Article

Evaluation of the Potential Release Risk of Internal N and P from Sediments—A Preliminary Study in Two Freshwater Reservoirs in South China

1
College of Fisheries and Life Sciences, Dalian Ocean University, Dalian 116023, China
2
Key Laboratory of Algal Biology, Institute of Hydrobiology, Chinese Academy of Sciences, Wuhan 430072, China
3
University of Chinese Academy of Sciences, Beijing 100049, China
*
Authors to whom correspondence should be addressed.
Water 2022, 14(4), 664; https://doi.org/10.3390/w14040664
Submission received: 24 December 2021 / Revised: 11 February 2022 / Accepted: 18 February 2022 / Published: 21 February 2022

Abstract

:
Growing evidence has demonstrated the influence of internal nitrogen (N) and phosphorus (P) on harmful algae blooms in eutrophic freshwater ecosystems. However, the main controlling factors for internal N and P release risks, and whether these factors vary as environmental conditions change, remains poorly understood. We evaluated potential release risks of N and P from sediments in two freshwater reservoirs in Beihai City, southern China, by evaluating apparent nutrient fluxes during simulated static incubation experiments at two temperatures (15 °C and 25 °C). Sediments were analyzed to determine their basic properties as well as N and P fractions. Results showed that the main controlling factors of the apparent fluxes in dissolved total P, soluble reactive P, total N, and ammonium were related to sediment adsorption properties, redox properties, and microbial-mediated properties (e.g., water-extractable P, total inorganic N, redox-sensitive P, total organic carbon, organic P). The primary controlling factors for apparent N and P fluxes were dependent on the form of N and P and changed with temperature. The results suggest that care should be taken when simply using total N and P contents in sediments to evaluate their internal nutrient release risks.

Graphical Abstract

1. Introduction

Human activities have delivered excess nutrients to aquatic ecosystems, which has caused widespread eutrophication of freshwater lakes and reservoirs [1,2,3]. Freshwater eutrophication can cause harmful algae blooms and dead zones, threatening public health by disturbing drinking water supplies, food security, and recreational uses [4,5]. Nitrogen (N) and phosphorus (P) are identified as key nutrients in freshwater eutrophication, and are the main elements that promote harmful algae blooms when present in excessive concentrations [6,7,8].
An excessive amount of N and P in freshwater bodies can be caused by external inputs and internal releases from sediments [9,10]. Numerous management efforts have been made to reduce the loading of external nutrients into freshwater bodies [8,11]. Such reductions in external nutrient loading are reported to be rapidly effective in controlling freshwater eutrophication in certain lakes, but not in many others, due to internal sediment loading [12,13,14,15]. Due to this internal loading, eutrophication can persist for 5–15 years after external nutrient inputs have been reduced [16,17].
Previous studies of freshwater eutrophication have considered P as the prime limiting nutrient, as evidenced in long-term case studies and multi-year whole lake assessments [7,18,19]. Consequently, more research has focused on limiting P loading than N loading, which is assumed to be offset by N2 fixation by cyanobacteria [19,20]. However, increasing evidence indicates that N limitation or co-limitation with P in freshwater bodies influences harmful algae blooms more frequently than P limitation [21,22,23]. The role of N and P limitations in controlling eutrophication varies dynamically among seasons and years [21,24]. P limitation of harmful algae blooms is commonly observed in spring, which shifts to N limitation in summer and autumn when temperature and other meteorological conditions favor the growth of harmful algae [13,25,26]. Recent studies suggest that variation in N and P limitations in freshwater bodies can be influenced by the internal loading of N and P [24,27,28]. Internal P loading has a major influence on seasonal N limitation of harmful algae blooms in Taihu Lake, China [24], while nitrate and ammonium concentrations in overlying water can also influence the release of P from sediments by controlling the sediment oxidation status or alkaline phosphatase activity [29,30]. Thus, investigating the internal nutrient loading of freshwater ecosystems requires investigating N and P loading simultaneously to better evaluate their influence on eutrophication [27,28].
In freshwater ecosystems, the internal release of N and P from sediments is determined primarily by their forms and contents in sediments [31,32,33]. Exchangeable P (NH4Cl-P), redox-sensitive Fe-bound P (BD-P), and Fe/Al-oxide-bound P (NaOH-P) are considered mobile forms of P in sediments [32]. They can be mobilized and released from sediments into the overlying water during changes in biogeochemical conditions in sediments [31,34]. N, which is present in sediments mainly in organic forms, can be a source of ammonium N (NH4-N) during degradation of organic matter and be released into the overlying water [35], sometimes even exceeding the external input of N [36]. Moreover, release of N and P from sediment can also be influenced by environmental factors, such as sediment redox conditions, dissolved oxygen, organic matter, pH, hydrodynamics, and bacterial activities [37,38,39]. However, few existing studies have investigated internal loading of N and P simultaneously, as well as their relationship with sediment properties and nutrient forms [24,28]. The main controlling factors in sediments for internal N and P loading, and whether their influence on N and P loading vary as environmental conditions change, remain poorly understood.
In the present study, we investigated potential release risks of N and P from sediments in two freshwater reservoirs in Beihai City, southern China. Simulated static incubation experiments at two temperatures were conducted, and sediment properties and N and P forms in sediment were analyzed, with the main objectives of exploring the controlling factors in sediments for potential release risks of internal N and P, as well as assessing potential variations in these factors and their influences on N and P release risks at different temperatures.

2. Materials and Methods

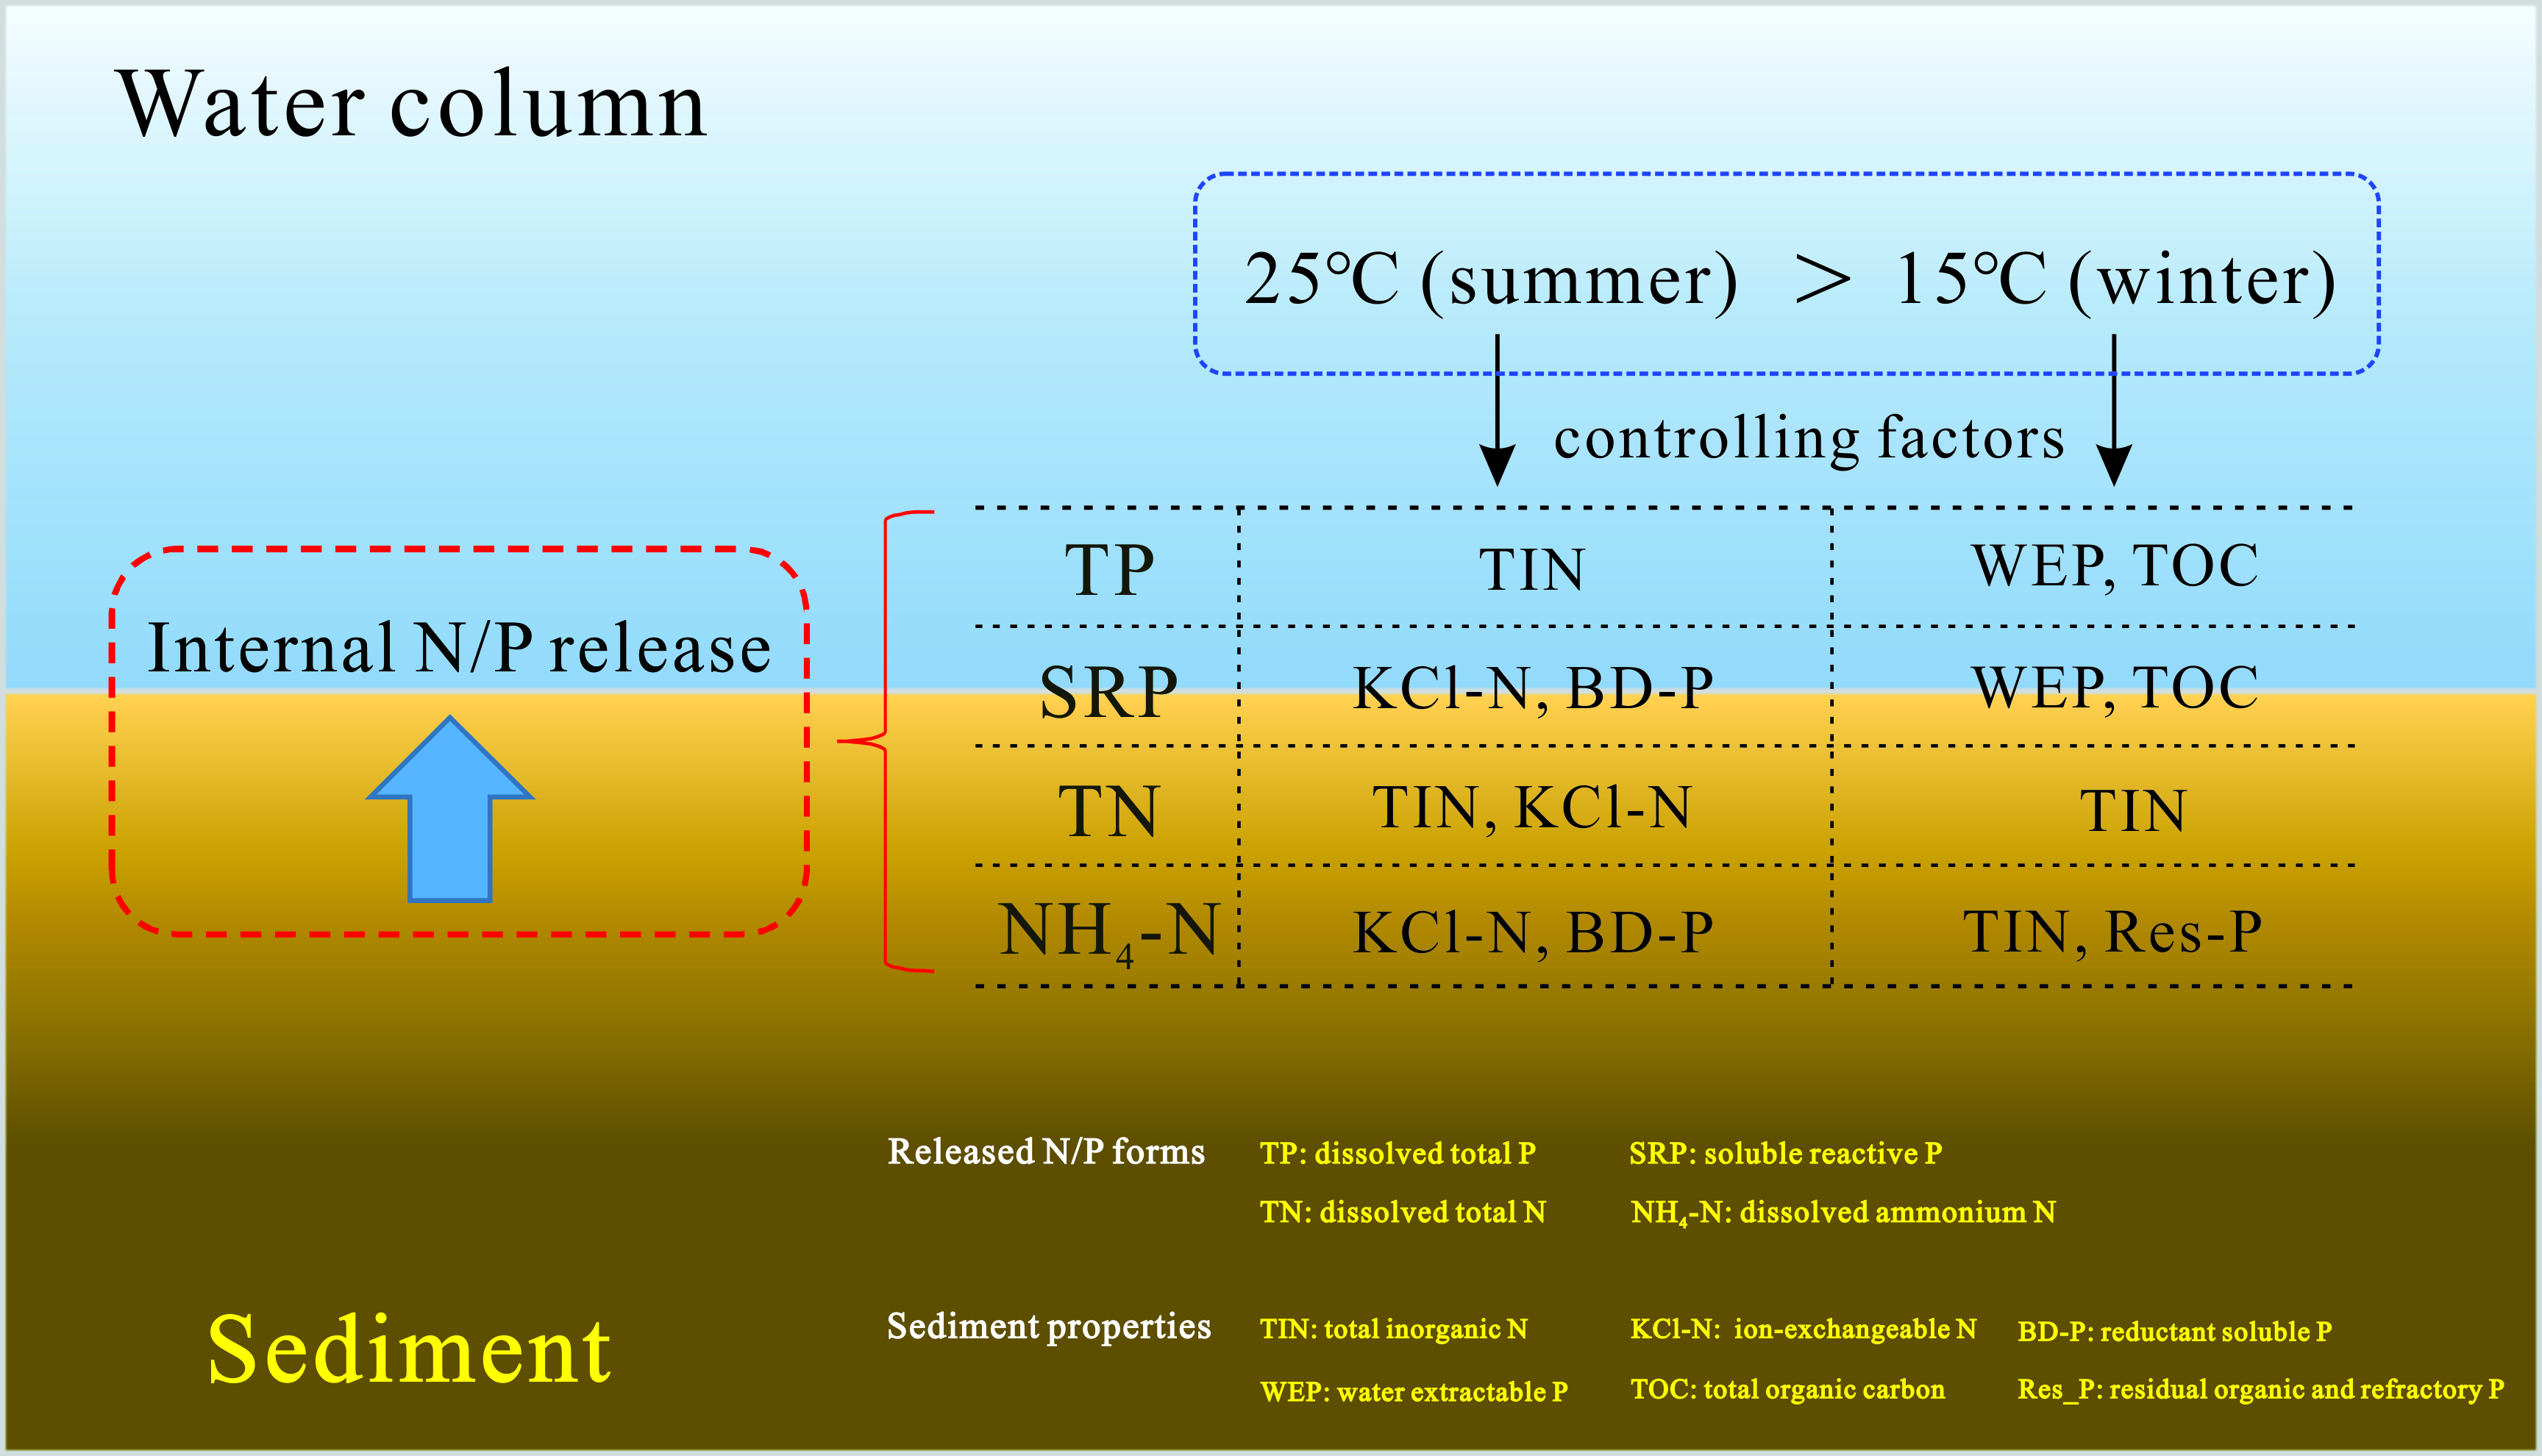
2.1. Sediment Sampling and Preparation

The sediments studied came from two freshwater reservoirs, Niuweiling (NWL) and Hongchaojiang (HCJ), near Beihai City in Guangxi Province, southern China (Figure 1). This region has a subtropical, maritime monsoon climate with mean monthly temperature ranging from 14.6 °C in January to 28.9 °C in July and mean annual precipitation of 1670 mm, of which ~85% falls between April and October (1976–2010). The soil type in this region is latosolic red soil. The NWL and HCJ reservoirs were both multifunctional water-control projects based on natural valleys. These two reservoirs have a primary function of irrigation and other functions such as flood control, water supply, and power generation. The NWL reservoir was built in 1964 and began to serve as the primary drinking water source for Beihai City in 2011. The NWL reservoir has a catchment area of 24.3 km2, a water surface area of 4.6 km2, total water storage of 25.5 million m3, and a mean depth of 6.7 m. The HCJ reservoir was also built in 1964 and was prepared as the secondary drinking water source for Beihai City after the reinforcement of hydrographic infrastructure in 2012. The HCJ reservoir has a catchment area of 402.0 km2, a water surface area of 66.7 km2, total water storage of 714.0 million m3, and mean depth of 22.0 m. The catchment area of the NWL reservoir is flatter and has a higher intensity of farming practice and higher population compared to the catchment area of HCJ reservoir, which is mostly mountainous. In recent years, the water quality of HCJ and NWL reservoirs has declined due to excessive anthropogenic and natural nutrient inputs, especially in the NWL reservoir, which has experienced occasional blooms of harmful algae.
In August 2020, sediment cores were taken using a gravity corer (8.0 cm inner diameter, 50.0 cm long) at two sites in each reservoir (H1 and H2 at HCJ, N1 and N2 at NWL (Figure 1). Three sediment cores were taken at each site and were sliced at 5 cm intervals. Sediments in the same layers of the three cores were placed into plastic self-sealing bags and uniformly mixed by manual press. Each mixture was maintained at 4 °C until analysis. Sediment cores were 0–25 cm at H1 and N1, but were 0–20 cm at H2 and N2 because of the hard substrate below 20 cm at these two sites. The total number of sediments studied was 18. Since the sampling sites were located in the main reservoir area (N1, H1) and the main inlet area (N2, H2) of each reservoir, only a few sampling sites were needed to represent the general sediment properties in each reservoir.

2.2. Sediment Analysis

Sediment total P (TPS) was digested in an acid mixture (HNO3, HClO4, and H2SO4 at a 3:1:1 ratio) and determined colorimetrically using the molybdenum blue method, with a precision of ±13 μg L−1 [40]. Organic P (OP) in sediments was determined as the difference in P concentrations extracted by 4.0 M H2SO4 from sediments before and after combustion at 550 °C [41]. Water extractable P (WEP) in sediments was extracted using deionized water at a sediment–water ratio of 1:25 and analyzed using the molybdenum blue method. Sediment total N (TNS) was digested in H2SO4 and determined colorimetrically using the indophenol blue method, with a precision of ±0.1 mg L−1 [42]. Total organic carbon (TOC) in sediments was analyzed via dry combustion with an automatic N and carbon analyzer–mass spectrometer. Total iron (TFe) in sediments was extracted with 3.0 M HCl and determined using colorimetric analysis [43], with a precision of ±5%. Sediment pH and redox potential (Eh) were determined using glass and platinum electrodes, respectively, as the working electrode and a calomel electrode as the reference. All sediment analyses were conducted in triplicate and fresh sediments were used at all times.

2.3. Sediment N and P Fractionation

A slightly modified sequential extraction scheme by Hupfer et al. (1995) [44] was used for P fractionation of sediments. Fresh sediments were subjected to sequential chemical extraction with 1 M NH4Cl (0.5 h), 0.11 M NaHCO3/Na2S2O4 (1 h), 1 M NaOH (16 h), 0.5 M HCl (16 h), and 1 M NaOH (2 h at 85 °C). The extracts were centrifuged and supernatants were filtered through 0.45 μm filters that were pre-rinsed with deionized water. The soluble reactive P (SRP) in the filtrates was then analyzed using the molybdenum blue method. Accordingly, the P fractions in sediments were separated into loosely sorbed P (NH4Cl-P), reductant soluble P (BD-P), Fe/Al-oxide-bound P (NaOH-P), calcium-bound P (HCl-P), and residual organic and refractory P (Res-P) [44].
The inorganic N in sediments were fractionated using a brief two-step sequential extraction scheme developed by Huo et al. (2014) [45]. Fresh sediments were subjected to sequential chemical extraction with 2 M KCl (0.5 h) and 0.1 M H2SO4 (0.5 h at 95 °C). The extracts were centrifuged and supernatants were filtered through pre-rinsed 0.45 μm filters. The NH4-N in the filtrates was then analyzed using the indophenol blue colorimetric method [42]. Accordingly, the inorganic N in sediments was separated into ion-exchangeable N (KCl-N) and acid-extractable N (H2SO4-N). The sum of these two fractions was defined as the total inorganic N (TIN) content in sediments. Organic N (Org-N) was determined as sediment TNS minus TIN.

2.4. Sediment Incubation and Evaluation of N and P Potential Release Risks

Potential release risks of N and P from sediments were evaluated via static incubation experiments by simulating the apparent flux of N and P during a given period of static incubation [46]. Temperatures in deep water in freshwater reservoirs in these regions ranged from 15 °C in winter to 25 °C in summer [47]. Thus, the static incubation experiments were conducted at 15 °C and 25 °C to simulate winter and summer temperatures, respectively, of the deep water in the reservoirs studied. To evaluate potential release risks of N and P from different sediment layers, synthesized overlying water was prepared for sediments from each depth. The detailed procedures were as follows:
Step 1: For each sediment, 10.0 g (dry weight) of fresh sediment was placed in a 1 L conical flask along with 500 mL deionized water, shaken to homogeneous, and placed in the dark to settle for 48 h. The objective of this step was to synthesize the overlying water for the sediment from each depth.
Step 2: For each sediment, 3.0 g (dry weight) of fresh sediment was placed in three replicate glass tubes (2.6 cm inner diameter, 30 cm height), and then 150 mL of synthesized overlying water of the corresponding sediment was slowly added to the tube. After being dispersed for 2 min ultrasonically, the tubes were capped with parafilm (on which holes were poked with a needle after capping) and placed in the dark for incubation at the selected temperatures.
Step 3: At 24 h (Day 1) and 20 days (Day 20), 15 mL of supernatant in each tube was sampled at 10 cm above the sediment surface and filtered through pre-rinsed 0.45 μm filters for analysis. After the sampling at 24 h, tubes were refilled with the synthesized overlying water to maintain the volume of overlying water in the tubes during incubation. The influence of the re-filled synthesized overlying water at 24 h on N and P concentrations in the remaining supernatant was considered negligible.
SRP, TP, and NH4-N concentrations in the filtrates were determined colorimetrically using the methods described above, while TN was analyzed by ultraviolet spectrophotometry after digestion of the filtrates in alkaline potassium persulfate [48]. The incubation duration of 20 days was selected based on results of a preliminary incubation experiment in which the release of TP and TN equilibrated after 16 days of incubation (Figure S1).
Apparent fluxes of SRP, TP, NH4-N, and TN over 20 days of incubation (Q) were quantified by the amount exchanged between the overlying water and sediment:
Q = ∆C × V/A
where ∆C is the difference in concentration between 24 h and 20 days of incubation, V is the volume of overlying water in the incubation tube, and A is the inner cross-sectional area of the incubation tube. Units of the nutrient fluxes were μmol m−2 for SRP and TP and mmol m−2 for NH4-N and TN.

2.5. Statistical Analysis

Differences in sediment physicochemical properties and N and P fractions among sampling sites were assessed using one-way analysis of variance and Tukey’s post-hoc test. The relationship between sediment properties and apparent fluxes of SRP, TP, NH4-N, and TN was assessed using pairwise Pearson correlation analyses. Stepwise multiple linear regression (MLR) and redundancy analysis (RDA) were conducted to identify the primary controlling factors in sediment properties for the apparent fluxes of SRP, TP, NH4-N, and TN. The order of parameters used in MLR was based on the absolute value of the Pearson correlation coefficient between sediment properties and apparent N and P fluxes. We used the Akaike information criterion (AIC) to select the variables in the final MLR model; the model with the lowest AIC was considered the best model. When performing RDA, data were re-scaled to 0–1 before analysis, and parameters with a variance inflation factor greater than 10 were excluded; thus, multicollinearity was negligible [49]. The significance of all analyses was set at p < 0.05. All statistical analyses were performed with R version 3.6.1 [50].

3. Results

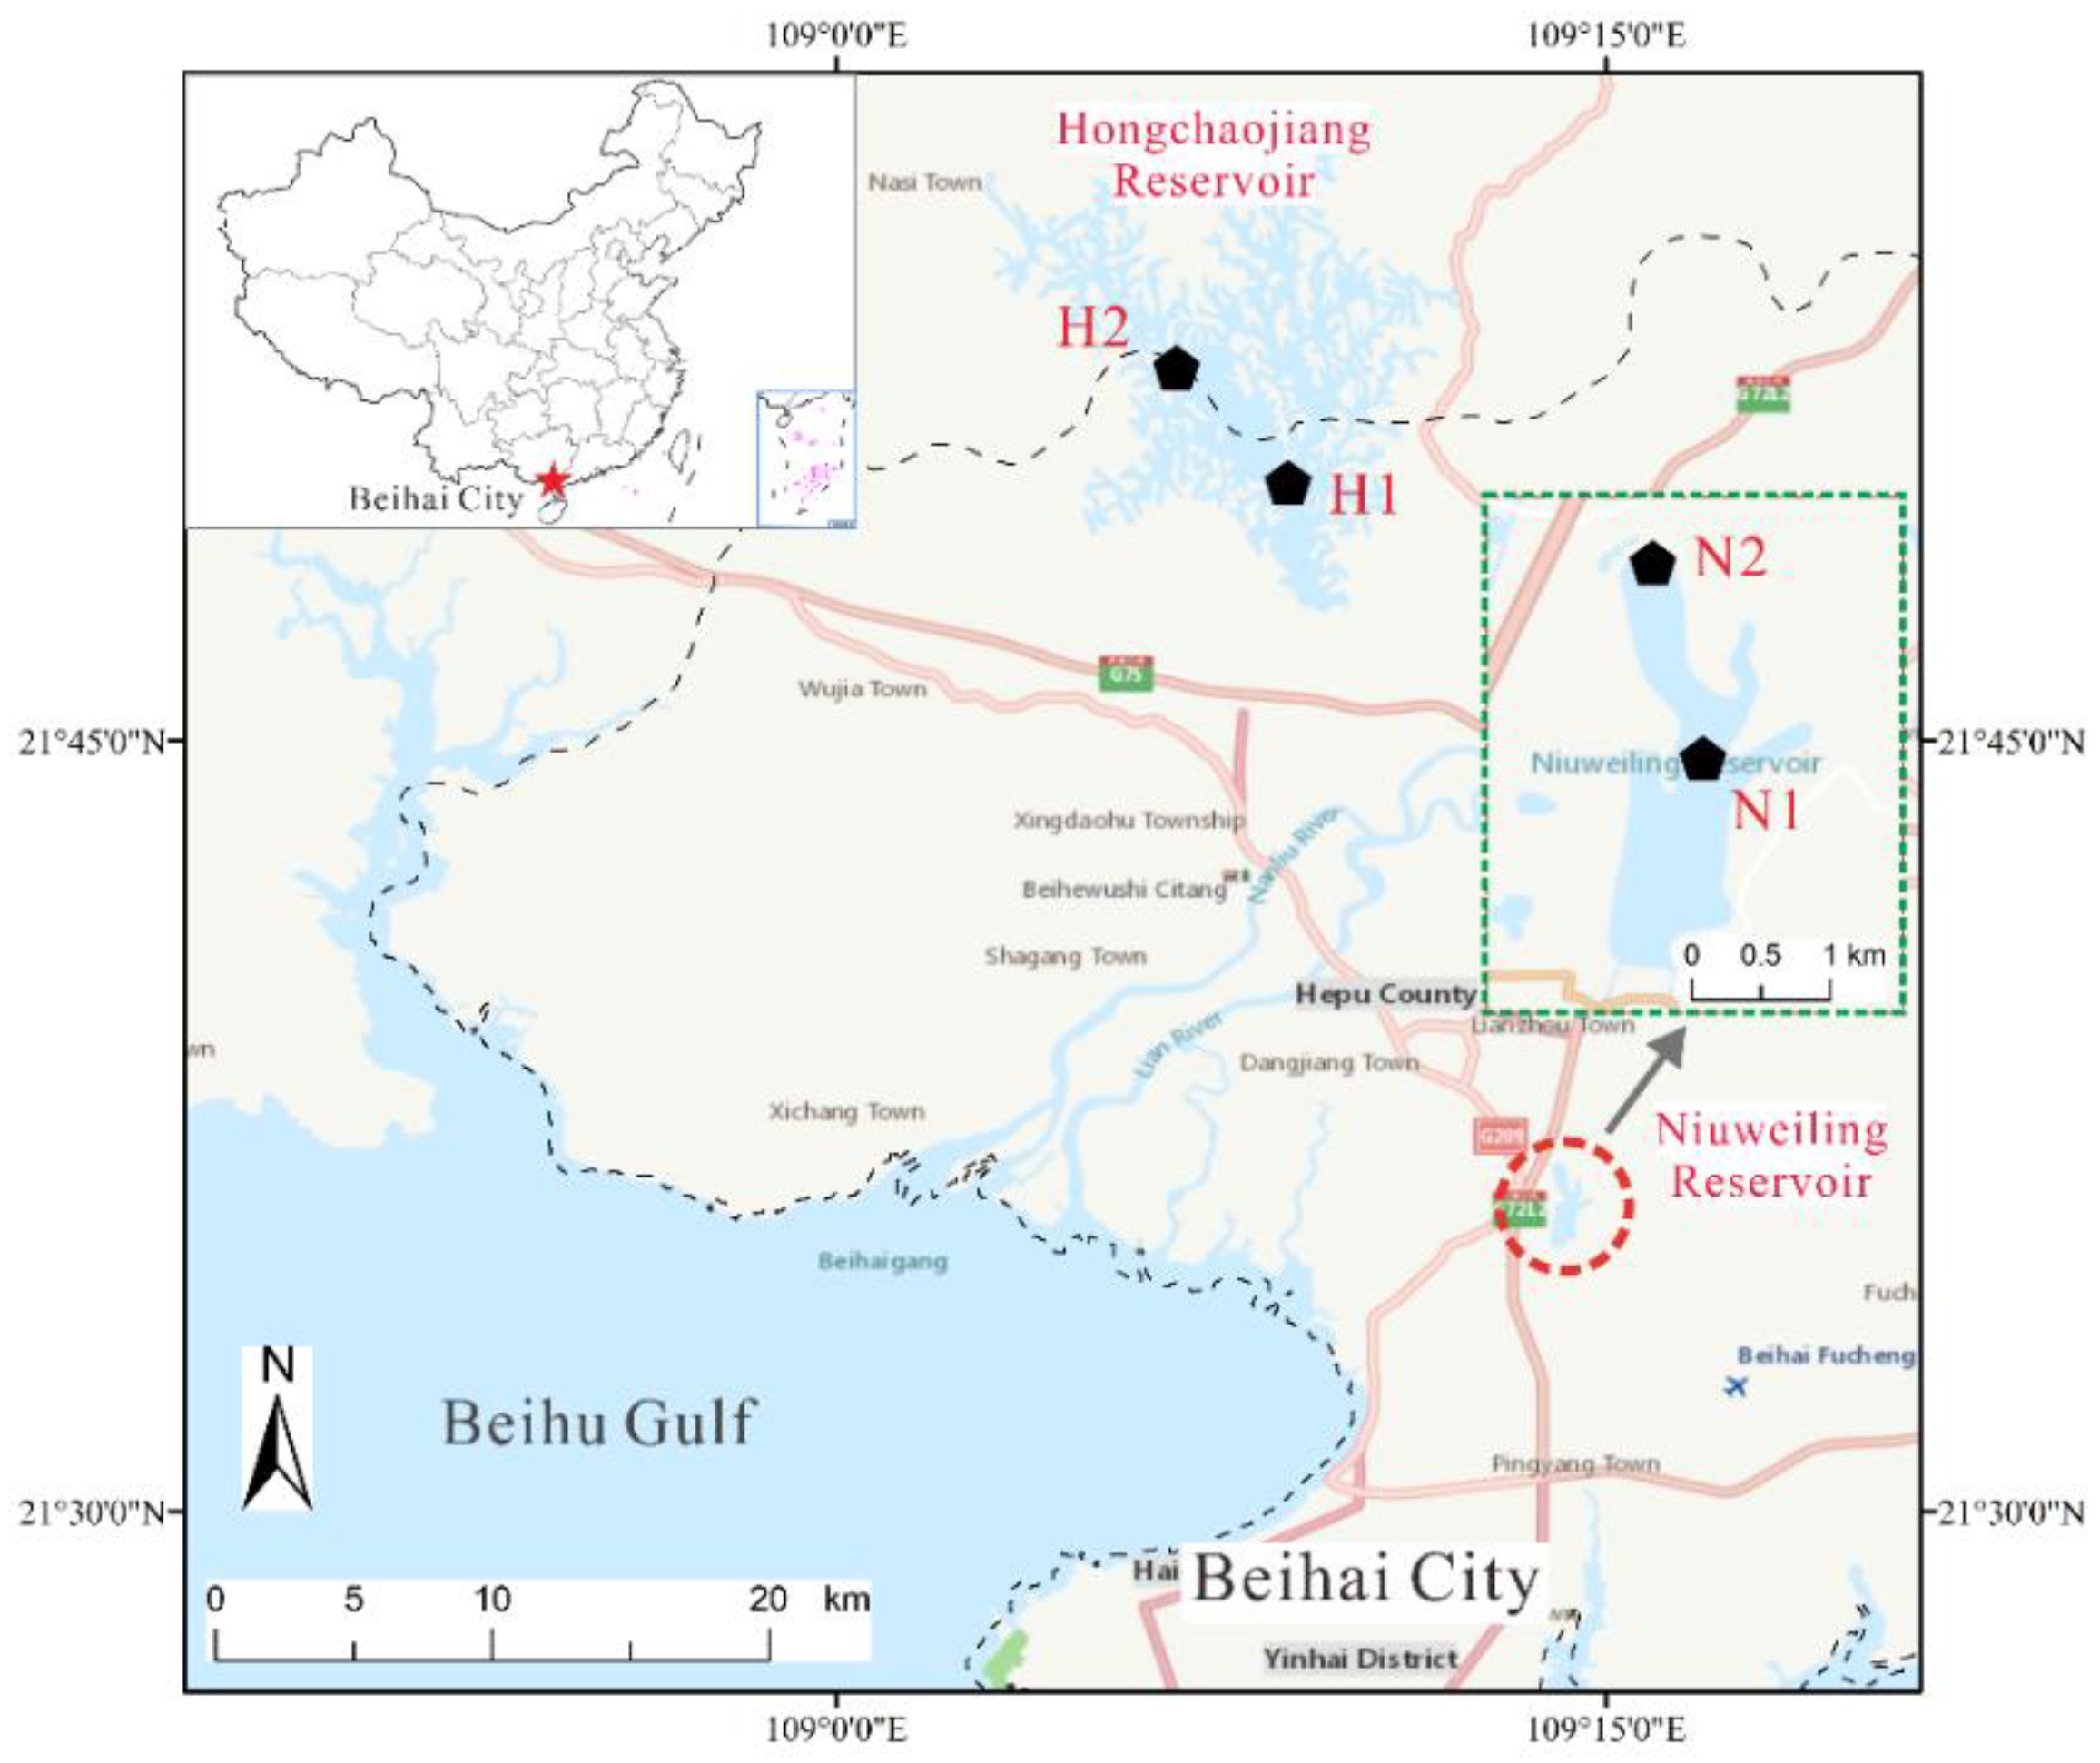
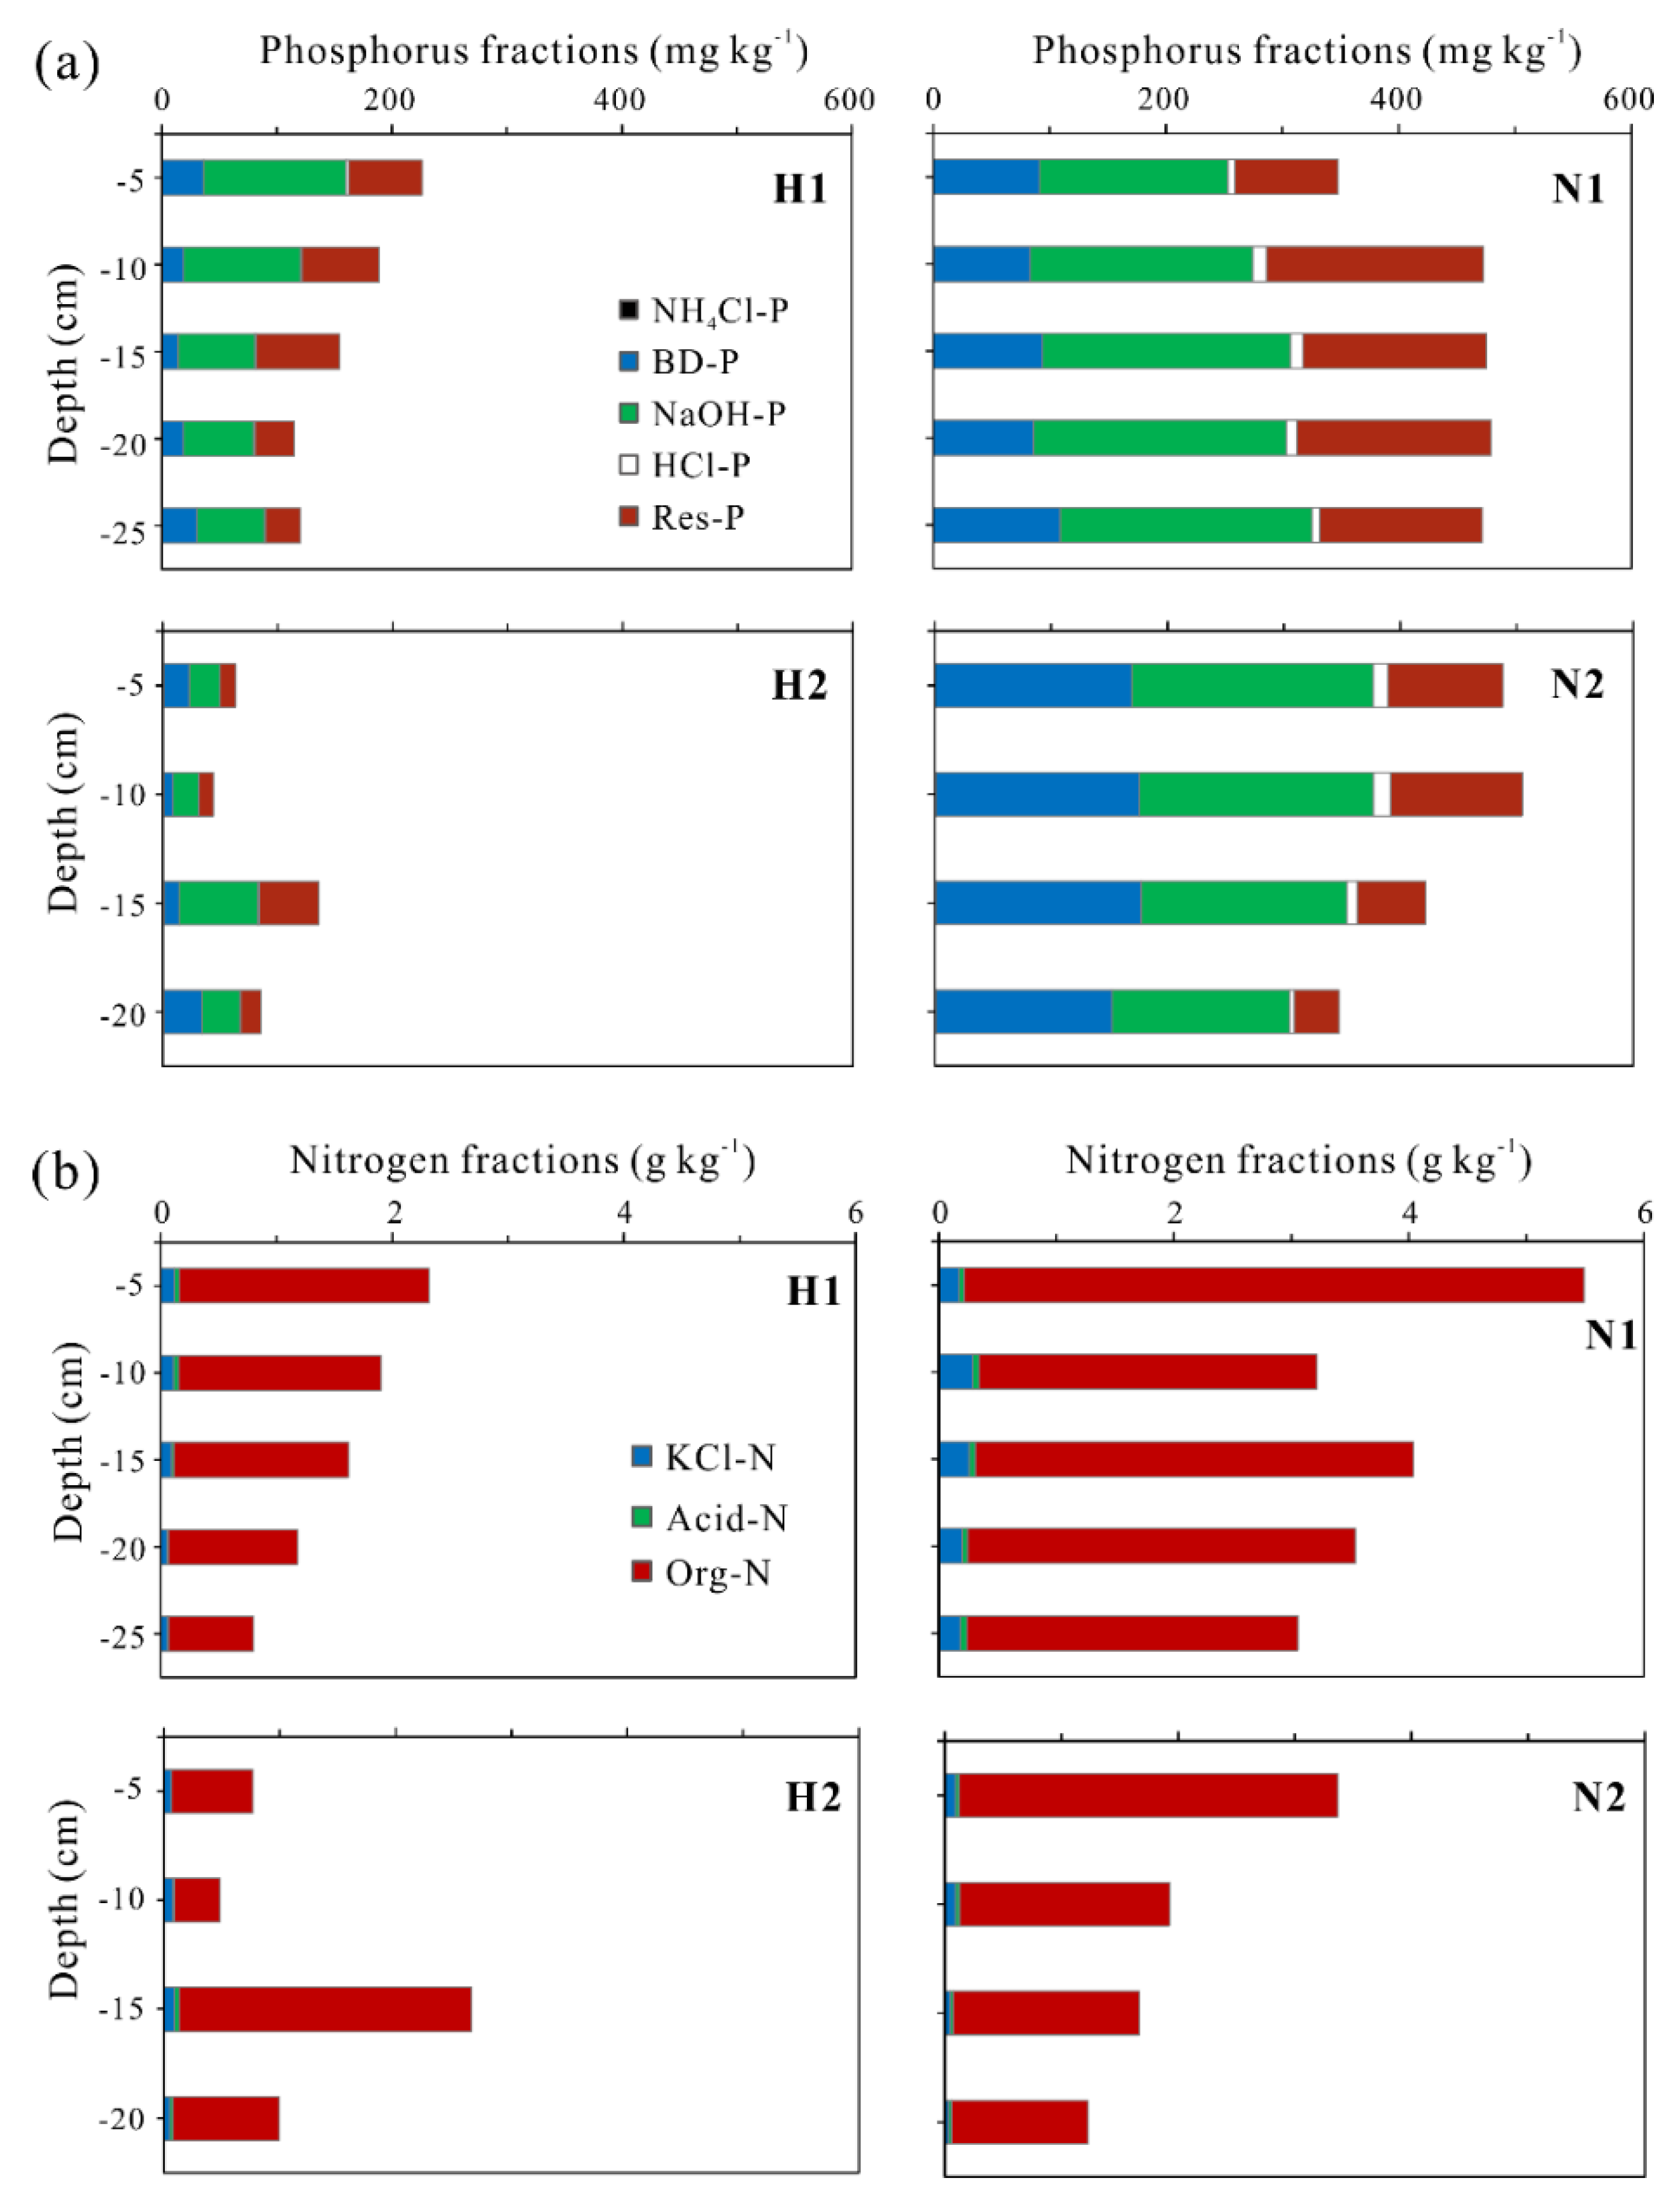
3.1. Sediment Properties and N and P Fractions

Sediments were slight acidic, with pH at H1 and H2 generally lower than those at N1 and N2 (Table 1, Figure S2). Sediments were strongly reduced, and those at N1 and N2 had significantly lower Eh than those at H1 and H2. Sediments at N1 and N2 generally had higher TOC, TNS, TPS, OP, and WEP than those at H1 and H2, suggesting a substantial difference in sediment properties between HCJ and NWL. TFe contents showed no obvious difference between HCJ and NWL (Table 1). Sediment TPS, TNS, and TFe contents generally decreased as sediment depth increased, except for TPS at H2 and N1 and TNS at H2. Sediment TOC, WEP, and OP contents and Eh and pH values showed no obvious trend as a function of sediment depth (Figure S2).
The N and P fractions in sediments were similar in percentage among depths and between the two reservoirs (Table 2, Figure 2). Among P fractions, NaOH-P was the largest fraction in all sediments, representing between 42–51% of the total extracted P. BD-P and Res-P were secondary fractions, representing between 15–38% and 18–39% of the total extracted P, respectively. NH4Cl-P and HCl-P together represented <5% of the total extracted P (Table 2). Differently, BD-P represented a higher percentage of total extracted P in sediments from N1 and N2 than those from H1 and H2, which was consistent with their difference in Eh (Figure S2). Among N fractions, Org-N was the largest fraction in all sediments, representing between 92–95% of the total extracted N. Within inorganic N fractions, KCl-N represented a higher percentage than H2SO4-N: 3–6% and 1–2% of the total extracted N, respectively (Figure 2b).

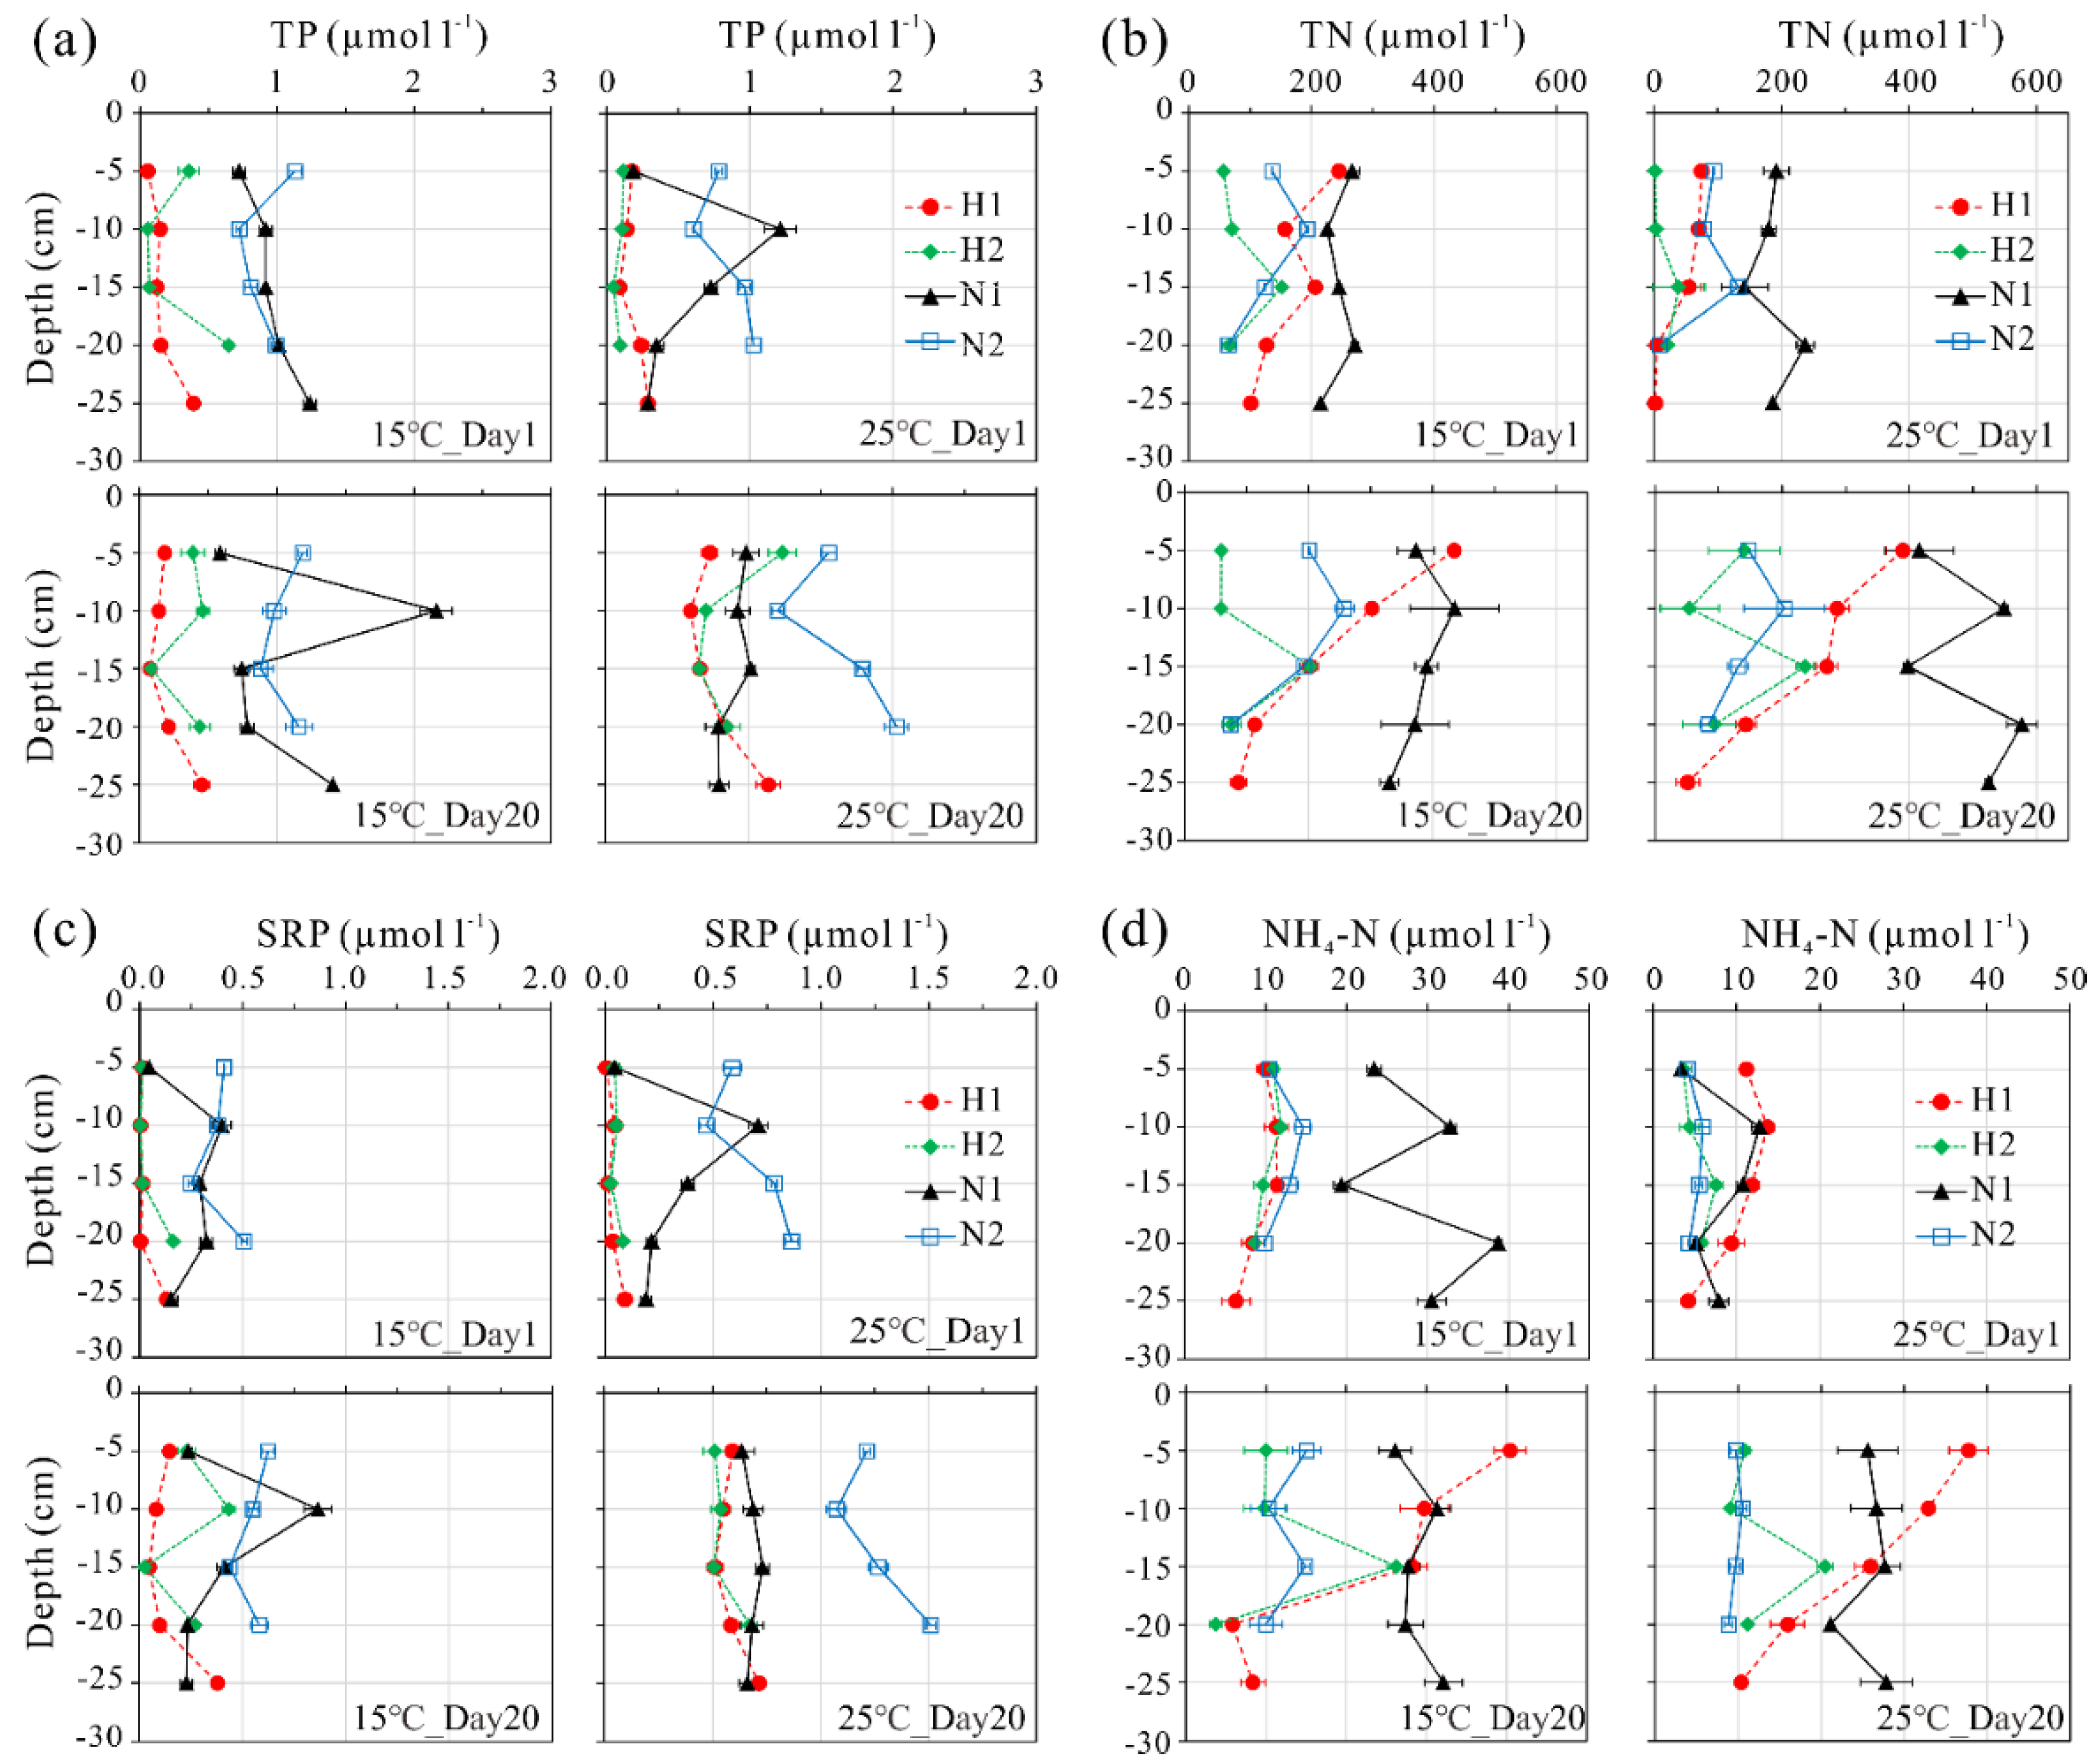
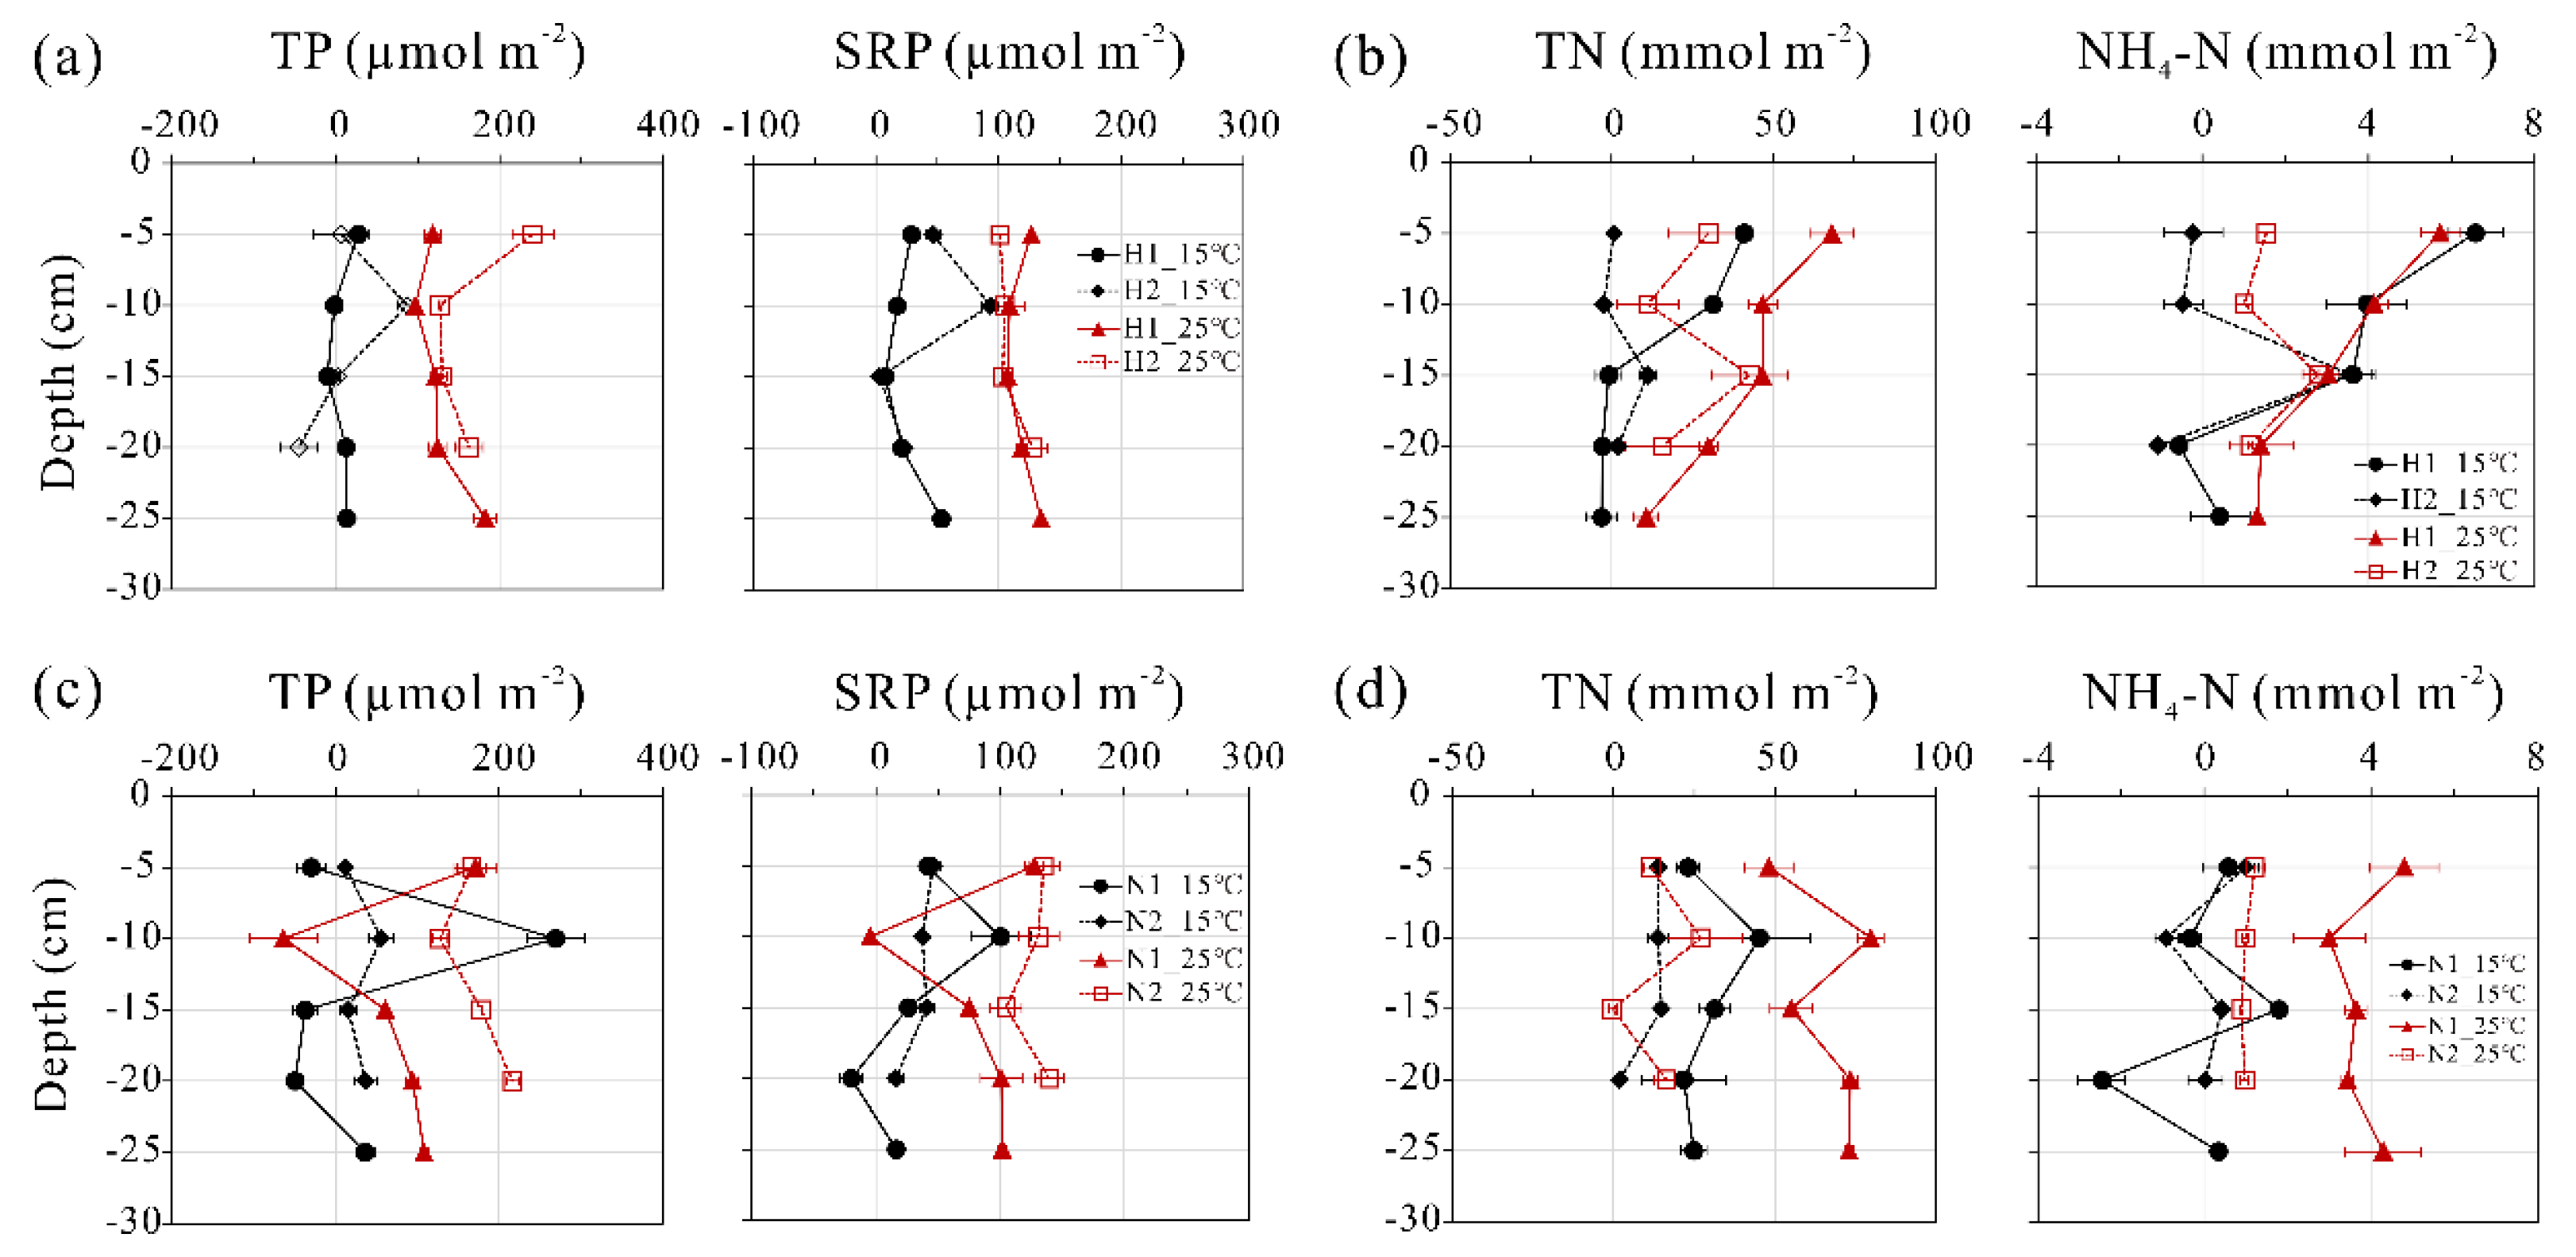
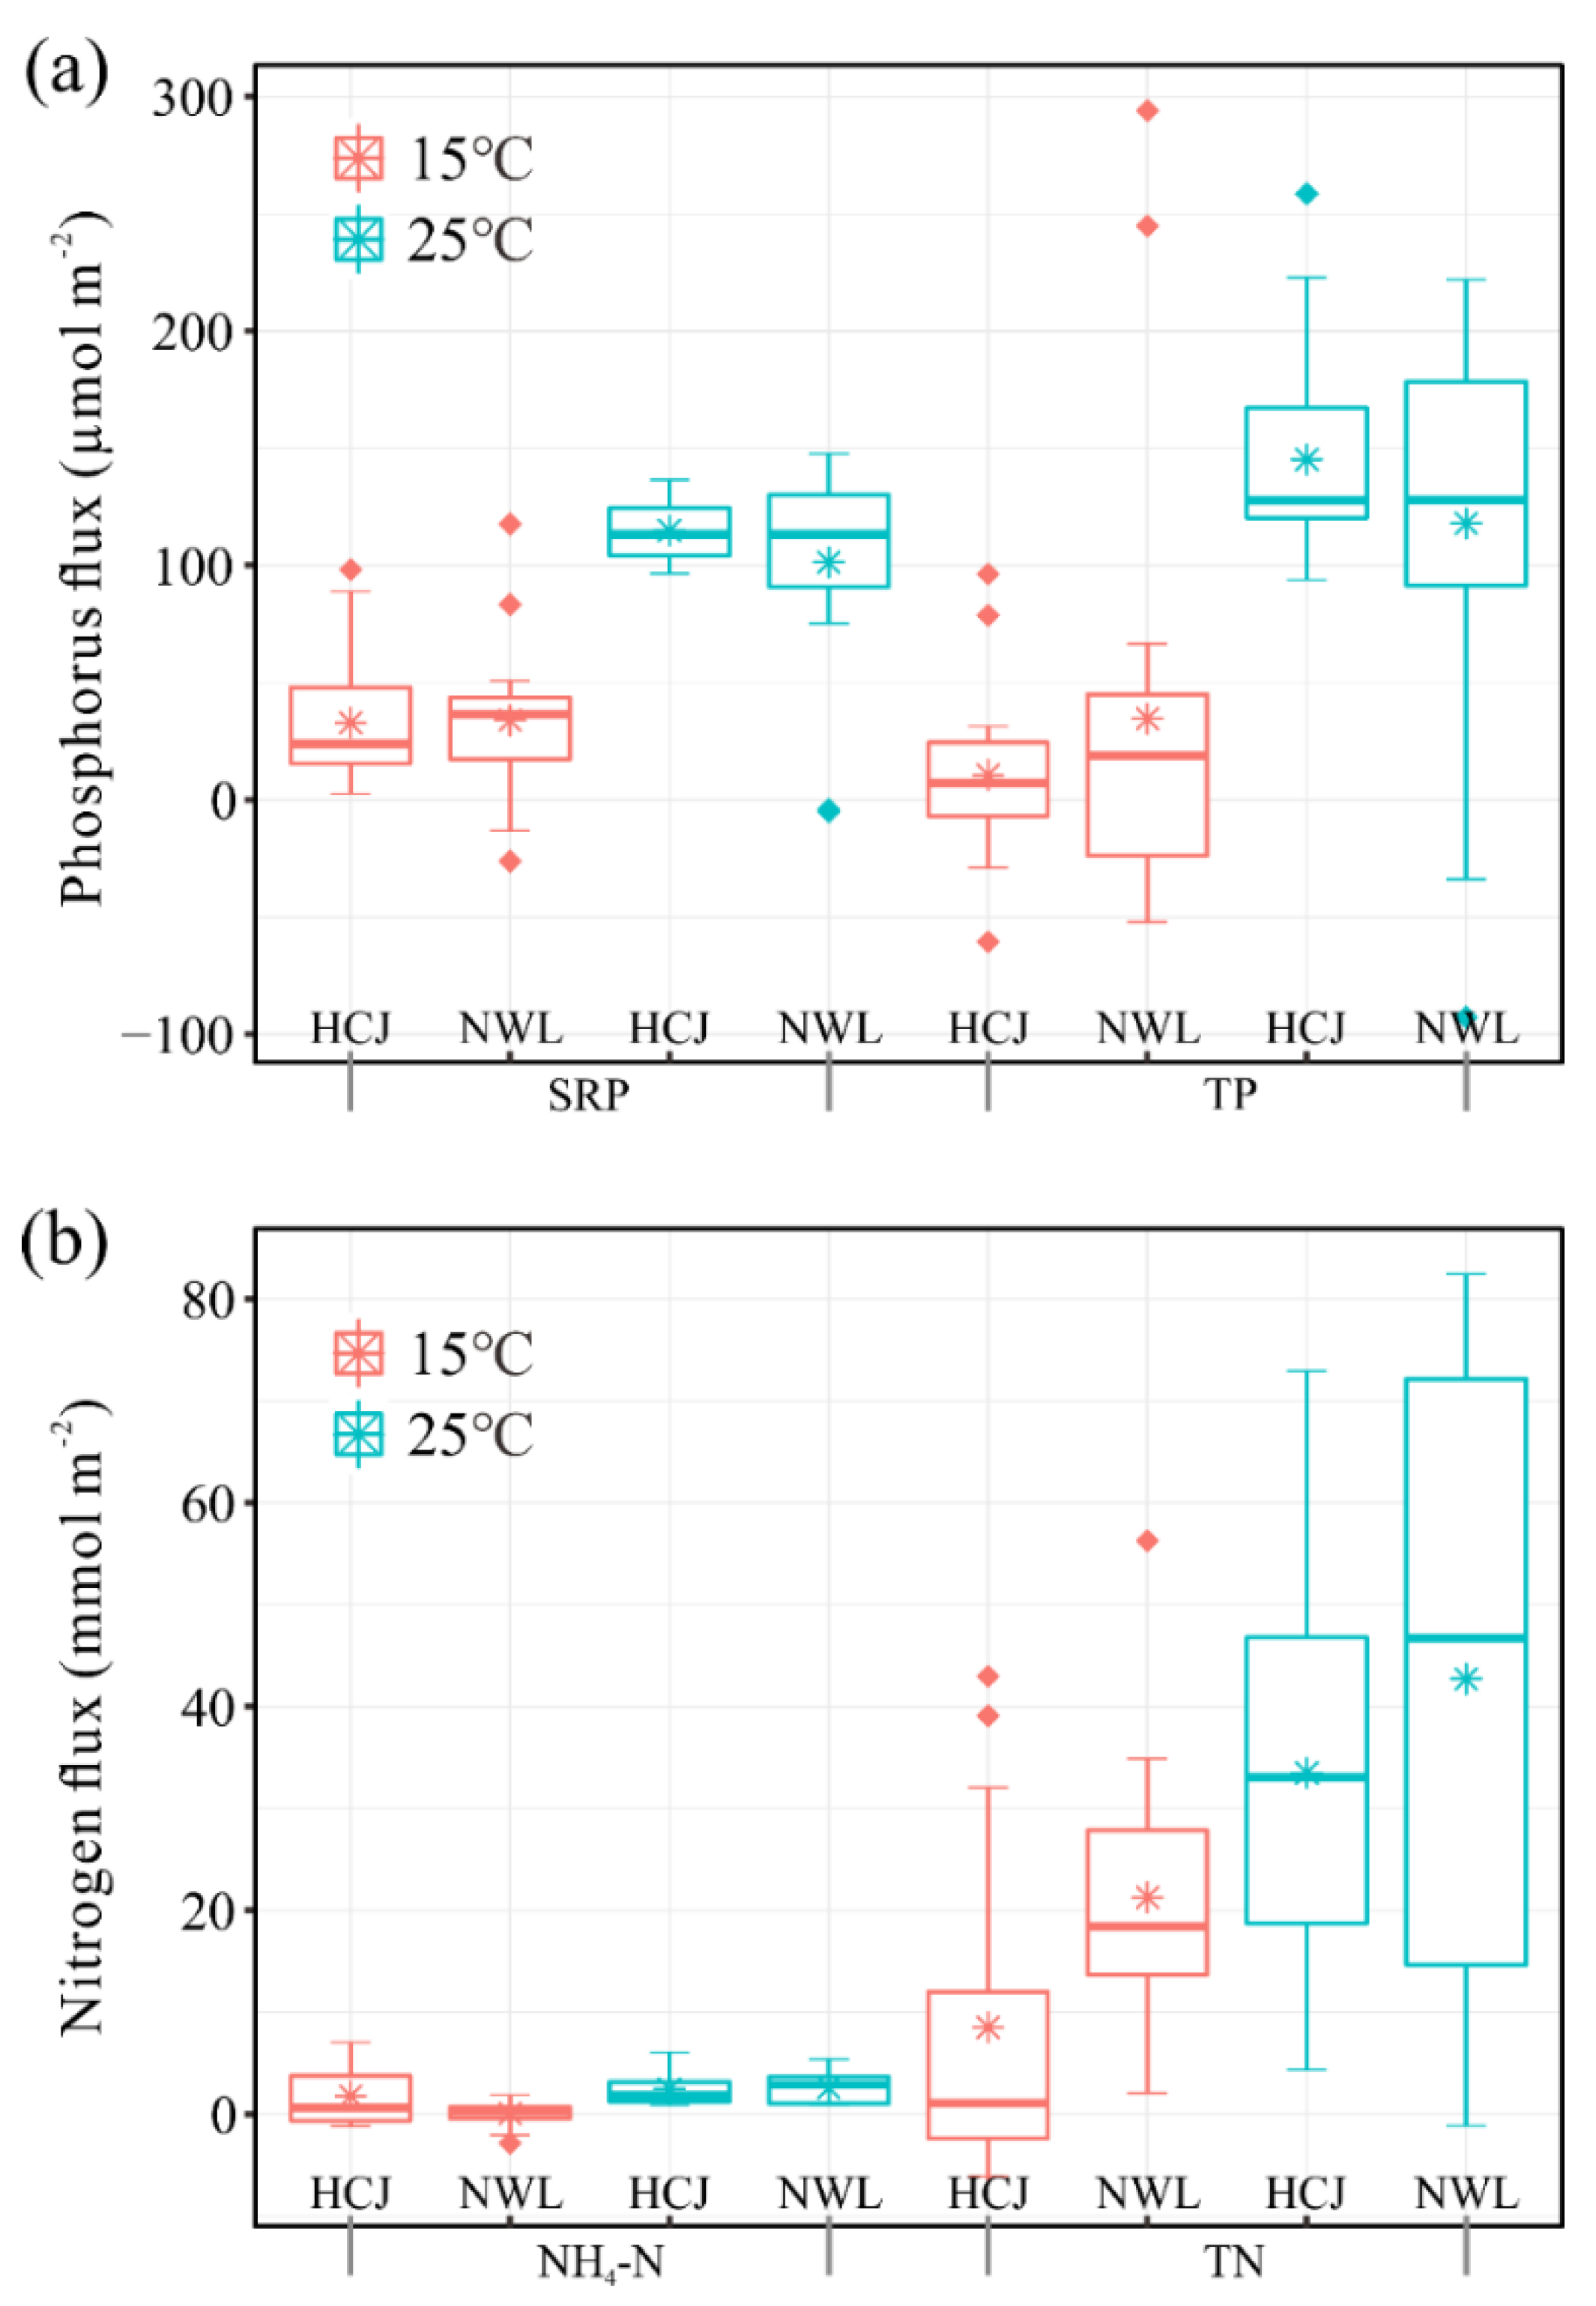
3.2. N and P Concentrations and Apparent Fluxes at 15 °C and 25 °C

Concentrations of TP and SRP were higher in the supernatants of sediments N1 and N2 than in those of H1 and H2 at both Day 1 and Day 20 at 15 °C and 25 °C (Figure 3a,c). Conversely, concentrations of TN and NH4-N in the supernatants showed no obvious difference between sediments from HCJ and NWL, except for sediments from N1, which had higher TN and NH4-N concentrations than those from the other three sites (Figure 3b,d). There was no obvious trend in TP, SRP, TN, or NH4-N concentrations as a function of sediment depth, except for sediments from H1, for which the TN and NH4-N concentrations decreased as sediment depth increased (Figure 3). From Day 1 to Day 20, concentrations of TP, SRP, TN, and NH4-N generally increased at both 15 °C and 25 °C for most sediments, except for TP on Day 1 at 15 °C (Figure 3 and Figure S3). Increases in concentrations from Day 1 to Day 20 were greater at 25 °C than at 15 °C, with the ratios of mean concentrations ranging from 2.5 to 3.1 at 25 °C compared with 1.2 to 1.9 at 15 °C for all parameters (Figure S3).
Apparent fluxes of TP, SRP, TN, and NH4-N were higher at 25 °C than at 15 °C for most sediments (Figure 4 and Figure 5). Mean apparent fluxes of TP and SRP of all sediments from two sites in HCJ and NWL were 22.5 and 33.4 μmol m−2 at 15 °C, respectively, compared to 131.5 and 108.1 μmol m−2 at 25 °C, respectively. Mean apparent fluxes of TN and NH4-N of all sediments from two sites in HCJ and NWL were 14.9 and 0.9 mmol m−2 at 15 °C, respectively, compared to 38.1 and 2.5 mmol m−2 at 25 °C, respectively (Figure 5). There was no obvious trend in apparent fluxes of TP, SRP, TN, or NH4-N as a function of sediment depth, except for those of TN and NH4-N at H1 at both 15 °C and 25 °C (Figure 4b). There were no obvious differences in apparent fluxes of TP, SRP, TN, or NH4-N between sediments from HCJ and NWL, except for those of TN, which were higher at NWL than HCJ (Figure 5b).

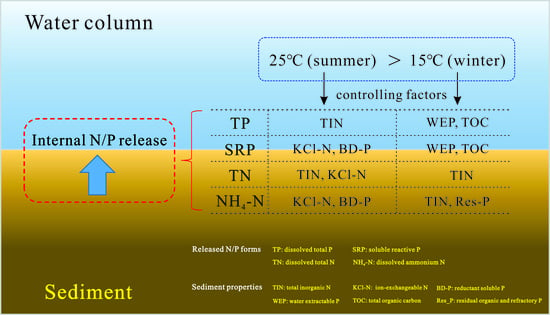
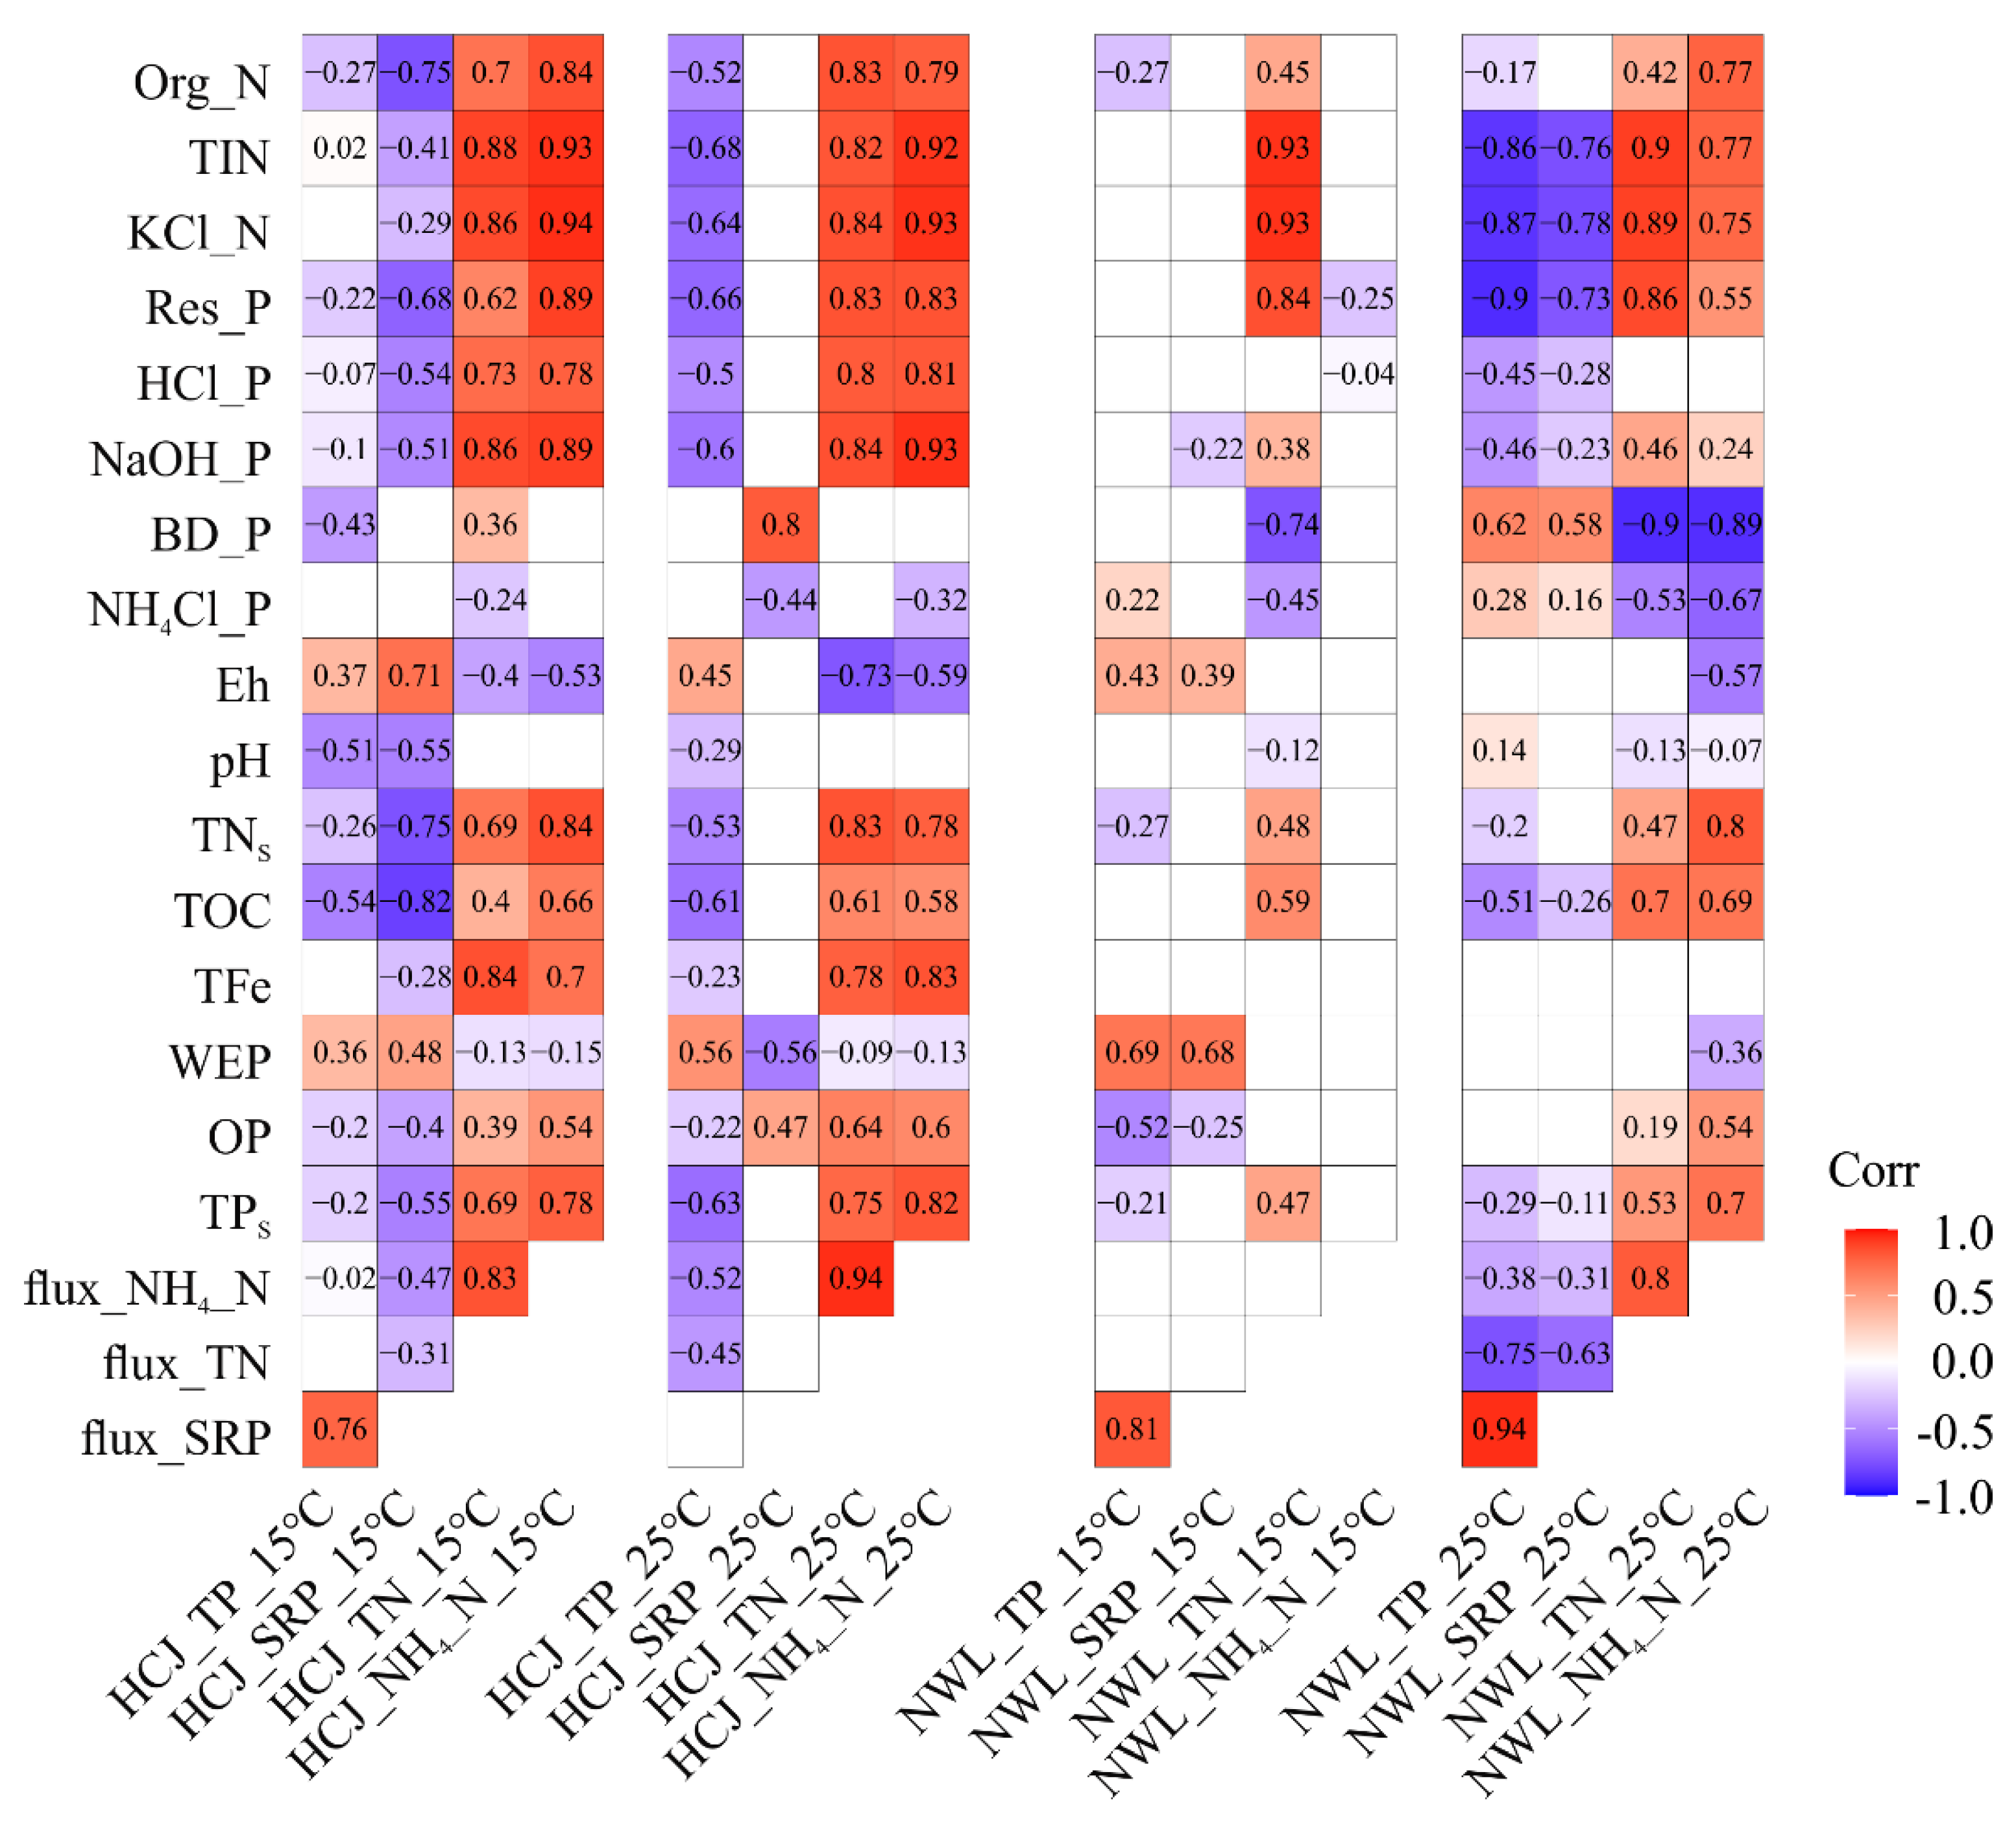
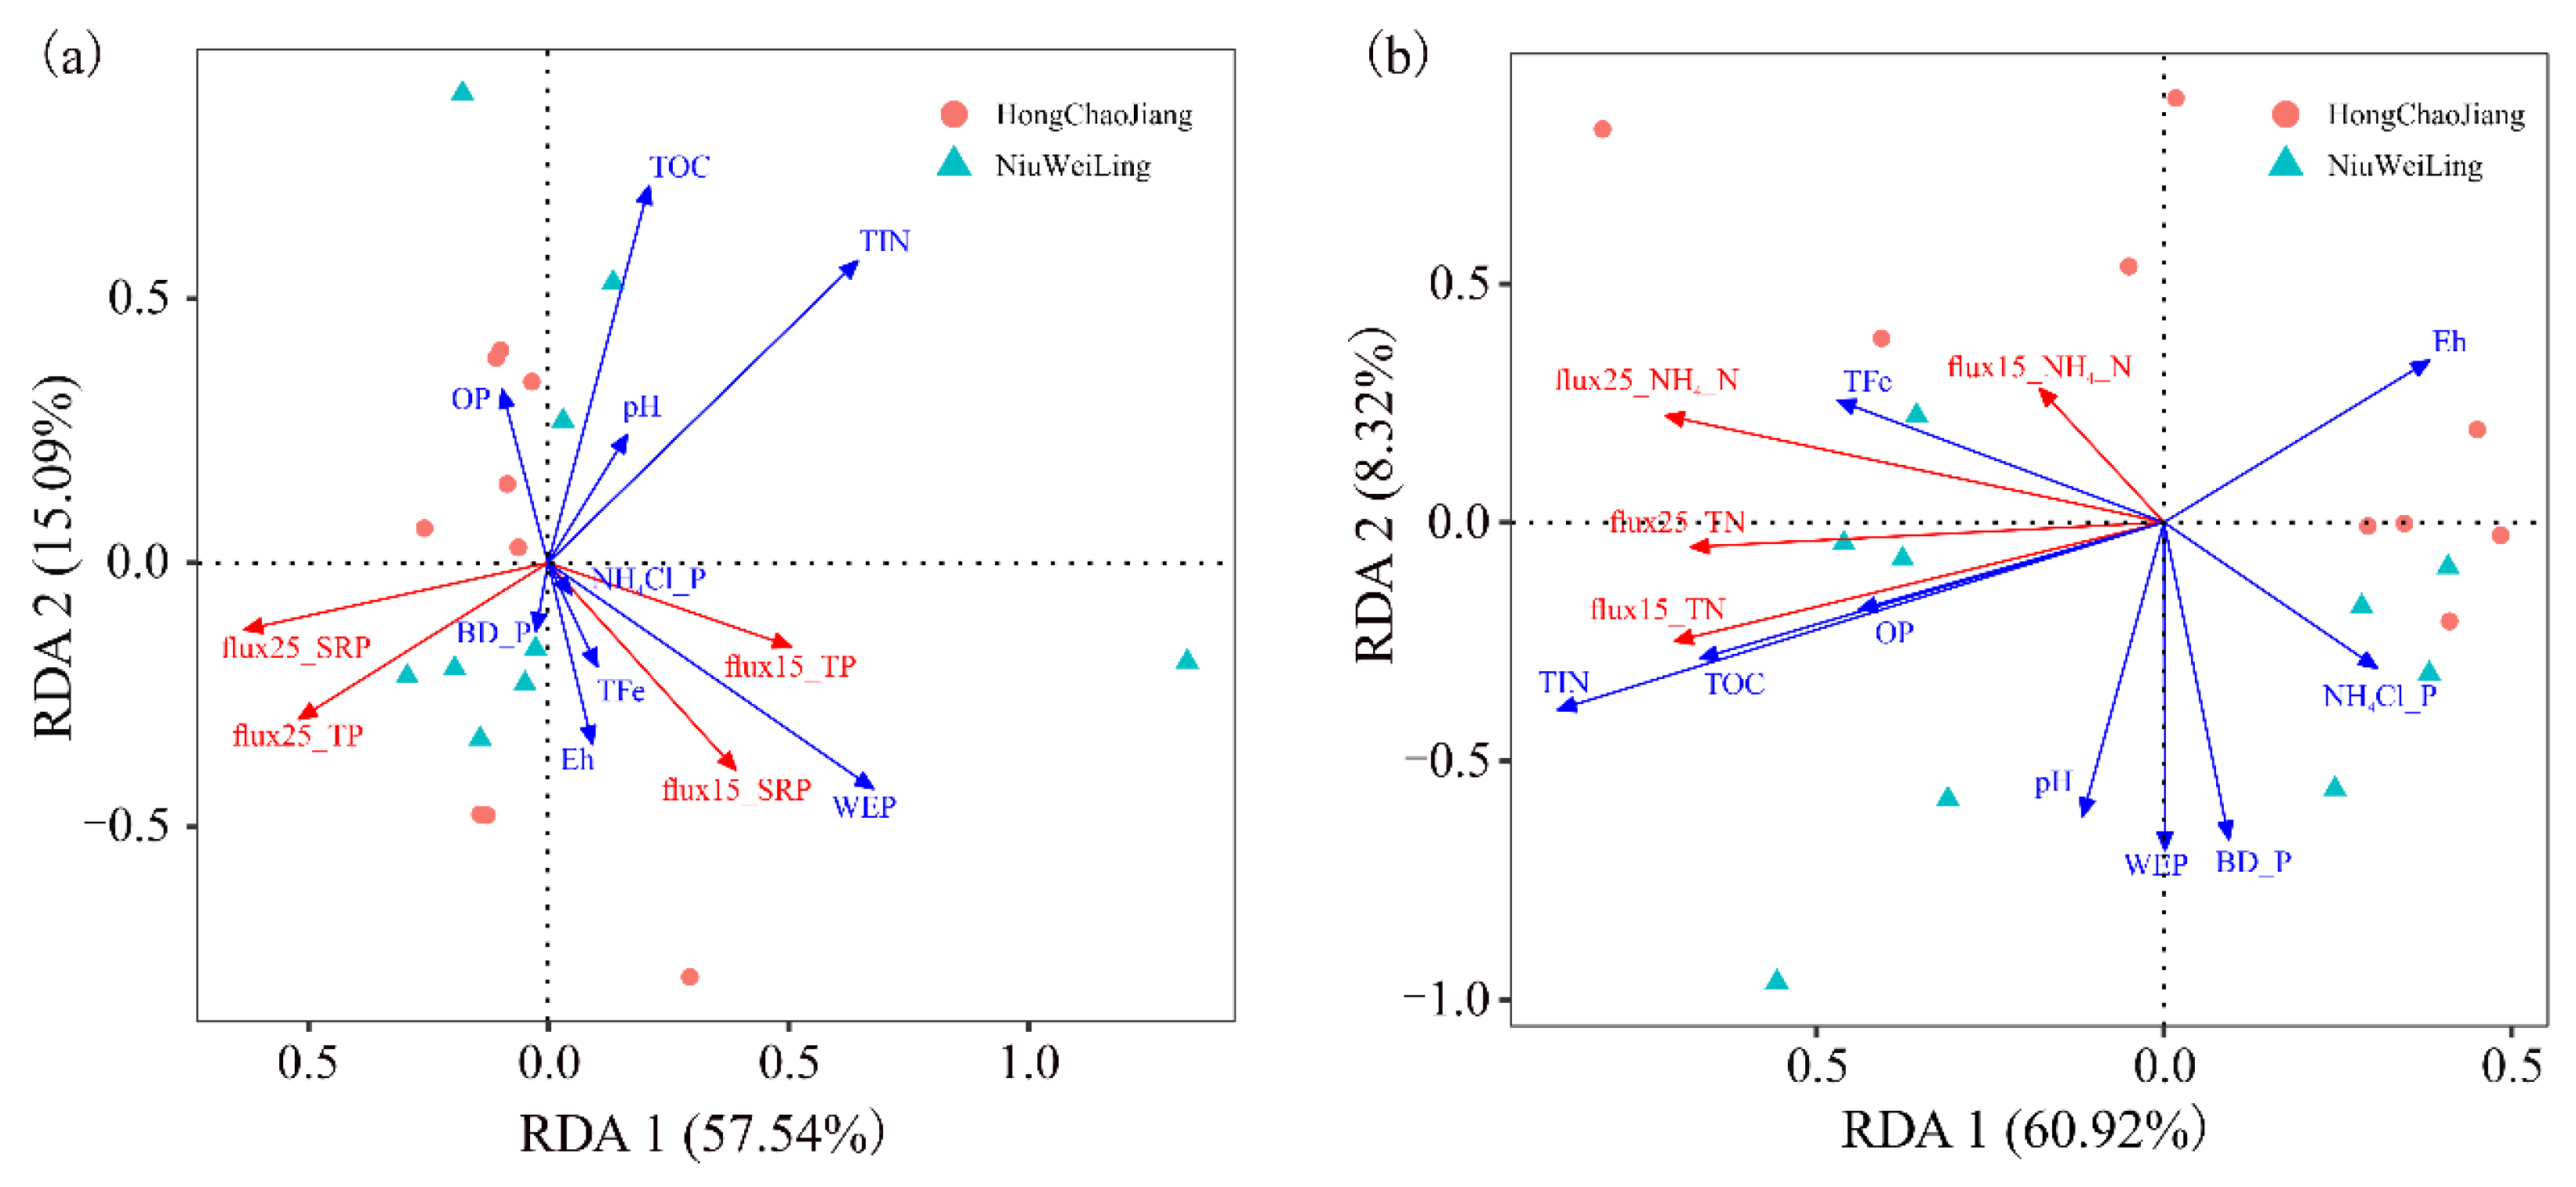
3.3. Controlling Factors of Apparent N and P Fluxes

The pairwise Pearson correlation analysis showed that, for HCJ sediments, apparent fluxes of TP and SRP at 15 °C and those of TP at 25 °C were correlated positively with WEP and Eh, but negatively with most of the other parameters (Figure 6). Apparent fluxes of SRP from HCJ sediments at 25 °C were correlated positively with BD-P and OP and negatively with WEP and NH4Cl-P, but were not correlated with most of the other parameters. Apparent fluxes of TN and NH4-N from HCJ sediments at 15 °C and 25 °C were correlated positively with most parameters, except for a negative correlation with Eh and WEP (Figure 6). For NWL sediments, apparent fluxes of TP and SRP at 15 °C were correlated positively with WEP and Eh and negatively with OP, but not correlated to most of the other parameters. Apparent fluxes of TP and SRP at 25 °C were correlated positively with BD-P and NH4Cl-P, but negatively with most of the other parameters. Apparent fluxes of TN at 15 °C and of TN and NH4-N at 25 °C were correlated negatively with BD-P and NH4Cl-P, but positively with most of the other parameters. Apparent fluxes of NH4-N from NWL sediments at 15 °C were not correlated with most of the other parameters (Figure 6).
Stepwise MLR results indicated that sediment properties explained 19–94% of the variance in apparent fluxes of N and P from HCJ sediments and 39–84% from NWL sediments (except for apparent fluxes of NH4-N at 15 °C) (Table 3). For HCJ sediments, the best explanatory factors for apparent fluxes of TP and SRP were TOC at 15 °C and, respectively, TIN and BD-P at 25 °C. The best explanatory factors for apparent fluxes of TN and NH4-N were TIN at 15 °C and KCl-N at 25 °C. For NWL sediments, the best explanatory factors for apparent fluxes of TP and SRP were WEP at 15 °C, and, respectively, TIN and KCl-N at 25 °C. Apparent fluxes of TN were best explained by TIN at 15 °C and 25 °C, but those of NH4-N were best explained by Res-P and BD-P at 15 °C and 25 °C, respectively (Table 3).
The RDA between apparent P fluxes and sediment properties showed that the first and second axes had eigenvalues of 0.12 and 0.03, respectively, and explained 57.5% and 15.1% of the variance in apparent P fluxes, respectively (Figure 7a). For apparent N fluxes, the first and second axes had eigenvalues of 0.22 and 0.03, respectively, and explained 60.9% and 8.3% of the variance in apparent N fluxes, respectively (Figure 7b). The main sediment properties related to the apparent fluxes of N and P were sediment OP, WEP, Fe, TOC, NH4Cl-P, BD-P, and TIN contents, and sediment pH and Eh (Figure 7).

4. Discussion

The RDA results showed that the main factors that influence apparent fluxes of different forms of N and P were related mainly to sediment adsorption properties such as WEP, NH4Cl-P, TIN, and pH and to sediment redox and microbial-mediated properties such as sediment Fe, BD-P, Eh, TOC, and OP (Figure 7). The exchange of N and P with the overlying water involves biogeochemical processes, such as sorption–desorption, reduction–oxidation, and bio-mineralization [34,51]. WEP, NH4Cl-P, and TIN are the exchangeable and labile fractions of N and P in sediments and can be released into the overlying water via desorption, which is influenced strongly by pH [52]. BD-P is considered the redox-sensitive Fe-bound P fraction in sediments [32] and can be transformed and released into the overlying water via reductive dissolution of Fe-oxyhydroxides, which is influenced by the sediment Fe content and Eh status, especially when Eh lies below the critical value of 200 mV [34]. TOC, along with temperature, influences microbial activity in sediments [53] and thus influences the mineralization of sediment OP and Org-N fractions, as well as the apparent N and P fluxes from sediments.
An important finding of the present study is that the main controlling factors for apparent N and P fluxes were different for different forms of N and P and changed with temperature (Table 3). The potential release risks of TP and SRP at 15 °C are positively controlled by the exchangeable P content in sediments (i.e., WEP) and negatively controlled by the organic carbon content (i.e., TOC), which could also influence the P sorption of sediment particles [54], depending on the reservoir. In comparison, the potential release risks of TP and SRP at 25 °C are negatively controlled by the exchangeable N contents in sediments (i.e., TIN, KCl-N) and positively controlled by the redox-sensitive P fraction (i.e., BD-P) in sediments. These findings evidence that the controlling mechanisms for apparent P fluxes switch from a sorption–desorption process in the winter season to a reduction–oxidation process and the inorganic N release process in the summer season. For potential release risks of TN and NH4-N, the primary controlling factors involve mainly the exchangeable N and residual organic and refractory P contents (i.e., TIN, Res-P) at 15 °C but the exchangeable N and redox-sensitive P fraction (i.e., KCl-N, TIN, BD-P) at 25 °C (Table 3). These findings evidence that the controlling mechanisms for apparent N fluxes mainly involve the inorganic N release process in both winter and summer seasons.
Interestingly, the exchangeable N in sediments (i.e., TIN, KCl-N) has positive influences on the apparent N fluxes but negative influences on apparent P fluxes (Table 3), suggesting a potential reciprocal effect between the apparent N fluxes with apparent P fluxes. This is further confirmed by the negative correlations between the TN and NH4-N fluxes and the TP and SRP fluxes in both HCJ and NWL sediments (Figure 6). This finding is different from a previous study on the effect of NH4-N on internal P release, in which they found that high NH4-N loading in the overlying water could promote sediment P release by increasing alkaline phosphatase activity [29]. The possible explanation is that the NH4-N concentration in the overlying water of the present study (<0.6 mg L−1) is much lower than that in their study (3–21 mg L−1), and they also observed a limiting effect of NH4-N on sediment P release at lower NH4-N concentrations (3–5 mg L−1) [29].
The results of the present study also indicated that temperature had a significant influence on apparent fluxes of N and P from the reservoir sediments, as mean apparent fluxes of TP, SRP, TN, and NH4-N in the simulated static incubations were significantly larger at 25 °C than at 15 °C (Figure 4 and Figure 5). This indicates higher internal N and P release risks during warm seasons than cold seasons, which is consistent with previous studies of freshwater eutrophic lakes that observed significant increases in internal fluxes of SRP and NH4-N from sediments from winter months to summer and autumn months [24,28]. One possible explanation is that lower temperatures decrease microbial activity, and meanwhile, the higher dissolved oxygen concentration in the overlying water promotes the formation of Fe-oxyhydroxides at the sediment surface, which increases the adsorption capacity of sediments [34], leading to lower nutrient fluxes or even net retention of nutrients by sediments. Conversely, higher temperatures increase microbial activity, which increases degradation of organic matter in sediments and reduces the redox potential of sediments, thus increasing nutrient fluxes through mineralization of organic matter or reductive dissolution of Fe-oxyhydroxides [28,51].
Moreover, temperature appeared to have more influence on apparent fluxes of TP and SRP than those of TN and NH4-N. Apparent fluxes of TP and SRP at 25 °C were 5.8 and 3.2 times higher than those at 15 °C, respectively, while the corresponding differences were only 2.6 and 2.8 times higher for apparent fluxes of TN and NH4-N, respectively (Figure 5). This is consistent with a previous study of seasonal internal N and P loadings in Chaohu Lake (China), in which SRP fluxes increased significantly more from winter to summer than NH4-N fluxes did [28]. The possible reasons are the difference in the controlling mechanisms for apparent P and N fluxes at different seasons and also the difference in the chemical equilibria of N and P with temperature.
Results of the present study suggested that the potential internal risk of TN in sediments appeared to be higher in the NWL reservoir than the HCJ reservoir. However, there were no obvious differences in apparent fluxes of TP, SRP, or NH4-N between sediments from the two reservoirs, despite the significant difference in their N and P contents in sediments (Figure 5; Table 1). This emphasizes the inappropriateness of using only total N and P contents in sediments to evaluate their internal nutrient release risk, especially for P. The relatively higher N and P release risks from sediments at 25 °C than at 15 °C, as well as their differing controlling factors as a function of temperature, suggest that mitigation measures to reduce internal nutrient loading in the two reservoirs studied are better applied in winter and should be adapted to the nutrient targeted.

5. Conclusions

The present study investigated the controlling factors in sediments on the internal release risks of TP, SRP, TN, and NH4-N and their change under different temperatures with sediments from two freshwater reservoirs in southern China by evaluating their apparent fluxes during static incubation. The results demonstrate that the main factors that influence the apparent fluxes of TP, SRP, TN, and NH4-N are related primarily to sediment adsorption properties (WEP, NH4Cl-P, TIN, pH), sediment redox properties (Fe, BD-P, Eh), or microbial-mediated properties (TOC, OP). The primary controlling factors for apparent fluxes of N and P are different for different forms of N and P and depend on temperatures. The apparent fluxes of N seem to have a limiting effect on the apparent fluxes of P, which both increase significantly from 15 °C to 25 °C. Our results suggest that care should be taken when using exclusively total N and P contents in sediments to evaluate their internal nutrient release risks. These findings were based on a small sample of sites, and investigation at higher spatial resolution and with cross-comparison with other water bodies is required to better evaluate internal N and P release risks and their controlling factors under varying environmental conditions.

Supplementary Materials

The following are available online at https://www.mdpi.com/article/10.3390/w14040664/s1. Figure S1: Releases dynamics of dissolved total phosphorus (TP) and total nitrogen (TN) during static incubation of sediments at 25 °C; Figure S2: Physiochemical properties of sediment by depth at each sampling site (H1, H2, N1, and N2); Figure S3: Concentrations of dissolved total P (TP), soluble reactive P (SRP), total N (TN), and ammonium (NH4-N) in the overlying water from sediments incubated at 15 °C and 25 °C for 1 (Day 1) and 20 days (Day 20).

Author Contributions

Conceptualization, Q.L. and S.G.; methodology, P.C. and S.G.; software, S.G.; validation, Q.L. and S.G.; formal analysis, P.C.; investigation, P.C., Q.L. and S.G.; resources, Q.L. and X.Z.; data curation, X.B., Y.J. and S.G.; writing—original draft preparation, Q.L. and S.G.; writing—review and editing, Q.L. and S.G.; visualization, Q.L. and S.G.; supervision, Q.L. and S.G.; project administration, Q.L. and X.Z.; funding acquisition, Q.L. and X.Z. All authors have read and agreed to the published version of the manuscript.

Funding

This research was funded by the National Natural Science Foundation of China (grant number: 41877397 and 42177038).

Acknowledgments

We thank Minmeng Liu, Liandong Yang, Cheng Wang, and Yongpeng Wang for their assistance during sample collection. Michelle Corson and Michael Corson post-edited the English style and grammar.

Conflicts of Interest

The authors declare no conflict of interest. The funders had no role in the design of the study; in the collection, analyses, or interpretation of data; in the writing of the manuscript, or in the decision to publish the results.

References

  1. Conley, D.J.; Paerl, H.W.; Howarth, R.W.; Boesch, D.F.; Seitzinger, S.P.; Havens, K.E. Controlling eutrophication: Nitrogen and phosphorus. Science 2009, 323, 1014–1015. [Google Scholar] [CrossRef] [PubMed]
  2. Jenny, J.-P.; Normandeau, A.; Francus, P.; Taranu, Z.E.; Gregory-Eaves, I.; Lapointe, F. Urban point sources of nutrients were the leading cause for the historical spread of hypoxia across European lakes. Proc. Natl. Acad. Sci. USA 2016, 113, 12655–12660. [Google Scholar] [CrossRef] [PubMed] [Green Version]
  3. Le Moal, M.; Gascuel-Odoux, C.; Ménesguen, A.; Souchon, Y.; Étrillard, C.; Levain, A. Eutrophication: A new wine in an old bottle? Sci. Total. Environ. 2018, 651, 139. [Google Scholar] [CrossRef] [PubMed] [Green Version]
  4. Brooks, B.W.; Lazorchak, J.M.; Howard, M.D.A.; Johnson, M.-V.V.; Morton, S.L.; Perkins, D.A.K.; Steevens, J.A. Are harmful algal blooms becoming the greatest inland water quality threat to public health and aquatic ecosystems? Environ. Toxicol. Chem. 2016, 35, 6–13. [Google Scholar] [CrossRef]
  5. Ward, M.H.; Jones, R.; Brender, J.; de Kok, T.; Weyer, P.; Nolan, B.; Van Breda, S.G. Drinking water nitrate and human health: An updated review. Int. J. Environ. Res. Public Health 2018, 15, 1557. [Google Scholar] [CrossRef] [Green Version]
  6. Peñuelas, J.; Poulter, B.; Sardans, J.; Ciais, P.; van der Velde, M.; Bopp, L.; Janssens, I.A. Human-induced nitrogen–phosphorus imbalances alter natural and managed ecosystems across the globe. Nat. Commun. 2013, 2013. 4, 2934. [Google Scholar] [CrossRef] [Green Version]
  7. Schindler, D.W.; Carpenter, S.R.; Chapra, S.C.; Hecky, R.E.; Orihel, D.M. Reducing phosphorus to curb Lake eutrophication is a success. Environ. Sci. Technol. 2016, 50, 8923–8929. [Google Scholar] [CrossRef]
  8. Tong, Y.; Zhang, W.; Wang, X.; Couture, R.-M.; Larssen, T.; Zhao, Y.; Lin, Y. Decline in Chinese lake phosphorus concentration accompanied by shift in sources since 2006. Nat. Geosci. 2017, 10, 507–511. [Google Scholar] [CrossRef]
  9. Matisoff, G.; Kaltenberg, E.M.; Steely, R.L.; Hummel, S.K.; Seo, J.; Gibbons, K.J.; Chaffin, J.D. Internal loading of phosphorus in western Lake Erie. J. Great Lakes Res. 2016, 42, 775–788. [Google Scholar] [CrossRef]
  10. Schindler, D.W.; Hecky, R.E.; McCullough, G.K. The rapid eutrophication of Lake Winnipeg: Greening under global change. J. Great Lakes Res. 2012, 38, 6–13. [Google Scholar] [CrossRef]
  11. Schoumans, O.F.; Chardon, W.J.; Bechmann, M.E.; Gascuel-Odoux, C.; Hofman, G.; Kronvang, B. Overview of mitigation options to reduce phosphorus losses from rural areas and to improve surface water quality. Sci. Total Environ. 2014, 468–469, 1255–1266. [Google Scholar] [CrossRef] [PubMed]
  12. Carpenter, S.R. Eutrophication of aquatic ecosystems: Bistability and soil phosphorus. Proc. Natl. Acad. Sci. USA 2005, 102, 10002–10005. [Google Scholar] [CrossRef] [PubMed] [Green Version]
  13. Janssen, A.B.G.; de Jager, V.C.L.; Janse, J.H.; Kong, X.; Liu, S.; Ye, Q. Spatial identification of critical nutrient loads of large shallow lakes: Implications for Lake Taihu (China). Water Res. 2017, 119, 276–287. [Google Scholar] [CrossRef] [PubMed]
  14. Lepori, F.; Roberts, J.J. Effects of internal phosphorus loadings and food-web structure on the recovery of a deep lake from eutrophication. J. Great Lakes Res. 2017, 43, 255–264. [Google Scholar] [CrossRef]
  15. Watson, S.B.; Miller, C.J.; Arhonditsis, G.B.; Boyer, G.L.; Carmichael, W.W.; Charlton, M.N.; Wilhelm, S.W. The re-eutrophication of Lake Erie: Harmful algal blooms and hypoxia. Harmful Algae 2016, 56, 44–66. [Google Scholar] [CrossRef] [PubMed]
  16. Cooke, G.D. Internal phosphorus loading in shallow lakes: Importance and control. Lake Reserv. Manag. 2005, 21, 209–217. [Google Scholar] [CrossRef] [Green Version]
  17. Jeppesen, E.; Søndergaard, M.; Jensen, J.P.; Havens, K.E.; Anneville, O.; Carvalho, L.; Winder, M. Lake responses to reduced nutrient loading—an analysis of contemporary long-term data from 35 case studies. Freshw. Biol. 2005, 50, 1747–1771. [Google Scholar] [CrossRef]
  18. Ho, J.C.; Michalak, A.M. Phytoplankton blooms in Lake Erie impacted by both longterm and springtime phosphorus loading. J. Great Lakes Res. 2017, 43, 221–228. [Google Scholar] [CrossRef]
  19. Schindler, D.W.; Hecky, R.E.; Findlay, D.L.; Stainton, M.P.; Parker, B.R.; Paterson, M.J.; Kasian, S. Eutrophication of lakes cannot be controlled by reducing nitrogen input: Results of a 37-year whole-ecosystem experiment. Proc. Natl. Acad. Sci. USA 2008, 105, 11254–11258. [Google Scholar] [CrossRef] [Green Version]
  20. Lewis, W.M.; Wurtsbaugh, W.A.; Paerl, H.W. Rationale for control of anthropogenic nitrogen and phosphorus to reduce eutrophication of inland waters. Environ. Sci. Technol. 2011, 45, 10300–10305. [Google Scholar] [CrossRef]
  21. Paerl, H.W.; Scott, J.T.; McCarthy, M.J. It takes two to tango: When and where dual nutrient (N & P) reductions are needed to protect lakes and downstream ecosystems. Environ. Sci. Technol. 2016, 50, 10805–10813. [Google Scholar] [CrossRef] [PubMed] [Green Version]
  22. Scott, J.T.; McCarthy, M.J. Nitrogen fixation may not balance the nitrogen pool in lakes over timescales relevant to eutrophication management. Limnol. Oceanogr. 2010, 55, 1265–1270. [Google Scholar] [CrossRef]
  23. Xu, H.; Paerl, H.W.; Qin, B.; Zhu, G.; Hall, N.S.; Wu, Y. Determining critical nutrient thresholds needed to control harmful cyanobacterial blooms in hypertrophic Lake Taihu, China. Environ. Sci. Technol. 2015, 49, 1051–1059. [Google Scholar] [CrossRef] [PubMed]
  24. Ding, S.M.; Chen, M.S.; Gong, M.D.; Fan, X.F.; Qin, B.Q.; Xu, H.; Zhang, C. Internal phosphorus loading from sediments causes seasonal nitrogen limitation for harmful algal blooms. Sci. Total Environ. 2018, 625, 872–884. [Google Scholar] [CrossRef] [PubMed]
  25. Bullerjahn, G.S.; McKay, R.M.; Davis, T.W.; Baker, D.B.; Boyer, G.L.; D’Anglada, L.V.; Wilhelm, S.W. Global solutions to regional problems: Collecting global expertise to address the problem of harmful cyanobacterial blooms. A Lake Erie case study. Harmful Algae 2016, 54, 223–238. [Google Scholar] [CrossRef] [Green Version]
  26. Chaffin, J.D.; Bridgeman, T.B.; Bade, D.L. Nitrogen constrains the growth of late summer cyanobacterial blooms in Lake Erie. Adv. Microbiol. 2013, 3, 16. [Google Scholar] [CrossRef] [Green Version]
  27. Holmroos, H.; Hietanen, S.; Niemisto, J.; Horppila, J. Sediment resuspension and denitrification affect the nitrogen to phosphorus ratio of shallow lake waters. Fundam. Appl. Limnol. 2012, 180, 193–205. [Google Scholar] [CrossRef]
  28. Yang, C.; Yang, P.; Geng, J.; Yin, H.; Chen, K. Sediment internal nutrient loading in the most polluted area of a shallow eutrophic lake (Lake Chaohu, China) and its contribution to lake eutrophication. Environ. Pollut. 2020, 262, 114292. [Google Scholar] [CrossRef]
  29. Ma, S.N.; Wang, H.J.; Wang, H.Z.; Li, Y.; Liu, M.; Liang, X.M.; Søndergaard, M. High ammonium loading can increase alkaline phos- phatase activity and promote sediment phosphorus release: A two-month meso- cosm experiment. Water Res. 2018, 145, 388–397. [Google Scholar] [CrossRef]
  30. Ma, S.N.; Wang, H.J.; Wang, H.Z.; Zhang, M.; Li, Y.; Bian, S.J.; Jeppesen, E. Effects of nitrate on phosphorus release from lake sediments. Water Res. 2021, 194, 116894. [Google Scholar] [CrossRef]
  31. Chalar, G.; Tundisi, J.G. Phosphorus fractions and fluxes in the water column and sediments of a tropical reservoir (Lobo-Broa-SP). Int. Rev. Hydrobiol. 2015, 86, 183–194. [Google Scholar] [CrossRef]
  32. Rydin, E. Potentially mobile phosphorus in Lake Erken sediment. Water Res. 2000, 34, 2037–2042. [Google Scholar] [CrossRef]
  33. Wang, W.W.; Jiang, X.; Zheng, B.H.; Chen, J.Y.; Zhao, L.; Zhang, B.; Wang, S.H. Composition, mineralization potential and release risk of nitrogen in the sediments of Keluke Lake, a Tibetan Plateau freshwater lake in China. R. Soc. Open Sci. 2018, 5, 180612. [Google Scholar] [CrossRef] [PubMed] [Green Version]
  34. Markovic, S.; Liang, A.; Watson, S.B.; Guo, J.; Mugalingam, S.; Arhonditsis, G.; Dittrich, M. Biogeochemical mechanisms controlling phosphorus diagenesis and internal loading in a remediated hard water eutrophic embayment. Chem. Geol. 2019, 514, 122–137. [Google Scholar] [CrossRef]
  35. Porubsky, W.P.; Weston, N.B.; Joye, S.B. Benthic metabolism and the fate of dissolved inorganic nitrogen in intertidal sediments. Estuar. Coast. Shelf Sci. 2009, 83, 392–402. [Google Scholar] [CrossRef]
  36. Burger, D.F.; Hamilton, D.P.; Pilditch, C.A.; Gibbs, M.M. Benthic nutrient fluxes in a eutrophic, polymictic lake. Hydrobiologia 2007, 584, 13–25. [Google Scholar] [CrossRef]
  37. Jiang, X.; Jin, X.; Yao, Y.; Li, L.; Wu, F. Effects of biological activity, light, temperature and oxygen on phosphorus release processes at the sediment and water interface of Taihu Lake, China. Water Res. 2008, 42, 2251–2259. [Google Scholar] [CrossRef] [PubMed]
  38. Liikanen, A.; Murtoniemi, T.; Tanskanen, H.; Vaisanen, T.; Martikainen, P.J. Effects of temperature and oxygen availability on greenhouse gas and nutrient dynamics in sediment of a eutrophic mid-boreal lake. Biogeochemistry 2002, 59, 269–286. [Google Scholar] [CrossRef]
  39. Müller, S.; Mitrovic, S.M.; Baldwin, D.S. Oxygen and dissolved organic carbon control release of N, P and Fe from the sediments of a shallow, polymictic lake. J. Soil. Sediment. 2016, 16, 1109–1120. [Google Scholar] [CrossRef]
  40. Jackson, M. Soil Chemical Analysis; Prentice Hall of India Pvt. Ltd.: New Delhi, India, 1973; p. 498. [Google Scholar]
  41. Anderson, G. Factors affecting the estimation of phosphate-ester in soils. J. Sci. Food Agr. 1960, 11, 497–503. [Google Scholar] [CrossRef]
  42. Nelson, D.W.; Sommers, L.E. Total nitrogen analysis of soil and plant tissues. J. AOAC Int. 1980, 63, 770–778. [Google Scholar] [CrossRef]
  43. Li, Q.M.; Wang, X.X.; Bartlett, R.; Pinay, G.; Kan, D.; Zhang, W.; Sun, J. Ferrous iron phosphorus in sediments: Development of a quantification method through 2,2′-bipyridine extraction. Water Environ. Res. 2012, 84, 2037–2044. [Google Scholar] [CrossRef] [PubMed] [Green Version]
  44. Hupfer, M.; Gachter, R.; Giovanoli, R. Transformation of phosphorus species in settling seston and during early sediment diagenesis. Aquat. Sci. 1995, 57, 305–324. [Google Scholar] [CrossRef]
  45. Huo, S.; Zhang, J.; Xi, B.; Zan, F.Y.; Su, J.; Yu, H. Distribution of nitrogen forms in surface sediments of lakes from different regions, China. Environ. Earth Sci. 2014, 71, 2167–2175. [Google Scholar] [CrossRef]
  46. Jiao, Y.; Xu, L.; Li, Q.; Gu, S. Thin-layer fine-sand capping of polluted sediments decreases nutrients in overlying water of Wuhan Donghu Lake in China. Environ. Sci. Pollut. Res. 2020, 27, 7156–7165. [Google Scholar] [CrossRef]
  47. Wang, S.; Qian, X.; Han, B.P.; Wang, Q.H.; Ding, Z.F. Physical limnology of a typical subtropical reservoir in south China. Lake Reserv. Manag. 2011, 27, 149–161. [Google Scholar] [CrossRef] [Green Version]
  48. Armstrong, F.A.J. Determination of Nitrate in Water Ultraviolet Spectrophotometry. Anal. Chem. 1963, 35, 1292–1294. [Google Scholar] [CrossRef]
  49. James, G.; Witten, D.; Hastie, T.; Tibshirani, R. An Introduction to Statistical Learning with Applications in R; Springer: New York, NY, USA, 2013; pp. 101–102. [Google Scholar]
  50. R Core Team. R: A language and environment for statistical computing. In R Foundation for Statistical Computing; R Core Team: Vienna, Austria, 2019. [Google Scholar]
  51. Søndergaard, M.; Jensen, J.P.; Jeppesen, E. Role of sediment and internal loading of phosphorus in shallow lakes. Hydrobiologia 2003, 506, 135–145. [Google Scholar] [CrossRef]
  52. Gu, S.; Gruau, G.; Dupas, R.; Petitjean, P.; Li, Q.; Pinay, G. Respective roles of Fe-oxyhydroxide dissolution, pH changes and sediment inputs in dissolved phosphorus release from wetland soils under anoxic conditions. Geoderma 2019, 338, 365–374. [Google Scholar] [CrossRef]
  53. Hicks, N.; Liu, X.; Gregory, R.; Kenny, J.; Lucaci, A.; Lenzi, L.; Duncan, K.R. Temperature driven changes in benthic bacterial diversity influences biogeochemical cycling in coastal sediments. Front. Microbiol. 2018, 9, 1730. [Google Scholar] [CrossRef] [Green Version]
  54. Yang, X.; Chen, X.; Yang, X. Effect of organic matter on phosphorus adsorption and desorption in a black soil from Northeast China. Soil Tillage Res. 2019, 187, 85–91. [Google Scholar] [CrossRef]
Figure 1. Location of the Hongchaojiang and Niuweiling reservoirs in Beihai City, southern China, and the sampling sites (black pentagons).
Water 14 00664 g001
Figure 2. (a) Phosphorus and (b) nitrogen fractions in sediments by depth at each sampling site (H1, H2, N1, and N2).
Water 14 00664 g002
Figure 3. Concentrations of (a) dissolved total P (TP), (b) total N (TN), (c) soluble reactive P (SRP), and (d) ammonium (NH4-N) in the water overlying sediments incubated at 15 °C and 25 °C for 1 (Day 1) and 20 days (Day 20), by depth, at each sampling site (H1, H2, N1, and N2).
Water 14 00664 g003
Figure 4. Apparent fluxes of dissolved total P (TP), total N (TN), soluble reactive P (SRP), and ammonium (NH4-N) during the 20-day incubation at 15 °C and 25 °C from sediments, by depth, at each sampling site from Hongchaojiang (HCJ) (a,b) and Niuweiling (NWL) (c,d) reservoirs.
Water 14 00664 g004
Figure 5. Boxplots of apparent fluxes of (a) soluble reactive P (SRP) and dissolved total P (TP) and (b) ammonium (NH4-N) and total N (TN) during the 20-day incubation at 15 °C and 25 °C from sediments from Hongchaojiang (HCJ) and Niuweiling (NWL) reservoirs. The middle bar represents the median, while the asterisk in the box represents the mean of all sediment from two sites in NWL and HCJ. The lower and upper bars limit the 1st quartile (q0.25) and the 3rd quartile (q0.75), respectively. The lower and upper whiskers are, respectively, the 1st quartile minus 1.5 times the interquartile range and the 3rd quartile plus 1.5 times the interquartile range. Diamonds outside the box represent outliers that exceed the lower and upper whiskers of the box.
Water 14 00664 g005
Figure 6. Pearson correlation matrix between sediment properties and apparent fluxes of dissolved total P (TP), soluble reactive P (SRP), total N (TN), and ammonium (NH4-N) during the 20-day incubation at 15°C and 25 °C from sediments from Hongchaojiang (HCJ) and Niuweiling (NWL) reservoirs. Only significant correlation coefficients (p < 0.05) are shown. Org_N: organic N; TIN: total inorganic N; KCl_N: ion-exchangeable N; Res_P: residual organic and refractory P; HCl_P: calcium-bound P; NaOH_P: Fe/Al-oxide-bound P; BD_P: reductant soluble P; NH4Cl_P: loosely sorbed P; Eh: redox potential; TNS: sediment total N; TOC: total organic carbon; TFe: total iron; WEP: water extractable P; OP: organic P; TPS: sediment total P.
Water 14 00664 g006
Figure 7. Redundancy analysis (RDA) used to identify the main controlling factors of sediment properties for apparent fluxes of (a) dissolved total P (TP) and soluble reactive P (SRP) and (b) total N (TN) and ammonium (NH4-N) during the 20-day incubation at 15 °C and 25 °C. Eh: redox potential; TOC: total organic carbon; TFe: total iron; WEP: water extractable P; OP: organic P; NH4Cl_P: loosely sorbed P; BD_P: reductant soluble P; TIN: total inorganic N.
Water 14 00664 g007
Table 1. Physiochemical properties of sediments at each sampling site (H1, H2, N1, and N2). Values are mean ± standard deviation of the layered sediments from the same site.
ParameterH1H2N1N2
pH5.81 ± 0.22 b5.72 ± 0.09 b6.25 ± 0.15 a6.28 ± 0.14 a
Eh−50.80 ± 31.92 b−14.25 ± 20.56 b−252.40 ± 117.16 a−167.25 ± 91.63 a
TOC g kg−131.97 ± 11.11 bc24.04 ± 13.86 c59.81 ± 3.33 a39.14 ± 18.32 b
TNS g kg−11.45 ± 0.55 b1.14 ± 0.95 b3.60 ± 1.01 a1.95 ± 0.90 b
TPS g kg−10.24 ± 0.06 c0.10 ± 0.04 d0.71 ± 0.08 a0.49 ± 0.21 b
OP g kg−10.13 ± 0.06 c0.05 ± 0.02 c0.32 ± 0.12 a0.23 ± 0.12 b
WEP mg kg−11.30 ± 0.37 b1.62 ± 1.17 ab2.01 ± 1.73 ab2.72 ± 2.05 a
TFe g kg−127.35 ± 14.79 a15.74 ± 8.85 b22.38 ± 14.34 ab24.92 ± 13.81 ab
Note. Different superscript letters in the same row indicate significant differences in means at p < 0.05. Eh: redox potential; TOC: total organic carbon; TNS: sediment total nitrogen; TPS: sediment total phosphorus; OP: organic phosphorus; WEP: water extractable phosphorus; TFe: total iron.
Table 2. Phosphorus and nitrogen fractions in sediments at each sampling site (H1, H2, N1, and N2). Values are mean ± standard deviation of the layered sediments from the same site. The units for phosphorus and nitrogen fractions are mg kg−1 and g kg−1, respectively.
ParameterH1H2N1N2
NH4Cl-P 0.24 ± 0.21 b0.87 ± 0.48 a0.54 ± 0.10 b0.77 ± 0.21 a
BD-P23.48 ± 9.25 c19.26 ± 10.39 c92.29 ± 10.65 b167.92 ± 11.19 a
NaOH-P82.56 ± 27.14 b37.78 ± 19.46 c199.76 ± 22.36 a184.39 ± 23.20 a
HCl-P1.32 ± 0.51 b0.52 ± 0.50 b9.04 ± 2.39 a10.21 ± 4.36 a
Res-P53.47 ± 19.23 c23.72 ± 17.45 c147.84 ± 35.33 a77.06 ± 32.23 b
KCl-N0.09 ± 0.03 b0.07 ± 0.02 b0.22 ± 0.05 a0.07 ± 0.03 b
H2SO4-N0.02 ± 0.01 b0.02 ± 0.01 b0.05 ± 0.01 a0.03 ± 0.01 b
Org-N1.34 ± 0.55 b1.05 ± 0.95 b3.33 ± 1.01 a1.86 ± 0.90 ab
Note. Different superscript letters in the same row indicate significant differences in means at p < 0.05. NH4Cl-P: loosely sorbed phosphorus (P); BD-P: reductant soluble P; NaOH-P: Fe/Al-oxide-bound P; HCl-P: calcium-bound P; Res-P: residual organic and refractory P; KCl-N: ion-exchangeable nitrogen (N); H2SO4-N: acid-extractable N; Org-N: organic N.
Table 3. Stepwise multiple linear regression (MLR) used to identify the primary controlling factors of sediment properties for apparent fluxes of dissolved total P (TP), soluble reactive P (SRP), total N (TN), and ammonium (NH4-N) during the 20-day incubation at 15 °C and 25 °C. Parameters are listed in descending order of the absolute value of the Pearson correlation coefficients between the explanatory factors and dependent variables.
Dependent VariablesExplanatory EquationAdjusted R2p-Value
Hongchaojiang (HCJ)
Flux_15 °C_TP−1.54[TOC] + 54.320.190.135
Flux_15 °C_SRP–1.86[TOC] + 85.740.620.007
Flux_25 °C_TP–0.83[TIN] + 230.300.390.04
Flux_25 °C_SRP0.89[BD-P] − 6.23[WEP] + 104.660.700.012
Flux_15 °C_TN0.40[TIN] − 32.790.75<0.002
Flux_15 °C_NH4_N0.10[TIN] − 6.380.87<0.001
Flux_25 °C_TN0.36[KCl-N] + 0.26[NaOH-P] − 11.550.690.012
Flux_25 °C_NH4_N0.06[KCl-N] + 0.05[BD-P] − 3.560.94<0.001
Niuweiling (NWL)
Flux_15 °C_TP36.73[WEP] − 50.800.400.040
Flux_15 °C_SRP12.31[WEP] + 5.340.390.042
Flux_25 °C_TP−1.48[TIN] + 290.200.780.001
Flux_25 °C_SRP−3.25[KCl-N] + 2.52[TIN] + 110.110.610.025
Flux_15 °C_TN0.11[TIN] − 0.390.84<0.001
Flux_15 °C_NH4_N−0.01[Res-P] + 0.750.000.51
Flux_25 °C_TN0.14[TIN] − 0.35[BD-P] + 60.370.820.002
Flux_25 °C_NH4_N−0.24[BD-P] + 0.48[TNS] + 4.260.820.002
Note. TOC: total organic carbon; TIN: total inorganic N; BD_P: reductant soluble P; WEP: water extractable P; KCl_N: ion-exchangeable N; NaOH_P: Fe/Al-oxide-bound P; BD_P: reductant soluble P; Res_P: residual organic and refractory P; TNS: sediment total nitrogen.
Publisher’s Note: MDPI stays neutral with regard to jurisdictional claims in published maps and institutional affiliations.

