Article

Characteristic and Attribution of Runoff Variation in the Yanhe River Basin, Loess Plateau, Based on the Budyko Hypothesis

1
School of Soil and Water Conservation, Beijing Forestry University, Beijing 100083, China
2
Research Center of Saline and Alkali Land of State Forestry Administration, Chinese Academy of Forestry, Beijing 100091, China
*
Author to whom correspondence should be addressed.
Water 2022, 14(3), 495; https://doi.org/10.3390/w14030495
Submission received: 22 December 2021 / Revised: 24 January 2022 / Accepted: 5 February 2022 / Published: 7 February 2022
(This article belongs to the Topic Water Management in the Era of Climatic Change)

Abstract

:
The ecological restoration projects in the Loess Plateau (LP) has significantly altered the underlying surface conditions, coupled with a warming–wetting climate, which has profoundly affected the regional water cycle. Evaluating the response of runoff to external environmental change and quantitatively identifying the contribution of anthropogenic interference and climate change are prerequisites for efficient utilization of water resources in arid/semi-arid regions. Daily recorded data of hydrological and meteorological elements between 1969 and 2019 and the elasticity coefficient method based on Budyko hypothesis were used for attribution analysis of runoff change in the Yanhe River basin. The results show the following: (1) the measured runoff decreased significantly (p < 0.05, –0.2845 mm year−1), and suggested substantial difference before and after 2000; (2) the area of woodland and grassland had a sharp increase from 2000, while the elasticity of runoff to precipitation, potential evapotranspiration (ET0), and vegetation all decreased; (3) the improvement of underlying surface conditions has become the leading factor of runoff reduction with a contribution of 96.78%; (4) the impact of vegetation restoration on runoff reduction is effective within a certain threshold. We consider that more attention should be paid to the afforestation scale and its possible negative eco-hydrological effects in future ecological restoration.

1. Introduction

A changing environment strongly influenced by climate and anthropogenic interference can directly affect the land surface process [1] and alter the mechanism of runoff generation and concentration [2]. Decreasing trends in runoff and sediment loads have been observed in approximately 50% of the world’s rivers, due to the effects of climate change, when coupled with the impacts of other natural and anthropogenic disturbances [3]. The middle reaches of the Yellow River (YR) in China, which is located in an arid/semi-arid region, have undergone particularly profound declines in runoff, and have gradually become areas of considerable research [4]. Moreover, the sharp reduction of runoff has led to new problems such as the serious shrinkage of the channel in the lower reaches and the reduction of the flood capacity [5].
As one of the common concerns in the field of global water cycle research, runoff dynamic change is particularly sensitive to climate [6,7]. The variation of meteorological elements such as precipitation, temperature, wind speed, and radiation change the cycle and distribution of water resources, and then affect river runoff [8]. China has experienced significant climate change, with the warmest 20 years since the 20th century. Studies have found that the temperature and precipitation have increased in the past 10–15 years in northwest China, exhibiting a trend of warming–wetting [9,10]. In particular, the temperature in the source of the YR [11] and part of the LP [12], showed a faster increase than the average level for China and the world. The ecological environment and human lives may be adversely affected by extreme climate. Extreme temperature events may lead to glacier melting, reducing ice and snow reserves located upstream, then weakening the ability of glaciers to recharge runoff [13]. Extreme precipitation events may result in infiltration-excess runoff production, causing surface scour and then destroying vegetation roots.
As another important factor, human activities affect hydrological processes mainly through the construction of water conservancy projects [14], the change of underlying surface caused by vegetation restoration [15], etc. Vegetation is an important part of the terrestrial ecosystem and also the most sensitive component of climate change. Since 1999, because of the implementation of ecological restoration projects such as the Grain for Green Project (GGP), the vegetation coverage in arid/semi-arid areas of northwest China has been significantly improved [16], having a profound impact on the underlying surface conditions and hydrological processes in the YR basin. Some scholars believe that the ecological restoration measures have played an absolute leading role in the reduction of runoff and sediment loads in the YR basin [17,18]. However, due to the diversity of the ecosystem, the resources required by vegetation growth cannot be met without limit, while the impact of ecological restoration measures on hydrological processes depends on the scale and coverage of vegetation.
At present, monitoring vegetation dynamics and quantifying the response of vegetation growth to climate has become an important field of global change research in the context of frequent extreme climate events [19,20]. Some scholars have studied the correlation between normalized difference vegetation index (NDVI) variation characteristics of different vegetation types and climate factors at different scales. The results showed that vegetation growth was very sensitive to temperature and precipitation, and climate change has a significant impact on vegetation growth [21], especially in arid/semi-arid areas [22], where extreme climate leads to a decrease in vegetation coverage. In recent years, under the background of large-scale vegetation restoration, have the changes of climate and underlying surface conditions had new effects on runoff in the Loess hilly-gully region with complex geographical conditions? How does the passive remodeling process of hydrological connectivity caused by dramatic changes in underlying surface, affect runoff? The revelation of these concerns will be beneficial in understanding the geographical differentiation of the hydrological effects caused by vegetation and climate change.
Several methods have been applied to quantitatively distinguish the impact of climate and anthropogenic disturbance on runoff, such as the hydrological model [23], the elasticity coefficient [24], the watershed comparative analysis [25], etc. Among them, the elasticity coefficient, based on the Budyko hypothesis, has been widely used in the study of the law of runoff variation, due to its good performance in distinguishing the sensitivity and contribution of the potential factors. For half a century, many scholars have carried out theoretical derivation and empirical research on the Budyko empirical model [26,27].Current studies mainly tend to modify the control parameters in the empirical model, and some research conclusions directly attribute the coupling parameters of precipitation and temperature to the contribution of the underlying surface [28].The research results obtained by using this method have also been widely reported. Zheng et al. [29] analyzed runoff variability in the alpine region (source of the YR) by using the elasticity coefficient method, and found that the contribution of land-use and climate to runoff change were 70% and 30%, respectively. Liu et al. [30] analyzed the variation of the streamflow in a water diversion project in the semi-humid region by using six different elasticity coefficient models based on the Budyko hypothesis, and found that climate change was the main factor leading to the decline of streamflow, contributing 84.1–90.1%. Li et al. [4] analyzed runoff changes in 12 semi-arid basins (the middle reaches of the YR), based on the Choudhury–Yang model and the elastic coefficient, and found that vegetation was the leading factor of runoff decline. However, under the background of climate fluctuation and frequent extreme climate, the application of the Budyko model in the attribution analysis of runoff change in the ecologically fragile Loess hilly-gully region requires further consideration of the specific conditions of the underlying surface of the study area.
Above all, it is of theoretical and practical significance to quantitatively distinguish the effects of anthropogenic disturbance and climate variation on runoff, so as to deeply appreciate the process of water cycle and improve the management measures of water resources. The main objectives of this paper are to (1) investigate the trends of the main hydrological and meteorological elements in the Yanhe River basin from 1969 to 2019, and study the substantial difference before and after the change point; (2) analyze the transfer of land-use structure caused by the GGP; (3) calculate the elasticity of runoff to precipitation, ET0, and vegetation; and (4) distinguish the contributions of the above factors to the variation of runoff. This study is structured as follows: In Section 2, the study area, data sources, and methods used in our study are introduced in detail. In Section 3, the trend and elasticity of runoff are evaluated, the land-use transfer processes are identified, and the contributions of climate and anthropogenic interference are calculated. In Section 4, the eco-hydrological effect of vegetation restoration and the uncertainty in attribution analysis of runoff change are discussed. The conclusions are proposed in the final section.

2. Materials and Methods
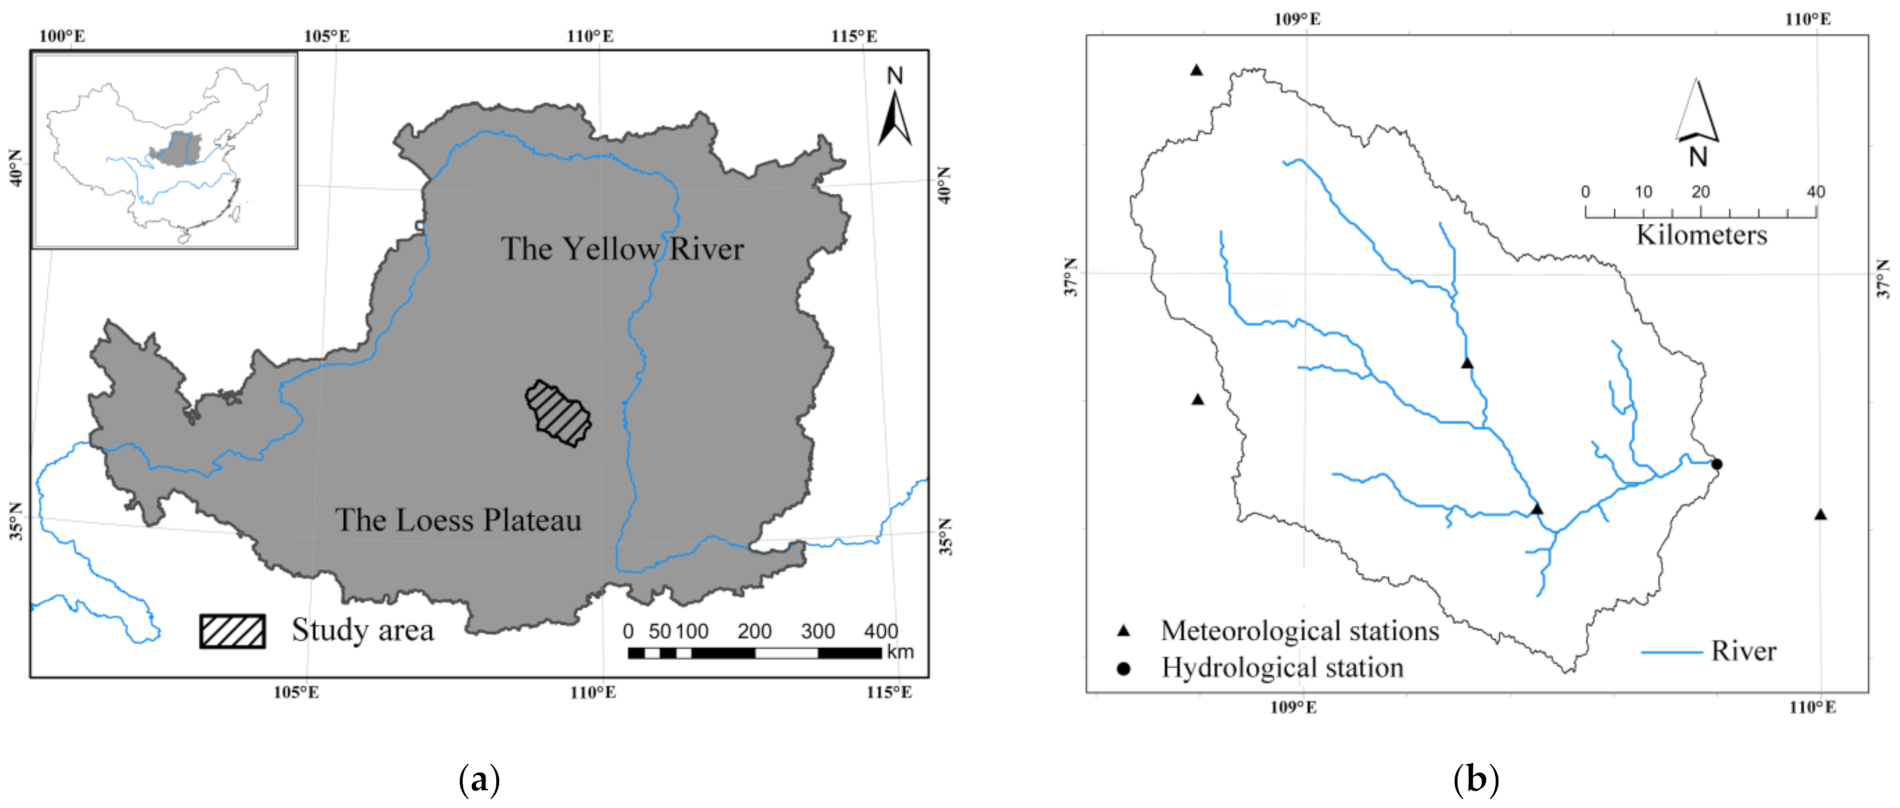
2.1. Basic Data

This study primarily focuses on the area above the control section of the Ganguyi Hydrological Station in the Yanhe River basin, encompassing an area of 5891.64 km2 (Figure 1), with a relative altitude difference of 972 m. From 1969 to 2019, the annual average precipitation was 489.79 mm, the maximum precipitation was 844.60 mm, and the minimum was 296.46 mm. The annual precipitation distribution was mostly concentrated in the flood season (from June to September), accounting for more than 70% of the total annual precipitation. The annual average temperature was 9.4 °C, the annual average wind speed was 1.3–3.3 m s−1, the annual average sunshine was 2418 h, the accumulated ≥0 °C annual total temperature was 3878.1 °C, the annual average frost-free period was 172 days, and the annual average evaporation was about 1000 mm.
The daily measured runoff data used in the paper were recorded by the Ganguyi Hydrological Station in the middle reaches of the YR. The meteorological records, such as precipitation, temperature, etc., were obtained from five stations: Ansai, Jingbian, Yan’an, Yanchang, and Zhidan.
Land-use changes were determined using remote sensing images from 1985, 1995, 2000, 2008, and 2015 (resolution 30 m × 30 m). Land-use was mapped by conducting supervised classifications on the images and through manual visual interpretations, using ERDAS 9.2 and ArcGIS 10.2 software.

2.2. Data Processing and Analysis

2.2.1. Potential Evapotranspiration

The ET0 was calculated according to the following equation [31]:
E T 0 = 0.408 Δ ( R n G ) + γ 900 T α + 273 u 2 V P D Δ + γ ( 1 + 0.34 u 2 )
where ET0 is the daily potential evapotranspiration (mm·d−1), ∆ is the slope of saturated vapor pressure in relation to air temperature (kPa·°C−1), Rn is the net radiation at the canopy surface (MJ·m−2·d−1), G is the soil heat flux density (MJ·m−2·d−1), γ is the psychrometric constant (kPa·°C−1), Tα is the mean daily air temperature at 2 m height (°C), u2 is the wind speed at 2 m height (m·s−1), VPD is the vapor pressure deficit (kPa). The annual ET0 was obtained by the accumulative daily values.

2.2.2. Time-Varying Trends in Hydrological and Meteorological Elements

The daily measured runoff (calculated by dividing the total annual volume of stream flow by the upstream basin area, mm), precipitation, and ET0 data were collected, sorted and counted on an annual basis from 1969 to 2019. The Mann–Kendall (MK) method [32,33] and a double mass curve were also applied to identify the abrupt change of runoff. The fluctuation of each factor was evaluated by the variation coefficient, calculated according to the following equation:
C v = σ D ¯
where σ and D ¯ are the standard deviation and average of time series records, respectively.

2.2.3. Attribution Analysis of Runoff Change

For a closed watershed, the water balance equation at the multi-year scale can be expressed as follows:
R = PETa − ∆S
where R is the runoff (mm), P is the precipitation (mm), ETa is the actual evapotranspiration (mm), ∆S is the change in soil water storage (mm). The variation of soil water storage can be considered constant over a long-time scale (more than 10 years), so Equation (3) can be simplified into the following equation:
R = PETa
The Budyko hypothesis holds that, there is a coupling equilibrium between water and heat in a watershed under certain climate and vegetation conditions [34]. The relationship between annual mean precipitation, ET0 and ETa can be described by an empirical curve. The ETa over a long-time scale can be estimated by the Budyko models. Among them, the Choudhury–Yang [27] model (as follows), obtained through empirical or analytical methods, was widely used with better application effect.
E T a = P × E T 0 P n + E T 0 1 / n
where n is the parameter reflecting the characteristics of the underlying surface, including landform, soil, and vegetation. The landform, soil, and other factors in the study area did not change significantly during the study period. Therefore, the parameter n was mainly determined by land-use/vegetation cover change and can be calculated by Equations (4) and (5). It is generally believed that the increase of n was caused by the improvement of vegetation cover in the basin.
The elasticity coefficient refers to the sensitivity of the dependent variable to independent variable [35]. The elasticity of runoff regarding potential factors can be expressed by the following equation:
E x = l i m Δ x / x 0 Δ R / R Δ x / x = R x × x R
where R is the runoff (mm) and x is a factor (such as precipitation, ET0 or vegetation) that can influence the runoff. A positive (negative) elasticity coefficient of the x factor suggests that an increase (decrease) in the x variable will cause an increase (decrease) in runoff. The greater the absolute value of the elasticity coefficient, the higher the sensitivity.
Combining Equations (4)–(6), we can derive:
Δ R = f P d P + f E T 0 d E T 0 + f n d n = R P P R Δ P P R + R E T 0 E T 0 R Δ E T 0 E T 0 R + R n n R Δ n n R + δ = ε P Δ P P R + ε E T 0 Δ E T 0 E T 0 R + ε n Δ n n R + δ = C P + C E T 0 + C n + δ
where CP, CET0, and Cn make up the contribution of precipitation, ET0 and n to the change of runoff, respectively, εP, εET0, and εn make up the elasticity of runoff to precipitation, ET0 and n, respectively, δ is the systematic error.

3. Results

3.1. Identification of Abrupt Change in Runoff

The result of the MK method showed that the UF(k) and UB(k) statistical curves generated for runoff had an intersection in 2000 (Figure 2a). The intersection was within the critical value (α = 0.05, Y = ±1.96), indicating that the temporal sequence abruptly changed in 2000.
Based on the result of MK analysis, the study period was divided into a reference period (1969–2000, PI) and a change period (2001–2019, PII), then a double mass curve was performed on the precipitation-runoff (Figure 2b). As shown, the correlations (R2) of the fitted trend line of the above cumulative quantities were all relatively high (p < 0.001) whether during PI or PII. The slope of the fitting curve changed significantly in 2000, which was consistent with the conclusion of the MK method.

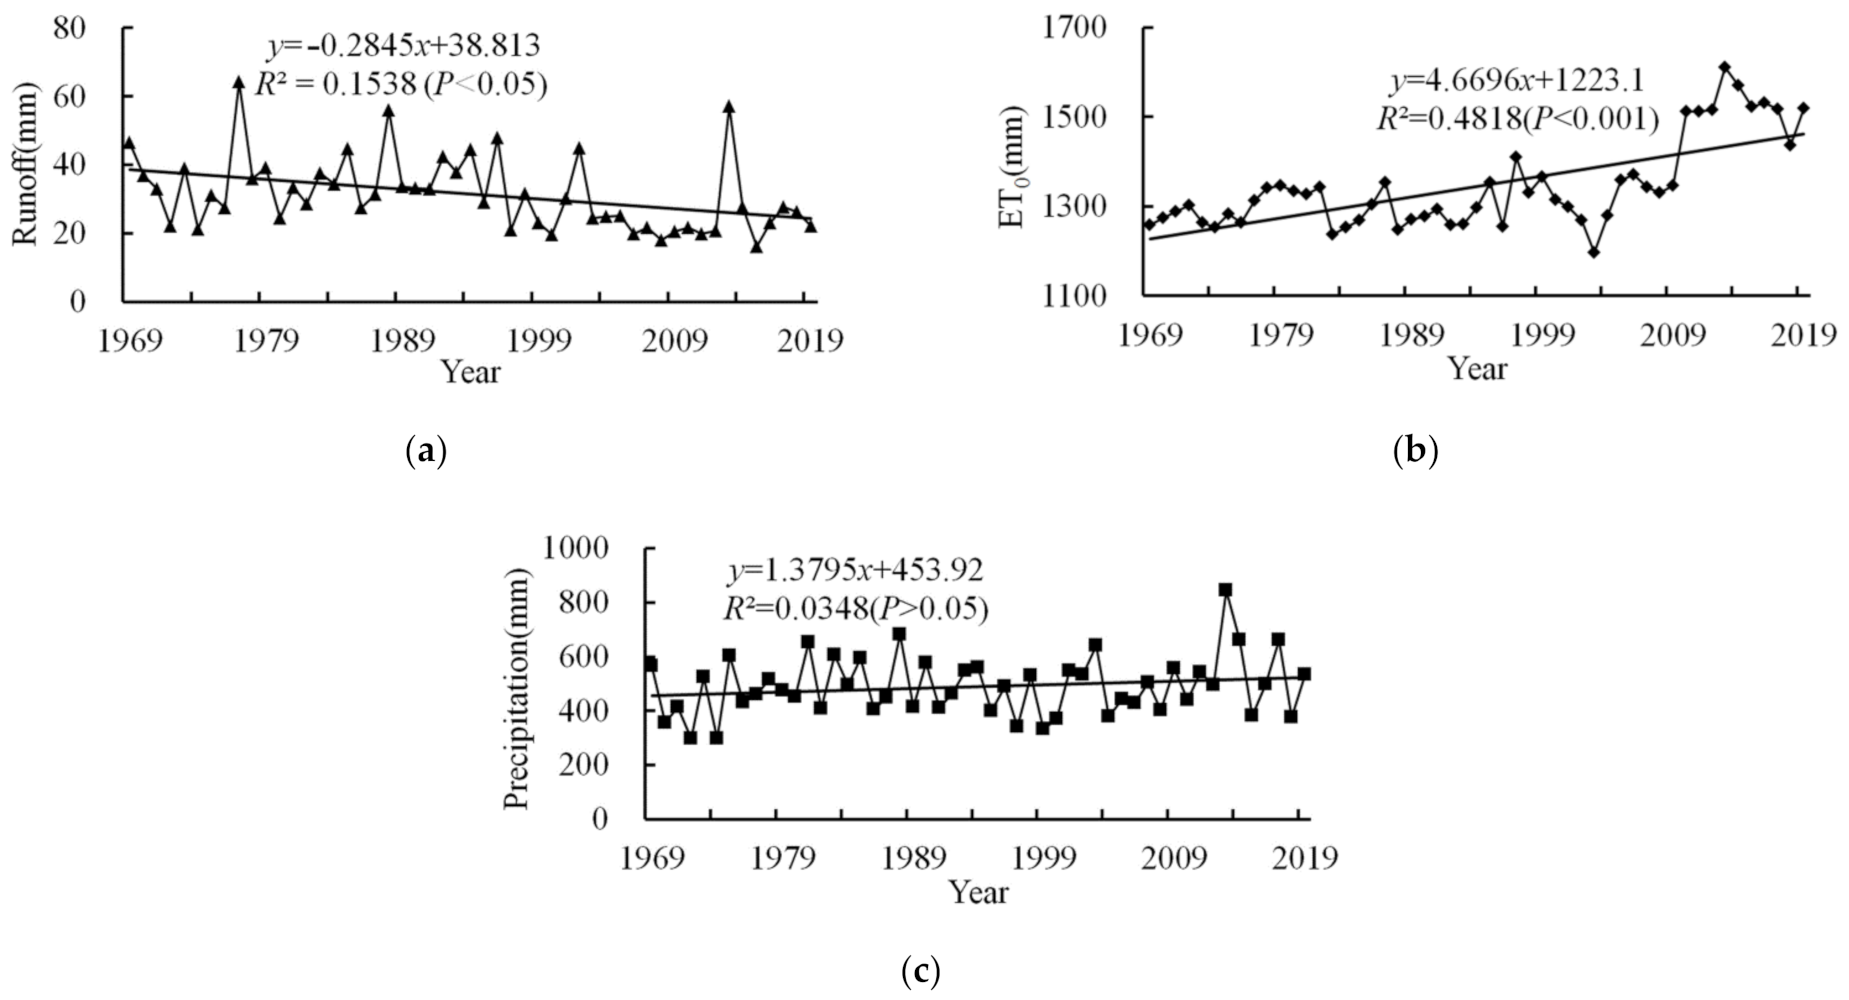
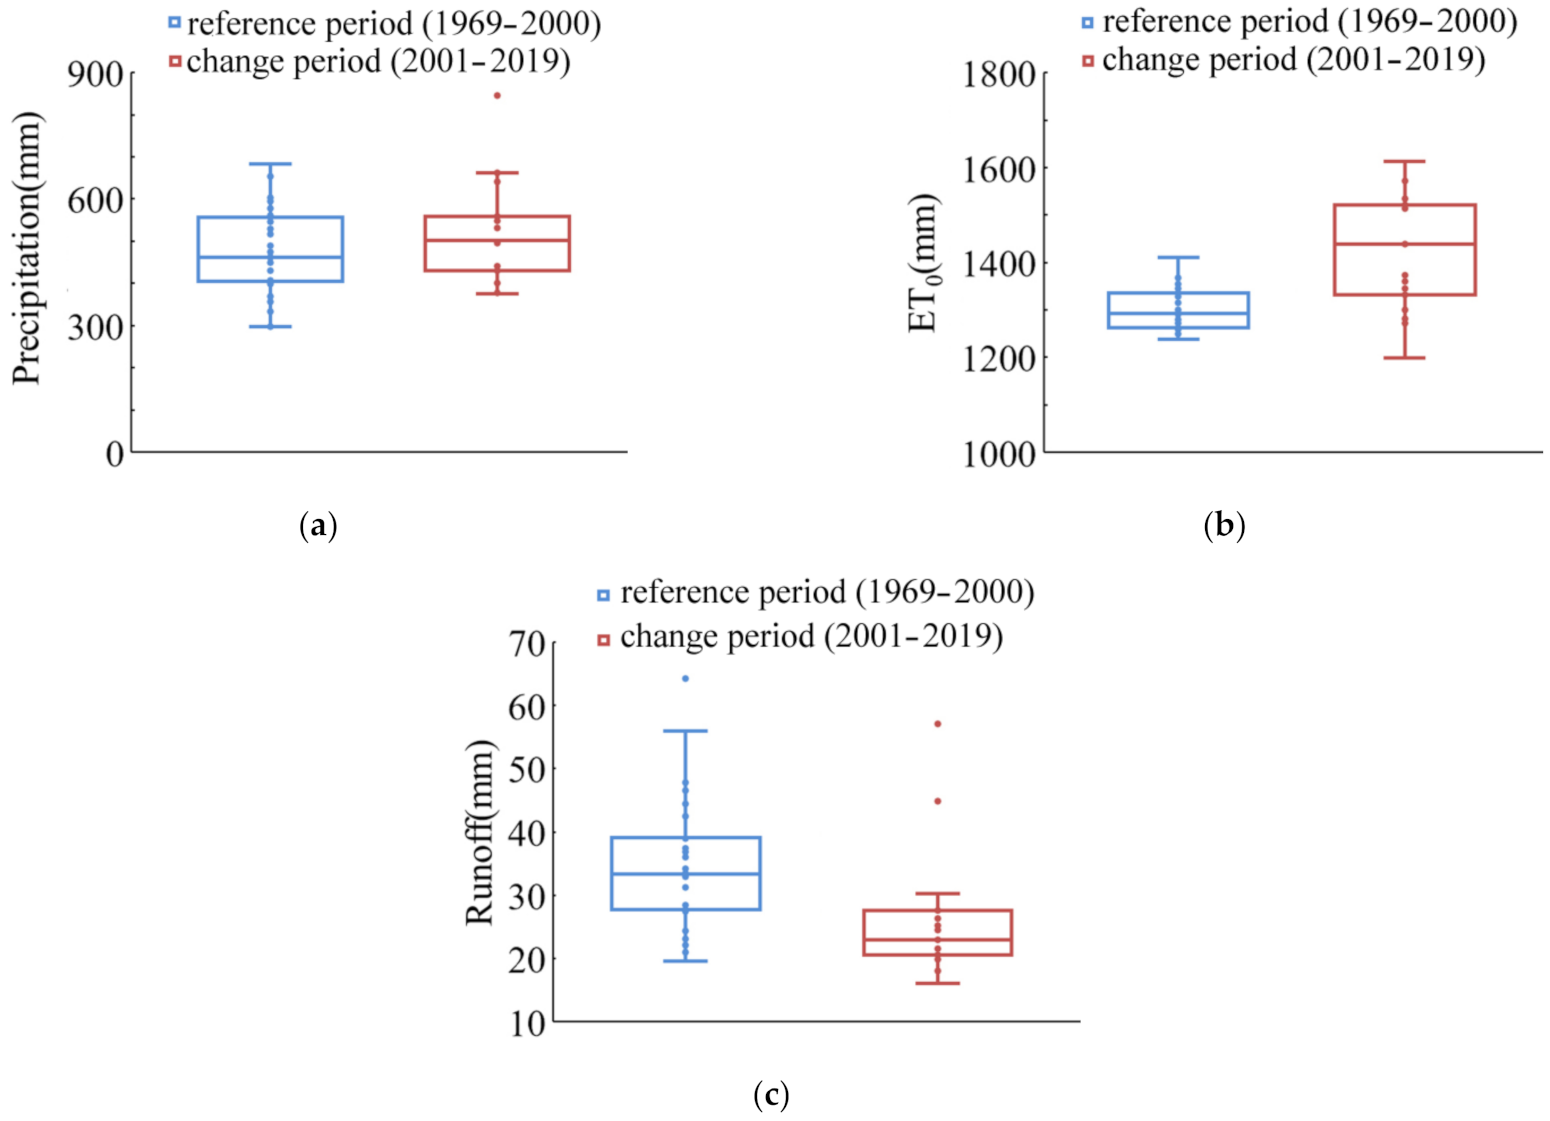
3.2. Inter-Annual Alteration in Hydrological and Meteorological Elements

Annual hydrological and meteorological records indicated that the observed runoff (Figure 3a) significantly decreased (p < 0.05, –0.2845 mm year−1) from 1969 to 2019, while the ET0 (Figure 3b) exhibited an insignificant upward trend (p < 0.001, 4.6696 mm year−1). The precipitation (Figure 3c) also showed an overall upward trend (p > 0.05, 1.3795 mm year−1), but only 3.48% of the total variance can be explained by the timing of the measurement.
The different performance of hydrological and meteorological elements in PI and PII are shown in Figure 4. The precipitation increased from 472.27 mm (PI) to 519.30 mm (PII), with a relative change rate of 9.96% (Figure 4a). The variation range of precipitation narrowed in PII, but the data points were denser away from the median and there were outliers deviating greatly from the box, indicating the frequency of extreme precipitation. The ET0 increased from 1298.07 mm (PI) to 1422.79 mm (PII), with a relative change rate of 9.61% (Figure 4b). The variation range of ET0 expanded considerably in PII, almost all data points were distributed away from the median, close to the extrema. This suggested that the ET0 fluctuated greatly during PII, which may be related to the surface disturbance caused by the GGP.
Compared with PI, the runoff in PII decreased by 8.82 mm, with a relative change of –25.42% (Figure 4c). Especially in the early 21st century (2000–2009), the average runoff decreased to 24.90 mm, 28.24% lower than that before 2000, while the decline trend has slowed down since 2010. The variation range of runoff narrowed significantly during PII, but there were many outliers far away from the box, which was considered to be related to the occurrence of extreme precipitation events.
The statistics of the intergenerational level changes of each element (Table 1) showed that the variation coefficient of runoff and precipitation both initially decreased before subsequently increasing, reaching their maximum between 2010 and 2019. The variation coefficient of ET0 experienced a gradual increase and then decreased slightly, with a maximum between 1990 and 2010.

3.3. Elasticity of Runoff to Climate and Vegetation

As shown in Table 2, during the whole study period (1969–2019), the elasticity coefficient of runoff to precipitation and ET0 were 0.166 and –0.039, respectively. This indicates that, when precipitation or ET0 increased by 10%, runoff would increase by 1.66% or decrease by 0.39%, respectively, and vice versa. The elasticity coefficient of runoff to the underlying surface parameter n, which represented vegetation change, was –1.738, indicating that runoff would be decreased by 17.38% when vegetation coverage increased by 10%.
Parameter n increased from 1.896 (PI) to 2.244 (PII), with a relative increase of 17.3%, indicating that the vegetation condition experienced a profound change during PII. The elasticity coefficients of runoff to precipitation and ET0 changed from 0.189 (PI) to 0.133 (PII), and –0.043(PI) to –0.033(PII), respectively, indicating that the effect of precipitation and ET0 on runoff has weakened in the 21st century. Overall, the sensitivity of runoff to precipitation, ET0, and underlying surface conditions all decreased during the change period.

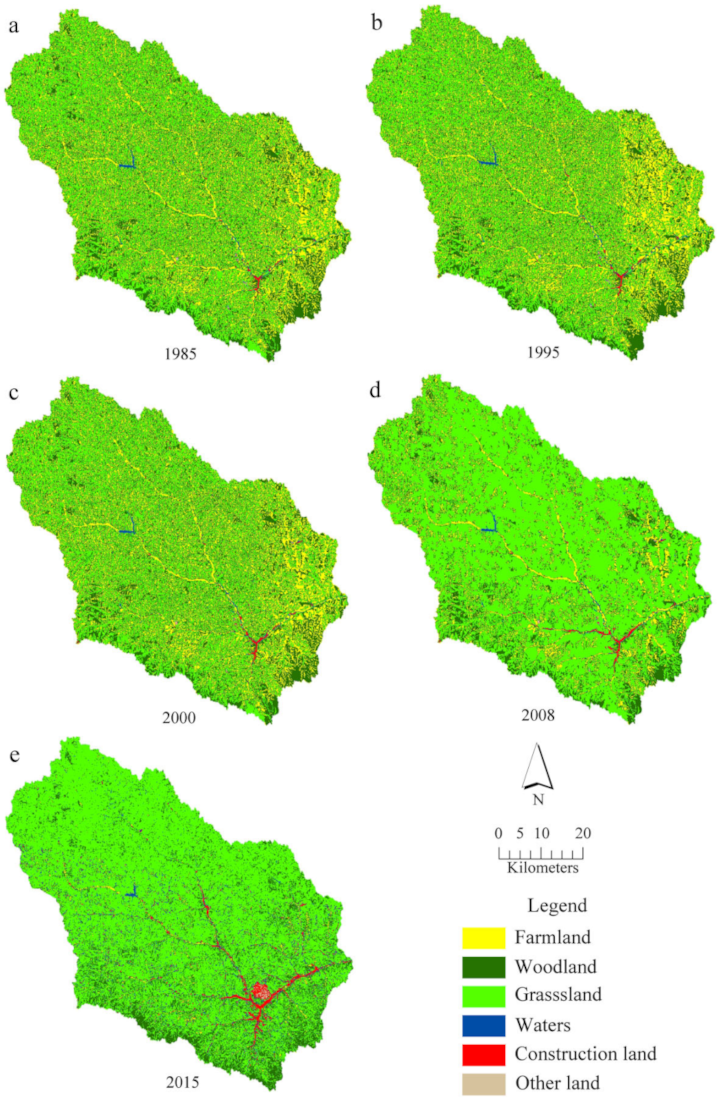
3.4. Composition and Transfer of Land-Use

According to the interpretation results (Figure 5) of remote sensing images in 1985, 1995, 2008, 2010, and 2015, the area proportions of each land-use type in the Yanhe River basin were calculated. The area of farmland, woodland, and grassland accounted for 99.29%, 99.22%, 99.16%, 99.05%, and 95.91%, respectively, of the total area in the years above.
The land-use transfer matrix (Table 3) was constructed based on the spatial analysis toolbox of ArcGIS. It can be found that agriculture was the main mode of production in the study area in 1985–2000, with slow transfer among different land-use types. Since 2000, the balance of original land-use structure fundamentally changed, and the obvious transfer among farmland, woodland, and grassland was the dominant process during this period. The area of farmland in 2015 decreased by 2259.11 km2 (88.07%) compared with 2000, of which 161.24 km2 and 2010.58 km2 were converted to woodland and grassland, respectively. The area proportion of woodland and grassland increased to 91% of the total area, caused by the implementation of the GGP. The increase of grassland and woodland has greatly altered the underlying surface, effectively improving the capacity of the soil to conserve water and maintain a low level of runoff in the watershed.

3.5. Attribution Analysis of Runoff Change

The contribution of precipitation, ET0, and vegetation to runoff change can be obtained by Equation (7), and the results are shown in Table 4. Since runoff was positively correlated with precipitation change, the upward trend of precipitation during PII did not contribute to the decrease of runoff. On the contrary, precipitation increased runoff by 0.461 mm with a contribution of –5.23%. The contribution of ET0 was 6.15%, which reduced runoff by 0.542 mm during the whole study period.
On the whole, the vegetation contributed the most of runoff decline, reaching 96.78%, and the corresponding runoff variation was –8.536 mm. The change of underlying surface conditions caused by vegetation restoration resulted in a significant decrease of runoff and offset the effect of precipitation increase.
In addition, we noticed that the systematic error was only 2.30% in the process of attribution analysis, indicating that the elasticity coefficient method was feasible for application in the typical arid/semi-arid region. However, at the same time, it also suggested that there were still one or more unknown factors affecting the change of runoff, besides precipitation, ET0 and vegetation.

4. Discussion

4.1. Variation of Hydrological and Meteorological Elements in the Yanhe River Basin

Ren et al. [36] found that with the reduction in precipitation, runoff and sediment load in the Yanhe River basin declined between 1961 and 2008. Li et al. [37] reached a similar conclusion by analyzing hydrological records in the Yanhe River basin between 1952 and 2003. Our study found that the decline in runoff (p < 0.05) became more significant as the study period was expanded from 1969 to 2019. Additional temporal data, however, showed that the change of precipitation turned into an insignificant upward trend. This finding about precipitation is different from the research conclusions of other scholars. With the ET0 also showing an extremely significant upward trend (p < 0.001), we suggest that the hydrological and meteorological situation within the Yanhe River basin has changed during the past 10 years, and there are also signs of warming–wetting.
The precipitation data points were highly discrete and far away from the median during PII, accompanied by outliers, and the variation coefficient reached its maximum in 2010–2019. All this indicates that, since the 21st century, especially the past 10 years, precipitation has experienced severe fluctuation, with more extreme precipitation events. The variation coefficient of runoff also showed the maximum in 2010–2019, which may have resulted from the extreme precipitation events and long-term accumulation of the GGP.

4.2. Attribution Analysis of Runoff Change

The obvious decrease of runoff in the Loess Plateau has been widely reported, but the dominant factors causing the change have been different in different periods. Zhang et al. [38] analyzed the runoff change and its leading factors in 11 basins of the Loess Plateau since the 1950s and concluded that the change of land use/cover caused by anthropogenic disturbance contributed more than 50% of the runoff reduction in eight basins, and climate factors played a more important role in the remaining three basins. Since the 21st century, it has been recognized that anthropogenic disturbance, represented by ecological restoration measures, have significantly reduced runoff in the Yanhe River basin. However, due to different research periods and methods, the contribution of anthropogenic disturbance has not exactly been the same. Gao et al. [39] believed that the contribution of climate factor to runoff change in the Yanhe River basin was almost equal to that of anthropogenic disturbance, while Wang et al. [40] concluded that the contribution of anthropogenic disturbance was much higher than that of climate factor, reaching 77.4%. We also consider that the change of underlying surface conditions caused by anthropogenic disturbance was the leading factor of runoff reduction in the Yanhe River basin, but its contribution was more than 95%, which is different from previous studies. At the same time, we also found that the frequent occurrence of extreme climate in the last five years has led to a certain recovery of runoff in the basin with time, which has not been reported yet. Whether this trend can continue in the future needs to be tested by more measured data of longer time series.

4.3. The Eco-Hydrological Effects of Vegetation Restoration

In recent years, some scholars have carried out a series of studies on vegetation change and its eco-hydrological effect. Since the 1980s, a significant greening trend has been observed over 25% to 50% of the global area, which has changed the process of the global surface water cycle [41]. The vegetation coverage in China has been also improved significantly since 2000, due to the impact of climate change and human activities [42]. The vegetation restoration projects have reduced sediment loads (about 90%) and measured runoff in the LP, resulting in an obvious decrease in the runoff coefficient in the middle reaches of the YR. Some scholars suggested that the vegetation restoration should be slowed down, otherwise it will lead to regional shortage of food and water resources.
In order to analyze the impact of the GGP on the eco-hydrological effect of vegetation, the PII was further divided into two periods (2001–2009 and 2010–2019) with a 10-year cycle to compare parameter n and its corresponding elasticity coefficient. The parameter n decreased in the 2010s, compared with that in 2001–2009 (Table 5), and the sensitivity of runoff to vegetation coverage has been reduced since the 2010s. It can be concluded that, although the area of woodland and grassland has still increased since 2010, it may not achieve the expected effect of vegetation restoration. Xia et al. [43] compared the underlying surface parameters and vegetation coverage in the Yanhe River basin from 2002 to 2016 by using the equation derived from the Budyko hypothesis. They found that the increasing trend of vegetation coverage has slowed significantly since 2010, which was not synchronized with the increase in woodland and grassland area, and the underlying surface parameters obviously showed the same performance. This opinion coincides with the conclusion of this article. In the initial stage, the vegetation restoration measures have a sharp impact on runoff, but with the vegetation restoration reaching a stable period, the impact may tend to moderate. The long-term effects of vegetation restoration on runoff need to be further studied.
The GGP would theoretically increase the vegetation coverage, but the planted trees may consume more water, while the poor water resources in arid/semi-arid areas of the LP may aggravate the water shortage in a short period, thus adversely affecting the vegetation diversity. Cao et al. [44] took five demonstration counties as examples in northern Shaanxi Province to study the influence of the GGP on vegetation coverage, and the results showed that the GGP resulted in a 30.5% decrease within vegetation coverage in afforestation areas. Improper selection of tree species or high planting density was considered to be the main cause of the negative effects above. How to increase the survival rate of afforestation is also the focus of further research.

4.4. Uncertainty in Attribution Analysis of Runoff Change

The original study from Budyko did not consider the factors such as underlying surface and watershed area, so the evapotranspiration rate and drought index calculated from measured data could not be fully projected on the Budyko curve in accordance with ideal conditions but were scattered around the curve. The method of interpreting these discrete points is mainly reflected by the control parameters in a series of empirical equations. In this paper, we applied the Choudhury–Yang coupling equation in the Yanhe River basin located in the Loess hilly-gully region, but there might still be some uncertainties resulting in systematic error.
In the process of calculating the contribution of the potential factor, the systematic error was 2.3%, indicating that the uncertainty has a limited influence on the final conclusion. The changes in runoff documented in this study would not be detectable in many humid regions having abundant vegetation, so the approach is likely to be applicable to basins in other arid/semi-arid regions which are sensitive to short-term (decadal scale) climatic shifts.

5. Conclusions

The Chinese government has implemented a number of ecological conservation and protection projects in arid/semi-arid regions to control soil erosion. In this paper, the Yanhe River basin was selected as the study area. We analyzed the variation trends of major measured hydrology and meteorology elements and identified the factors influencing runoff with the elasticity coefficient method based on the Budyko hypothesis. The results showed the following: (1) Between 1969 and 2019, the measured runoff showed an obvious downward trend (p < 0.05), with an abrupt change in 2000, and the average runoff in the change period decreased by 25.42% compared with that in the reference period. Precipitation and ET0 showed an upward trend (p > 0.05) and a significant decreasing trend (p < 0.001), respectively. The climate condition showed a trend of warming–wetting. (2) Farmland, woodland, and grassland were the three main land-use types, accounting for more than 95% in total. Due to the GGP, the proportion of woodland and grassland has gradually increased to 91% since the 21st century, compared with that in 2000. (3) The underlying surface parameter n increased from 1.896 in the reference period to 2.244 in the change period, with a relative increase of 18.35%. The vegetation was the leading factor resulting in the decline of runoff with a contribution of 96.78%, while the ET0 followed with a contribution of 6.15%. Precipitation increased runoff with a contribution of 5.23%. (4) By analyzing the periodic change of parameter n and the elasticity coefficient, we suggest that the response of runoff to vegetation restoration measures has a certain threshold effect in an arid/semi-arid area, and the runoff reduction will not remain for a long time. It may be related to the short-term water shortage caused by large-scale vegetation restoration, thus affecting the survival rate of afforestation. Large-scale vegetation restoration needs to be carried out carefully under the premise of assessing a reasonable threshold to avoid an ecological disaster.

Author Contributions

Data curation, J.W.; Methodology, X.W.; Writing—original draft, K.H.; Writing—review and editing, X.W. All authors have read and agreed to the published version of the manuscript.

Funding

This research was funded by [Natural Science Foundation of China] grant number [41871195]. And The APC was also funded by the funder above.

Data Availability Statement

The data used in this study are available from the corresponding author on reasonable request.

Acknowledgments

We thank the two anonymous reviewers for their valuable comments and constructive suggestions on the manuscript.

Conflicts of Interest

The authors declare no conflict of interest.

References

  1. Piao, S.; Ciais, P.; Huang, Y.; Shen, Z.; Peng, S.; Li, J.; Zhou, L.; Liu, H.; Ma, Y.; Ding, Y.; et al. The impacts of climate change on water resources and agriculture in China. Nature 2010, 467, 43–51. [Google Scholar] [CrossRef] [PubMed]
  2. Wang, S.; Fu, B.; Piao, S.; Lü, Y.; Ciais, P.; Feng, X.; Wang, Y. Reduced sediment transport in the Yellow River due to anthropogenic changes. Nat. Geosci. 2016, 9, 38–41. [Google Scholar] [CrossRef]
  3. Nilsson, C.; Reidy, C.A.; Dynesius, M.; Revenga, C. Fragmentation and flow regulation of the world’s large river systems. Science 2005, 308, 405–408. [Google Scholar] [CrossRef] [PubMed] [Green Version]
  4. Li, Y.; Liu, C.; Zhang, D.; Liang, K.; Li, X.; Dong, G. Reduced runoff due to anthropogenic intervention in the Loess Plateau, China. Water 2016, 8, 458. [Google Scholar] [CrossRef]
  5. Yao, W.; Xiao, P.; Shen, Z.; Wang, J.; Jiao, P. Analysis of the contribution of multiple factors to the recent decrease in load and sediment yield in the Yellow River basin, China. J. Geogr. Sci. 2016, 26, 1289–1304. [Google Scholar] [CrossRef]
  6. Milly, P.C.D.; Betancourt, J.; Falkenmark, M.; Hirsch, R.; Kundzewicz, Z.; Lettenmaier, D.; Stouffer, R. Stationarity is dead: Whither water management? Science 2008, 319, 573–574. [Google Scholar] [CrossRef]
  7. Jaramillo, F.; Destouni, G. Local flow regulation and irrigation raise global human water consumption and footprint. Science 2015, 350, 1248–1251. [Google Scholar] [CrossRef]
  8. Song, X.; Zhang, J.; Zhan, C.; Liu, C. Review for impacts of climate change and human activities on water cycle. J. Hydraul. Eng. 2013, 44, 779–790. (In Chinese) [Google Scholar] [CrossRef]
  9. Zhang, X.; Zheng, J.; Hao, Z. Climate change assessments for the main economic zones of China during recent decades. Prog. Geogr. 2020, 39, 1609–1618. (In Chinese) [Google Scholar] [CrossRef]
  10. Li, M.; Sun, H.; Su, Z. Research progress in dry/wet climate variation in Northwest China. Geogr. Res. 2021, 40, 1180–1194. (In Chinese) [Google Scholar] [CrossRef]
  11. Liu, C.; Wang, P.; Wen, T.; Yu, D.; Bai, W. Spatio-temporal characteristics of climate change in the Yellow River source area from 1960 to 2019. Arid Zone Res. 2021, 38, 293–302. (In Chinese) [Google Scholar] [CrossRef]
  12. Gu, C.; Mu, X.; Gao, P.; Sun, W.; Zhao, G. Characteristics of temporal variation in precipitation and temperature in the Loess Plateau from 1961 to 2014. J. Arid Land Resour. Environ. 2017, 31, 136–143. (In Chinese) [Google Scholar] [CrossRef]
  13. Ding, Y.; Liu, S.; Li, J.; Shangguan, D. The retreat of glaciers in response to recent climate warming in western China. Ann. Glaciol. 2006, 43, 97–105. [Google Scholar] [CrossRef] [Green Version]
  14. Kingsford, R.T. Ecological impacts of dams, water diversions and river management on floodplain wetlands in Australia. Austral Ecol. 2000, 25, 109–127. [Google Scholar] [CrossRef]
  15. Li, Z.; Liu, X.; Niu, T.; Kejia, D.; Zhou, Q.; Ma, T.; Gao, Y. Ecological restoration and its effects on a regional climate: The source region of the Yellow River, China. Environ. Sci. Technol. 2015, 49, 5897–5904. [Google Scholar] [CrossRef]
  16. Jiang, W.; Yuan, L.; Wang, W.; Cao, R.; Zhang, Y.; Shen, W. Spatio-temporal analysis of vegetation variation in the Yellow River Basin. Ecol. Indic. 2015, 51, 117–126. [Google Scholar] [CrossRef]
  17. Gao, P.; Mu, X.; Wang, F.; Li, R. Changes in streamflow and sediment discharge and the response to human activities in the middle reaches of the Yellow River. Hydrol. Earth Syst. Sci. 2011, 15, 1–10. [Google Scholar] [CrossRef] [Green Version]
  18. Mu, X.; Zhang, L.; Mcvicar, T.; Chille, B.; Gau, P. Analysis of the impact of conservation measures on stream flow regime in catchments of the Loess Plateau, China. Hydrol. Process. 2010, 21, 2124–2134. [Google Scholar] [CrossRef]
  19. Chen, P.; Shang, J.; Qian, B.; Jing, Q.; Liu, J. A New Regionalization Scheme for Effective Ecological Restoration on the Loess Plateau in China. Remote Sens. 2017, 9, 1323. [Google Scholar] [CrossRef] [Green Version]
  20. Mo, K.; Chen, Q.; Chen, C.; Zhang, J.; Wang, L.; Bao, Z. Spatiotemporal variation of correlation between vegetation cover and precipitation in an arid mountain-oasis river basin in northwest China. J. Hydrol. 2019, 574, 138–147. [Google Scholar] [CrossRef]
  21. Li, C.; Wang, J.; Hu, R.; Shan, Y.; Ayal, D. Relationship between vegetation change and extreme climate indices on the Inner Mongolia Plateau, China, from 1982 to 2013. Ecol. Indic. 2018, 89, 101–109. [Google Scholar] [CrossRef]
  22. Sun, W.; Song, X.; Mu, X.; Gao, P.; Wang, F.; Zhao, G. Spatiotemporal vegetation cover variations associated with climate change and ecological restoration in the Loess Plateau. Agric. For. Meteorol. 2015, 209–210, 87–99. [Google Scholar] [CrossRef]
  23. Chang, J.; Wang, Y.; Istanbulluoglu, E.; Bai, T.; Huang, Q.; Yang, D.; Huang, S. Impact of climate change and human activities on runoff in the Weihe River Basin, China. Quat. Int. 2015, 380, 169–179. [Google Scholar] [CrossRef]
  24. Wang, D.; Hejazi, M. Quantifying the relative contribution of the climate and direct human impacts on mean annual streamflow in the contiguous United States. Water Resour. Res. 2011, 47, W00J02. [Google Scholar] [CrossRef] [Green Version]
  25. Brown, A.E.; Lu, Z.; Mcmahon, T.A.; Western, A.W.; Vertessy, R.A. A review of paired catchment studies for determining changes in water yield resulting from alterations in vegetation. J. Hydrol. 2005, 310, 28–61. [Google Scholar] [CrossRef]
  26. Pike, J.G. The estimation of annual run-off from meteorological data in a tropical climate. J. Hydrol. 1964, 2, 116–123. [Google Scholar] [CrossRef]
  27. Yang, H.; Yang, D.; Lei, Z.; Sun, F. New analytical derivation of the mean annual water-energy balance equation. Water Resour. Res. 2008, 44, 893–897. [Google Scholar] [CrossRef]
  28. Zhou, G.; Wei, X.; Chen, X.; Zhou, P.; Liu, X.; Xiao, Y.; Sun, G.; Scott, D.; Zhou, S.; Han, L.; et al. Global pattern for the effect of climate and land cover on water yield. Nat. Commun. 2015, 6, 5918. [Google Scholar] [CrossRef] [Green Version]
  29. Zheng, H.; Zhang, L.; Zhu, R.; Liu, C.; Sato, Y.; Fukushima, Y. Responses of streamflow to climate and land surface change in the headwaters of the Yellow River basin. Water Resour. Res. 2009, 45, 641–648. [Google Scholar] [CrossRef]
  30. Liu, X.; Liu, C.; Luo, Y.; Zhang, M.; Xia, J. Dramatic decrease in streamflow from the headwater source in the central route of China’s water diversion project: Climatic variation or human influence? J. Geophys. Res. Atmos. 2012, 117, D06113. [Google Scholar] [CrossRef] [Green Version]
  31. Allen, R.G.; Pereira, L.S.; Raes, D.; Smith, M. Crop Evapotranspiration—Guidelines for Computing Crop Water Requirements; FAO Irrigation and Drainage Paper 56; FAO: Roma, Italy, 1998. [Google Scholar]
  32. Mann, H.B. Nonparametric test against trend. Econometrica 1945, 13, 245–259. [Google Scholar] [CrossRef]
  33. Kendall, M.G. Rank correlation methods. Brit. J. Psychol. 1990, 25, 86–91. [Google Scholar] [CrossRef]
  34. Budyko, M.I. Evaporation under Natural Conditions, Gidrometeoizdat, Leningrad 1948; English Translation byIsrael Program for Scientific Translations; IPST: Jerusalem, Israel, 1963. [Google Scholar]
  35. Patterson, L.A.; Lutz, B.; Doyle, M.W. Climate and direct human contributions to changes in mean annual streamflow in the South Atlantic, USA. Water Resour. Res. 2013, 49, 7278–7291. [Google Scholar] [CrossRef]
  36. Ren, Z.; Zhang, G.; Yang, Q. Characteristics of runoff and sediment variation in Yanhe River basin in last 50 years. J. China Hydrol. 2012, 32, 81–86. (In Chinese) [Google Scholar] [CrossRef]
  37. Li, C.; Wang, H.; Yu, F.; Yang, A.; Yan, D. Impact of soil and water conservation on runoff and sediment in Yanhe River Basin. Sci. Soil Water Conserv. 2011, 9, 1–8. (In Chinese) [Google Scholar] [CrossRef]
  38. Zhang, X.; Zhang, L.; Zhao, J.; Rustomji, P.; Hairsine, P. Responses of streamflow to changes in climate and land use/cover in the Loess Plateau, China. Water Resour. Res. 2008, 44, W00A07. [Google Scholar] [CrossRef]
  39. Gao, P.; Jiang, G.; Wei, Y.; Mu, X.; Wang, F.; Zhao, G.; Sun, W. Streamflow regimes of the Yanhe River under climate and land use change, Loess Plateau, China. Hydrol. Process. 2015, 29, 2402–2413. [Google Scholar] [CrossRef]
  40. Wang, Y.; Feng, Q. Characteristics of runoff and sediment transport during 1960–2010 and its response to Grain for Green Project in Yanhe River. Sci. Soil Water Conserv. 2017, 15, 1–7. (In Chinese) [Google Scholar] [CrossRef]
  41. Zhu, Z.; Piao, S.; Myneni, R.; Huang, M.; Zeng, Z.; Canadell, J.; Ciais, P.; Sitch, S.; Friedlingstein, P.; Arneth, A.; et al. Greening of the earth and its drivers. Nat. Clim. Change 2016, 6, 791–795. [Google Scholar] [CrossRef]
  42. Yang, D.; Shao, W.; Yeh, P.J.F.; Yang, H.; Kanae, S.; Oki, T. Impact of vegetation coverage on regional water balance in the nonhumid regions of China. Water Resour. Res. 2009, 45, 507–519. [Google Scholar] [CrossRef] [Green Version]
  43. Xia, Y.; Zhang, S.; Gao, W.; Zhang, H.; Guo, L. Influence of greening Loess Plateau on streamflow change in Yanhe River basin of the middle Yellow River, China. J. Earth Sci. Environ. 2020, 42, 849–860. (In Chinese) [Google Scholar] [CrossRef]
  44. Cao, S.; Chen, L.; Yu, X. Impact of China’s Grain for Green Project on the landscape of vulnerable arid and semi–arid agricultural regions: A case study in northern Shaanxi Province. J. Appl. Ecol. 2009, 46, 536–543. [Google Scholar] [CrossRef]
Figure 1. Location of the study area: (a) location of Yanhe River Basin on the Loess Plateau, (b) distribution of hydrological and weather stations.
Water 14 00495 g001
Figure 2. Analysis of runoff abrupt change: (a) MK mutation test, (b) double mass curves of precipitation-runoff.
Water 14 00495 g002
Figure 3. Evolution law of hydrological and meteorological elements: (a) runoff; (b) ET0; (c) precipitation.
Water 14 00495 g003
Figure 4. Characteristics of hydrological and meteorological elements during reference period and change period: (a) precipitation; (b) ET0; (c) runoff.
Water 14 00495 g004
Figure 5. Composition of land-use from 1985 to 2015: (a) 1985; (b) 1995; (c) 2000; (d) 2008; (e) 2015.
Water 14 00495 g005
Table 1. The variation coefficient of hydrological and meteorological elements in the past 50 years.
PeriodRunoffPrecipitationET0
1969–19790.3180.2170.024
1980–19890.2500.1980.032
1990–19990.2450.1840.038
2000–20090.3000.1770.038
2010–20190.4140.2530.028
1969–20190.3400.0740.222
Table 2. The elasticity of runoff regarding each factor in different periods.
PeriodnεPεET0εn
Reference period (PI, 1969–2000)1.8960.189–0.043–2.033
Change period (PII, 2001–2019)2.2440.133–0.033–1.339
Study period (1969–2019)2.0250.166–0.039–1.738
Table 3. Land-use transfer matrix from 1985 to 2015 (km2).
PeriodLand-UseFarmlandConstruction LandOther LandWoodlandGrasslandWaters
1985–1995Farmland2513.952.720.113.0433.951.33
Construction land0.122.18000.10.05
Other land002.5000
Woodland14.940.380498.6940.840.07
Grassland57.830.17018.932652.820.47
Waters0.23000.150.3215.78
1995–2000Farmland2359.474.050.5342.67177.912.42
Construction land2.0922.0800.40.790.09
Other land0.7501.750.010.090
Woodland24.930.330.01479.725.60.24
Grassland156.961.790.0447.722520.540.98
Waters1.750.150.030.130.7514.89
2000–2008Farmland1023.168.13075.281438.60.78
Construction land2.5625.3700.210.210.05
Other land0.130.172.06000
Woodland00.260570.3700
Grassland00.76002724.450.47
Waters0.80.8600.030.0216.91
2008–2015Farmland295.2351.6618.4485.96571.983.38
Construction land0.5430.70.150.433.620.11
Other land0.010.030.040.181.80
Woodland1.138.544.33437.39193.810.69
Grassland8.9568.2538.08753.173287.447.39
Waters0.1240.320.538.334.91
Table 4. Contribution of hydrological and meteorological elements to runoff change.
CPCET0Cnδ
Variation/mm0.461–0.542–8.536–0.203
Contribution/%–5.236.1596.782.30
Table 5. The change of parameter n and elasticity during the change period.
Periodnεn
2001–20092.271–1.398
2010–20192.224–1.215
Publisher’s Note: MDPI stays neutral with regard to jurisdictional claims in published maps and institutional affiliations.

