Article

Human-Induced Sharp Salinity Changes in the World’s Largest Hypersaline Lagoon Bay Sivash (Crimea) and Their Effects on the Ecosystem

by
Elena Anufriieva
1,*,
Elena Kolesnikova
1,
Tatiana Revkova
1,
Alexander Latushkin
1,2 and
Nickolai Shadrin
1
1
A.O. Kovalevsky Institute of Biology of the Southern Seas of RAS, 2 Nakhimov Ave., 299011 Sevastopol, Russia
2
Marine Hydrophysical Institute, Russian Academy of Sciences, 2 Kapitanskaya St., 299011 Sevastopol, Russia
*
Author to whom correspondence should be addressed.
Water 2022, 14(3), 403; https://doi.org/10.3390/w14030403
Submission received: 1 December 2021 / Revised: 18 January 2022 / Accepted: 27 January 2022 / Published: 28 January 2022
(This article belongs to the Special Issue Ecosystems of Inland Saline Waters)

Abstract

:
Lakes and lagoons play an important role worldwide, and salinity fluctuations significantly affect their ecosystems. Bay Sivash, the world’s largest hypersaline water body, underwent a sharp change in salinity, induced by the closing of the North Crimean Canal. To monitor a shift in the ecosystem, a study was carried out from 2014 to 2020 at 15 sites of the lagoon. Since the closure of the canal, the average salinity increased from 22 g L−1 (2013) to 94 g L−1 (2020). Suspended solids and dissolved organic matter also increased. When salinity increased above 50 g L−1, the number of taxa significantly decreased; this was a negative linear relation. The increase in salinity significantly changed the structure of zooplankton and benthos. The most dramatic changes occurred with the salinity increase from 25 to 70 g L−1. Chironomidae larvae numbers began to increase greatly in the ecosystem of the bay, and since 2014, they have rapidly increased their contribution to the abundance of benthos and plankton. The concentration of benthic–planktonic species increased in plankton, in particular, in Harpacticoida and Chironomidae. At salinity above 80–90 g L−1, nauplii and adult brine shrimp appeared to become abundant in plankton and benthos. The transit of the ecosystem to a new alternative state occurred.

1. Introduction

Among ongoing global changes, salinity modification in different water bodies is one of the most influential, affecting the structure, functioning, and dynamics of aquatic ecosystems [1,2,3,4]. This modification may have various causes (natural and anthropogenic) as well as different directions, either increasing or decreasing [5,6,7,8]. The same global change can lead to an increase in salinity in some water bodies and a decrease in others. For example, air temperatures increase, leading to an acceleration of melting of mountain glaciers, which causes a salinity decrease in lakes that are fed from these glaciers [6]; however, in other lakes, it may cause a salinity increase by increasing evaporation [2]. Anthropogenic influences also may strongly influence the salinity of water bodies, with a wide variety of ecosystems responding to them [9,10,11,12,13].
Each water body has individual abiotic and biological characteristics and differing external natural and anthropogenic factors, which result in each water body being unique. Understanding the effect of changes in salinity on an aquatic ecosystem requires a combination of knowledge of the uniqueness of the particular ecosystem, overlaid with known general patterns. To this end, data from salinity changes in a variety of water bodies should be accumulated to obtain general patterns. While there are some accumulated data on the response to fast or slow salinity changes on various aquatic systems, there is not sufficient collected data to use as a tool to understand, anticipate, and mitigate those changes, or enable the development of strategies for environmental management. As lakes and lagoons play an important role in different regions worldwide [14], attention should focus on the analysis of the effects of salinity changes on their ecosystems. Bay Sivash, the world’s largest hypersaline water body (Figure 1), underwent two sharp changes of salinity, induced by humans, with corresponding ecosystem shifts [12].
Before the construction of the North Crimean Canal (1963–1975), the semi-closed shallow lagoon was hypersaline (mean salinity of about 140 g L−1 reaching >200 g L−1 in the southern part) and highly productive. Due to scarcity of fresh water in Crimea (the largest peninsula in the Black Sea), the North Crimean Canal was constructed (total length of 465 km, 375 km in Crimea) to supply water from the River Dnieper into Crimea. This started the development of irrigated agriculture on 4000 km2 of land, and drainage water from that area began discharging mostly into Bay Sivash. In 1985, 521 million m3 and 109 million m3 of drainage waters were discharged from the territories of Crimea and the Kherson region, respectively [12]. As a result, after the start of the operation of the North Crimean Canal, a decrease in salinity began in the Sivash, which continued in various areas until 1997; the average salinity decreased from 141.00 g L−1 (data from 1955) to 22.60 g L−1 in 1989, and to a minimum value of 17.00 g L−1 in 1997–2009 [15]. The Sivash ecosystem gradually transformed into a new ecosystem of brackish waters [12,16,17,18]. The transformation of the ecosystem was accompanied by the appearance of large populations of commercial fish in the bay, that came from the Sea of Azov, due to which, fishing began to intensively develop in the bay. Due to political reasons, the Ukrainian government decided to stop the supply of Dnieper water via the North Crimean Canal, and did so in April 2014. The discharge of freshwater to the lagoon almost stopped, and salinity started to increase gradually, resulting in a new ecosystem shift. To monitor this shift, a comprehensive study was carried out from 2014 until 2020. Partial results which were obtained before June 2018, and were analyzed and published previously [4,12,18,19,20].
The proposed goals of this work are the following: (1) to present new unpublished data obtained from 2016 (June) to 2020 (December), summarize, and analyze all these data; (2) find the general patterns in the different occurred changes (means and ranges) and the correlation between them; (3) prove or disprove the assumption that salinity itself can be a good predictor of ecosystem shift character.

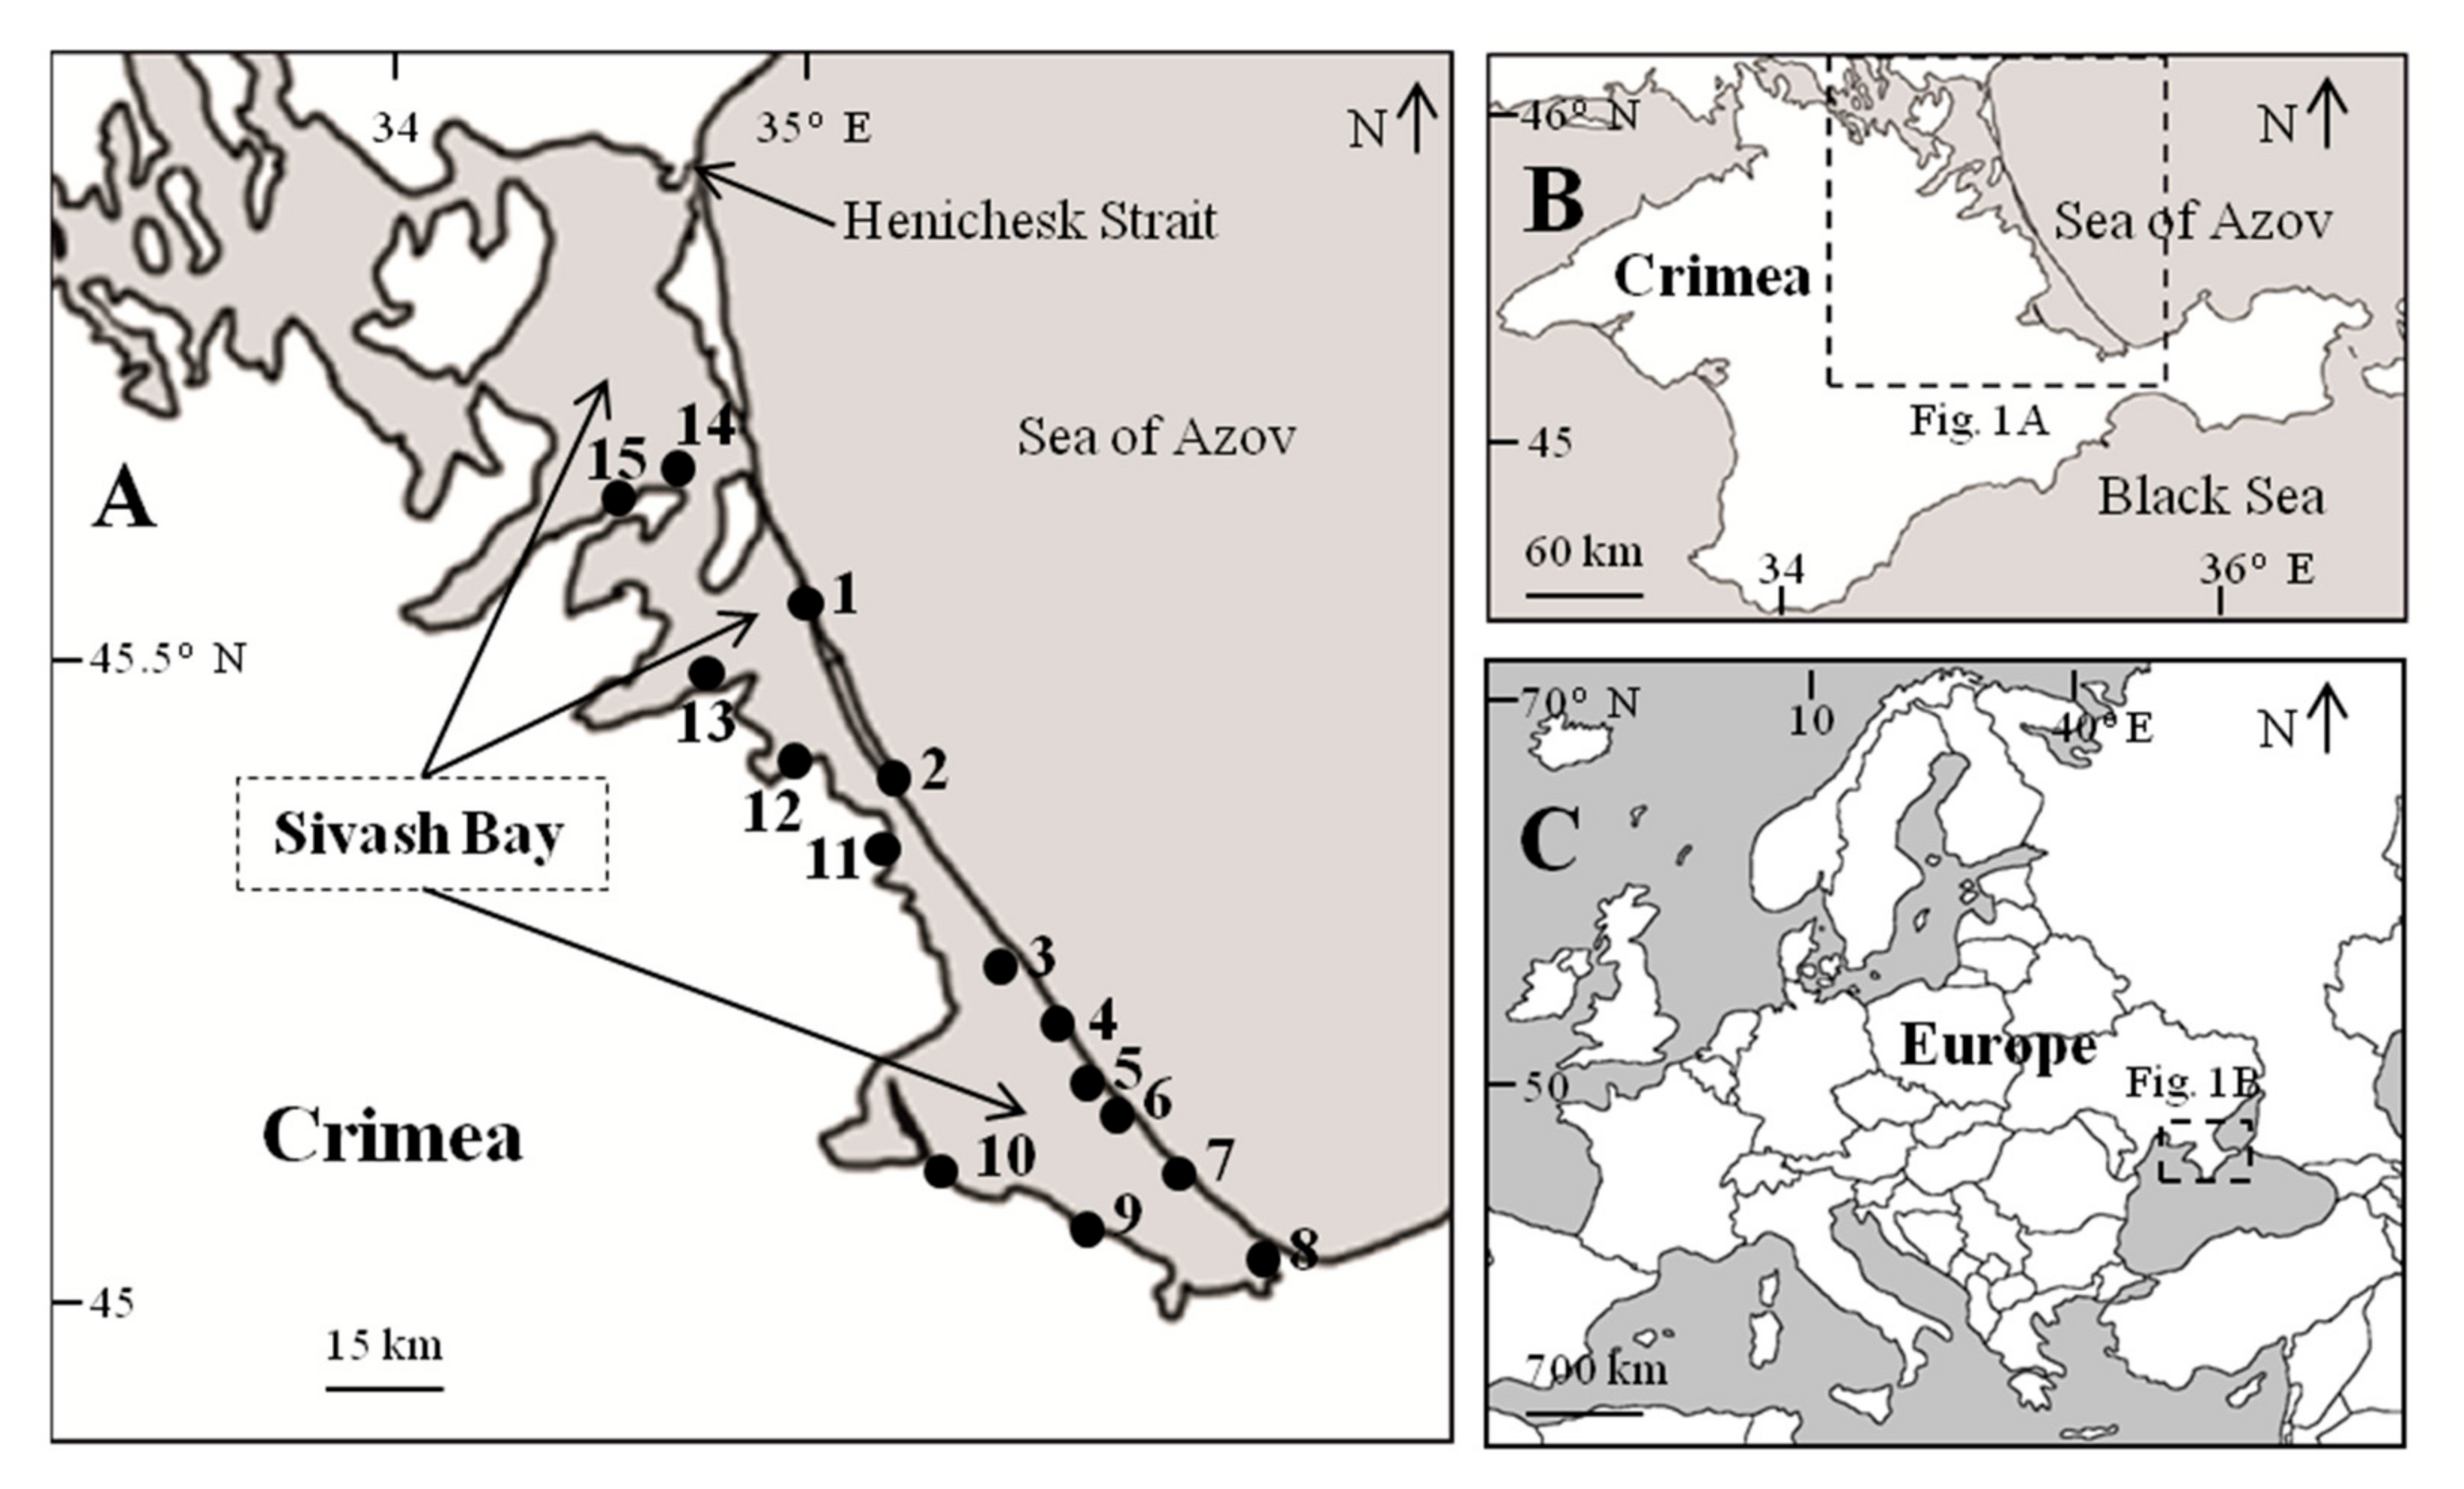
2. Materials and Methods

Bay Sivash (from 45°17′ to 46°12′ N, from 34°30′ to 35°28′ E) is separated from the Sea of Azov by the sandy narrow Arabat Spit (from 270 m to 8 km in width, length 112 km) and occupies an area of around 2560 km2 (Figure 1). To the north, the narrow Henichesk Strait connects the lagoon with the sea; it has been described previously in several papers [4,12,18,20]. It is a shallow water body with a depth of 0.1 to 2.5 m. Few small rivers enter the lagoon, and no river drains the water from it. The water balance in the lagoon before 2014 was mainly determined by the water from the North Crimean canal, precipitation, exchange with the Sea of Azov, and evaporation. Flowing freshwater from the North Crimean canal was 10 times more than that from all the small rivers. The volume of water from the small rivers was approximately 15 times lower than average annual precipitation. Before the canal construction, floating mats of the filamentous green alga Cladophora siwaschensis C. Meyer occupied huge areas in the bay (Figure 2c). Currently, floating mats have formed again, occupying a large area and reaching high biomass (up to 2.5–3.0 kg m−2 in wet weight). In these mats, there is an abundance of animals of different taxa. Hypoxic and even anoxic conditions often exist below these floating mats. After construction of the canal, changes in Bay Sivash were accompanied by shifts on its shores, where large areas were occupied by belts of the common reed, which, in some places, reached 100 meters wide. With the salinity increase, the common reed began to die, and its belt width decreased significantly (Figure 2d).
Data used in this paper were collected during eight expeditions to Sivash in the period from June 2016 to December 2020; sampling sites and their coordinates are given in Figure 1 and Table 1. The methods used were the same as in previous works [4,12,18,20]. The soft-bottom samples were collected by benthic tubes (diameter of 5 cm) in duplicate at depths of 0.2–0.6 m. Quantitative zooplankton samples were taken by filtration of 100–150 L of water through a plankton net with a mesh size of 110 μm. All samples were fixed by 4% formaldehyde. Samples were processed in a Bogorov chamber with binocular MBS-9, Olympus SZ61TR.
The concentration of total suspended solids (TSS), as well as dissolved organic matter (DOM), was measured with the hydrobiophysical multiparametric complex ‘Condor’ (made by Akvastandart-Yug, Sevastopol, Russia, http://ecodevice.com.ru/ecodevice-catalogue/multiturbidimeter-kondor, accessed date 1 December 2021). Salinity and temperature were also determined by manual refractometer Kellong WZ212 and an electronic thermometer PHH-830, respectively.
All data were subject to standard statistical treatments: mean values, the regression equation parameters, coefficients of variation (CV), correlation (R), and determination (R2). These were calculated in the standard programs MS Excel 2007 and STATISTICA 6.0. The confidence level of correlation coefficients (p) was also evaluated [21].

3. Results

3.1. Abiotic Parameters

Average values and indices of their variability of the studied parameters in different periods of observation are given in Table 2.
The average salinity and the range of its spatial differences constantly increased during the study. At the northernmost point close to the strait connecting the lagoon with the sea, salinity did not change significantly, for example, in December 2020, it ranged from 30 to 41 g L−1. At the southernmost point, salinity varied significantly from 82 to 112 g L−1 during the same period. The direction and speed of wind could modify salinity distribution, given the general tendency for salinity to increase from north to south. The TSS concentration showed a large spatial heterogeneity, which was even higher during the period of strong autumn–winter winds. In the summer months, a significant correlation (p < 0.01) was noted between TSS and salinity, for example, in May 2018, the relationship had the following form (R = 0.913, p = 0.0005):
TSS = 0.0009 S2.273,
where: TSS—total suspended solids, mg L−1; S—salinity, g L−1.
A similar significant dependence was noted in other summer periods, for example in June 2019 (Figure 3). In the autumn–winter period, this dependence was not so pronounced, and the main influence on the distribution of suspended matter was exerted by winds. As an example, there was a northeast wind during sampling in November 2018 influencing TSS spatial distribution in the bay. TSS and DOM concentrations were significantly (p = 0.001) lower near the windward shore than near the leeward shore. TSS concentrations were on average 22.2 mg L−1 (CV = 1.085) near the windward shore and only 5.7 mg L−1 (CV = 0.660) opposite, and for DOM were 13.95 mg L−1 (CV = 1.011) and 4.66 mg L−1 (CV = 0.324), respectively. The heterogeneity of the spatial distribution of DOM was less pronounced than the TSS; however, significant positive dependence on salinity was also noted, which was seen, for example, in June 2019 (Figure 3). There was a close positive correlation in the spatial distribution between DOM and TSS in all observation periods. For example, in June 2019, it looked like the following (R = 0.922, p = 0.0005):
DOM = 0.527 TSS + 0.693,
where DOM and TSS are measured in mg L−1.
The data showed the existence of a general trend of increasing DOM concentration from spring to autumn, and a slight increase in DOM from 2018 to 2020.

3.2. Zooplankton

Generalized data on changes in the zooplankton structure are given in Table 3. During the period under consideration, there were significant changes in the taxonomic structure of zooplankton. In June 2016, Copepoda (Acartia (Acartiura) margalefi Alcaraz, 1976) still dominated in numbers, accounting for 86% of the abundance of zooplankton.
In June and November 2018, copepods accounted for only 7% and 2% of the total zooplankton abundance, respectively. In later samples, their contribution to the total number did not even reach 1%. In the period from 2018 to 2020, Artemia sp. (Anostraca) or Harpacticoida dominated. At the same time, during this period, the macro-taxonomic diversity of plankton decreased. At a salinity of up to 90 g L−1, representatives of 7 classes of animals were present in plankton; from 70 to 112 g L−1, 6 classes were represented, and at a salinity of 138 g L−1, only 3 classes. In the period from June 2016 to September 2020, the total abundance of zooplankton increased, which can be approximated as follows (R = 0.862, p = 0.005):
Nt = 128 t + 810,
where: Nt—where the average total number of zooplankton at the time of sampling, ind. m−3; t—the number of months since the beginning of the study (June 2016 was taken as first month).
Between September and December 2020, the total number of zooplankton decreased by 4 times, which was probably due to winter conditions. If the mid-winter point (December 2020) is excluded, then a significant relationship is revealed between the total abundance of zooplankton and salinity (R = 0.893, p = 0.005), as follows:
Nt = 170 S − 8721,
where: Nt—where the average total number of zooplankton at the time of sampling, ind. m−3; S—salinity, g L−1.
In each of the study periods, in the spatial aspect, the total abundance of zooplankton, and its constituent groups did not unambiguously depend on salinity, TSS, and DOM. However, in all periods of the study, the maximum total abundance was found in the salinity range from 80 to 110 g L−1. This was because the number of active stages of Artemia sharply increased at salinity above 75–80 g L−1. For example, in July 2020, in the salinity range from 41 to 86 g L−1, the average number of active stages of Artemia was 238 ind. m−3 (SD = 384, CV = 1.612), and in the salinity range from 90 to 128 g L−1 was 75,271 ind. m−3 (SD = 82,637, CV = 1.098). The differences are significant (p = 0.001). Winds, especially in the autumn–winter period, had a significant impact on the distribution of zooplankton, this effect was not the same for its components. In November 2018, as an example, average Artemia cyst abundance was significantly higher near the leeward shore (by 73 times) than near the windward shore (p = 0.0001). Artemia nauplii on average were also significantly (p = 0.05) more abundant (by 2.8 times) near the leeward shore than near the opposite shore. Another trend was found for adult Artemia, when more females and males were observed near the windward shore (average 718 and 1700 ind. m−3, respectively) than near the leeward shore (553 and 493 ind. m−3, respectively). Cyst abundance did not correlate with salinity near the windward shore, and there was a positive significant correlation near the leeward shore (R = 0.982; p = 0.001), as follows:
Nc = 2.203 e0.201 S,
where: Nc—the number of cysts, S—salinity, g L−1.

3.3. Zoobenthos

The variability in the composition of macrotaxa in zoobenthos is presented in Table 4. Macro-taxonomic diversity in the benthos from May to November 2018 increased from 11 to 16 taxa, and then gradually decreased to 10 (December 2020).
There is a significant correlation between the total number of animal and protist macrotaxa and salinity in the period from November 2018 to December 2020 (R = 0.982, p = 0.005):
Kb = 34.9 − 0.26 S,
where: Kb—the total number of animal and protist macrotaxa; S—salinity, g L−1.
The total abundance of zoobenthos increased in the period from May 2018 to June 2019 and then began to gradually decrease. The temporal dependence of the average abundance on salinity was bell-shaped rather than linear. At the same time, the maximum abundance was observed in the salinity range from 70 to 80 g L−1. Table 4 also shows the maximum salinities at which different taxa were encountered. The total abundance of zoobenthos is negatively statistically significantly related to salinity and TSS, for example in June 2019 (Figure 4). The abundance of individual groups of animals did not correlate with salinity. Changes in different groups did not correlate with each other. Of macrobenthos organisms at salinity above 40–60 g L−1, only larvae of Chironomidae (Baeotendipes noctivagus (Kieffer, 1911)) were usually present, the share of which, in the total abundance, in some samples exceeded 80%, averaging in the lagoon from 7.5 to 29% for different observation periods. A linear relationship between the number of larvae and salinity was not observed, but the maximum proportion of larvae in the total number of zoobenthos usually was within the salinity range from 80 to 120 g L−1. Taking into account the fact that chironomid pupae were massively present in plankton only in May, this was the time when the adults emerge. At the beginning of summer, the number of chironomid larvae in the benthos is significantly higher than in November–December. Occasionally, a high abundance of other macrobenthos organisms Gastropoda (Hydrobia acuta (Draparnaud, 1805)), Amphipoda (Gammarus aequicauda (Martynov, 1931)), and Polychaeta (Protodrilius sp., Polydora cornuta Bosc, 1802,) were observed in single sites, and Oligochaeta were found only once in high numbers (Table 4).
During the days with a strong northeasterly wind (November 2018), zoobenthos average abundance near the leeward and windward coasts were 106,345 ind. m−2 (CV = 0.956) and 167,979 ind. m−2 (CV = 0.524), respectively. Abundance was higher near the windward shore at 1.7 times. A similar trend was observed also separately for Chironomidae and Harpacticoida. In Gastropoda, in November 2018, the average abundance was 1010 ind. m−2 (CV = 1.126) and 2706 ind. m−2 (CV = 1.545) near windward and leeward shores, respectively.

3.4. Zooplankton vs. Zoobenthos

As the comparison of Table 3 and Table 4 showed, the most common species of different taxa cannot be classified as purely planktonic or benthic species, since they made a significant contribution to both zooplankton and zoobenthos. The trend where the total number of zooplankton and zoobenthos organisms decreased with increasing salinity was not statistically significant. The ratio of the total abundance of zooplankton and zoobenthos (abundance of zoobenthos/abundance of zooplankton) significantly changed in the bay with an increase in the proportion of zooplankton in the total abundance; the changes that took place can be described (R = 0.903, p = 0.01) as follows:
Nb/Nz = 197.7 Ln (t) + 589.9,
where: Nb/Nz—an abundance of zoobenthos/an abundance of zooplankton; t—the number of months since the beginning of the study (June 2016 was taken as the first month).
Harpacticoida, as a rule, were simultaneously present in plankton and benthos, but their planktonic share in the total abundance significantly increased with increasing salinity, as, for example, in June 2019 (Figure 5). This dependence can be described (R = 0.780, p = 0.025) as follows:
Y = 0.0002 e0.109 S,
where: Y—the proportion of planktonic Harpacticoida in their total plankton and benthos abundance; S—the salinity, g L−1.
Other factors can significantly modify this dependence; therefore, it did not manifest itself as clearly in all periods as in July 2019. A similar trend was noted for the larvae of Chironomidae, but it is not significant. The observations indicate that the bottom oxygen deficiency significantly affected the distribution of larvae between plankton and benthos. Strong winds had a significant impact on the distribution of the total pool of animals in the bay between plankton and the bottom. For example, in November 2018, near the leeward coast, on average, 28% (CV = 1.399) of all recorded animals and protists were found in plankton, and only 7% near the windward coast (CV = 0.883).
The analyses of Table 3 and Table 4 showed (Figure 6) that there is a significant negative dependence of the number of classes of animals in plankton and/or benthos on the maximum salinity at which they were found in the lagoon (R = 0.969, p = 0.001), as follows:
Ks = 15.40 − 0.08 S,
where: Ks—the number of animal classes in Bay Sivash, S—the salinity, g L−1.

4. Discussion

The use of new and published data [12,18,19,20] showed that since the closure of the North Crimean Canal, salinity, TSS, and DOM increased in Bay Sivash (Figure 7). As was shown before, the content of TSS positively correlates with salinity in different water bodies of Crimea [12,22] and different regions [23,24,25,26,27]. There are different reasons for the observed correlation of increases in salinity, TSS, and DOM, and the main one in Bay Sivash may be a positive correlation between liquid density with salinity that resulted in a lower sedimentation rate of single-sized particles [12]. Additionally, the disappearance of reed beds may be responsible for increasing the mineral particle flow into the bay [12]. Dramatically decreased reed beds of P. australis do not prevent erosion of small clay cliffs on the western coast of the lagoon now. Currently, muddy water stains near those cliffs have been observed regularly [4]. Accelerated cliff erosion may also contribute to the TSS increase in the Bay Sivash. The increase in DOM concentration can probably be explained by the TSS increase and/or the addition to primary production due to the development of floating mats of filamentous green algae Cladophora [4,12,19]. The intensive development of Cladophora in hypersaline water bodies can increase their primary production by more than 10 times [3,28]. In November 2018, the abundance of benthic microalgae related positively to an increase in salinity and TSS [19]. Another reason for an increase in DOM is the increased release of exopolymers by algae into the water. Under increased salinity, a larger amount of primary production is excreted into the environment as exo-metabolites [29,30,31,32].
However, changes in the bay environment caused by an increase in salinity are not limited to changes in the concentration of TSS and DOM. A cascade of interrelated changes in the physical and chemical parameters of the environment was initiated. For example, the heat capacity of a solution decreases linearly with increasing salinity [12]. With a decrease in heat capacity, the temperature regime changes, in particular, less heat is required to heat a unit volume of water per 1 °C. Consequently, the same amount of solar radiation heating the water in the bay will increase more saline water to a higher temperature. The calculation, according to the known formula [12], showed it can heat water in the lagoon up by 2–5 °C more than in the period before the closure of the North Crimean channel. A wider range of daily temperature fluctuations now occur. This effect of a salinity increase on the water temperature was observed previously in the Dead Sea and hypersaline lakes of Crimea and India [12,33]. The solubility of oxygen in water exponentially decreases with a salinity increase [12,34]. A temperature increase acts the same way. Currently, in different seasons and different parts of the bay, according to calculations, the oxygen concentration should be 20–50% lower than before the start of the salinity increase. An increase in salinity, as well as changes in other physical and chemical parameters, shift the geochemical background of the lagoon ecosystem, including the solubility of various salts, as well as direction and character of some reactions [35,36,37,38]. All this may often increase the concentration of toxic substances adding more extremality to the environment.
With an increase in salinity in the lagoon, the massive development of floating mats of green filamentous algae of Cladophora began, which was also shown for other Crimean hypersaline water bodies with a significant increase in their total primary productivity [3,28]. This often led to the formation of hypoxic and anoxic conditions at the bottom, which often led to a decrease (to zero) in the diversity and number of benthic animals [4,12]. At the same time, Cladophora filaments are intensively overgrown with various microalgae, seen also in Bay Sivash [19,32], significantly improving the food supply of animals and leading to an increase in their total number. Normally, benthic animals move to live in the Cladophora floating mats [4,12].
The decrease in the number of taxa of different levels with an increase in salinity above 50 g L−1 is a well-known phenomenon, and the dependence at the global level has been quantitatively characterized [39]. Using the data of that article, the authors calculated the following equation (R = 0.987, p = 0.001):
Kg = 25.01 − 0.07 S,
where: Kg—the number of animal classes at the global level; S—the salinity, g L−1.
Calculated Equations (9) and (10) showed that, despite a much larger number of classes at all salinities at the global level, the general trend is the same in both cases. In the case of Bay Sivash, the number of classes decreased with an increase in salinity from 50 to 150 g L−1 by 3.6 times, and at the global level, with the same rise in salinity, the number of animal classes decreases 1.5 times.
As new data and the previously published articles cited above show, with an increase in the salinity of the environment in Bay Sivash significant changes in the structure of zooplankton and benthos occurred, similar to those observed in similar situations in different water bodies of Crimea and other regions [3,28,40,41]. Summarizing all the available information on these changes, the following generalized trends can be distinguished:
(1) In Bay Sivash, the most dramatic changes occurred with an increase in salinity in the range from 25 to about 70 g L−1, i.e., in the period from 2014 to 2017. The same can be said about other similar well-known cases;
(2) Changes in different taxa occurred unevenly, although a general tendency towards a decrease in taxonomic diversity was present in all of them;
(3) With an increase in salinity, the proportion of calanoid copepods in the total abundance of zooplankton decreased—they practically disappeared from plankton at salinity above 80–100 g L−1;
(4) At salinity above about 50–60 g L−1, Chironomidae larvae began to massively develop in the ecosystem of the bay, and since 2014, they have rapidly increased their contribution to the abundance of both benthos and plankton. Their larvae are actively consumed by both fish and invertebrates, for example, amphipods [42]. Therefore, it can be confidently assumed that at lower salinities, when there are many predators, they are quickly consumed;
(5) The concentration of benthic–planktonic species increases in plankton, in particular, Harpacticoida and Chironomidae;
(6) At salinity above 80–90 g L−1, nauplii and adult brine shrimp appeared and became abundant in plankton and benthos. Below this salinity, fish, amphipods, and ostracods are usually present in water bodies, which eat up all brine shrimp at the naupliar stage [43]. At higher salinity, as in our case, brine shrimp begin to dominate in plankton. It should be noted that the appearance and dominance of Artemia in water bodies leads to a significant restructuring of intra-ecosystem relationships [40,44]. In particular, the concentration of phytoplankton sharply decreases, and the transparency of the water increases significantly. This may be one of the factors responsible for the high concentrations of benthic microalgae in Bay Sivash [19]. It is interesting to note that when salinity in reservoirs begins to decrease, brine shrimp persist in plankton approximately down to a salinity of 50–55 g L−1, and when salinity begins to increase in reservoirs, adult brine shrimp appear at salinity above 80 g L−1 [40,45]. This covers the hysteresis effect, which is common for system oscillations between alternative states [45,46];
(7) The variability of different taxa were practically not correlated with each other. There was also no clear relationship between changes in plankton and benthos;
(8) The correlation between changes in abundance of different taxa and variations in environmental factors, if they were observed in some cases, was very weak. In the salinity range from 40–50 g L−1 to about 120–140 g L−1, a significant role in the dynamics of zooplankton was probably played not by salinity itself, but by a complex of all interacting factors. In this interaction, an important role is played by unaccounted factors, internal and external, such as the strength and direction of the wind, the precipitation regime, and the drift of water masses from the Sea of Azov. This is typical for similar lagoons and lakes [47,48,49,50]. An equally important role is played by the factor of chance, which, for example, may be associated with the feeding of birds that have arrived episodically in the lagoon or extreme climatic events. The important role of the factor of chance in the dynamics of the biotic structure of ecosystems is now widely recognized [51,52,53].
The general conclusion following from all this is that salinity by itself is not a reliable predictor of possible ecosystem changes in the range from about 25 to 120–140 g L−1. Salinity becomes a hard environmental filter for the existence of certain animal species at its value above 120–140 g L−1 [54]. Consequently, the ecosystem outcomes of anthropogenically induced changes of salinity in saline water bodies are poorly predictable and should therefore be avoided. The transit of ecosystems to new alternative states is always uncertain [55], and new data confirm this conclusion. That is why it is difficult to adapt the management of the external environment to such shifts in ecosystems [8].
A comparison can be made between the rates and ranges of salinity changes in two periods when it decreased after the canal was built and when it increased after the closure of the canal. When the canal was built, salinity decreased from 140 to 17–25 g L−1, i.e., approximately by 7 times in 40 years [15], and when the canal was closed, it increased from 22 to 94 g L−1, i.e., about by 4 times over 6 years. The calculation showed that the relative rate of change (g L−1 year−1) during the period of salinity decline was about 6 times less than during the period of increase. Drainage water from the canal led to a significant decrease in salinity also in the hypersaline lake Kyzyl-Yar, where the period of salinity decline in the lake lasted 30 years [45]. At the same time, the mineralization of water in the bottom deposits declined significantly slower and did not finish after 45 years. This fact showed that the speed of salinity changes in saline water bodies is determined not only by water budget but also by features of the bottom sediments as one of the aquatic ecosystem components.
Transformations occurred two times—not only in the lagoon, but also in surrounding territory and the avifauna. During the first shift, reed vegetation had occupied large areas, which stabilized the higher water level in the lagoon with reducing its seasonal fluctuations, and the bird composition changed [12]. Ciconiiformes birds, which were absent in the hypersaline stage, became common in the Bay Sivash area [56]. In 2014–2018, after the canal closing, the total diversity and abundance of visually observe birds decreased. In 2020–2021, after increasing Artemia and chironomid larvae abundance, bird presence increased, and new species were present. The most interesting case is Phoenicopterus roseus Pallas, 1811, which started to nest in Bay Sivash in 2017 [57]. Adult and young greater flamingo Ph. roseus were observed in Bay Sivash on 29 September 2021 (Figure 8) (photo by G. Prokopov). As is known, flamingos prefer to use such hypersaline water bodies with a similar set of invertebrates in various regions, in particular, in South America [58,59,60]. The introduction of flamingos into Bay Sivash can lead to a new round of ecosystem changes as was previously noted in other water bodies [61]. To conserve the biodiversity of the unique hypersaline lagoon and birds, further monitoring of changes in its ecosystem is required.

Author Contributions

Conceptualization, N.S.; methodology, N.S. and E.A.; field investigation and sampling, N.S., E.A. and A.L.; sample processing, species identification, E.A., E.K. and T.R.; data formal analysis, N.S. and E.A.; writing—original draft preparation, N.S.; writing—review and editing, N.S., E.A., E.K., T.R. and A.L.; supervision, E.A.; project administration, E.A.; funding acquisition, E.A. All authors have read and agreed to the published version of the manuscript.

Funding

Sample processing, species identification, data analysis, and manuscript writing was supported by the Russian Science Foundation, grant number 18-16-00001; the part concerning the long-term study of the lagoon environment was conducted in the framework by the state assignment of A.O. Kovalevsky Institute of Biology of the Southern Seas of RAS, number 121041500203-3; TSS and DOM measurements were conducted in the framework by the state assignment of Marine Hydrophysical Institute of RAS, number 0555-2021-0003.

Institutional Review Board Statement

Not applicable.

Informed Consent Statement

Not applicable.

Data Availability Statement

All data used in this study are available upon request from the corresponding author.

Acknowledgments

The authors are grateful to all who help us in field studies as well as Ludmila Lukianova for technical assistance in sample processing, and Bindy Datson for her selfless work in improving the English of the manuscript.

Conflicts of Interest

The authors declare no conflict of interest.

References

  1. Hart, B.T.; Lake, P.S.; Webb, J.A.; Grace, M.R. Ecological risk to aquatic systems from salinity increases. Aust. J. Bot. 2003, 51, 689–702. [Google Scholar] [CrossRef]
  2. Lin, Q.; Xu, L.; Hou, J.; Liu, Z.; Jeppesen, E.; Han, B.P. Responses of trophic structure and zooplankton community to salinity and temperature in Tibetan lakes: Implication for the effect of climate warming. Water Res. 2017, 124, 618–629. [Google Scholar] [CrossRef] [PubMed]
  3. Golubkov, S.M.; Shadrin, N.V.; Golubkov, M.S.; Balushkina, E.V.; Litvinchuk, L.F. Food chains and their dynamics in ecosystems of shallow lakes with different water salinities. Russ. J. Ecol. 2018, 49, 442–448. [Google Scholar] [CrossRef]
  4. Shadrin, N.; Kolesnikova, E.; Revkova, T.; Latushkin, A.; Dyakov, C.; Anufriieva, E. Macrostructure of benthos along a salinity gradient: The case of Sivash Bay (the Sea of Azov), the largest hypersaline lagoon worldwide. J. Sea Res. 2019, 154, 101811. [Google Scholar] [CrossRef]
  5. Royer, T.C.; Grosch, C.E. Ocean warming and freshening in the northern Gulf of Alaska. Geophys. Res. Lett. 2006, 33, L16605. [Google Scholar] [CrossRef] [Green Version]
  6. Mao, D.; Wang, Z.; Yang, H.; Li, H.; Thompson, J.R.; Li, L.; Song, K.; Chen, B.; Gao, H.; Wu, J. Impacts of climate change on Tibetan lakes: Patterns and processes. Remote Sens. 2018, 10, 358. [Google Scholar] [CrossRef] [Green Version]
  7. Regan, H.C.; Holland, P.R.; Meredith, M.P.; Pike, J. Sources, variability and fate of freshwater in the Bellingshausen Sea, Antarctica. Deep Sea Res. Part I Oceanogr. Res. Pap. 2018, 133, 59–71. [Google Scholar] [CrossRef]
  8. Shadrin, N.V.; Simonov, V.G.; Anufriieva, E.V.; Popovichev, V.N.; Sirotina, N.O. Anthropogenic transformation of Kyzyl-Yar Lake in Crimea: Multiyear research findings. Arid Ecosyst. 2018, 8, 299–306. [Google Scholar] [CrossRef]
  9. Al-Dousari, A.E. Desalination leading to salinity variations in Kuwait marine waters. Am. J. Environ. Sci. 2009, 5, 451. [Google Scholar] [CrossRef] [Green Version]
  10. Dugan, H.A.; Bartlett, S.L.; Burke, S.M.; Doubek, J.P.; Krivak-Tetley, F.E.; Skaff, N.K.; Summers, J.C.; Farrell, K.J.; McCullough, I.M.; Morales-Williams, A.M.; et al. Salting our freshwater lakes. Proc. Natl Acad. Sci. USA 2017, 114, 4453–4458. [Google Scholar] [CrossRef] [Green Version]
  11. Kaushal, S.S.; Likens, G.E.; Pace, M.L.; Utz, R.M.; Haq, S.; Gorman, J.; Grese, M. Freshwater salinization syndrome on a continental scale. Proc. Natl. Acad. Sci. USA 2018, 115, E574–E583. [Google Scholar] [CrossRef] [PubMed] [Green Version]
  12. Shadrin, N.V.; Anufriieva, E.V.; Kipriyanova, L.M.; Kolesnikova, E.A.; Latushkin, A.A.; Romanov, R.E.; Sergeeva, N.G. The political decision caused the drastic ecosystem shift of the Sivash Bay (the Sea of Azov). Quat. Int. 2018, 475, 4–10. [Google Scholar] [CrossRef]
  13. Sharifinia, M.; Afshari Bahmanbeigloo, Z.; Smith, W.O., Jr.; Yap, C.K.; Keshavarzifard, M. Prevention is better than cure: Persian Gulf biodiversity vulnerability to the impacts of desalination plants. Glob. Chang. Biol. 2019, 25, 4022–4033. [Google Scholar] [CrossRef] [PubMed]
  14. Kjerfve, B. Coastal Lagoon Processes; Elsevier Science Publisher: Amsterdam, The Netherlands, 1994; 577p. [Google Scholar]
  15. Dyakov, N.N.; Belogudov, A.A.; Timoshenko, T.Y. Assessment of the components in the water balance of Bay Sivash Bay. Ecol. Saf. Coast. Shelf Zones Complex Manag. Shelf Res. 2013, 27, 439–445. (In Russian). [Google Scholar]
  16. Getmanenko, V.A.; Yanovsky, Y.G.; Grout, G.G. Impact of semi-mechanical trawling on the zoobenthos of the eastern Sivash (Azov Sea). Hydrobiol. J. 1996, 32, 54–60. (In Russian). [Google Scholar]
  17. Zagorodnyaya, Y.A. The taxonomic composition and quantitative characteristics of zooplankton in the eastern part of Gulf Sivash during summer 2004. Ecosyst. Res. Azov Sea Black Sea Casp. Sea 2006, 8, 103–114. (In Russian). [Google Scholar]
  18. Anufriieva, E.; Shadrin, N. The long-term changes in plankton composition: Is Bay Sivash transforming back into one of the world’s largest habitats of Artemia sp. (Crustacea, Anostraca)? Aquac. Res. 2020, 51, 341–350. [Google Scholar] [CrossRef]
  19. Shadrin, N.; Balycheva, D.; Anufriieva, E. Microphytobenthos in the hypersaline water bodies, the case of Bay Sivash (Crimea): Is salinity the main determinant of species composition? Water 2021, 13, 1542. [Google Scholar] [CrossRef]
  20. Sergeeva, N.G.; Shadrin, N.V.; Anufriieva, E.V. Long-term changes (1979–2015) in the nematode fauna in Sivash Bay (Sea of Azov), Russia, worldwide the largest hypersaline lagoon, during salinity transformations. Nematology 2019, 21, 337–347. [Google Scholar] [CrossRef]
  21. Müller, P.H.; Neuman, P.; Storm, R. Tafeln der Mathematischen Statistic; VEB Fachbuchverlag: Leipzig, Germany, 1979; 272p. [Google Scholar]
  22. Boulion, V.V.; Anokhin, L.E.; Arakelova, E.U. Primary production of the hypehaline lakes in Crimea. Trudy Zool. Inst. 1989, 205, 14–25. (In Russian). [Google Scholar]
  23. López-González, P.J.; Guerrero, F.; Castro, M.C. Seasonal fluctuations in the plankton community in a hypersaline temporary lake (Honda, southern Spain). Int. J. Salt Lake Res. 1997, 6, 353–371. [Google Scholar] [CrossRef]
  24. Schallenberg, M.; Burns, C.W. A temperate, tidal lake-wetland complex 2. Water quality and implications for zooplankton community structure. N. Z. J. Mar. Freshw. Res. 2003, 37, 429–447. [Google Scholar] [CrossRef]
  25. Abdo, M.H. Physico-chemical characteristics of Abu Za’baal ponds, Egypt. Egypt. J. Aquat. Res. 2005, 31, 1–15. [Google Scholar]
  26. Elloumi, J.; Carrias, J.F.; Ayadi, H.; Sime-Ngando, T.; Boukhris, M.; Bouaïn, A. Composition and distribution of planktonic ciliates from ponds of different salinity in the solar saltwork of Sfax, Tunisia. Estuar. Coast. Shelf Sci. 2006, 67, 21–29. [Google Scholar] [CrossRef]
  27. Telesh, I.V.; Khlebovich, V.V. Principal processes within the estuarine salinity gradient: A review. Mar. Pollut. Bull. 2010, 61, 149–155. [Google Scholar] [CrossRef]
  28. Ivanova, M.; Balushkina, E.; Basova, S. Structural functional reorganization of ecosystem of hyperhaline lake Saki (Crimea) at increased salinity. Russ. J. Aquat. Ecol. 1994, 3, 111–126. [Google Scholar]
  29. Abdullahi, A.S.; Underwood, G.J.; Gretz, M.R. Extracellular matrix assembly in diatoms (Bacillariophyceae). V. Environmental effects on polysaccharide synthesis in the model diatom, Phaeodactylum Tricornutum. J. Phycol. 2006, 42, 363–378. [Google Scholar] [CrossRef]
  30. Steele, D.J.; Franklin, D.J.; Underwood, G.J. Protection of cells from salinity stress by extracellular polymeric substances in diatom biofilms. Biofouling 2014, 30, 987–998. [Google Scholar] [CrossRef] [Green Version]
  31. Prazukin, A.V.; Anufriieva, E.V.; Shadrin, N.V. Cladophora mats in a Crimean hypersaline lake: Structure, dynamics, and inhabiting animals. J. Oceanol. Limnol. 2018, 36, 1930–1940. [Google Scholar] [CrossRef]
  32. Prazukin, A.; Shadrin, N.; Balycheva, D.; Firsov, Y.; Lee, R.; Anufriieva, E. Cladophora spp. (Chlorophyta) modulate environment and create a habitat for microalgae in hypersaline waters. Eur. J. Phycol. 2021, 56, 231–243. [Google Scholar] [CrossRef]
  33. Steinhorn, I. Evaporation estimate for the Dead Sea: Essential considerations for saline lakes. In The Dead Sea: The Lake and Its Setting; Niemi, T.M., Ben-Avraham, Z., Gat, J.R., Eds.; Oxford University Press: Oxford, UK, 1997; pp. 122–132. [Google Scholar]
  34. Sherwood, J.E.; Stagnitti, F.; Kokkinn, M.J.; Williams, W.D. A standard table for predicting equilibrium dissolved oxygen concentrations in salt lakes dominated by sodium chloride. Int. J. Salt Lake Res. 1992, 1, 1–6. [Google Scholar] [CrossRef]
  35. Naftz, D.; Angeroth, C.; Kenney, T.; Waddell, B.; Darnall, N.; Silva, S.; Perschon, C.; Whitehead, J. Anthropogenic influences on the input and biogeochemical cycling of nutrients and mercury in Great Salt Lake, Utah, USA. Appl. Geochem. 2008, 23, 1731–1744. [Google Scholar] [CrossRef]
  36. Zhang, D.; Lin, Q.; Xue, N.; Zhu, P.; Zhang, F.; Ge, C.; Ma, C.; Pan, X. Ca2+ complexation of dissolved organic matter in arid inland lakes is significantly affected by drastic seasonal change of salinity. Sci. Total Environ. 2019, 663, 479–485. [Google Scholar] [CrossRef] [PubMed]
  37. Mirzoeva, N.; Shadrin, N.; Arkhipova, S.; Miroshnichenko, O.; Kravchenko, N.; Anufriieva, E. Does salinity affect the distribution of the artificial radionuclides 90Sr and 137Cs in water of the saline lakes? A case of the Crimean Peninsula. Water 2020, 12, 349. [Google Scholar] [CrossRef] [Green Version]
  38. Shadrin, N.; Stetsiuk, A.; Latushkin, A.; Anufriieva, E. Mercury in the world’s largest hypersaline lagoon Bay Sivash, the Sea of Azov. Environ. Sci. Pollut. Res. 2021, 28, 28704–28712. [Google Scholar] [CrossRef]
  39. Saccò, M.; White, N.E.; Harrod, C.; Salazar, G.; Aguilar, P.; Cubillos, C.F.; Meredith, K.; Baxter, B.K.; Oren, A.; Anufriieva, E.; et al. Allentoft, M.E. Salt to conserve: A review on the ecology and preservation of hypersaline ecosystems. Biol. Rev. 2021, 96, 2828–2850. [Google Scholar] [CrossRef]
  40. Wurtsbaugh, W.A.; Berry, T.S. Cascading effects of decreased salinity on the plankton chemistry, and physics of the Great Salt Lake (Utah). Can. J. Fish. Aquat. Sci. 1990, 47, 100–109. [Google Scholar] [CrossRef]
  41. Davis, J.A.; McGuire, M.; Halse, S.A.; Hamilton, D.; Horwitz, P.; McComb, A.J.; Froend, R.H.; Lyons, M.; Sim, L. What happens when you add salt: Predicting impacts of secondary salinisation on shallow aquatic ecosystems by using an alternative-states model. Aust. J. Bot. 2003, 51, 715–724. [Google Scholar] [CrossRef]
  42. Shadrin, N.; Yakovenko, V.; Anufriieva, E. Can Gammarus aequicauda (Amphipoda) suppress a population of Baeotendipes noctivagus (Chironomidae) in a hypersaline lake? A case of Lake Moynaki (Crimea). Aquac. Res. 2021, 52, 1705–1714. [Google Scholar] [CrossRef]
  43. Shadrin, N.; Yakovenko, V.; Anufriieva, E. Suppression of Artemia spp. (Crustacea, Anostraca) populations by predators in the Crimean hypersaline lakes: A review of the evidence. Int. Rev. Hydrobiol. 2019, 104, 5–13. [Google Scholar] [CrossRef] [Green Version]
  44. Jia, Q.; Anufriieva, E.; Liu, X.; Kong, F.; Shadrin, N. Intentional introduction of Artemia sinica (Anostraca) in the high-altitude Tibetan Lake Dangxiong Co: The new population and consequences for the environment and for humans. Chin. J. Oceanol. Limnol. 2015, 33, 1451–1460. [Google Scholar] [CrossRef]
  45. Shadrin, N.V. The alternative saline lake ecosystem states and adaptive environmental management. J. Oceanol. Limnol. 2018, 36, 2010–2017. [Google Scholar] [CrossRef]
  46. Scheffer, M. Alternative attractors of shallow lakes. Sci. World J. 2001, 1, 254–263. [Google Scholar] [CrossRef] [PubMed] [Green Version]
  47. El-Shabrawy, G.M.; Anufrieva, E.V.; Shadrin, N.V. Tintinnina (Ciliophora) and Foraminifera in plankton of hypersaline Lagoon Bardawil (Egypt): Spatial and temporal variability. Turk. J. Zool. 2018, 42, 218–229. [Google Scholar] [CrossRef] [Green Version]
  48. Anufriieva, E.V.; El-Shabrawy, G.M.; Shadrin, N.V. Copepoda in the shallow hypersaline Bardawil coastal lake (Egypt): Are there long-term changes in composition and abundance? Oceanol. Hydrobiol. Stud. 2018, 47, 219–229. [Google Scholar] [CrossRef]
  49. Pérez-Ruzafa, A.; De Pascalis, F.; Ghezzo, M.; Quispe-Becerra, J.I.; Hernández-García, R.; Munoz, I.; Vergara, C.; Pérez-Ruzafa, I.M.; Umgiesser, G.; Marcos, C. Connectivity between coastal lagoons and sea: Asymmetrical effects on assemblages’ and populations’ structure. Estuar. Coast. Shelf Sci. 2019, 216, 171–186. [Google Scholar] [CrossRef]
  50. Gera, A.; Kumaraswami, M.; Rao, V.R.; Vijay, A.; Pandiyarajan, R.S.; Ezhilarasan, P.; Murthy, M.R. The Pulicat, a distinctive shallow lagoon: Hypersalinity, thermodynamics and meromixis. Estuar. Coast. Shelf Sci. 2021, 252, 107292. [Google Scholar] [CrossRef]
  51. Case, T.J.; Sidell, R. Pattern and chance in the structure of model and natural communities. Evolution 1983, 1, 832–849. [Google Scholar] [CrossRef]
  52. Carranza, A.; Defeo, O.; Arim, M. Taxonomic relatedness and spatial structure of a shelf benthic gastropod assemblage. Divers. Distrib. 2011, 17, 25–34. [Google Scholar] [CrossRef]
  53. Boero, F.; Kraberg, A.C.; Krause, G.; Wiltshire, K.H. Time is an affliction: Why ecology cannot be as predictive as physics and why it needs time series. J. Sea Res. 2015, 101, 12–18. [Google Scholar] [CrossRef]
  54. Shadrin, N.V.; Belyakov, V.P.; Bazhora, A.I.; Anufriieva, E.V. The role of salinity as an environmental filtering factor in the determination of the Diptera taxonomic composition in the Crimean waters. Knowl. Manag. Aquat. Ecosyst. 2019, 420, 3. [Google Scholar] [CrossRef]
  55. Holling, C.S. Understanding the complexity of economic, ecological, and social system. Ecosystems 2001, 4, 390–405. [Google Scholar] [CrossRef]
  56. Grinchenko, A.B. History and dynamics of colonial settlements of Ciconiidae in the Eastern Crimea under the influence of anthropogenic succession at the Eastern Sivash and near Sivash area. Branta Trans. Azov-Black Sea Ornithol. Stn. 2004, 7, 61–81. (In Russian). [Google Scholar]
  57. Popenko, V.M.; Andryushchenko, Y.A. Nesting of Greater Flamingo (Phoenicopterus roseus) in Ukraine. Branta Trans. Azov-Black Sea Ornithol. Stn. 2017, 20, 220–223. (In Russian). [Google Scholar] [CrossRef] [Green Version]
  58. Hurbbert, S.H. Limnological studies of flamingo diets and distributions. Nat. Geogr. Soc. Res. Rep. 1982, 14, 351–356. [Google Scholar]
  59. Dejoux, C. Benthic invertebrates of some saline lakes of the Sud Lipez region, Bolivia. Hydrobiologia 1993, 267, 257–267. [Google Scholar] [CrossRef]
  60. Williams, W.D.; Carrick, T.R.; Bayly, I.A.; Green, J.; Herbst, D.B. Invertebrates in salt lakes of the Bolivian Altiplano. Int. J. Salt Lake Res. 1995, 4, 65–77. [Google Scholar] [CrossRef]
  61. Hurlbert, S.H.; Chang, C.Y. Ornitholimnology: Effects of grazing by the Andean flamingo (Phoenicoparrus andinus). Proc. Natl. Acad. Sci. USA 1983, 80, 4766–4769. [Google Scholar] [CrossRef] [Green Version]
Figure 1. Bay Sivash with the distribution of sampling sites (A—the local scale, B—the Crimean scale, C—the European scale).
Water 14 00403 g001
Figure 2. The views of Bay Sivash: (a,b)—general views; (c)—green algae Cladophora mats; (d)—belts of the common reed (Phragmites australis) which have died due to the salinity increase.
Water 14 00403 g002
Figure 3. Relationships of TSS (rhombuses) and DOM (squares) with salinity in Bay Sivash in 2019, June.
Water 14 00403 g003
Figure 4. Relationship of total zoobenthos abundance with salinity in Bay Sivash (2019, June).
Water 14 00403 g004
Figure 5. Relationship of the planktonic share in the total abundance of Harpacticoida with salinity.
Water 14 00403 g005
Figure 6. The maximal number of animal classes in the different salinity ranges in Bay Sivash.
Water 14 00403 g006
Figure 7. The salinity (a), TSS (b), and DOM (c) changes in Bay Sivash after the closure of the canal.
Water 14 00403 g007
Figure 8. The greater flamingo Phoenicopterus roseus Pallas, 1811 in Bay Sivash on 29 September 2021.
Water 14 00403 g008
Table 1. Coordinates of sampling stations in Bay Sivash during this study.
The Station NumberCoordinatesThe Station NumberCoordinates
145°45′37.0″ N; 34°57′57.0″ E945°19′05.5″ N; 35°14′59.8″ E
245°37′9.0″ N; 35°04′40.0″ E1045°21′04.2″ N; 35°06′06.5″ E
345°31′13.7″ N; 35°11′12.9″ E1145°37′48.3″ N; 35°01′54.8″ E
445°29′04.7″ N; 35°13′27.9″ E1245°40′48.8″ N; 34°54′55.2″ E
545°27′19.5″ N; 35°13′27.9″ E1345°44′00.8″ N; 34°48′10.3″ E
645°24′43.5″ N; 35°17′33.8″ E1445°52′38.8″ N; 34°44′33.3″ E
745°23′04.7″ N; 35°19′44.6″ E1545°52′42.6″ N; 34°42′09.0″ E
845°17′14.3″ N; 35°28′01.2″ E
Table 2. Environmental characteristics in Bay Sivash during different periods of this study.
DateTemperature, °CSalinity, g L−1TSS, mg L−1DOM, g L−1
MeanRangeCVMeanRangeCVMeanRangeCVMeanRangeCV
2016, June32.5031.00–34.000.09051.0024.00–70.000.270
2018, May21.8019.50–26.000.10364.0030.00–82.000.29213.642.37–24.760.6323.572.66–4.160.154
2018, November11.9010.00–14.000.11674.0030.00–100.000.31513.981.31–70.161.3359.312.97–42.141.158
2019, June28.0026.00–32.000.05673.0035.00–100.000.24113.792.45–26.660.6237.952.98–15.350.617
2020, July26.7021.00–34.000.12487.0041.00–128.000.24518.00 *2.04–33.70 *0.603 *
2020, September26.6024.00–28.000.04888.0041.00–138.000.382
2020, December3.003.00–3.500.05594.0030.00–112.000.293
TSS—total suspended solids; DOM—dissolved organic matter; *—excluding the value on station 9 where TSS was as high as 214.8 mg L−1 due to the concentration of suspended solids by the strong wind.
Table 3. Temporal and spatial variability of zooplankton structure in Bay Sivash from 2016 to 2020.
Taxon2016201820192020Max Salinity, g L−1
* JuneJuneNovemberJuneJulySeptemberDecember
Mean, Ind. m−2Mean, Ind. m−2CVFO, %Mean, Ind. m−2CVFO, %Mean, Ind. m−2CVFO, %Mean, Ind. m−2CVFO, %Mean, Ind. m−2CVFO, %Mean, Ind. m−2CVFO, %
Artemia cysts26000120,0601.94810017,8461.15810011,7632.14610043,2111.252100276,0391.327100138
Artemia active stages00042011.4206910582.8212251,3231.5278646281.0821001502.62025138
Chironomidae larvae and pupae02081.30988532.60638191.5513314411.8301001140.9721004301.38875138
Calanoida1247331.77738133.0231572.121220000102.82813112
Gastropoda0371.7321332.663152611.469677113.55743380.99280252.82825112
Bivalvia0171.7321332.663151061.4938972.35721101.2258000138
Harpacticoida60981.7867552.0002328702.46810024132.368641921.5641004952.47950138
Amphipoda1070082.74823411.4004413.7427000095
Ostracoda0732.2886300411.77933542.19029322.066600088
Fish juveniles041.836250061.8253300000075
Foraminifera+++50000013492.085571701.37760402.82225138
Isopoda3000000023.742700802.8281350
Polychaeta1300000000000045
Araneae012.82813000000000075
Total zooplankton abundance (without Artemia cysts)14574350.67110042861.41710043041.68410059911.77410051500.04510011541.152100
The number of macrotaxa6879977
Share of Artemia (without cysts) in total zooplankton abundance, %00740.559122.590530.762600.861102.428
*—samples were taken in only two stations with salinity 40–45 g L−1; mean—mean abundance; FO—frequency of occurrence, %.
Table 4. Temporal and spatial variability of zoobenthos structure in Bay Sivash from 2016 to 2020.
Taxon201820192020Max Salinity, g L−1
May–June *NovemberJuneJulyDecember
Mean, Ind. m−2CVFO, %Mean, Ind. m−2CVFO, %Mean, Ind. m−2CVFO, %Mean, Ind. m−2CVFO, %Mean, Ind. m−2CVFO, %
Gastropoda423.162920001.6415811101.520455822.332231052.8281395
Chironomidae larvae40,7111.6306428422.0465827941.5627322,5402.0419228941.55863128
Polychaeta1681.630911,3323.429334982.53327323.60680095
Bivalvia00353.464800323.60680087
Amphipoda3371.630914383.193256122.30818000090
Isopoda0000773.3179000050
Oligochaeta007373.464800000038
Artemia,
without cysts
0051272.180251153.317922451.549547892.82913128
Acarina115181053.464800000092
Nematoda97,8252.6127328,6282.4816760,6622.3238231,4781.309859471.20675128
Ostracoda12252.0123647361.4258334451.171829391.871553151.18150128
Harpacticoida51,8211.9569178242.0357525,0301.8317383881.517853161.182100128
Turbellaria82,1332.4574539291.4055821,7662.6187313601.0366912632.69625128
Kinorhyncha00003061.95327000070
Ciliata22,9251.5984530,2421.956756511.6214566061.1617766310.88088128
Foraminifera1152.365182461.7083312252.462363241.925311571.98425128
Allogromiidae+2112.8921739421.6909114252.776231582.82813128
Gromia+353.46481152.37118000054
Total zoobenthos abundance298,9481.92010095,6721.045100290,0691.90610076,2980.91710017,5770.647100
The number of macrotaxa1116151210
Share of Chironomidae larvae in total zoobenthos abundance, %13.61.985.01.87110.01.60429.01.05914.81.143
*—data from Shadrin et al., 2019; mean—mean abundance; FO—frequency of occurrence, %.
Publisher’s Note: MDPI stays neutral with regard to jurisdictional claims in published maps and institutional affiliations.

