Article

Kinetic Study of the Anaerobic Digestion of Recycled Paper Mill Effluent (RPME) by Using a Novel Modified Anaerobic Hybrid Baffled (MAHB) Reactor

1
Faculty of Bioengineering and Technology, Jeli Campus, Universiti Malaysia Kelantan, Jeli 17600, Kelantan, Malaysia
2
Department of Civil and Environmental Engineering, Cleveland State University, Cleveland, OH 44115, USA
3
School of Chemical Engineering, Engineering Campus, Universiti Sains Malaysia, Seri Ampangan, Nibong Tebal 14300, Pulau Pinang, Malaysia
4
School of Civil Engineering, Engineering Campus, Universiti Sains Malaysia, Seri Ampangan, Nibong Tebal 14300, Pulau Pinang, Malaysia
*
Author to whom correspondence should be addressed.
Water 2022, 14(3), 390; https://doi.org/10.3390/w14030390
Submission received: 9 December 2021 / Revised: 19 January 2022 / Accepted: 25 January 2022 / Published: 27 January 2022
(This article belongs to the Special Issue Water Quality Engineering and Wastewater Treatment Ⅱ)

Abstract

:
The process kinetics of an anaerobic digestion process for treating recycled paper mill effluent (RPME) was investigated. A laboratory-scale modified anaerobic hybrid baffled reactor (MAHB) was operated at hydraulic retention times of 1, 3, 5, and 7 days, and the results were analyzed for the kinetic models. A kinetic study was conducted by examining the phase kinetics of the anaerobic digestion process, which were divided into three main stages: hydrolysis kinetics, acetogenesis kinetics, and methane production kinetics. The study demonstrated that hydrolysis was the rate-limiting step. The applied Monod and Contois kinetic models showed satisfactory prediction with μ m a x values of 1.476 and 0.6796 L day−1, respectively.

1. Introduction

The recycled paper industry is a worldwide emergent industry that consumes a considerable amount of resources, energy, and raw materials. Many of those involved in this industry discharge their insufficiently treated waste into streams and rivers, which contributes to serious problems in flora–fauna and aquatic life [1]. Owing to the increasing public concern on environmental sustainability, waste disposal, and energy supply, the conversion of effluent into energy is becoming an economically viable practice.
The anaerobic digestion process is one of the main biological wastewater treatment processes in use today. It became popular as a wastewater treatment option because it is energy positive (it produces methane) and it has low sludge production [2]. Hence, anaerobic digestion is one of the most remarkable options to treat high-strength organic effluents, such as recycled paper mill effluent (RPME).
Process kinetics is a useful tool for predicting and describing the performance of anaerobic digestion systems. A literature survey indicates that Monod kinetic models have been extensively used to explain the process kinetics of anaerobic digesters [3,4]. However, some researchers have found difficulties in applying them [5,6], which might be because the Monod equation does not consider the reliance of effluent substrate concentration on influent substrate concentration. Hu et al. [7] indicated that the effluent substrate concentration depends on the influent substrate concentration if the growth-limiting substrate is measured as chemical oxygen demand (COD). Several researchers have applied the Monod kinetic model in determining the biokinetic parameters of the aerobic digestion (AD) process. Hu et al. [7] studied the kinetic behavior of AD for treating ice cream wastewater by using the Monod kinetic model, which presented a μ m a x value of 0.7844 day−1 and K s value of 0.4028 g COD L−1. Lokshina et al. [8] used the Monod model to evaluate the kinetic coefficients of low-temperature acetoclastic methanogenesis for lake sediments. The result indicated that the inhibition constant K 1 and half-saturation constant K s values are 110 and 103 mM, respectively. Chen and Hashimoto [9] suggested that the Contois kinetic model was more suitable than the Monod model for describing the performance of the anaerobic digestion process in treating dairy wastewater. This suggestion was based on the assumption that in the Contois kinetic model, a direct relationship exists between influent and effluent substrate concentrations. Abu-Reesh [10] fitted the experimental data of AD of Labaneh whey to the Contois kinetic model and obtained a kinetic constant value of 0.065 day−1 and K_s of 1.27 g L−1 with 1.29 value of error obtained from nonlinear curve fitting of the model. Vavilin et al. [11] stated that in treating complex solid waste, the Contois kinetic model is preferable when considering the optimal design of a two-phase anaerobic digestion system. Veeken and Hamelers [12] used Contois kinetics with inhibition of 30 g of volatile fatty acid (VFA) per liter, which yielded an adequate result in treating biowaste. Meanwhile, Veeken et al. [13] elucidated the VFA inhibition mechanism by designing a set of experiments for treating organic solid waste. The result showed that no inhibition by non-ionized VFA or VFA can be measured at pH between 5 and 7 and that acidic pH was the inhibitor factor. Other researchers have also viewed a specific growth rate assuming Monod kinetics with substrate inhibition. The demanding task of determining kinetic data to describe the anaerobic acetate-to-methane conversion has restricted the implementation of this model. Variability in obtaining maximum growth rates still occurred in experiments involving identical cultures of Methanosarcina barkeri, strain 227, and the substrate acetate [14]. This variability might be the reason why few studies were performed by implementing Monod kinetics with substrate inhibition.
To understand the kinetics of AD in treating RPME by using a modified anaerobic hybrid baffled (MAHB) reactor, the kinetic behaviors of successive sequence steps were investigated for evaluating the reaction involved in each process. The processes consisted of the kinetics of hydrolysis, acetogenesis, and methanogenesis. The experimental results were compared with the theoretical data, and whether the experimental results fitted well with the theoretical ones was determined. The hydrolysis behavior can be measured via kinetic study. Through understanding the effect of operating conditions on hydrolysis process, researchers could design and operate anaerobic reactors. Numerous kinetic models have been applied for hydrolysis in AD systems. However, most studies have shown that experimental data fit well with first-order kinetic models. Meanwhile, the kinetics of acetogenesis can be modeled using a simplified integral method but with an adjustment to the Monod kinetic model via the rate of conversion of VFA. In methanogenic systems, methane formation is proportional to COD reduction on the basis of the Michaelis–Menten equation. Through understanding the effect of operating conditions on each phase kinetics of AD process, researchers could design and operate anaerobic reactors. The novelty of this research is that we are able to know the phase kinetics of the anaerobic digestion process of RPME by using an MAHB reactor, which is specifically designed and fabricated for this research.

2. Materials and Methods

2.1. Equipment

A laboratory-scale MAHB reactor was used in this study. The MAHB reactor was rectangular in shape and consisted of five compartments. Each compartment was separated by a modified vertical baffle. The reactor had a total active volume of 58 L. Polypropylene ring packing materials were used as media for supporting biofilm formation. They were located under the surfaces of compartments two and three. Sampling ports were present in the top and bottom of each compartment. The MAHB reactor was operated under mesophilic conditions (35 ± 2 °C), and the temperature was maintained by circulating hot water through the bioreactor jacket. Samples were collected from each compartment for analysis, together with the effluent. The details of the MAHB reactor have been reported previously [15].

2.2. Inoculum and Wastewater Preparation

Seed sludge sources were collected from the anaerobic pond of Malpom Sdn Bhd, Penang, Malaysia and kept in a refrigerator at 4 °C until used. The wastewater samples were collected from the point before going to the equalization tank (i.e., before going to the existing effluent treatment plant specifically designed and operated for the treatment of recycled paper wastewater of Muda Paper Mill Bhd, Bandar Tasek Mutiara, Penang, Malaysia) and refrigerated at 4 °C. Prior to analysis, the samples were warmed to room temperature (25 ± 2 °C). The collected samples were analyzed for the required parameters, such as pH, total dissolved solids, volatile suspended solids (VSS), total suspended solids (TSS), total solids (TS), BOD, COD, heavy metals, VFA, and dissolved oxygen, in accordance with the Standard Methods for the Examination of Water and Wastewater [16]. The characteristics of the RPME used and the start-up of the MAHB reactor have been reported previously [15].

2.3. Kinetic Study

For the kinetic study of anaerobic digestion phases, kinetic data were obtained at each steady state condition (<5% variation in effluent COD concentration) that included all three main stages: hydrolysis, acetogenesis, and methanogenesis. The kinetic study was performed under different conditions, as shown in Table 1.
The experimental work was conducted by continuously operating the MAHB reactor at constant initial sludge inoculum but different feeding wastewater concentrations, feed flow rates, and organic loading rates for the hydrolysis, acetogenesis, and methanogenesis stages, respectively. To investigate the hydrolysis kinetics, the MAHB reactor was continuously fed with feeding wastewater concentrations of 1000, 2000, 3000, and 4000 mg COD L−1 until reaching steady state at each condition.
For the acetogenesis kinetics, four experiments at 28 ± 2 °C were performed with feed flow rates of 58, 19.3, 11.6, and 8.29 L day−1. For the methanogenesis kinetics, four different feeding COD concentrations of 1000, 2000, 3000, and 4000 mg COD L−1 at the hydraulic retention time (HRT) of 1–7 days were considered. The samples from each operating condition were collected at constant time interval (every 2 weeks of operation times). The effluent from the MAHB reactor was collected and analyzed for COD, solid concentration (i.e., TS, total volatile solid (VS), TSS, and VSS), VFA, methane production rate, and pH for every two subsequent days. To estimate the reaction kinetics, the experimental data were plotted as a relationship between substrate concentration and specific growth rate.
For the kinetics of hydrolysis, a first-order kinetic model was chosen, which was given as
d S d t = k S
where t is the time (days), k is the first-order rate coefficient (day−1), and S is the vs. concentration. Hence, the conversion coefficient of vs. into product was denoted as ∝ and applied to the kinetic equation to obtain the following equation:
d P d t = α k S
Integration of Equation (2) yielded Equation (3), which could be used to determine the product concentration during hydrolysis process, as follows:
P = P 0 + α S o ( 1 e k t )
where P is the product concentration; and P0 and So are the initial product and substrate concentrations, respectively.
For acetogenesis, the kinetic constant was determined using the Monod kinetic model (Equation (4)) and integral method at different feed flow rates by using a constant feeding COD concentration of 2000 mg L−1. The biomass concentration inside the reactor was assumed constant during the steady-state conditions. Hence, the mass balances of the reactor were given as
d C V F A d t = ( k m a x , V F A   ) C V F A K s , V F A + C V F A X V F A
where C V F A is the concentration of VFA, k m a x , V F A   is the specific maximum VFA degradation rate, K s , V F A is the saturation constant, and X V F A is the concentration of the biomass VFA. For C V F A >> than K s ,   Equation (4) was reduced to
d C V F A d t = ( k m a x , V F A   ) X V F A
Equation (5) could be integrated to obtain
C V F A = ( k m a x , V F A   ) X V F A t + C V F A .0
where 0 denoted the inlet concentration. Through plotting Equation (6), a straight line was obtained, where the slope of the line is k m a x , V F A   . X V F A . The value of k m a x , V F A   could be calculated given that the concentration of the biomass inside the reactor is known. All the above equations are valid at high VFA concentrations. From the literature, the acetogenic biomass was assumed to be 5% of the total biomass, and 95% of the anaerobic mixed biomass corresponded to acidogenic and methanogenic biomass [16]. For C V F A   << than K s   , Equation (4) was reduced to Equation (7); through integrating it, Equation (8) could be obtained.
d C V F A d t = ( k m a x , V F A   ) X V F A K s , V F A   C V F A
ln ( C V F A C V F A .0 ) = k m a x , V F A   X V F A K s , V F A  
Through plotting Equation (8), the value of k m a x , V F A   k s , V F A   could be calculated from the slope of the straight line. This condition is valid at low VFA concentration. The kinetic constant of the process could be calculated by comparing the experimental data with the following equation:
t = k s , V F A   ln ( C V F A C V F A .0 ) + ( C V F A C V F A .0 ) k m a x , V F A   X V F A
For comparison, the experimental data were calculated again by using the integral method. For the integral method, the kinetic constants were calculated as
( C V F A .0 C V F A ) ln ( C V F A .0 / C V F A ) = K S . V F A + k m a x . V F A X V F A t ln ( C V F A .0 / C V F A )
Plotting Equation (10) gives a straight line, where k m a x . V F A X V F A is the slope, and K S . V F A is the intersection of the straight line with the y-axis. X V F A (acetogenic biomass) is constant, and the slope can be divided by the biomass to obtain k m a x . V F A . To indicate whether the experimental and measured data have a good agreement, Theil’s inequality coefficient (TIC) was used, as shown as follows:
TIC = i ( y i y m . i ) 2 i y i 2 + i y m .   i 2
where y_i represents the experimentally measured value, and y m .   i refers to the data from solving Equation (9). TIC values are in a range of zero to unity; if the TIC value is closer to zero, it shows better model validity (i.e., the model or system is valid for acceptable range); if the TIC value is smaller than 0.3, a good agreement (experimental results are significantly a reflection of theoretical results) with measured data can be observed [17].
For the methanogenesis process, the production kinetics of methane was determined by assuming that the models were proportional to the biodegradable fraction of organic matter (COD concentration). Biomass and product (methane) production rates were described as
Y X = d X / d t d S / d t
Y M = d P / d t d S / d t
where Y X is the biomass yield, and Y M is the methane yield. Through simultaneously completing Equations (12) and (13), the following equation could be derived:
d P d t = Y M Y x ( d X d t )
Noting that r M = Y M Y x ( d X d t ) , and μ X = d X d t ; thus, Equation (14) became
r M = Y M Y x ( μ X )
where r M is the methane production rate (L CH4 day−1), μ is the specific microbial growth rate (per day), and X is the biomass concentration. Substituting the Monod model (Equation (4)) into Equation (15) yielded
r M = [ Y M μ m Y x ( K s + S ) ] X S
where μ m is the maximum specific microbial growth rate (per day), K s is the half-velocity constant (g COD L−1), and S is the effluent substrate concentration (g COD L−1). Then, assuming that the substrate is almost depleted ( K s S ) and X is constant throughout the system, Equation (16) became
r M = [ Y M μ m Y x K s ] X S
If the apparent reaction rate constant K = [ Y M μ m Y x K s ] X , then Equation (17) became
r M = K S
This equation indicated that methane production was proportional to organic matter. The experimental data obtained could then be verified by plotting the methane production rate versus the straight line from the theoretical data line from r M (experimental) versus r M (theoretical) line. Methane yield Y M represents the performance of the reactor in terms of methane production rate related to organic removal rate. Therefore, the rate of methane produced Q M (L CH4 day−1) could be expressed as
Q M = Y M Q ( S o S )
where S o is the influent COD concentration (g COD L−1), S is the effluent COD concentration, and Q is the volumetric feed flow rate (L day−1).

2.4. Analytical Method

Biogas composition was determined using a Shimadzu gas chromatograph–flame ionization detector with a propack N column. The carrier gas was helium set at a flow rate of 50 mL min−1, a column temperature of 28 °C, a detector temperature of 38 °C, and an injector temperature of 128 °C. VFAs were measured using esterification methods. Triplicate samples were collected for each parameter reading to increase the precision of the results, and only the average value was reported throughout this study. VSS was measured in accordance with the Standard Methods [18], while COD was measured using Spectrophotometer DR-2800 in accordance with the reactor digestion method [19]. The MAHB reactor was monitored every 2 days for COD and the biogas produced and weekly for VFA. Samples were collected for analysis from each of the five compartments of the MAHB reactor at HRT of 1, 3, 5, and 7 days as the system achieved its steady state.

3. Results

3.1. Kinetic Study of Anaerobic Digestion by Using an MAHB Reactor

AD process was investigated by the kinetics of the three phases of AD process (hydrolysis, acetogenesis, and methanogenesis). In the three-phase kinetics, the kinetic evaluation might be important in terms of digestion rate, bacterial varieties, environmental demands, digestion process, and digestion products for each phase involved [20]. The AD process kinetic study of RPME was investigated using the Monod and Contois equations to develop two basic steady-state models. Both models were evaluated with a set of routine analytical data obtained.

3.1.1. Hydrolysis Kinetics

In this study, hydrolysis kinetics was expressed using first-order kinetics with respect to particulate or biomass degradation. VSS was chosen as a crucial parameter due to the fact that VSS contains a high percentage of organic matter and is an easy-to-degrade material. VFA was noted as the primary product of RPME hydrolysis, and the first-order kinetics of RPME were calculated using Equation (3).
Figure 1 shows the first-order kinetics of RPME at different initial wastewater concentrations and HRT of 7 days. The result showed that the first-order kinetics were well fitted with the experimental data with R2 values of 0.9617, 0.9008, 0.9485, and 0.9839 for the initial feeding concentrations of 1000, 2000, 3000, and 4000 mg COD L−1, respectively. The values of kinetic coefficient obtained and summarized in Table 2 clearly indicated that first-order rate coefficients k were highest at low feeding concentrations and that the substrate conversion coefficient (α So) increased as the feeding concentration increased. This phenomenon might be due to a high feeding concentration providing substantial substrate particles that collide with the microorganism per unit time, which leads to frequent reactions between them. As a result, the substrate conversion coefficient increased as the feeding concentration increased. The decrease in the first-order rate coefficient might be due to the excessive available amount of adsorption sites of particulate substrate because the hydrolysis rate is controlled by enzyme kinetics [21].
The conversion coefficient (α) obtained from this work could be predicted from Equations (1) and (2), which provided the value of 0.206 g VFA g VSS−1. Previous study reported that the conversion coefficient for a control reactor was 0.13 g COD g VSS−1. For enzymatic treatment of solid waste, the conversion coefficient determined ranged from 0.23 g COD g VSS−1 to 0.27 g COD g VSS−1. From the result, hydrolysis process was the rate-limiting step, which made the assumption possible. The reason was that the rate coefficient values were less than 0.5, which implied that hydrolysis/acidogenesis was the rate-limiting step, as previously suggested by Momoh et al. [22].
Systems with methane as a final product could also be used if the slowest or rate-limiting reaction was hydrolysis. The product concentration value P in Equation (3) was expressed in terms of X for methane volume released in hydrolysis kinetics to yield
X = X 0 + α S o ( 1 e k t )
The time profile of methane volume released during anaerobic sludge and RPME effluent degradation under mesophilic conditions is shown in Figure 2. From the graph, the hydrolysis coefficient was estimated using Equation (20) to give a value of α So = 7315 mL and k = 0.0117 day−1. From the result obtained, the experimental data exhibited a good agreement and fitted reasonably well with the first-order kinetics, which yielded the following substance conversion equation:
X = X 0 + 0.85 S o ( 1 e 0.0117 t )

3.1.2. Kinetics of Acetogenesis

Acetogenesis process mainly corresponded to VFA concentration and system pH. Hence, the kinetics of acetogenesis was determined by observing the VFA degradation process at different feed flow rates of 58, 19.3, 11.6, and 8.29 L day−1. Figure 3a,b were plotted using Equations (7) and (8), respectively. From the results shown in Figure 3, VFA degradation began when the system started, and higher sequences of degradation were obtained at higher feed flow rates, followed by other feed flow rates in descending patterns. This finding indicated that once the acetogenic bacteria underwent the acclimatization process, VFA degradation started. The kinetics was determined using the Monod kinetic model. k m a x . V F A and k s . V F A values (from the slope) for VFA were determined using the Monod model, as depicted in Figure 3a,b, respectively.
Figure 4 shows the determination of k m a x . V F A and k s . V F A by using the integral method (Equation (10)). k m a x . V F A could be calculated from the slope of the straight line, while and the value of k s . V F A was obtained from the intersection of the y-axis. The values of K m a x , V F A and K s , V F A for VFA degradation by using the Monod model and the integral method are summarized in Table 3.
The values of k m a x . V F A . obtained in this study are close to the previous results of 13 mg COD mg−1 VSS day−1 reported by Skiadas et al. [23]. In addition, K S , V F A values are close to the value of 0.28 g VFA L−3 recorded by Romli et al. [24] and the value of 0.15 g VFA L−3 determined by Vavilin and Lockshina [25]. Comparison of the results obtained from both methods indicated that the differences between the methods were less than 10% (5.2%, 3.3%, 3.4%, and 0.7% for the feed flow rates of 58.0, 19.3, 11.6, and 8.29 L day−1, respectively) for constant k m a x . V F A . values. This finding confirmed that the proposed method was suitable in determining the specific maximum degradation rate. For saturation constant K s , V F A ,   . the difference between the methods was not more than 37.9% at the highest feed flow rate of 58 L day−1.
This finding indicated that both models were successful in determining the kinetic constant. To verify the kinetic constants obtained from both methods with the experimental data, a plot of comparison between both methods with the experimental data is shown in Figure 5. It clearly illustrated a similar trend with decreasing values of VFA concentration as the feed flow rate decreased over time. From the data obtained, the TIC values could be calculated using Equation (11) as previously described. The results are summarized in Table 4.
The TIC values were equal and lower than 0.203 for all cases studied, which implied that the experimental and theoretical data were in good agreement. These values were higher than the TIC values obtained from a previous study conducted by Huilinir et al. [17], which recorded TIC values lower than 0.11. TIC showed increasing values as the feed flow rate increased for both methods. Theoretically, TIC values lower than 0.3 indicated that the data were in good agreement with the measured data [26].

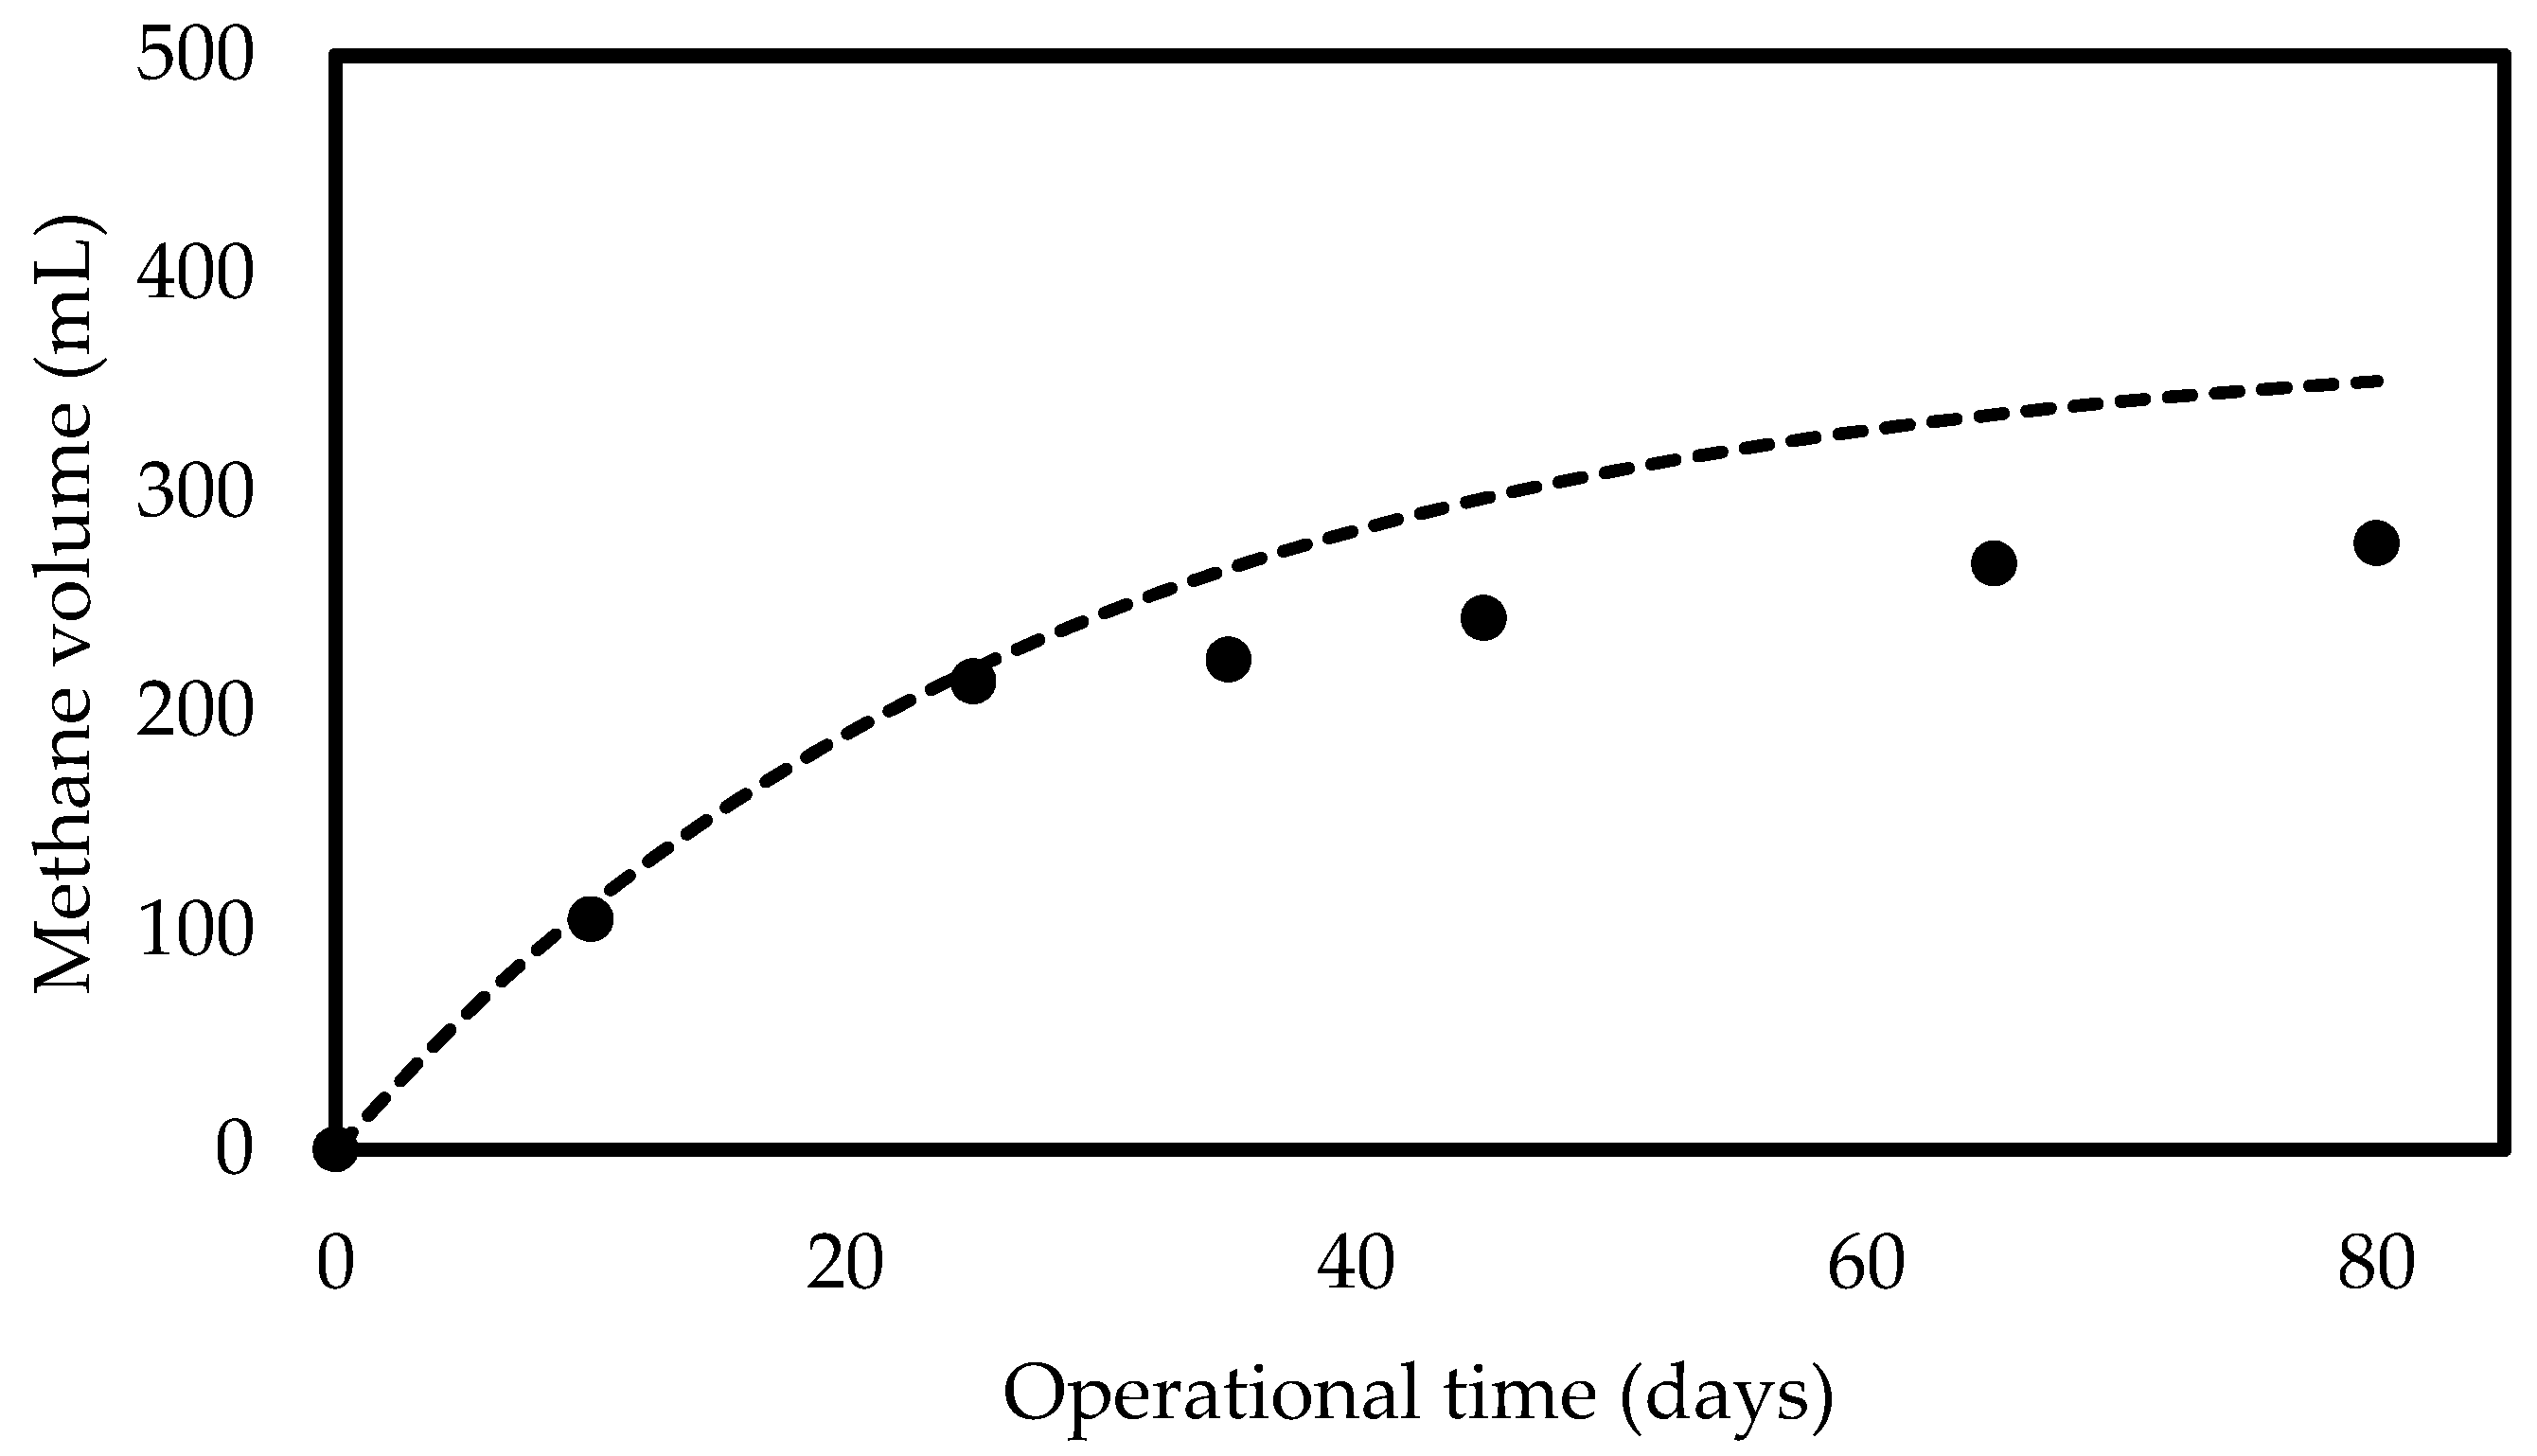
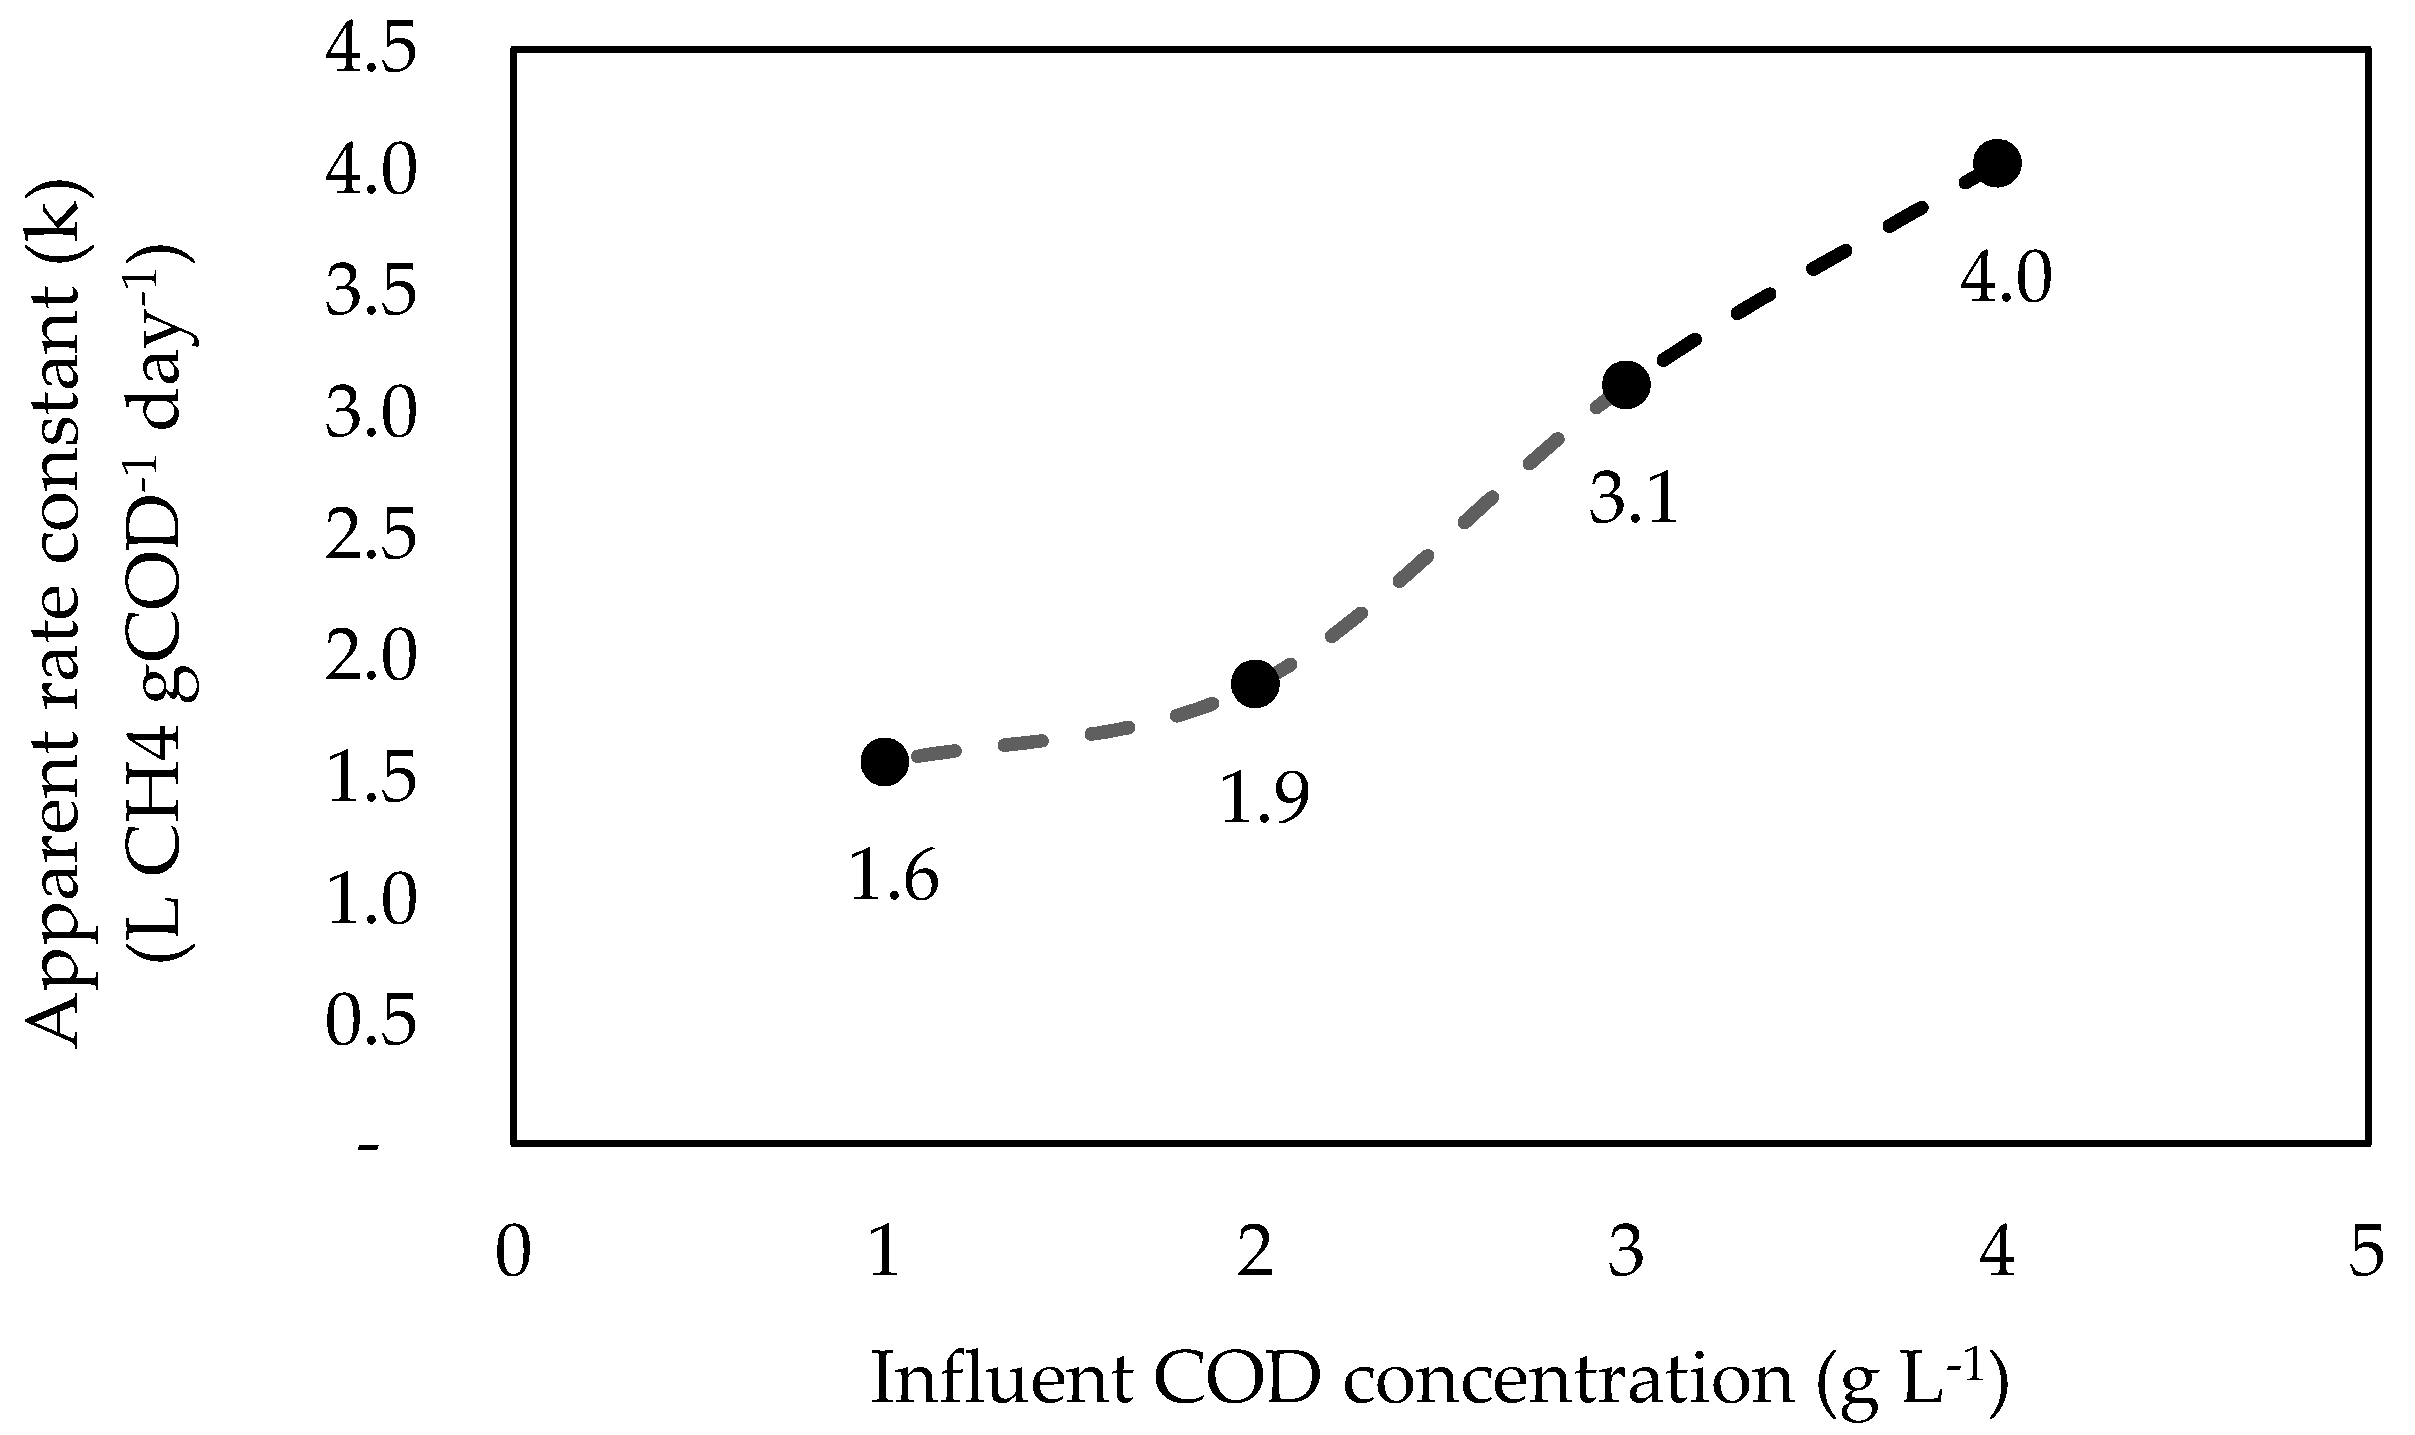
3.1.3. Kinetics of Methanogenesis

The rate of methane production was assumed to be proportional to organic matter degradation. In this study, graph extrapolation was employed at finite HRT to estimate the COD concentration. The kinetics of methanogenesis was evaluated at different feeding concentrations of 1000, 2000, 3000, and 4000 mg L−1 at HRT of 1–7 days. Figure 6 presents the plot of effluent COD concentration versus the inverse HRT at each set of data. All data showed an R2 value higher than 0.80 for different feeding concentrations. The results implied that an increase in feeding COD concentration yielded an increase in effluent COD concentration. Given that Figure 6 shows high R2 values, the variation in methane production rate ( r M )   . as the function of effluent COD was then plotted (Figure 7).
The plotted line indicated that Equation (18) was valid to describe the system. From the result, the rate constants (K) were calculated for each data set from the slope of straight line (Figure 7) by using Equation (18). The calculated apparent rate constant (K) variation corresponding to influent COD concentration is shown in Figure 8. The result showed that the apparent rate constant was proportional to the influent COD concentration with the highest value of 4.03 L CH4 g−1 COD day−1 at the influent COD concentration of 4000 mg L−1.
The result was comparable to the result obtained by Zinatizadeh et al. [27], which presented the highest K value of 7.4 L CH4 g−1 COD day−1 at a high feeding COD concentration. This phenomenon might be due to the high specific activity of microorganisms inside the reactor. The hybrid system (biofilm or attached microorganism) applied inside the MAHB reactor allowed to metabolize the intermediate products, such as VFA. The apparent rate constant (K) was further interrelated with the concentration of microorganisms (X) (in terms of VSS), as shown in Figure 9. The experimental data fitted well with an R2 value of 0.89. However, in contrast with K = [ Y M μ m Y s K s ] X , a nonzero intercept was observed. This condition might be due to the inability to distinguish other suspended organic matter, as well as true microorganisms.
The experimental methane production rate ( r M ) . was plotted against the theoretical methane rate (Figure 10) by using Equation (18), which resulted in a straight line with an R2 value of 0.93. The theoretical data were calculated by multiplying the effluent substrate concentration (S) in terms of COD with the apparent rate constant (K). High correlation values indicated insignificant difference between the theoretical and experimental values.
The methane production rate ( Q M ) . was related to the rate of organic removal. Figure 11 shows the plotted methane production rate corresponding to substrate consumption by using Equation (19), which yielded a straight line that indicated a proportional effect. From the plotted graph, YM was calculated using Equation (19) to yield a value of 0.0645 L CH4 g COD−1. This value was lower than the previous results obtained by Belhadj et al. [28] (0.245 L CH4 g COD−1) and Zinatizadeh et al. [27] (0.3251 L CH4 g COD−1). The lower value of methane yield coefficient might be attributed to the differences in the types of wastewater (RPME) and the lower substrate concentration (below 4000 mg L−1 COD concentration) compared with those in previous studies, which presented a high sewage sludge concentration of 50,000 mg L−1 [28] and a palm oil mill effluent concentration of 34,000 mg L−1 [27]. However, the present study clearly indicated that anaerobic digestion could be a good option for degrading the available feedstock (RPME). The kinetic parameters in each step are summarized in Table 5.

4. Conclusions

In AD phase kinetics, the kinetic study might be significant in terms of digestion process, digestion rate, environmental demands, bacterial varieties, and digestion products for each phase involved. In conclusion, the novelty of this research is that we are able to know the phase kinetics of the anaerobic digestion process of RPME by using an MAHB reactor, which is specifically designed and fabricated for this research. The result indicates that the kinetic study of the subsequent phase of anaerobic digestion shows that hydrolysis is the rate-limiting step with hydrolysis coefficient S o = 7315 mL and k = 0.0117 day−1. For acetogenesis kinetics, Monod and integral show similar K s , V F A   and K m a x , V F A values with TIC values equal and lower than 0.203 for all cases studied. For methanogenesis kinetics, Y M obtained is 0.0645 L CH4 g COD−1.

Author Contributions

Conceptualization, I.D.; methodology, I.D., S.R.H.; software, S.R.H.; validation, S.R.H.; formal analysis, S.R.H.; investigation, S.R.H.; resources, I.D.; data curation, S.R.H.; writing—original draft preparation, S.R.H.; writing—review and editing, S.R.H., I.D., H.A.A.; visualization, S.R.H.; supervision, I.D., H.A.A., Y.-T.H.; project administration, I.D.; funding acquisition, Y.-T.H. All authors have read and agreed to the published version of the manuscript.

Funding

This work was supported by the Research University (RU)—Individual Grant, Universiti Sains Malaysia (Account No. 1001/PJKIMIA/814148).

Data Availability Statement

Datasets generated during the current study are available from the corresponding author on reasonable request.

Acknowledgments

The authors wish to acknowledge financial support from the Universiti Sains Malaysia (RU-I A/C.1001/PJKIMIA/814148).

Conflicts of Interest

The authors declare no conflict of interest.

References

  1. Singh, U.S.; Panwar, S.; Jain, R.K.; Tripathi, Y.C. Assessment of Physicochemical Characteristics of Effluents from Paper Mill in the State of Uttar Pradesh, India. Int. J. Eng. Res. Technol. IJERT 2020, 9, 313–318. [Google Scholar]
  2. Hanum, F.; Yuan, L.C.; Kamahara, H.; Aziz, H.B.; Atsuta, Y.; Yamada, T.; Daimon, H. Treatment of Sewage Sludge Using Anaerobic Digestion in Malaysia: Current State and Challenges. Bioenergy Biofuel 2019, 7, 19. [Google Scholar] [CrossRef] [Green Version]
  3. Siergrist, H.; Renggli, D.; Gujer, W. Mathematical modelling of anaerobic mesophilic sewage sludge treatment. Water Sci. Technol. 1993, 27, 25–36. [Google Scholar] [CrossRef]
  4. Anderson, G.K.; Kasapgil, B.; Ince, O. Microbial kinetics of a membrane anaerobic reactor system. Environ. Technol. 1996, 17, 449–464. [Google Scholar] [CrossRef]
  5. Grady, C.P.L.; Harlow, J.L.J.; Riesing, R.R. Effects of growth rate and influent substrate concentration on effluent quality from chemostats containing bacteria in pure and mixed culture. Biotechnol. Bioeng. 1972, 14, 391–410. [Google Scholar] [CrossRef]
  6. Fadzil, F.; Norazman, A.F.; Seswoya, R. Pilot scale anaerobic digestion of food waste: Evaluation on the stability, methane production and kinetic analysis. Res. Sq. 2021. [Google Scholar] [CrossRef]
  7. Hu, W.C.; Thayanithy, K.; Forster, C.F. Kinetic study of anaerobic digestion of sulphate-rich wastewaters from manufacturing food industries. In Proceedings of the 7th International Conference on Environmental Science and Technology, Syros Island, Greece, 3 –6 September 2001. [Google Scholar]
  8. Vavilin, V.; Lokshina, L.; Rytov, S. Using kinetic isotope effect to evaluate the significance of the sequential and parallel steps: Formation of microbial consortium during reversible anaerobic methane oxidation coupled with sulfate reduction. Water Sci. Technol. 2019, 79, 2056–2067. [Google Scholar] [CrossRef]
  9. Chen, Y.R.; Hashimoto, A.G. Substrate utilisation kinetic model for biological treatment processes. Biotechnol. Bioeng. 1980, 22, 2081–2095. [Google Scholar] [CrossRef]
  10. Abu-Reesh, I.M. Kinetics of anaerobic digestion of labaneh whey in a batch reactor. Afr. J. Biotechnol. 2014, 13, 1745–1755. [Google Scholar]
  11. Vavilin, V.A.; Rytov, S.V.; Lokshina, L.Y.; Rintala, J.A.; Lyberatos, G. Simplified hydrolysis models for the optimal design of two-stage anaerobic digestion. Water Res. 2001, 35, 4247–4251. [Google Scholar] [CrossRef]
  12. Veeken, A.H.M.; Hamelers, B.V.M. Effect of substrate-seed mixing and the leachate recirculation on solid state digestion of biowaste. Water Sci. Technol. 2000, 41, 255–262. [Google Scholar] [CrossRef]
  13. Sukphun, P.; Sittijunda, S.; Reungsang, A. Volatile Fatty Acid Production from Organic Waste with the Emphasis on Membrane-Based Recovery. Fermentation 2021, 7, 159. [Google Scholar] [CrossRef]
  14. Lübken, M.; Gehring, T.; Wichern, M. Microbiological fermentation of lignocellulosic biomass: Current state and prospects of mathematical modeling. Appl. Microbiol. Biotechnol. 2010, 85, 1643–1652. [Google Scholar] [CrossRef]
  15. Hassan, S.R.; Zwain, H.M.; Zaman, N.Q.; Dahlan, I. Recycled paper mill effluent treatment in a modified anaerobic baffled reactor: Start-up and steady-state performance. Environ. Technol. 2013, 35, 294–299. [Google Scholar] [CrossRef]
  16. Batstone, D.J.; Keller, J.; Blackall, L.L. The influence of substrate kinetics on the microbial community structure in granular anaerobic biomass. Water Res. 2004, 38, 1390–1404. [Google Scholar] [CrossRef]
  17. Huilinir, C.; Roa, E.; Vargas, D.; Roeckel, M.; Aspe, E. Kinetics of syntrophic acetogenesis in a saline medium. J. Chem. Technol. Biotechnol. 2008, 83, 1433–1440. [Google Scholar] [CrossRef]
  18. Clescerl, L.S.; Greenberg, A.E.; Eaton, A.D. (Eds.) Standard Methods for the Examination of Water and Wastewater, 20th ed.; American Public Health Association; American Water Works Association; Water Environment Federation: Washington, DC, USA, 1998. [Google Scholar]
  19. Jirka, A.M.; Carter, M.J. Micro semiautomated analysis of surface and waste waters for chemical oxygen demand. Anal. Chem. 1975, 47, 1397–1402. [Google Scholar] [CrossRef]
  20. Shuizhou, K.; Shi, Z. Applications of two phase anaerobic degradation in industrial wastewater treatment. Int. J. Environ. Pollut. 2005, 23, 65–80. [Google Scholar]
  21. Vavilin, V.A.; Fernandez, B.; Palatsi, J.; Flotats, X. Hydrolysis kinetics in anaerobic degradation of particulate organic material: An overview. Waste Manag. 2008, 28, 939–951. [Google Scholar] [CrossRef]
  22. Momoh, O.L.Y.; Anyata, B.U.; Saroj, D.P. Development of simplified anaerobic digestion models (SADM’s) for studying anaerobic biodegradability and kinetics of complex biomass. Biochem. Eng. J. 2013, 79, 84–93. [Google Scholar] [CrossRef] [Green Version]
  23. Skiadas, I.V.; Gavala, H.N.; Lyberatos, G. Modelling of the periodic anaerobic baffled reactor (PABR) based on the retaining factor concept. Water Res. 2000, 34, 3725–3736. [Google Scholar] [CrossRef]
  24. Romli, M.; Keller, J.; Lee, P.J.; Greenfield, P.F. Model prediction and verification of a two-stage highrate anaerobic wastewater treatment system subjected to shock loads. Process Saf. Environ. Prot. 1995, 73, 151–154. [Google Scholar]
  25. Vavilin, V.A.; Lockshina, L.Y. Modelling of volatile fatty acids degradation kinetics and evaluation of microorganism activity. Bioresoure Technol. 1996, 57, 69–80. [Google Scholar] [CrossRef]
  26. Hvala, N.; Strmcnik, S.; Sel, D.; Milanic, S.; Banko, B. Influence of model validation on proper selection of process models—An industrial case study. Comput. Chem. Eng. 2005, 29, 1507–1522. [Google Scholar] [CrossRef]
  27. Zinatizadeh, A.A.L.; Mohamed, A.R.; Najafpour, G.D.; Hasnain, I.M.; Nasrollahzadeh, H. Kinetic evaluation of palm oil mill effluent digestion in a high rate up-flow anaerobic sludge fixed film bioreactor. Process Biochem. 2006, 41, 1038–1046. [Google Scholar] [CrossRef]
  28. Belhadj, S.; El Bari, H.; Karouach, F.; Joute, Y.; Chica, A.F.; Santos, M.A.M. Production of methane from mesophilic anaerobic digestion of sewage sludge in morocco. Am. J. Adv. Sci. Res. 2014, 2, 81–91. [Google Scholar]
Figure 1. Time profiles of the VFA concentration during RPME mesophilic anaerobic degradation at different initial wastewater concentrations (in terms of mg VFA L−1). Symbols refer to the experimental data, and dash lines refer to the predictions by using Equation (2) with k = 0.0356 ± 0.004 day−1 and α = 0.206 ± 0.0084 g VFA g VSS−1.
Water 14 00390 g001
Figure 2. Time profile of the methane volume released during anaerobic sludge and RPME effluent degradation under mesophilic conditions (35 ± 2 °C). Symbols refer to the experimental data and dash lines to the model predictions with k = 0.0356 ± 0.004 day−1 and α So = 327.9 ± 21 mL.
Water 14 00390 g002
Figure 3. Determination of (a) k m a x . V F A and (b) k s . V F A .
Water 14 00390 g003
Figure 4. Determination of k m a x . V F A and k s . V F A by using the integral method.
Water 14 00390 g004
Figure 5. Comparison of the results of the calculation method with the experimental data for VFA degradation at different feed flow rates. Symbols refer to the Monod kinetic model, and the dash line refers to the integral method.
Water 14 00390 g005
Figure 6. Estimation of nonbiodegradable fraction of total COD.
Water 14 00390 g006
Figure 7. Variation in methane production rate as a function of effluent biodegradable substrate concentration.
Water 14 00390 g007
Figure 8. Relationship between apparent rate constant (K) and influent substrate concentration.
Water 14 00390 g008
Figure 9. Relationship between apparent rate constant (K) and influent substrate concentration.
Water 14 00390 g009
Figure 10. Experimental r M . versus theoretical r M .
Water 14 00390 g010
Figure 11. Methane production rate as a function of substrate consumption rate.
Water 14 00390 g011
Table 1. Parameters for the kinetic study of anaerobic digestion phases.
Anaerobic PhaseParametersModel Used
HydrolysisData Feeding Concentration: 1000, 2000, 3000 and 4000 mg COD L−1 at HRT of 7 daysFirst order kinetics model
AcetogenesisFeed flow rates: 58, 19.3,11.6 and 8.29 L day−1Monod kinetic and integral method
MethanogenesisFeeding Concentration: 1000, 2000, 3000 and 4000 mg COD L−1 at HRT in a range of 1–7 daysMonod kinetic model
Table 2. Parameters for the kinetic study of anaerobic digestion phases.
Feeding Concentration, (mg COD L−1)Substrate Conversions Coefficient, α So (mL)First Order Rate Coefficient, k (Day−1)
10008.6820.1040
200051.5640.0440
300029.9740.0578
400024.2100.0643
Table 3. Kinetic constant of the Monod model and the integral method for syntrophic acetogenesis.
Feed Flow Rate (L Day−1) Monod ModelIntegral Method
K s , V F A
(g VFA L−1)
K m a x , V F A
(mg VFA mg−1 VSS Day−1)
K s , V F A
(g VFA L−1)
K m a x , V F A
(mg VFA mg−1 VSS Day−1)
58.00.2913.350.1812.66
19.30.1519.830.1019.17
11.60.1516.750.1216.18
8.290.1010.360.09010.43
Table 4. Theil’s inequality coefficient (TIC) values for the Monod and integral methods.
Feed Flow Rate (L Day−1)TIC
MonodIntegral
58.00.2030.201
19.30.0360.035
11.60.0590.057
8.290.0250.026
Table 5. Summary of kinetic parameters.
AD Phase Kinetic Parameters
Hydrolysisα So7315 mL
k0.0117 day−1
AcetogenesisMonod Model
K s , V F A
K m a x , V F A
Integral Method
K s , V F A
K m a x , V F A

0.10–0.29 g VFA L−1
10.36–19.83 mg VFA mg-1 VSS day−1

0.090–0.18 g VFA L−1
10.43–19.17 mg VFA mg−1 VSS day−1
MethanogenesisYM0.0645 L CH4 g COD−1
K4.03 L CH4 g−1 COD day−1
Publisher’s Note: MDPI stays neutral with regard to jurisdictional claims in published maps and institutional affiliations.

