1. Introduction
Nepal is located on the south side of the Himalaya Mountains, and the impact between the Tibetan plate and the India plate causes frequent and strong tectonic movement in this area. In addition to the highest mountain in the world, the tectonic movements also bring Nepal complex geological conditions and active seismic events. The plate collision increases the possibility of earthquakes, and developed joints and fractures in the rock mass make the slope structure more vulnerable, while the summer monsoon brings abundant precipitation. All these factors contribute to the occurrence of geo-hazards, especially landslides.
According to statistical data from Nepal disaster reports, there were 2942 landslides recorded between 1971 and 2012. During these landslides, 4511 people died, 1566 were injured, and more than 555,000 families have been affected. Moreover, due to the environment and climate change, 219 and 241 people died because of floods and landslides, respectively [
1,
2,
3].
On 25 April 2015, an M7.8 large earthquake happened in Nepal, which was followed by more than 250 aftershocks >M 3.0. More than 9000 people were killed in this catastrophe. A total of 4312 landslides were triggered during or after the earthquake, and 491 glacier lakes were found. Human lives and properties were endangered [
4].
This extreme seismic event produced a great amount of loose material and cracks all over the mountain area; thus, it will take less precipitation to trigger a landslide. After the extreme precipitation in the ongoing monsoon season, the occurrence of shallow landslides increases dramatically, and many of the antecedent landslides are reactivated. This condition also occurred after other earthquakes, such as the Chi-Chi and Wenchuan earthquakes [
5,
6,
7].
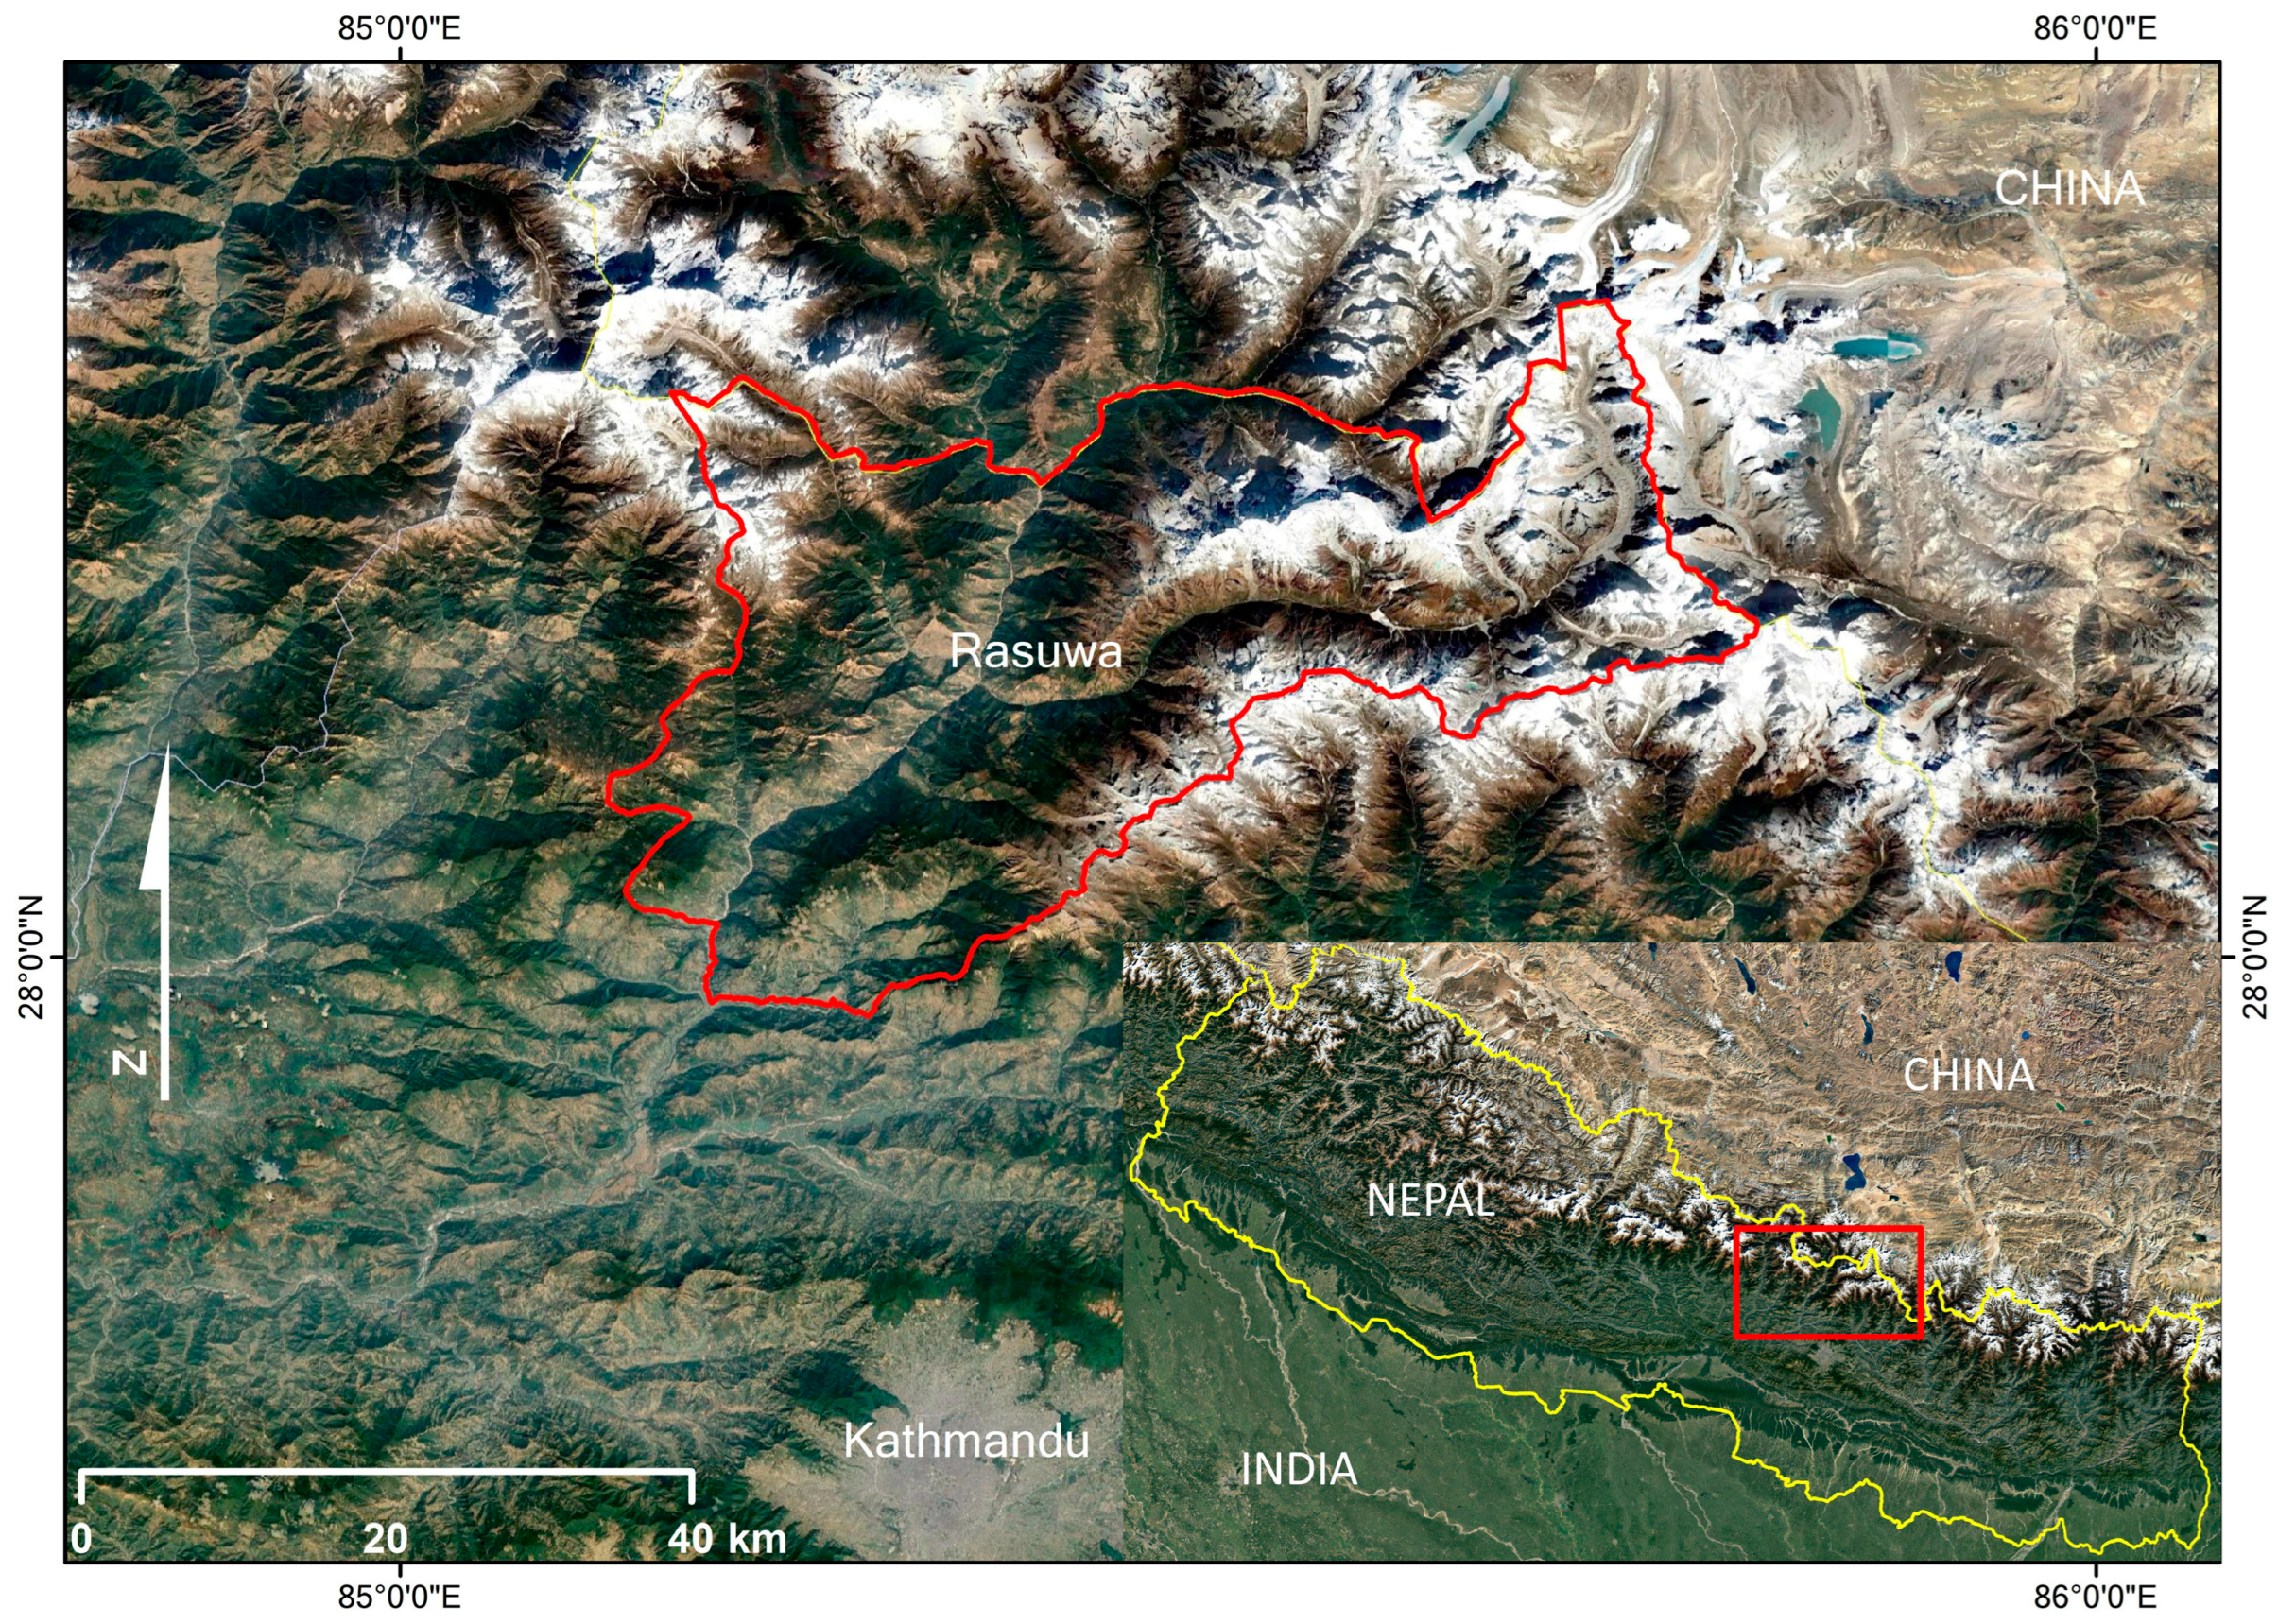
The Rasuwa area is one of the worst-hit regions (
Figure 1). The active tectonic movement of the Himalaya Mountains makes this region suffer from earthquakes and landslides, which leave abundant colluvial deposits on the steep slopes. These deposits can be easily reactivated in extreme conditions. More than 528 co-seismic landslides were triggered by the 2015 earthquake. Furthermore, during the monsoon season after the earthquake, a large amount of precipitation reactivates the unstable slopes, especially along roads and rivers. Several severe landslides happened in Rasuwa, including the largest debris avalanche, which destroyed the entire Langtang Village [
4]. More than 600 landslides were identified in field work. The infrastructure in this area is not developed, and several areas are exposed to shallow landslides.
The 2015 earthquake occurred years ago, but the risk of rainfall-induced landslides is still high in Nepal. The rainfall-induced shallow landslides threaten both human lives and economy development, especially in the Rasuwa area. Risk reduction measures must be taken in this region. A regional-scale rainfall threshold can be an effective method to reduce the geohazard risk.
Thresholds are widely used to indicate the stability or probability of the occurrence of landslides. There are two general methods of threshold definition: statistical analysis and physically based analysis. Statistical analysis is based on historical rainfall data and landslide events. The threshold is defined by the relationship between landslide occurrences and antecedent rainfall or cumulated rainfall. In the review paper by Guzzetti et al. [
8], rainfall thresholds for shallow landslides and debris flow in many parts of the world are discussed. They present rainfall thresholds of different times, different events, and different areas. Anna Roccati et al. define the rainfall threshold for shallow landslides in Italy using statistical methods [
9]. Antonello Troncone proposed a rainfall threshold due to the rising water table [
10]. There are also rainfall threshold studies for the Himalaya region. Galanti defined a rainfall threshold for shallow landslides in Italy based on statistical methods [
11]. Dahal & Hasegawa developed a rainfall threshold for the entire Nepal area. A total of 193 landslides and matched rainfall events are used in the analysis [
12]. Huang proposed three types of rainfall threshold through landslide susceptibility assessment and machine learning [
13]. Physically based analysis is based on slope stability and hydrological condition. The threshold is defined by modelling that considers soil physical properties, slope features, hydraulic change, and other related factors [
14]. Thiebes built a physical model combining hydrology and stability and put it into the early warning system of landslides [
15]. Jiaming He applied Transient Rainfall Infiltration and Grid-based Regional Slope-stability Model (TRIGRS) and Scoops3D models to rainfall threshold definition [
16]. There is no effective risk reduction method applied in the Rasuwa area, and no physically based rainfall threshold has been done in Nepal.
In this paper, the main problem is to define a rainfall threshold that is suitable for Rasuwa after the 2015 earthquake, but with limited data. A physically based model was used.
2. Model and Parameterization
2.1. Model Introduction
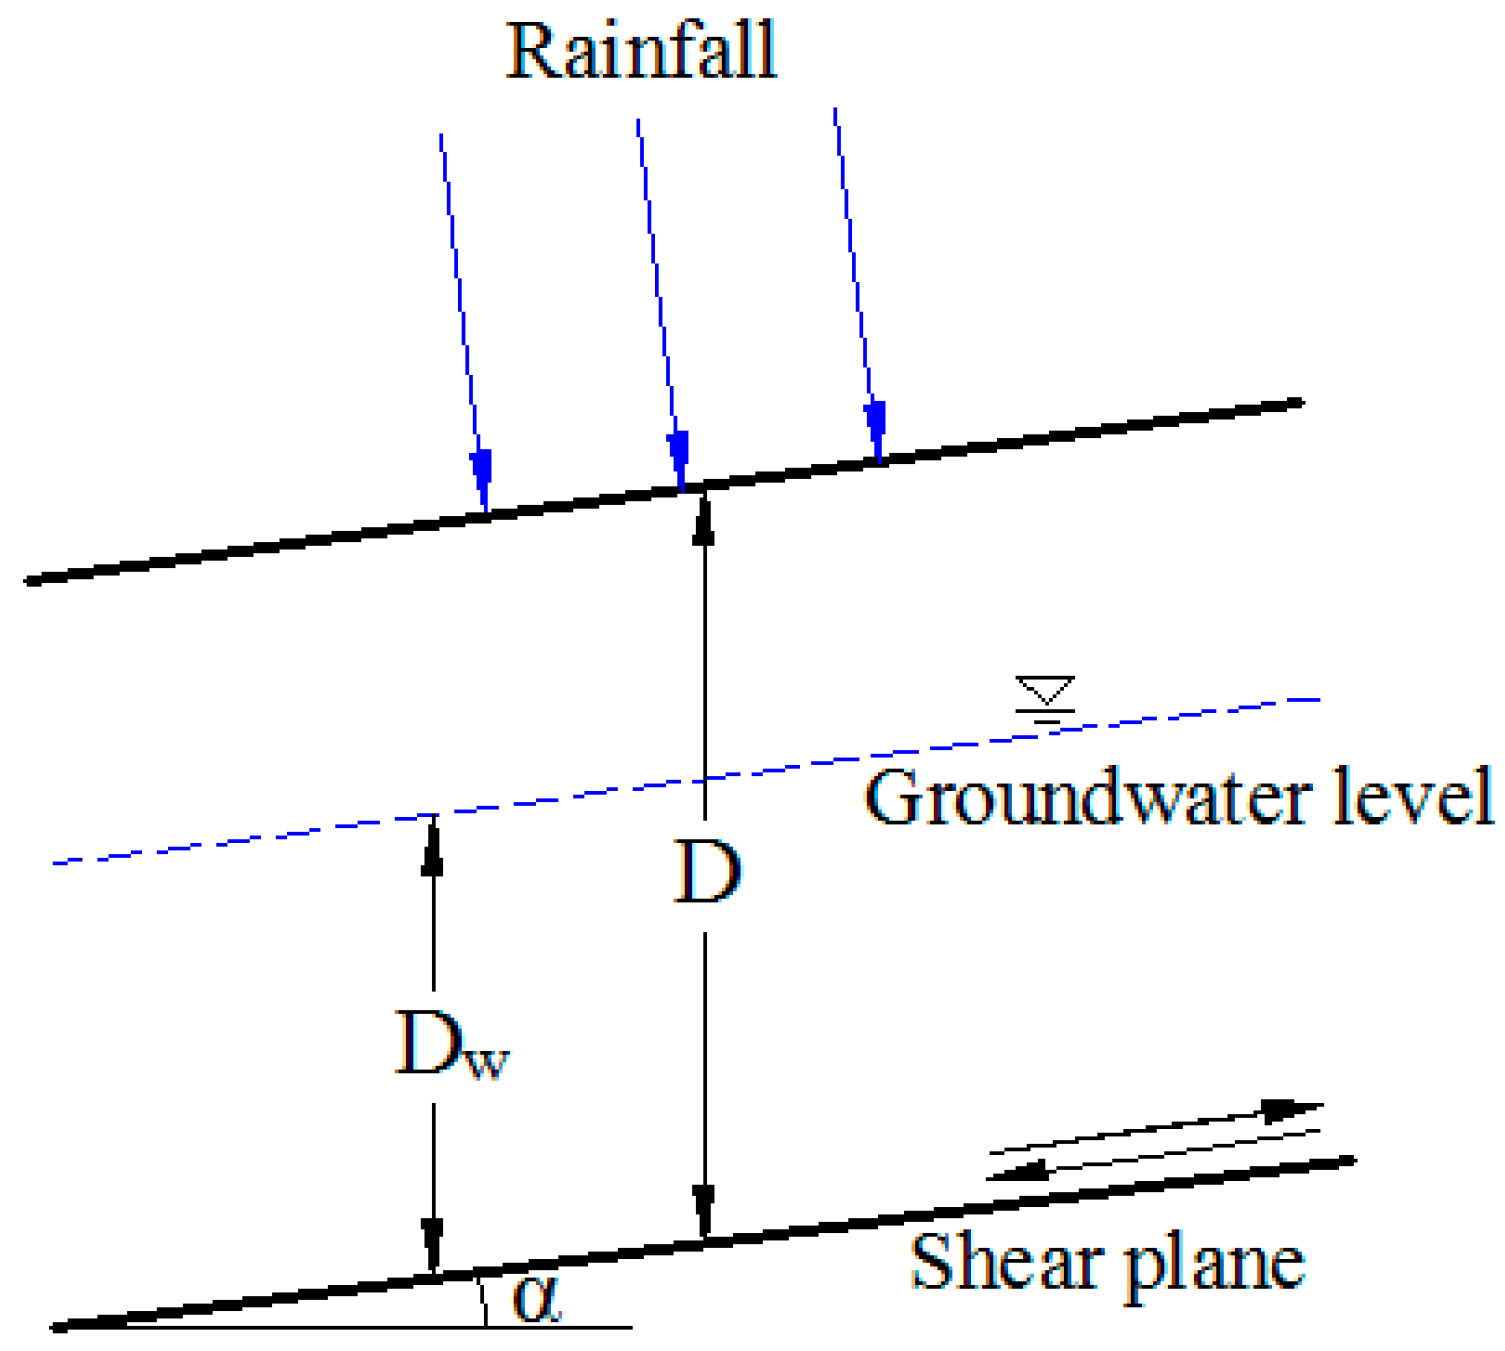
Rainfall duration and rainfall intensity are both key factors in triggering landslides, especially in the Rasuwa area. Rainfall-induced shallow landslides in this research aim to define the movements of slope material within 2 to 3 m of depth, triggered by precipitation. Hydrological factors are the main mechanism of these kinds of failures. For example, soil moisture increases the weight and reduces the shearing strength, and the groundwater level affects the pore water pressure (
Figure 2).
Rainfall directly affects the soil moisture and groundwater table, and other factors, such as overflow and discharge, are also influenced by rainfall. In the physically based model, however, only soil moisture and groundwater are considered.
The model used in our research consists of two separate parts: a dynamic hydrological model and an infinite slope stability model. These two models are closely connected because the outputs of the dynamic hydrological model are the inputs of the slope stability model.
The basic concept in the dynamic hydrological model is that there is origin water content and a groundwater level in any pixel. At any time step, pixels obtain precipitation and change their hydraulic conditions. When soil is saturated, there will be surface runoff and water transfer to the next pixel at the next time step along the hydraulic gradient. Another part of the water will evaporate according to the temperature. The water content of each pixel can be calculated as:
where
is the current water content,
is the water content of the last time step, Rain is daily rainfall, and
and
are the water that comes in and out of the pixels.
where
WL is the groundwater level and
is the time step.
where
is the lateral transfer index and
is the saturated coefficient.
where
is the lateral transfer flux and
WL(x) is the groundwater level in pixel
x.
The stability model is based on the infinite slope stability equation of factor of safety:
In the classic model, where FS is the factor of safety, c′ is the effective cohesion of the soil (KPa), is the internal friction angle (°), U is the pore water pressure, N is normal stress, W is weight, D is liner load, α is slope angle, and ψ is the angle between the loading and the vertical direction.
While in the out model, the weight is dynamic due to the water content, and the effective cohesion will also change.
where
are the gravity of the soil in the dry, saturated condition and
is the gravity of the water.
D is the soil depth and
Dw is the saturated soil depth.
Based on the equation above, the unstable pixels and unstable days can be simulated. The model can provide dynamic results using dynamic rainfall data, and the stability condition of each pixel and each day can be derived. The main source of error, i.e., the uncertainty of the data, is a huge problem, especially in a data-limited region such as Rasuwa. Therefore, the parameterization has been simplified to improve the accuracy.
2.2. Parameterization
Due to data availability, the parameterization has to be simplified. The soil-related parameters also come from soil tests and literature values. Soil samples were taken in seven different locations in the study area. Grain size and water conductivity tests were done with the help of Tribhuvan University. The test results are shown in
Appendix A. However, these tests are not detailed enough to provide all the soil related input. According to the soil water characteristic model proposed by Saxton [
17], several parameters can be estimated based on field tests results.
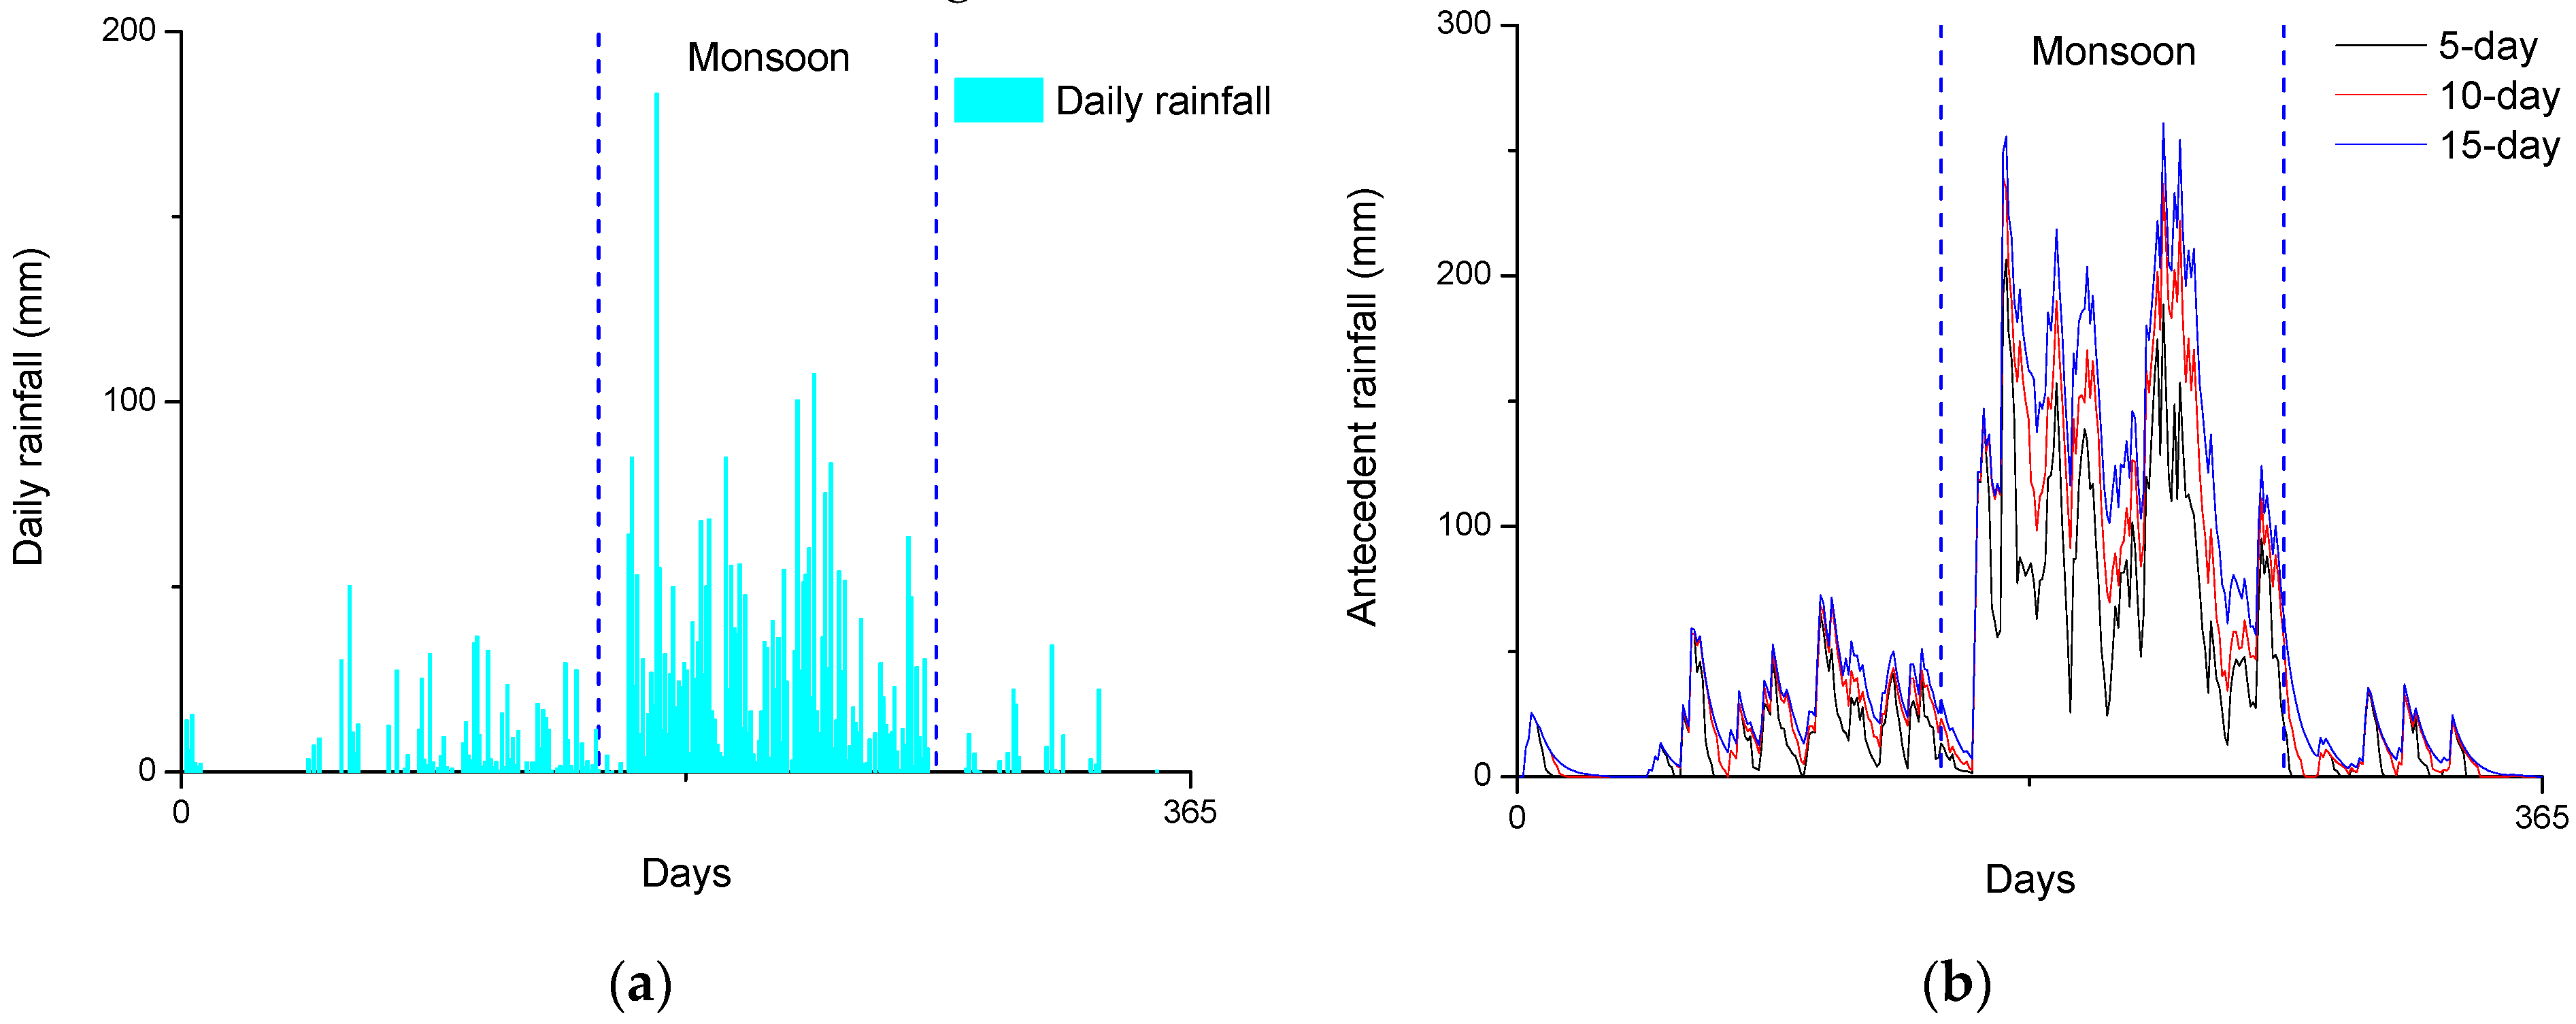
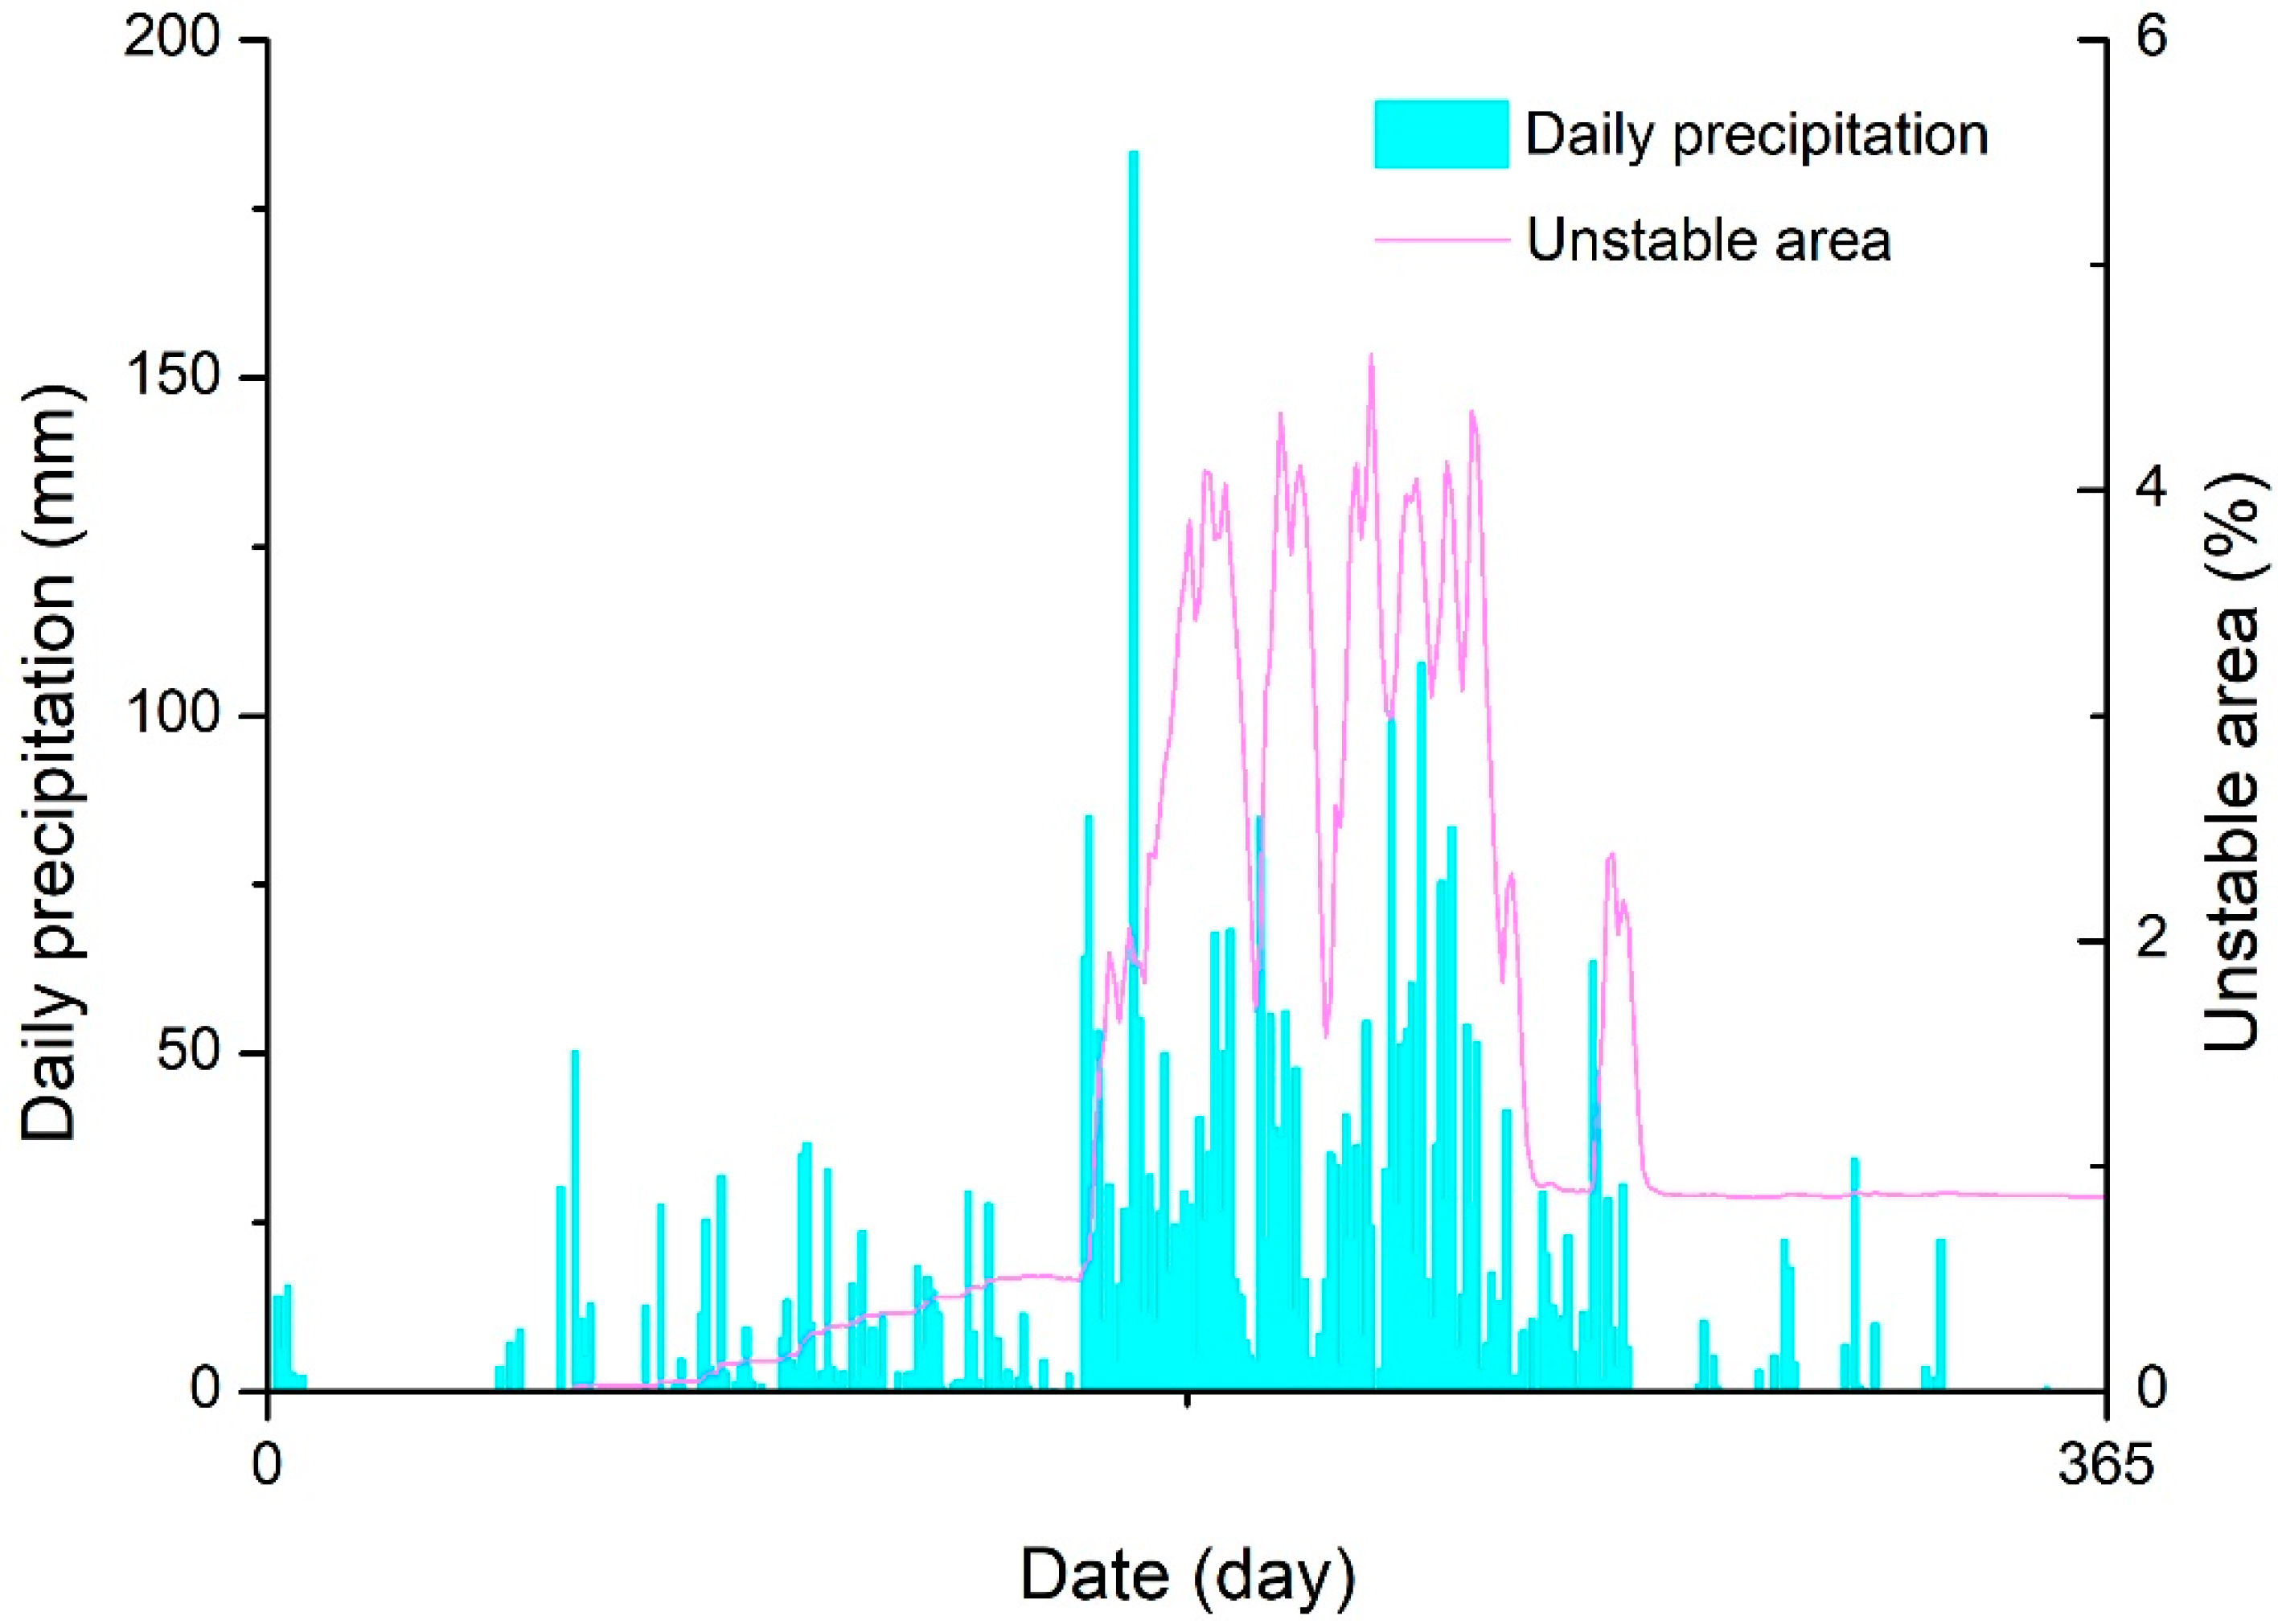
Rainfall data were derived from the Global Precipitation Measurement (GPM) database of 2016. The GPM data are open-access rainfall data with decent temporal and spatial resolution (maxima 0.1° and 0.5 h). In order to take the antecedent rainfall into consideration, the antecedent rainfall was calculated based on the equation below [
18]:
in which
is antecedent rainfall,
is the daily rainfall of the nth day before the current day, and k is a constant related to outflow. The
k is set at 0.84, which comes from a study in the US [
19,
20]. Daily rainfall and different antecedent rainfall data were used in the model (
Figure 3).
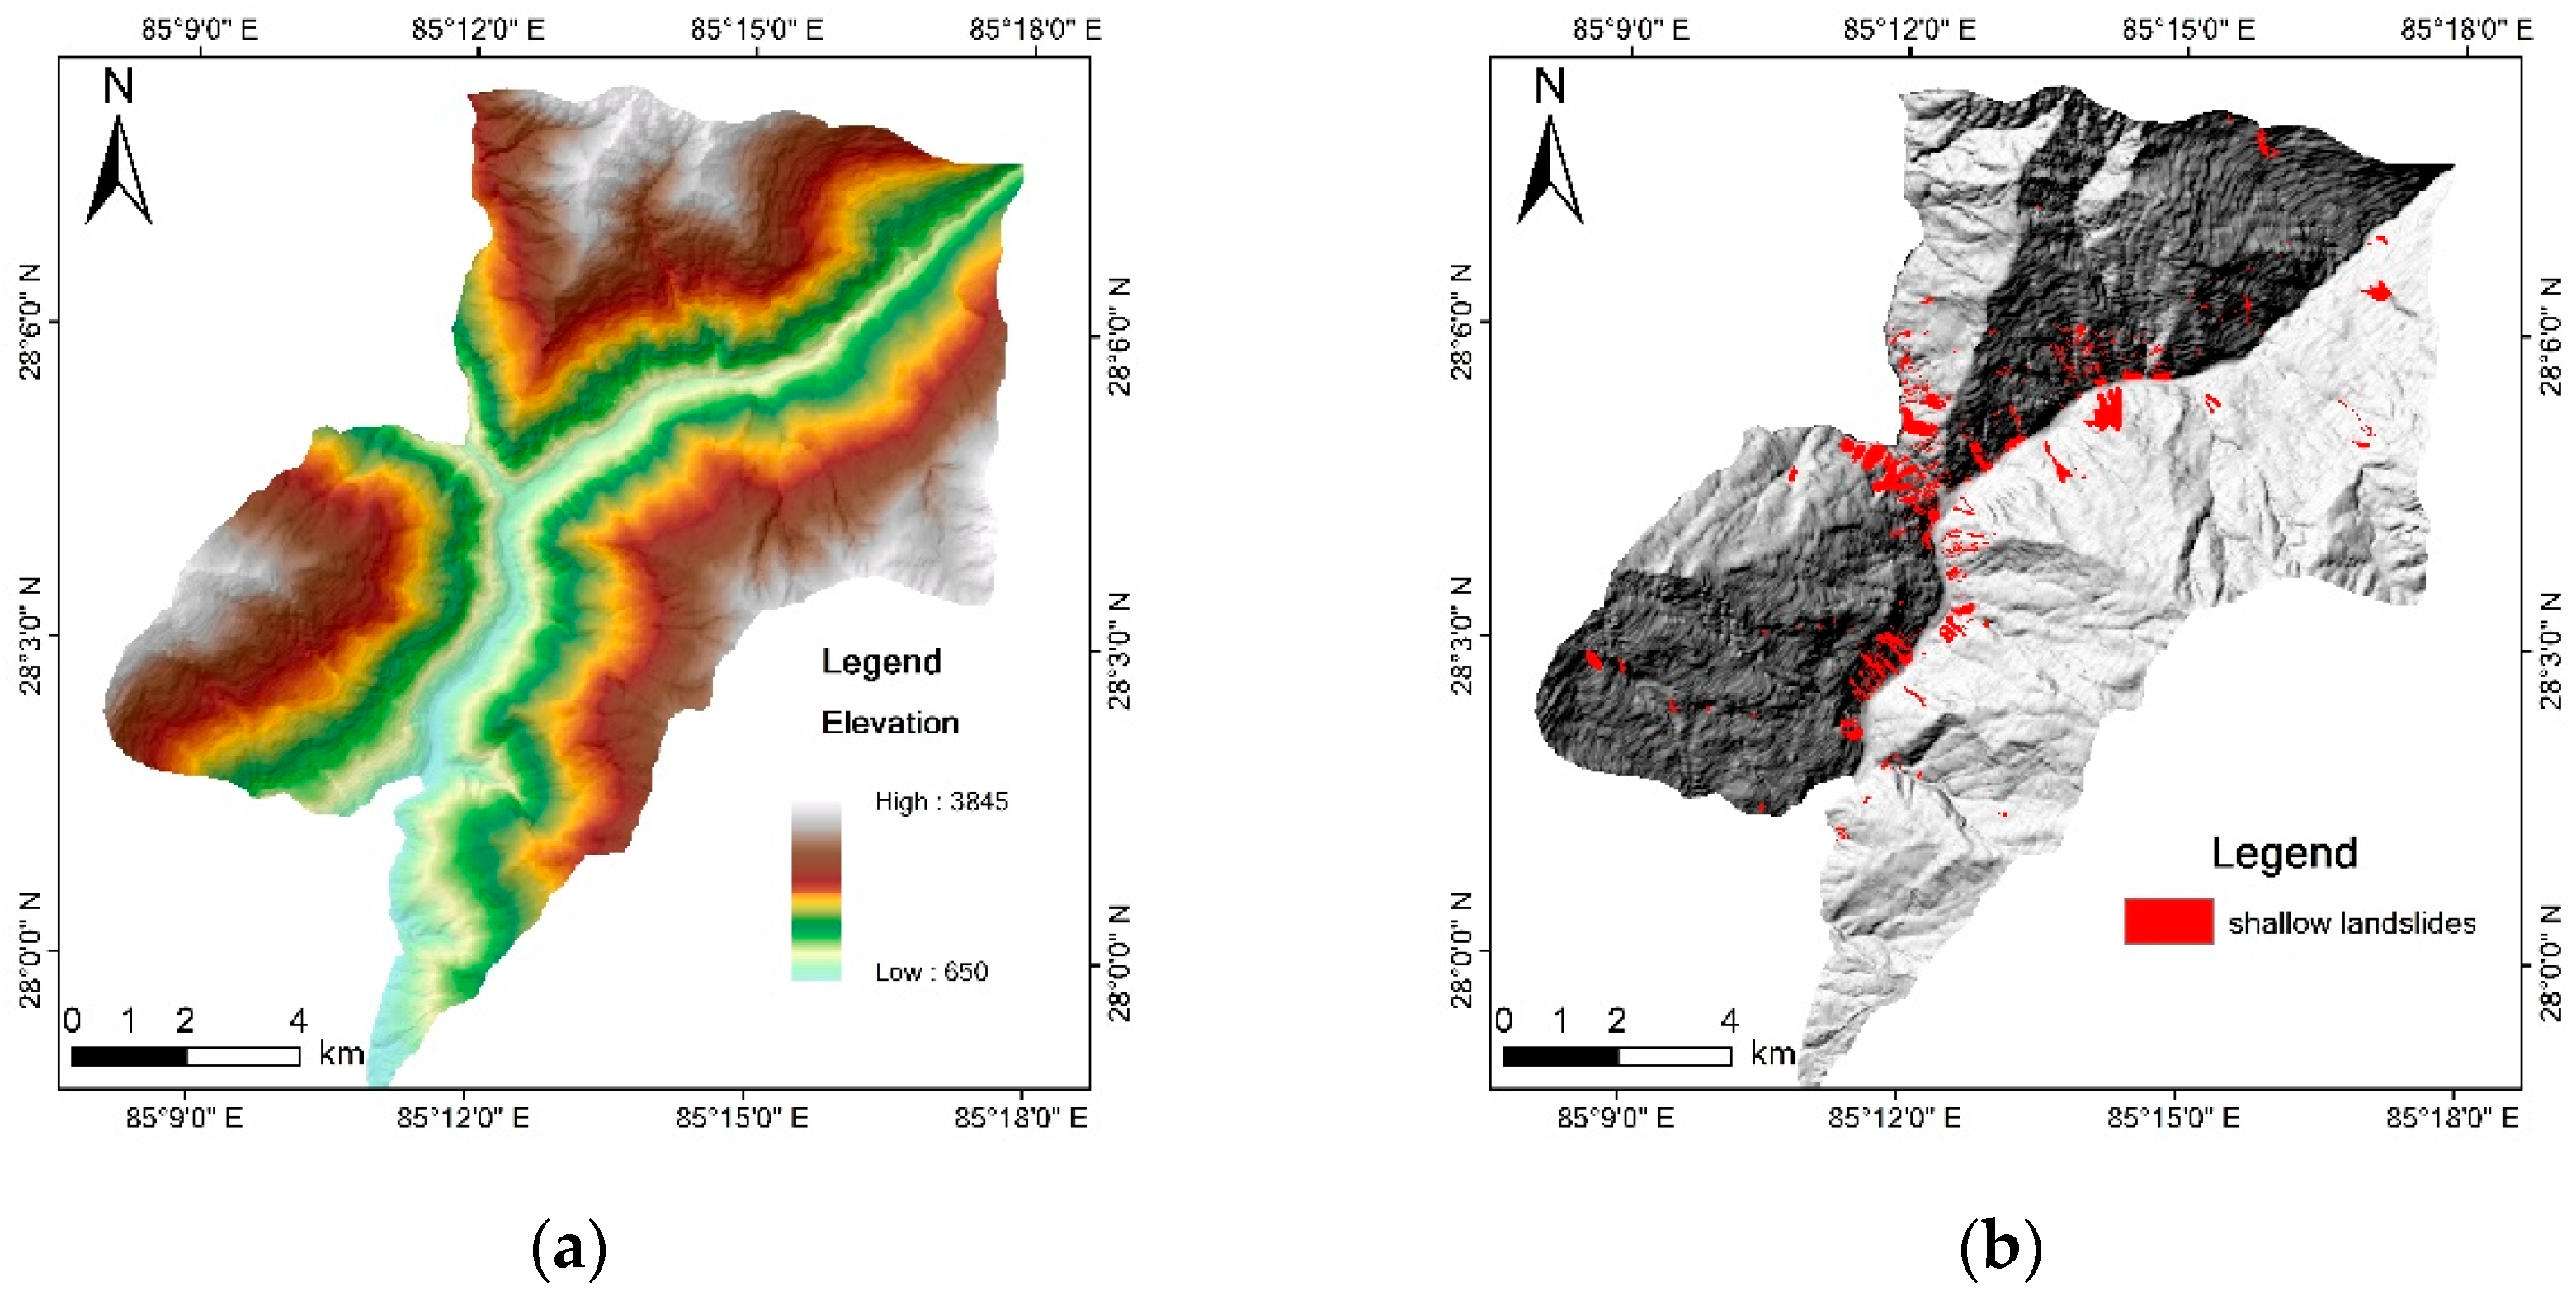
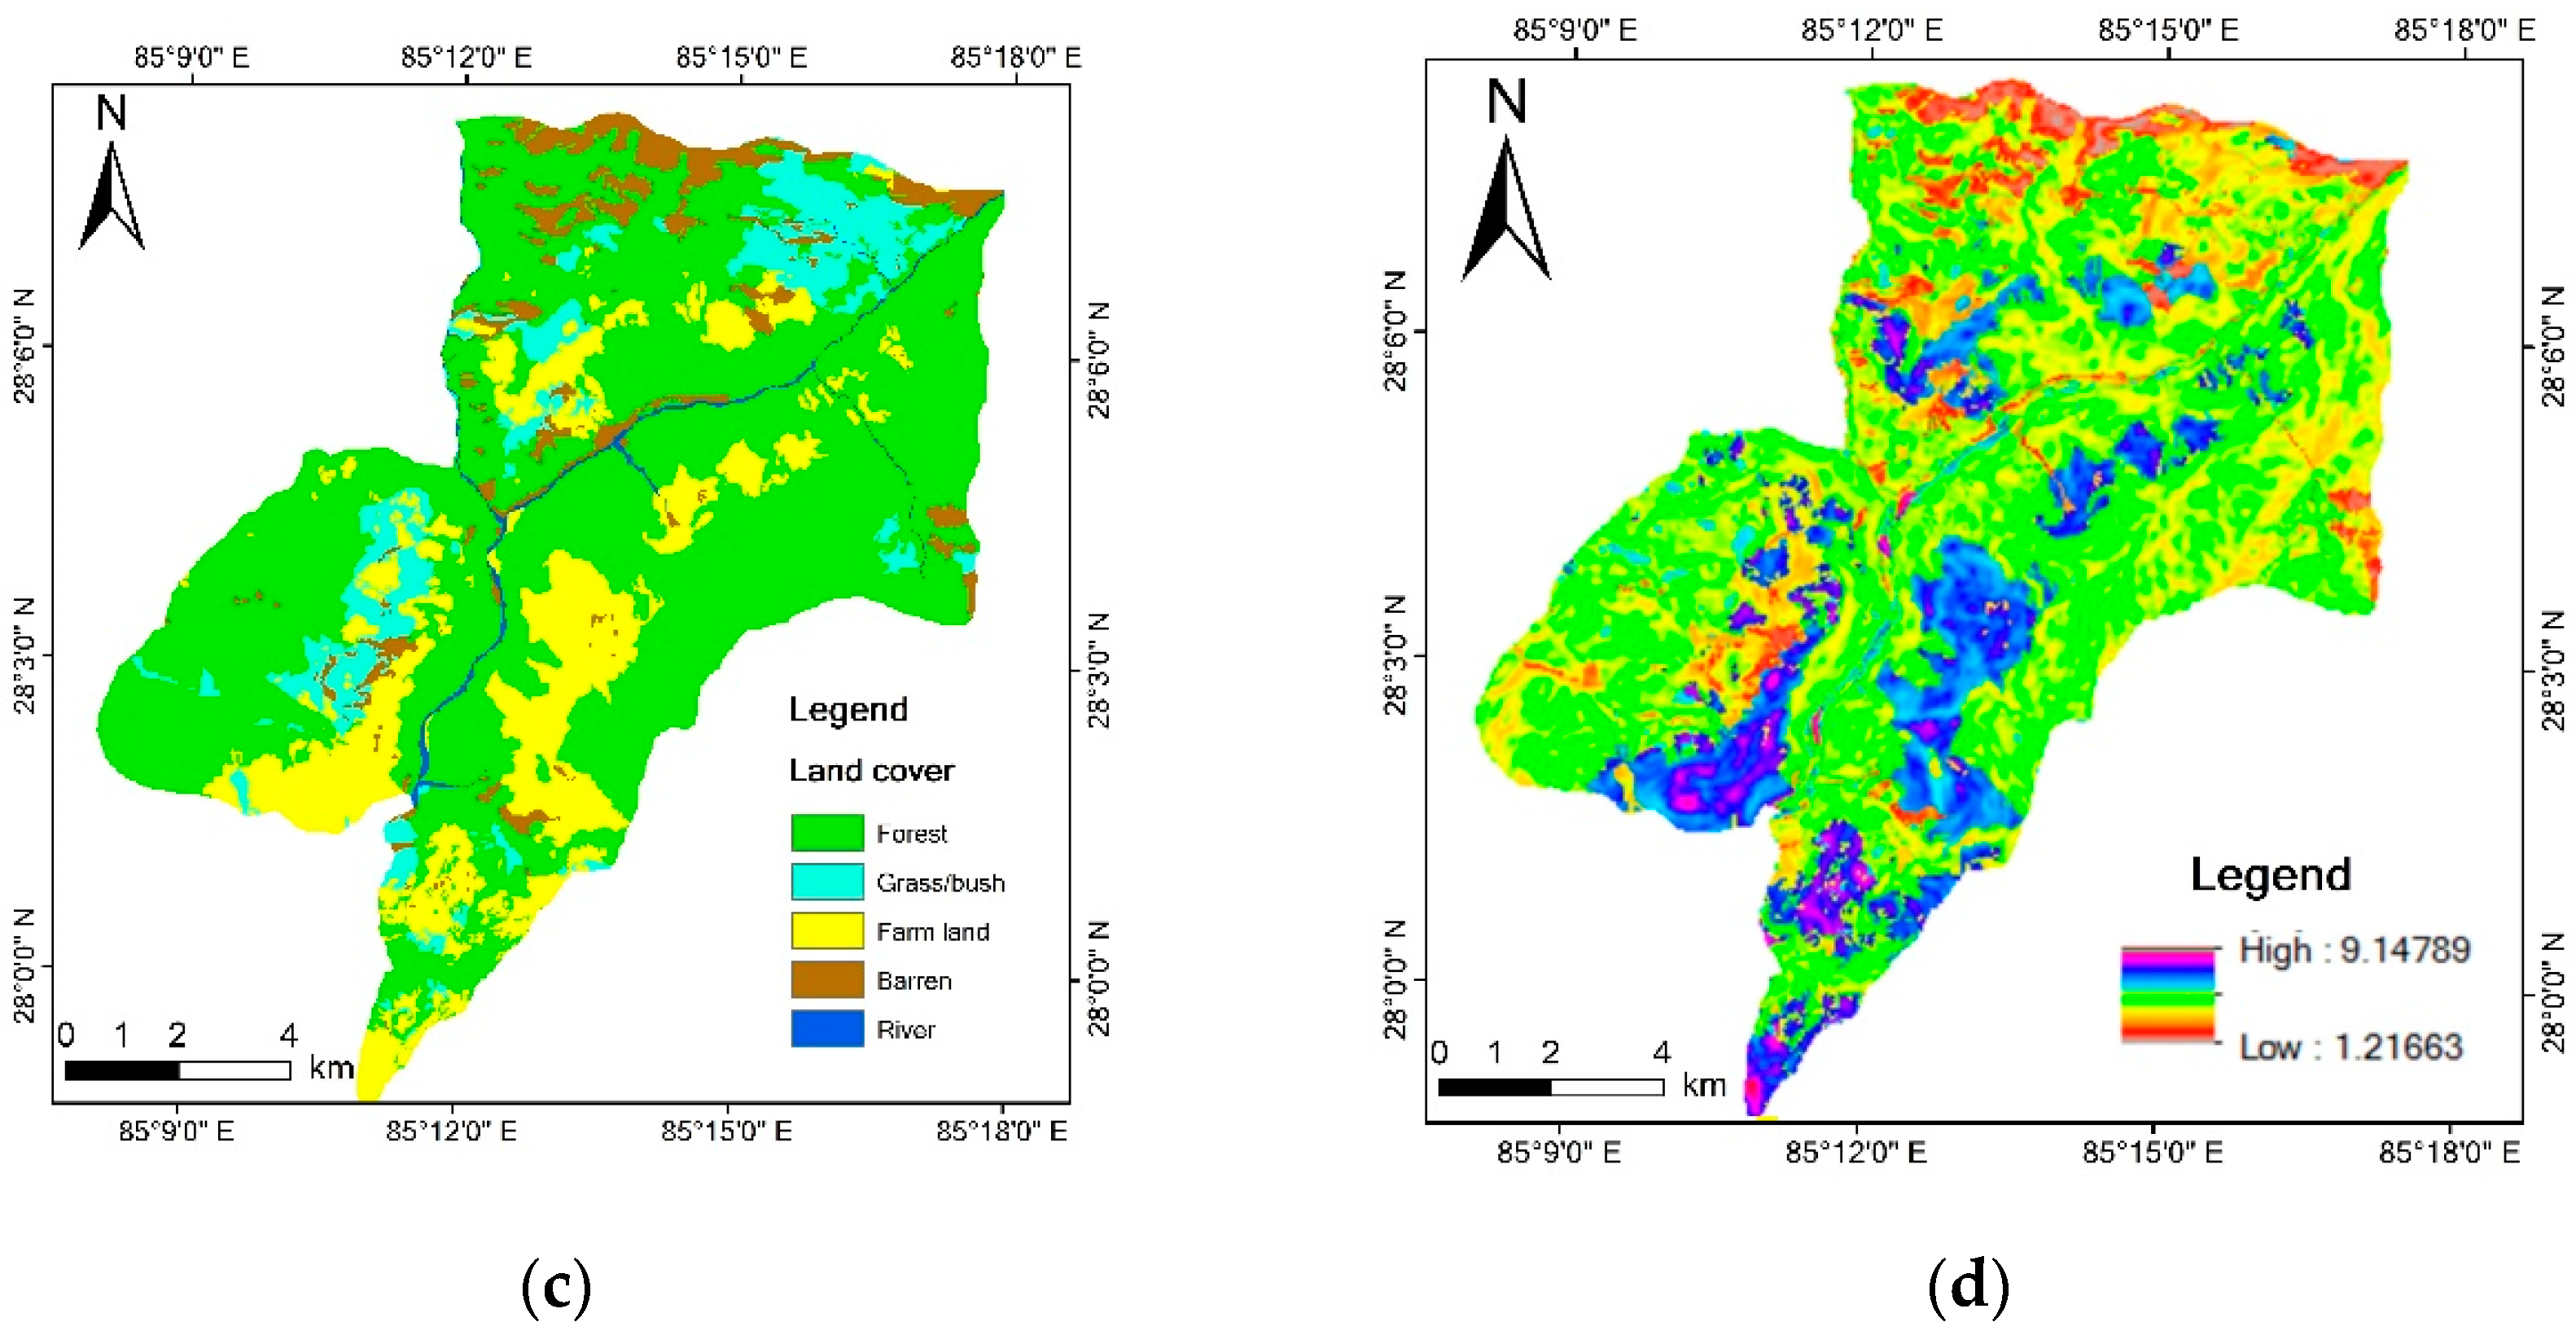
The DEM data were derived from the 1:50,000 topographic map (Survey Department Government of Nepal). The landslide inventory and land cover map were interpreted from remote sensing images and calibrated in the field investigation. Soil depth was simulated based on Equation (8).
where
SD is the simulated soil depth (m),
a–f are calibration constants (-),
is the distance to the nearest coast (m),
is the distance to channels,
S is the slope index (-),
C is the profile curvature (m-1), and
W is the wetness index.
The base maps used in the model are shown in
Figure 4.
3. Results
3.1. Model Result
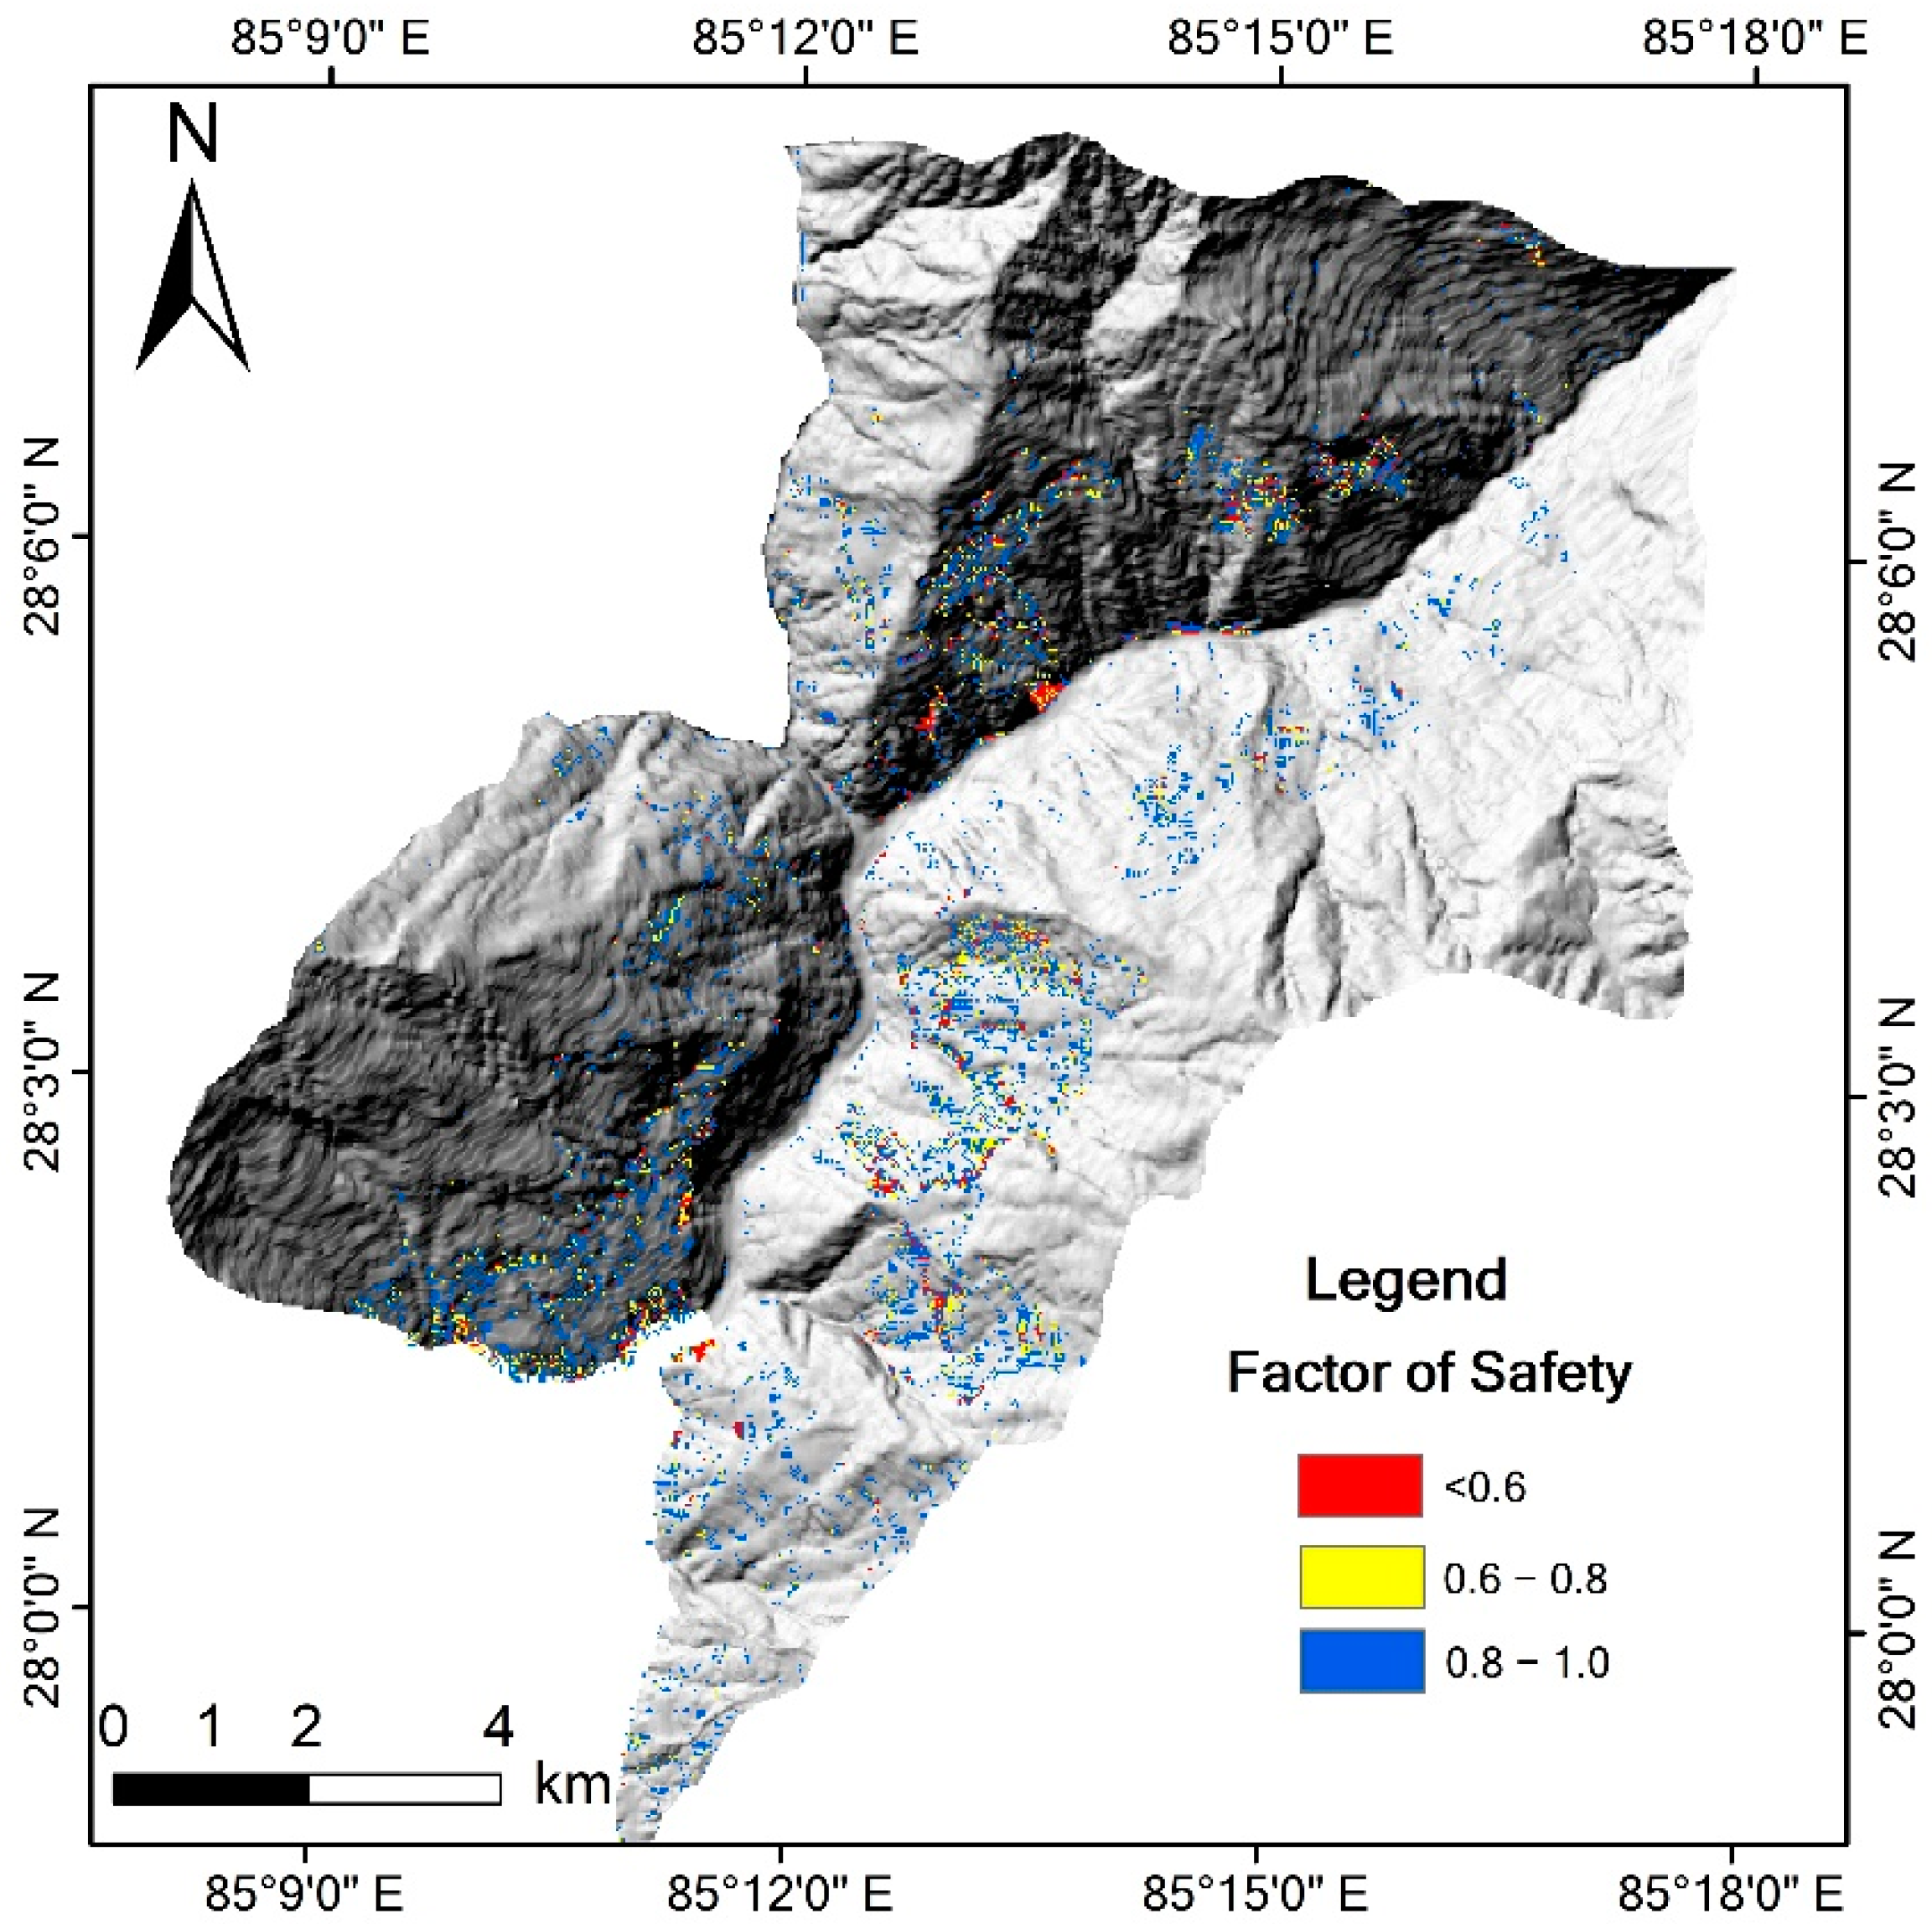
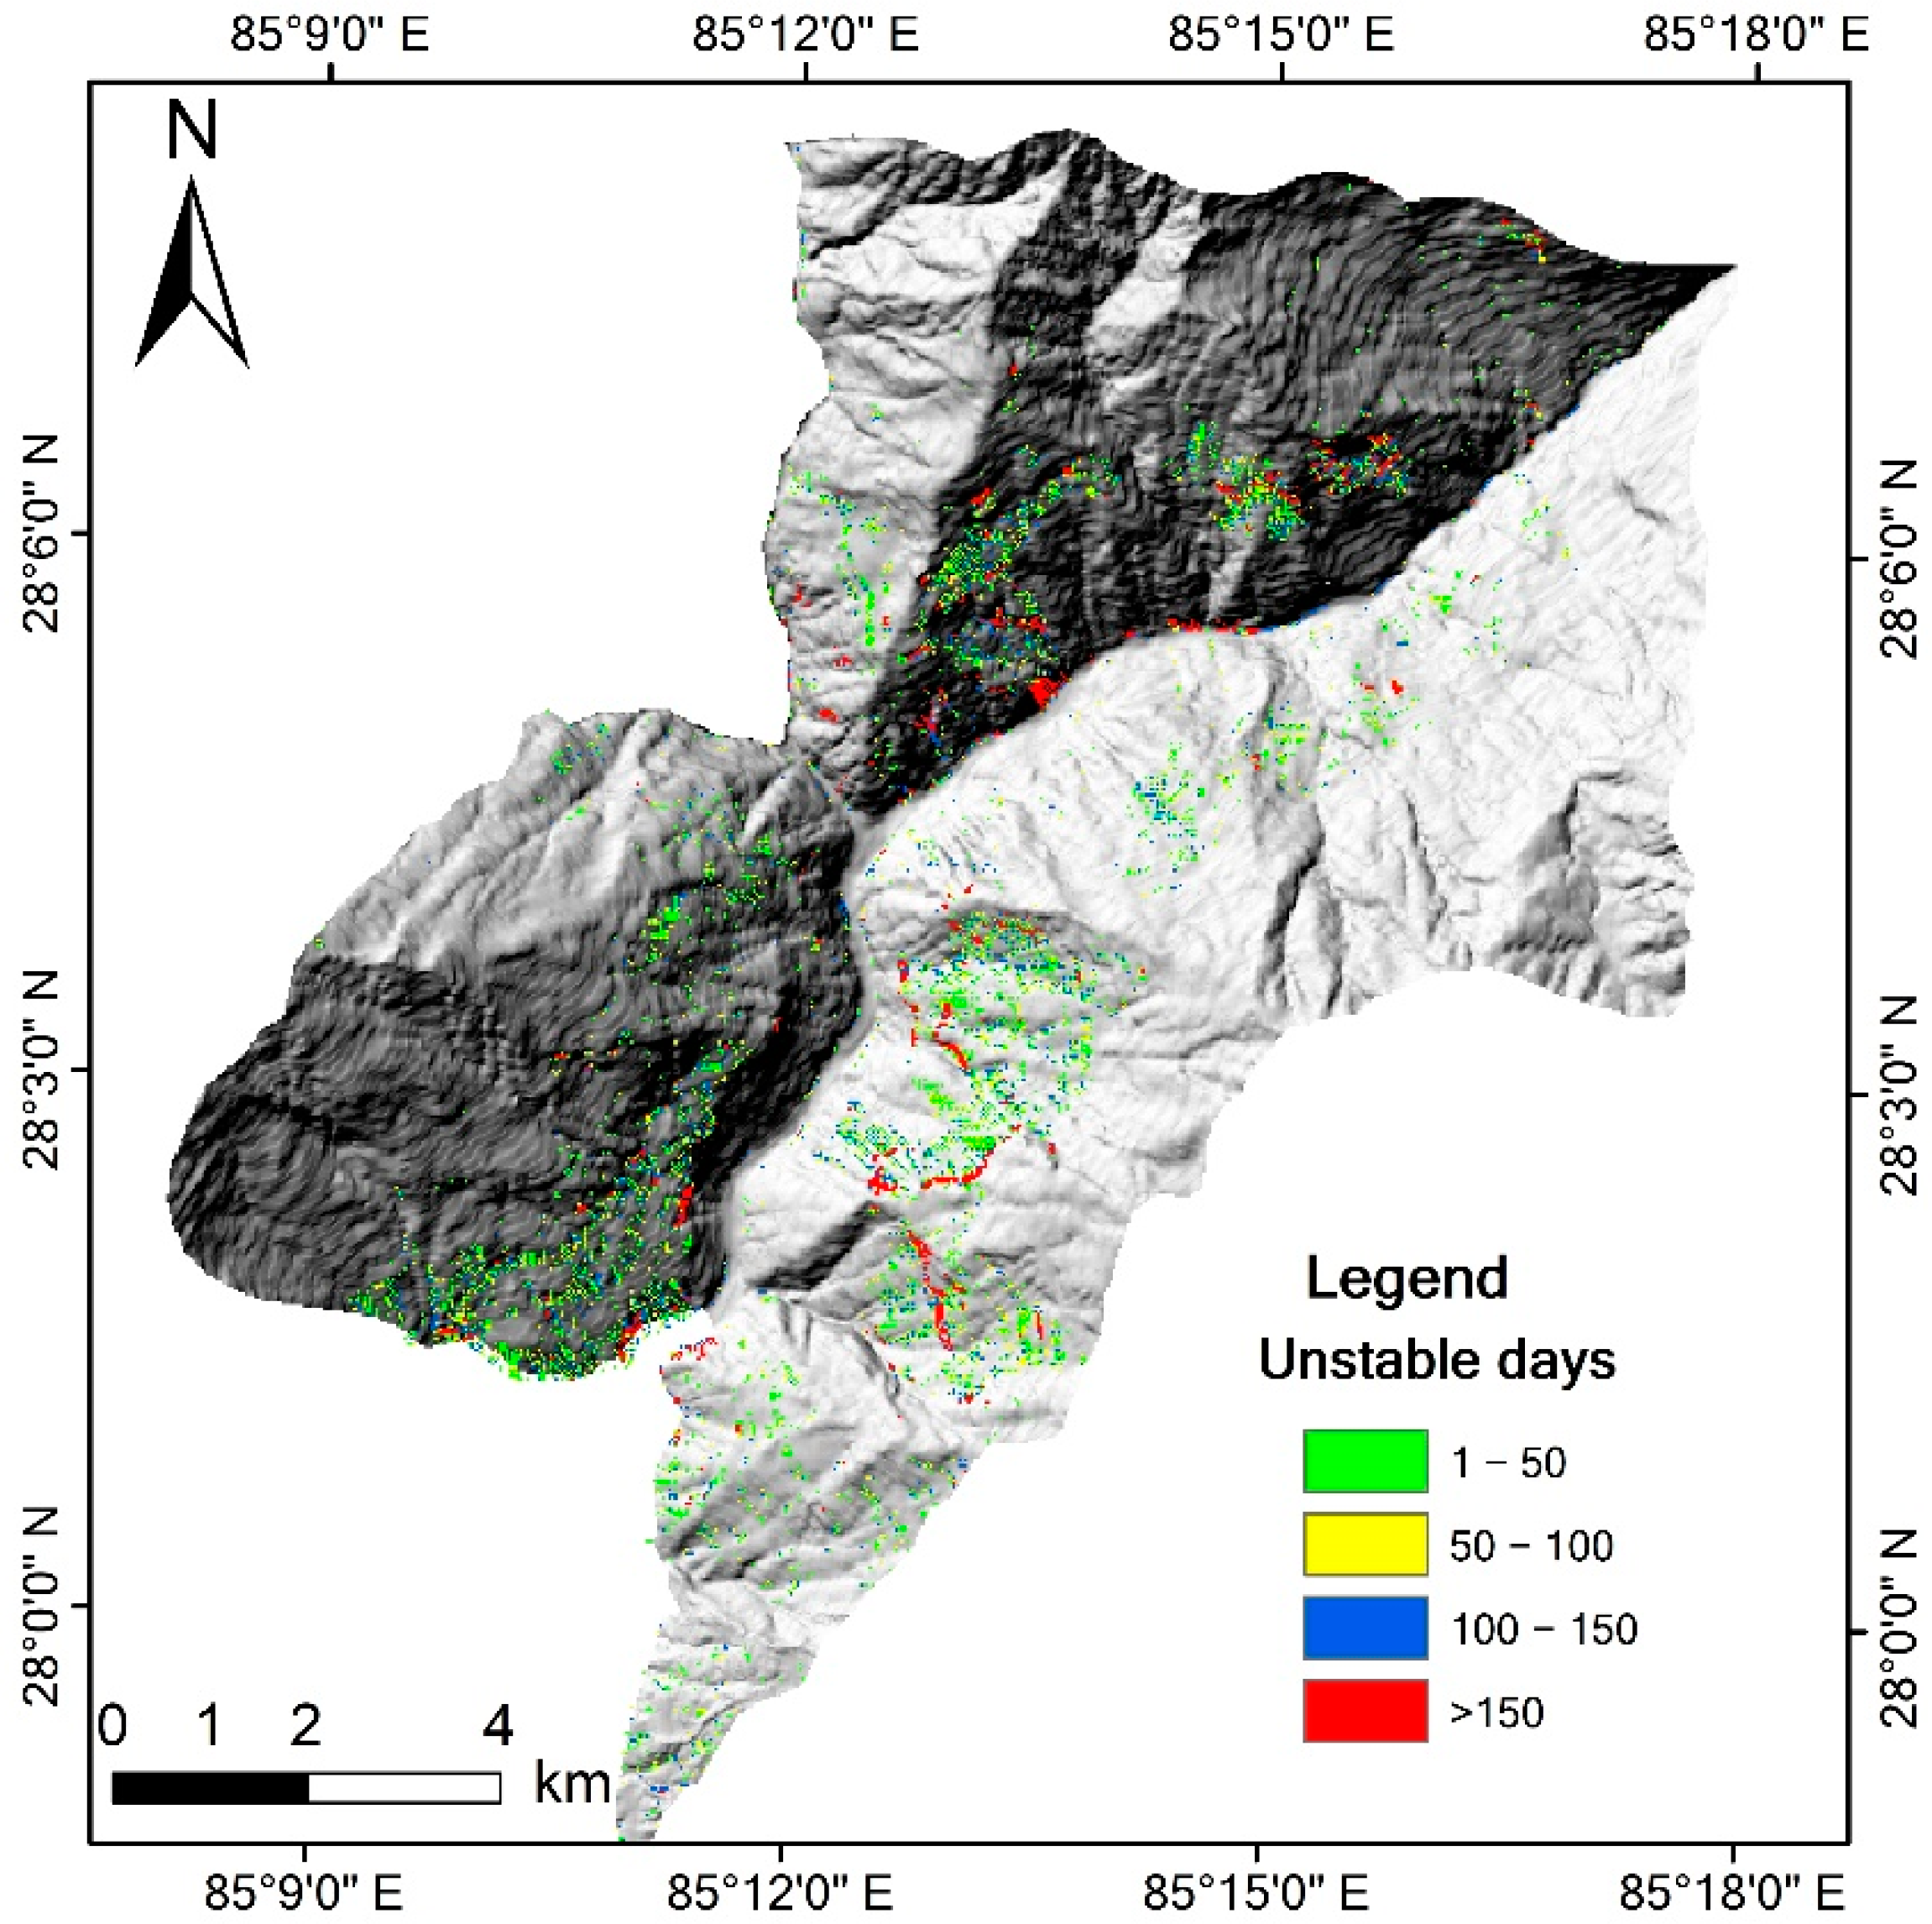
Except for the parameters mentioned above, the modelling setup takes only one layer above the slip surface into consideration. Only rainfall and vertical fluxes are considered in the water level calculation. The stimulation time step is set as 1 day, and 365 steps in total are used to simulate the whole year. The rainfall data of 2016 were used in the modeling because the only validation source available is based on the field investigation in 2016. Part of the model’s outputs are shown in
Figure 5,
Figure 6 and
Figure 7.
In this rainfall condition, a maximum of 7642 pixels (6.87 km2) become unstable, which accounts for 4.51% of the whole study area. About 69.93% of the area has a minimal factor of safety (FOS) value between 0.8 and 1.0, and 27.88% between 0.6 and 0.8. Only 2.18% of the area has a FOS lower than 0.6. Further, 46.88% of the unstable area has unstable periods less than 50 days, 20.93% of the area has unstable days between 50 to 100 days, and 18.32% of the area has unstable days between 50 to 100 days. The most dangerous region has more than 150 unstable days. This area has mainly old co-seismic landslides that can be triggered easily by rainfall during the entire monsoon season, which corresponds to the landslide situation of the Rasuwa area.
3.2. Threshold Definition
The rainfall threshold is an effective method of landslide risk reduction, and it can also be an important component of landslide Early Warning Systems. Some work has been done on threshold research in the Himalaya region [
12,
21]. The existing study mainly focused on the intensity-duration of the rainfall threshold using statistical methods.
In the empirical intensity-duration threshold definition, historical landslides and matched rainfall datasets are needed. The specific rainfall intensity and duration of actual landslide dates are plotted in the I-D coordinate system. Threshold curves are defined based on the boundaries of the scatters. All these studies were based on historical landslide inventories and historical rainfall data, while none of these data are available in under-developing region such as Rasuwa.
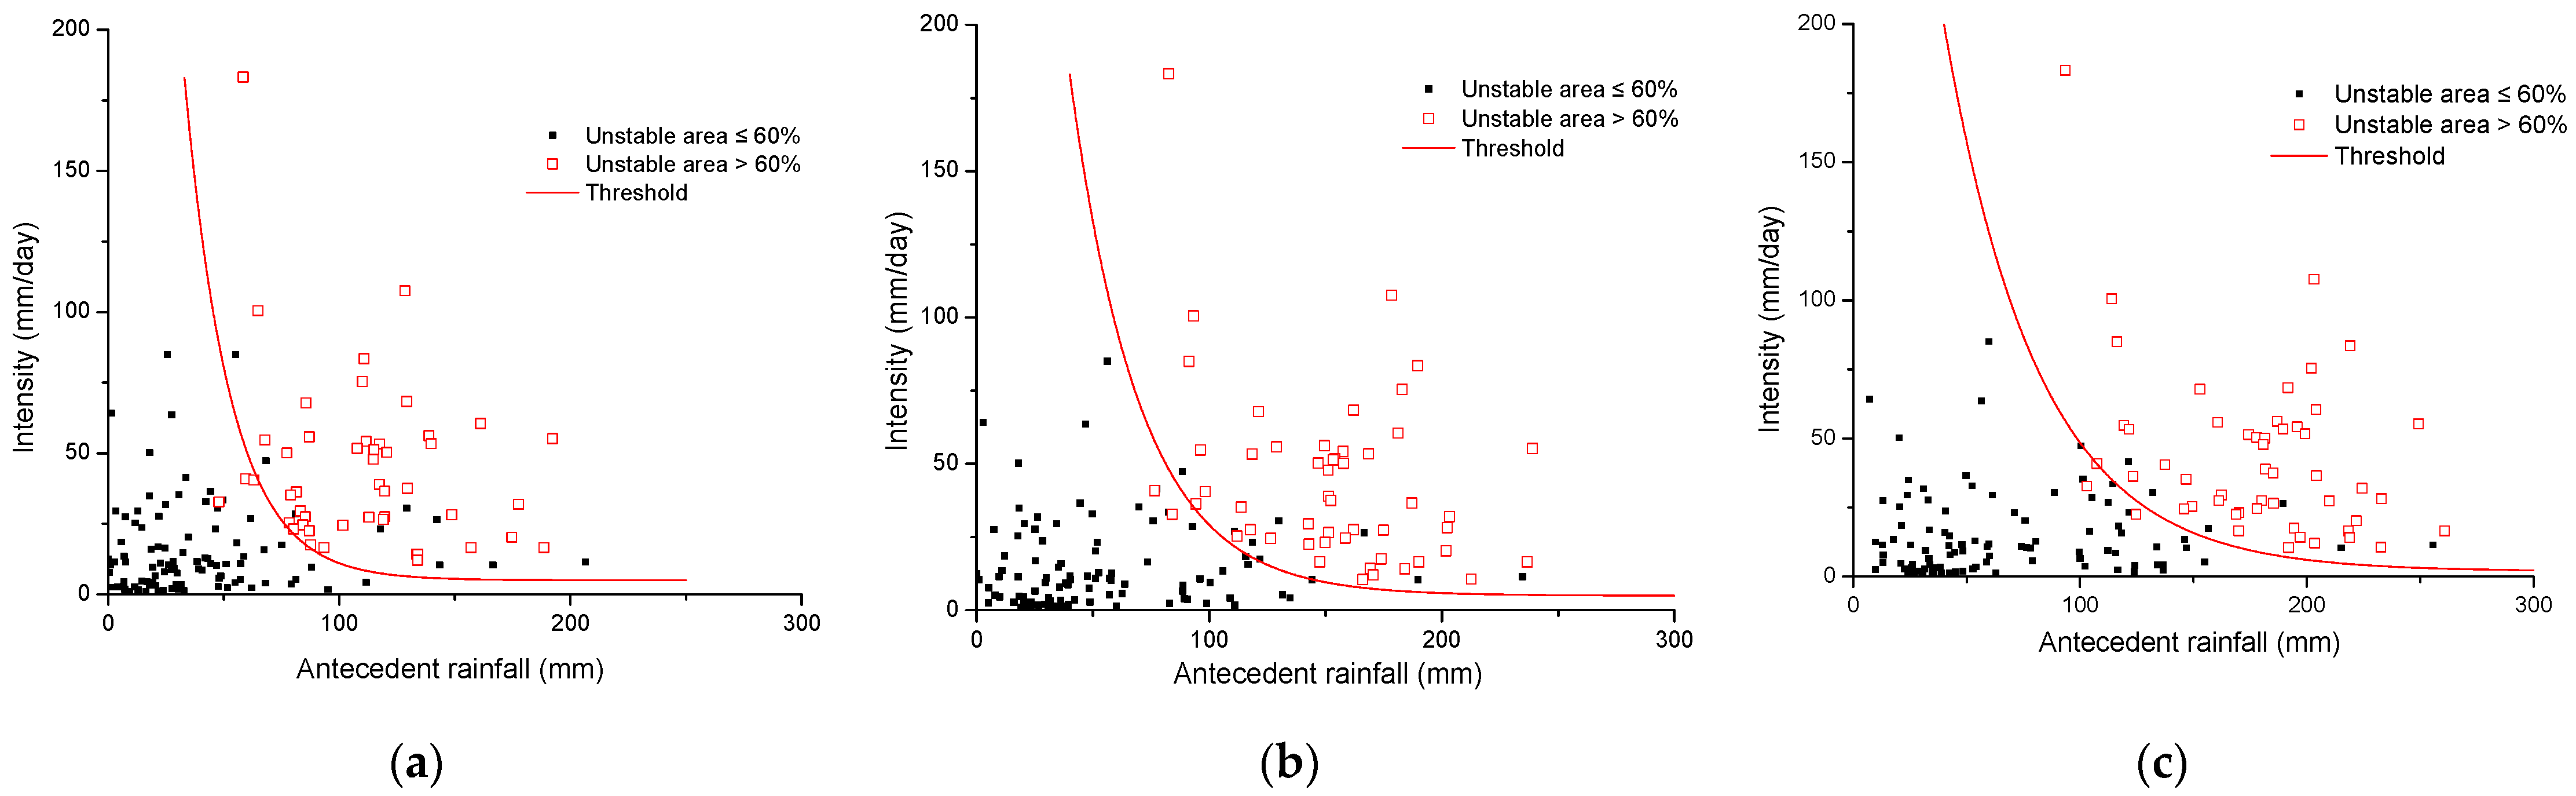
Intensity-Duration is not the only part of the rainfall threshold definition. Antecedent rainfall plays an important role in the triggering of shallow landslides. The soil moisture and groundwater after rainfall stops has a delayed effect because of the soil hydrological characteristics. This kind of delay means the antecedent rainfall will influence the factor of safety in the current situation.
In the year 2016, daily rainfall data were analyzed and 159 rainfall events were distinguished. In order to define the rainfall threshold without a precise landslide database, the output of the physically based model stimulation for the year 2016 was used. The FOS map was derived with corresponding rainfall events. The scatters of daily rainfall and antecedent rainfall are plotted (
Figure 8). The distribution of the three groups of scatters was used as the basis of the threshold definition. The threshold lines were defined using the nonlinear fit of exponential function. According to the field investigation, a total number of 4.2 km
2 landslides were identified. Thus, the threshold boundary was defined as when the unstable area was larger than 4.2 km
2, which is about 60% percent of the total landslides.
The threshold equations could then be defined as follows:
where
I is the average daily rainfall and
Rn is the antecedent rainfall of n days.
Data for 60 rainfalls and the corresponding landslide conditions (14 landslides occurred) of 2016 were used to validate the rainfall threshold. The results are shown in
Table 1.
The table shows that there are more false positives than false negatives in the results, which means more false alarms than missing alarms. More work can be done to improve the results with abundant data. Under limited conditions, the validation results reveal that the 15-day antecedent rainfall has the best performance with an accuracy of 88.33%.
4. Discussion
The research was hindered by the lack of appropriate data: rainfall records, historical landslide occurrences, soil data, and digital elevation data were all not optimal for this remote study area in Nepal. Parameterization of the physically based model was a difficult task in this study due to the lack of reliable information. In addition to the parameters from laboratory tests, all other parameters were derived from literature or defined by estimation and field observation. These assumptions increased the uncertainty of the modelling. The study would provide more realistic results if better soil and rock mechanical characteristics could be obtained, as well as other landslide-related information.
Land cover plays a very important role in this model. Further study can be done to analyze the vegetation influence in the Rasuwa area because ecological methods are cost-effective methods for landslide hazard reduction. There is a problem of groundwater level: underground recharge is ignored in the model and infiltration must be higher than reality to maintain the groundwater level at a reasonable level. A relative groundwater table may be helpful in the water stimulation, which can be used to do the validation for the hydrological model. The stability model used the infinite slope model equations and fixed cohesion. Actually, cohesion is significantly influenced by soil moisture. In this study, the cohesion is linked with soil moisture with the relation derived from literature. The relation varies a lot among different soil types and clay content. This modification can increase the FOS sensitivity with rainfall.
About 6.87 km2, or 4.51%, of the whole study area become unstable under the 2016 rainfall scenario, while in the 2016 monsoon, the rainfall-induced landslides only occurred in an area of 4.20 km2 in the study area. The model results have the problem of overprediction, which leads to more False Positives and less False Negatives. Therefore, the practical application of using this threshold as a basis for Early Warning Systems is limited. More work is needed to calibrate it.
The thresholds are not constant values; they may change after major events, such as earthquakes [
22]. This kind of change is mainly because events destroy the soil and rock structure and leave fractures on the slope surface. The fractures increase the infiltration speed and static water pressure. It is difficult to take this factor into consideration in the physically based model, which means the model results will not significantly change after extreme events, as in reality.
The results of the modelling only represent the theoretical instability using the factor of safety; there are two measures to improve the results to relate this value to realistic instability. Regional landslide mapping and accurate triggering time should be acquired to improve the performance of the physically based model. Enlarging the rainfall dataset is also helpful.
The thresholds are the initial part of EWS. Detailed warnings, such as using the results to derive the frequency of landslides in order to determine hazards (probability of occurrence) and risk, are difficult. The uncertainty of the geotechnical parameters should be taken into account, and this needs large-scale, detailed field work that will cost a lot of resources. Consequently, the current product can be used in local-scale general warning and prediction linked with weather forecasts.
A few suggestions for future work follow.
- (1)
Further study can be done to analyze the vegetation influence in the Rasuwa area because ecological methods are cost-effective methods for landslide hazard reduction.
- (2)
Validation and calibration work are needed to relate the thresholds to actual landslide instability.
- (3)
More emphasis should be given to keep records of the location and dates of landslide events, and a national landslide database should be established.
- (4)
The threshold is only one part of the EWS. Monitoring, alerts, and social responses are needed to establish an integrated EWS.
5. Conclusions
Rainfall thresholds as a component of a regional Landslide Early Warning System using satellite-derived rainfall in combination with physically based landslide initiation modelling have been developed under the condition of very limited data.
The main mechanism of rainfall-induced landslides is the rainfall that saturates the soil layer, reducing the shear strength. The resistant force decrease until less than driving force, and the slope become unstable. In this process, rainfall, soil, and topography all play important roles. In the physically based model, several assumptions were made to simplify the simulation. The modelling setup was changed to only one layer above the slip surface. Each soil layer was divided into a saturated zone and an unsaturated zone, and the water level was calculated based on the water level from the last time step and soil moisture change. The only source of water was rainfall, and only vertical fluxes were considered; underground recharge and river recharge were ignored. Buoyancy was the only water pressure considered in the infinite slope model, while in reality, static and dynamic water pressure also play important roles in slope stability.
Rainfall thresholds were defined based on physically based modelling. A total of 60 rainfall events were used to validate the threshold, but no validation was done to test the model itself. The 15-day antecedent rainfall has the best performance.
Author Contributions
Conceptualization, B.G. and X.P.; methodology, B.G.; software, M.X.; validation, B.G. and M.X.; field investigation, B.G.; resources, B.G.; data curation, M.X.; writing—original draft preparation, B.G. and M.X.; writing—review and editing, X.P. and T.L.; visualization, B.G.; supervision, X.P.; project administration, X.P.; funding acquisition, T.L. All authors have read and agreed to the published version of the manuscript.
Funding
This research was funded by the Youth Project of National Natural Science Foundation of China (Grant No. 41907238), the Independent Research Project of State Key Laboratory of Geohazard Prevention and Geoenvironment Protection(Grant No. SKLGP2021Z008).
Data Availability Statement
Not applicable.
Conflicts of Interest
The authors declare no conflict of interest.
Appendix A
Table A1.
Table of Soil Test Results.
Table A1.
Table of Soil Test Results.
| No | Classification | Location | Sand Content % (Excluding Gravels) | Organic Content % | Gravel Content % | Compaction | Porosity | Ksat
mm/hour |
|---|
| 1 | farmland | Near Dhunche | 0.9 | 5 | 15 | Loose-normal | 0.25 | 28.8 |
| 2 | landslide deposition | Mukharka | 0.82 | 1 | 30 | Dense | 0.33 | 36 |
| 3 | landslide deposition | Grang | 0.82 | 1 | 40 | Hard | 0.19 | 7.2 |
| 4 | farmland | Ramche | 0.89 | 5 | 30 | Normal | 0.22 | 18 |
| 5 | landslide deposition | Kalikasthan | 0.82 | 1 | 50 | Dense | 0.24 | 14.4 |
| 6 | grass land | Mailong | 0.85 | 1 | 50 | Dense | 0.27 | 10.8 |
| 7 | farmland | Kalikasthan | 0.9 | 5 | 10 | Loose-normal | 0.30 | 28.8 |
References
- Dhakal, S. Disasters in Nepal. In Disaster Risk Management; TU-CDES and UNDP Nepal Publisher: Kathmandu, Nepal, 2016; pp. 39–74. [Google Scholar]
- DPNet. Nepal Disaster Report, Disaster Preparedness Network, Nepal; DPNet-Nepal: Kathmandu, Nepal, 2013. [Google Scholar]
- MoHA. Nepal Disaster Report. 2011. Available online: http://www.moha.gov.np//uploads/document/file/Nepal_Disaster_Report_2011_20130904031242.pdf (accessed on 15 February 2017).
- Collins, B.D.; Jibson, R.W. Geological Survey Open-File Report. In Assessment of Existing and Potential Landslide Hazards Resulting from the April 25, 2015 Gorkha, Nepal Earthquake Sequence; U.S. Geological Survey: Reston, VA, USA, 2015; 50p. [Google Scholar] [CrossRef] [Green Version]
- Lin, C.W.; Liu, S.H.; Lee, S.Y.; Liu, C.C. Impacts of the Chi-Chi earthquake on subsequent rainfall-induced landslides in central Taiwan. Eng. Geol. 2006, 86, 87–101. [Google Scholar] [CrossRef]
- Tang, C.; Zhu, J.; Li, W.L.; Liang, J.T. Rainfall-triggered debris flows following the Wenchuan earthquake. Bull. Eng. Geol. Environ. 2009, 68, 187–194. [Google Scholar] [CrossRef]
- Fan, X.; Scaringi, G.; Domènech, G.; Yang, F.; Guo, X.; Dai, L.; He, C.; Xu, Q.; Huang, R. Two multi-temporal datasets that track the enhanced landsliding after the 2008 Wenchuan earthquake. Earth Syst. Sci. Data 2019, 11, 35–55. [Google Scholar] [CrossRef] [Green Version]
- Guzzetti, F.; Peruccacci, S.; Rossi, M.; Stark, C.P. The rainfall intensity-duration control of shallow landslides and debris flows: An update. Landslides 2008, 5, 3–17. [Google Scholar] [CrossRef]
- Anna, R.; Guido, P.; Fabio, L.; Francesco, F.; Laura, T. Rainfall Threshold for Shallow Landslides Initiation and Analysis of Long-Term Rainfall Trends in a Mediterranean Area. Atmosphere 2020, 11, 1367. [Google Scholar] [CrossRef]
- Antonello, T.; Luigi, P.; Enrico, C. Rainfall Threshold for Shallow Landslide Triggering Due to Rising Water Table. Water 2022, 14, 2966. [Google Scholar] [CrossRef]
- Galanti, Y.; Giannecchini, R.; Avanzi, G.; Barsanti, M.; Benvenuto, G. Rainfall thresholds for triggering shallow landslides in Vara Valley (Liguria, Italy). In Landslides and Engineered Slopes. Experience, Theory and Practice; CRC Press: Boca Raton, FL, USA, 2016; pp. 943–950. [Google Scholar] [CrossRef]
- Dahal, R.K.; Hasegawa, S. Representative rainfall thresholds for landslides in the Nepal Himalaya. Geomorphology 2008, 100, 429–443. [Google Scholar] [CrossRef]
- Huang, F.; Chen, J.; Liu, W.; Huang, J.; Hong, H.; Chen, W. Regional rainfall-induced landslide hazard warning based on landslide susceptibility mapping and a critical rainfall threshold. Geomorphology 2022, 408, 108236. [Google Scholar] [CrossRef]
- Capparelli, G.; Tiranti, D. Application of the MoniFLaIR early warning system for rainfall-induced landslides in Piedmont region (Italy). Landslides 2010, 7, 401–410. [Google Scholar] [CrossRef]
- Thiebes, B.; Bell, R.; Glade, T.; Jäger, S.; Mayer, J.; Anderson, M.; Holcombe, L. Integration of a limit-equilibrium model into a landslide early warning system. Landslides 2014, 11, 859–875. [Google Scholar] [CrossRef]
- He, J.; Qiu, H.; Qu, F.; Hu, S.; Yang, D.; Shen, Y.; Zhang, Y.; Sun, H.; Cao, M. Corrigendum to “Prediction of spatiotemporal stability and rainfall threshold of shallow landslides using the TRIGRS and Scoops3D models”. Catena 2020, 198. [Google Scholar] [CrossRef]
- Saxton, K.; Rawls, W. Soil Water Characteristic Estimates by Texture and Organic Matter for Hydrologic Solutions. Soil Sci. Soc. Am. J. 2006, 70, 1569–1578. [Google Scholar] [CrossRef] [Green Version]
- Glade, T.; Crozier, M.; Smith, P. Applying Probability Determination to Refine Landslide-triggering Rainfall Thresholds Using an Empirical “Antecedent Daily Rainfall Model”. Pure Appl. Geophys. 2000, 157, 1059–1079. [Google Scholar] [CrossRef]
- Bruce, J.P.; Clark, R.H. Introduction to Hydrometeorology; Pergamon Press: Long Island City, NY, USA, 1966. [Google Scholar]
- Crozier, M.J.; Eyles, R.J. Assessing the probability of rapid mass movement. In Third Australia-New Zealand Conference on Geomechanics: Wellington, May 12–16, 1980; Institution of Professional Engineers New Zealand: Wellington, NZ, USA, 1980; p. 2. [Google Scholar]
- Mathew, J.; Babu, D.G.; Kundu, S.; Vinod Kumar, K.; Pant, C.C. Integrating intensity-duration-based rainfall threshold and antecedent rainfall-based probability estimate towards generating early warning for rainfall-induced landslides in parts of the Garhwal Himalaya, India. Landslides 2014, 11, 575–588. [Google Scholar] [CrossRef]
- Fan, X.; Hsein Juang, C.; Wasowski, J.; Huang, R.; Xu, Q.; Scaringi, G.; van Westen, C.J.; Havenith, H.-B. What we have learned from the 2008 Wenchuan Earthquake and its aftermath: A decade of research and challenges. Eng. Geol. 2018, 241, 25–32. [Google Scholar] [CrossRef]
| Publisher’s Note: MDPI stays neutral with regard to jurisdictional claims in published maps and institutional affiliations. |
© 2022 by the authors. Licensee MDPI, Basel, Switzerland. This article is an open access article distributed under the terms and conditions of the Creative Commons Attribution (CC BY) license (https://creativecommons.org/licenses/by/4.0/).


