Article

Identifying Critical Isolation Valves in a Water Distribution Network: A Socio-Technical Approach

by
Noha Abdel-Mottaleb
1,
Payman Ghasemi Saghand
2,
Mathews J. Wakhungu
3,
Hadi Charkhgard
2,
E. Christian Wells
3 and
Qiong Zhang
1,*
1
Department of Civil and Environmental Engineering, University of South Florida, Tampa, FL 33620, USA
2
Department of Industrial and Management Systems Engineering, University of South Florida, Tampa, FL 33620, USA
3
Department of Anthropology, University of South Florida, Tampa, FL 33620, USA
*
Author to whom correspondence should be addressed.
Water 2022, 14(21), 3587; https://doi.org/10.3390/w14213587
Submission received: 17 August 2022 / Revised: 17 October 2022 / Accepted: 29 October 2022 / Published: 7 November 2022
(This article belongs to the Special Issue Urban Water Networks Modelling and Monitoring, Volume II)

Abstract

:
Isolation valves are critical for the reliable functioning of water distribution networks (WDNs). However, it is challenging for utilities to prioritize valve rehabilitation and replacement given it is often unclear if certain valves are operable in a given WDN. This study uses the Gomory–Hu tree of the segment-valve representation (or dual representation) of WDNs to obtain the logical implications of inoperable valves (i.e., which segments should be isolated and merged unnecessarily due to valve inoperability). Multi-objective optimization is then used to identify the critical valves based on selected attributes (e.g., social vulnerability, flow volume) of segments that would be unnecessarily isolated as a result. This study developed three multi-objective formulations: first, deterministic; second, accounting for uncertainty; and third, accounting for both uncertainty and the likelihood of failure of pipes within segments. Identified critical valves are compared between the three developed formulations and a method considering only a single objective. Results demonstrated that multi-objective optimization provided additional information which can be used to discern valve importance for utilities in comparison with using a single objective. Further, though there was overlap between the results from the three formulations, the third formulation provided the most insight without overwhelming decision-makers with a large number of identified valves.

1. Introduction

While many stressors act on water distribution networks (WDNs) (e.g., climate change, aging infrastructure, interdependencies), utilities have limited resources to address the challenges WDN infrastructure face. This makes prioritizing WDN components (e.g., pipes, valves, pumps, tanks) to repair, rehabilitate, or replace important. Much research has focused on the prioritization of pipes, based on pipe criticality [1,2,3]. The criticality of pipes is determined using several indicators, such as system demand shortfall. The major assumption is that a single pipe can be isolated for repair. However, the minimum isolatable unit of WDNs is a segment, and segments often consist of more than a single pipe. This is because in real-world WDNs, isolation valves are not available at the end of each pipe [4,5].
When pipes are to be accessed for repair, rehabilitation, or replacement, isolation valves must be operated to isolate segments of the WDNs [6]. In the extreme case that a network does not have sufficient operable isolation valves, the entire network would need to be isolated from its water sources for any pipe repair (i.e., every customer’s water service is disrupted). In fact, this occurred recently, in 2013, in a town in Oklahoma, USA [7]. Operable valves also become increasingly important under situations such as natural disasters (e.g., Nova Scotia, Canada and Ft. Myers, USA) and where there are ongoing military operations (e.g., Ukraine) (see: Times [8], Unicef [9]). Though these are extreme cases, it often happens that more segments must be isolated because of inoperable valves—leaving more customers without water, some of which are potentially more vulnerable than others to the water loss. In addition, valves may become inoperable unless they are exercised at regular time intervals at least once a year, or more often in the case of abrasive water [10,11].
Prioritizing valves is more complicated than the common assumption of single-pipe isolation, because a single valve can be responsible for the isolation of many segments (depending on the given scenario of valve operability in the network). Valves are critical when the segments, or zones, they help prevent from unintended isolation are important/critical themselves. The importance of segments and valves has been addressed in the literature in two different ways: analysis and design [11]. Design is concerned with the optimal placement of valves (e.g., Giustolisi and Savic [4], Santonastaso et al. [5], Creaco and Haidar [12], Giustolisi [13], Yang et al. [14], Morosini et al. [15], Hernandez Hernandez and Ormsbee [16]). Analysis involves evaluating the impacts of valve failure (or inoperability) on WDN performance and prioritizing valves and segments to inform operation and management. There are limited studies focused on identifying critical segments or valves given a water network design with valves already allocated (e.g., Liu et al. [6], Jun and Loganathan [11], Mahmoud et al. [17], Zischg et al. [18], Abdel-Mottaleb and Walski [19], Hernandez and Ormsbee [20], Atashi et al. [21]).
Jun and Loganathan [11] developed a technique based on graph theory and matrix calculations to identify WDN segments and an algorithm to trace unintended isolations due to a given segment isolation. Their work is an advance which used the dual topology, with valves modeled as edges and segments modeled as nodes. However, their method does not provide a ranking of segments or valves in the network. Similarly, Abdel-Mottaleb and Walski [19] used a matrix to compute the importance and vulnerability of segments using reachability to water sources under valve failure scenarios. Though their research provided a ranking of segments, it would require many simulations to rank valves. Zischg et al. [18] applied complex network analysis to the dual topologies of different WDNs to evaluate and compare the valving of the networks. Their methodology allows for a quick comparison of valving scenarios (i.e., location and number of valves) but does not provide a prioritization scheme at the valve or segment level. These techniques serve only as a quick preliminary screening for utilities, prior to running hydraulic simulations. Liu et al. [6] evaluated different performance measures for various valving scenarios, demonstrating that increasing valving throughout a network reduced the adverse consequences of failures in the network. They evaluated impacts of each inoperable valve; however, there can be many combinations of inoperable valves in real WDNs. In addition, because there are often loops of segments in real WDNs, there can be many paths between one segment and another (i.e., that need to be isolated). It is resource-intensive to enumerate all possible scenarios for utilities. Mahmoud et al. [17] prioritized repair actions (including operating valves) using multi-objective optimization; where the objectives were the minimization of the negative impact on the consumers (e.g., unsupplied water volume) and the minimization of the corresponding number of repair actions. The purpose of their method is real-time decision-making after failures, assuming valves are operable.
The aforementioned studies do not account for the social vulnerability of communities serviced by WDNs (i.e., customers vulnerable to a disruption in water service). In reality, utilities are often concerned with social indicators to varying degrees and account for social vulnerabilities within the consequences-of-failure score in their risk-based asset management. Choi et al. [22] used multi-objective optimization, and Giustolisi et al. [23] proposed a relevance-based centrality metric, to identify critical segments that account for social indicators. This can provide utilities with insight into the valves that ought to be repaired sooner; however, the probability of the failure of segments was not included in these studies [13]. Simone et al. [24] addressed this gap by developing a method that accounts for the probability of the failure of segments, in addition to some social indicators through the relevance-based centrality metric proposed by Giustolisi et al. [23]. Similarly, Giustolisi et al. [25] used complex network analysis to identify critical segments and valves. While these methods are useful for utilities, they do not account for whether valves are operable and do not account for uncertainties associated with both the water service needs of customers and customer vulnerability, which are inherent in infrastructure networks and the urban environment [26,27,28]. Accounting for these uncertainties has been shown to have an effect on resulting best practices or decisions made by utilities [29]. In sum, challenges to prioritizing isolation valves include the complexity of accounting for multiple possible operable-valve scenarios in a WDN, and accounting for social vulnerability regarding the service population, uncertainties in both hydraulic performance and social vulnerability, and the likelihood of segment failure. These limitations can be attributed to the methodologies used for analyzing WDN valving.
This study addresses these limitations as follows. First, a method is developed to reduce the complexity of the potential operable valve scenarios in a WDN. Then, the resulting WDN representation is used as input for three multi-criteria optimization formulations developed in this study. The three formulations build upon each other. The third formulation accounts for social vulnerability, uncertainties associated with consumer demands and the likelihood of failure of pipes within segments. In lieu of a priori knowledge on valve operability, the proposed method identifies the pareto-optimal sets of critical valves (i.e., valves which have the most potential adverse impact when inoperable) based on hydraulic simulations and the social vulnerability of WDN segments. The identified critical valves are compared for the three formulations for the City of Tampa as a case study.

2. Materials and Methods

To identify critical valves, an optimization model is used for the logical implications of inoperable valves. The implications of inoperable valves are segment isolation and the potential subsequent loss of water service. Not all segment isolation has the same effect—some segment isolation is more critical than others. To obtain the logical implications, first a segment-valve representation of the network is constructed. Then, the segment-valve representation is simplified to a Gomory-Hu-tree network model (i.e., an equivalent flow graph), which allows the identification of the minimum set of inoperable valves that would cause any given segment isolation.

2.1. Segment-Valve Representation

The segment-valve representation of the WDN has often been called the mathematical “dual” of the more common pipe-junction representation. In this representation, segments containing pipes are the nodes and isolation valves are the edges, or links, between them. To obtain the segment-valve representation, a hydraulic network model based on a pipe-junction representation is first created using a hydraulic modeling software (e.g., WaterGEMS). The data structure (e.g., list of lists, dictionary) containing segments and associated isolation valves is exported from the software (e.g., WaterGEMS) to Python. A network model of segments and valves is then generated using the networkx package [19].
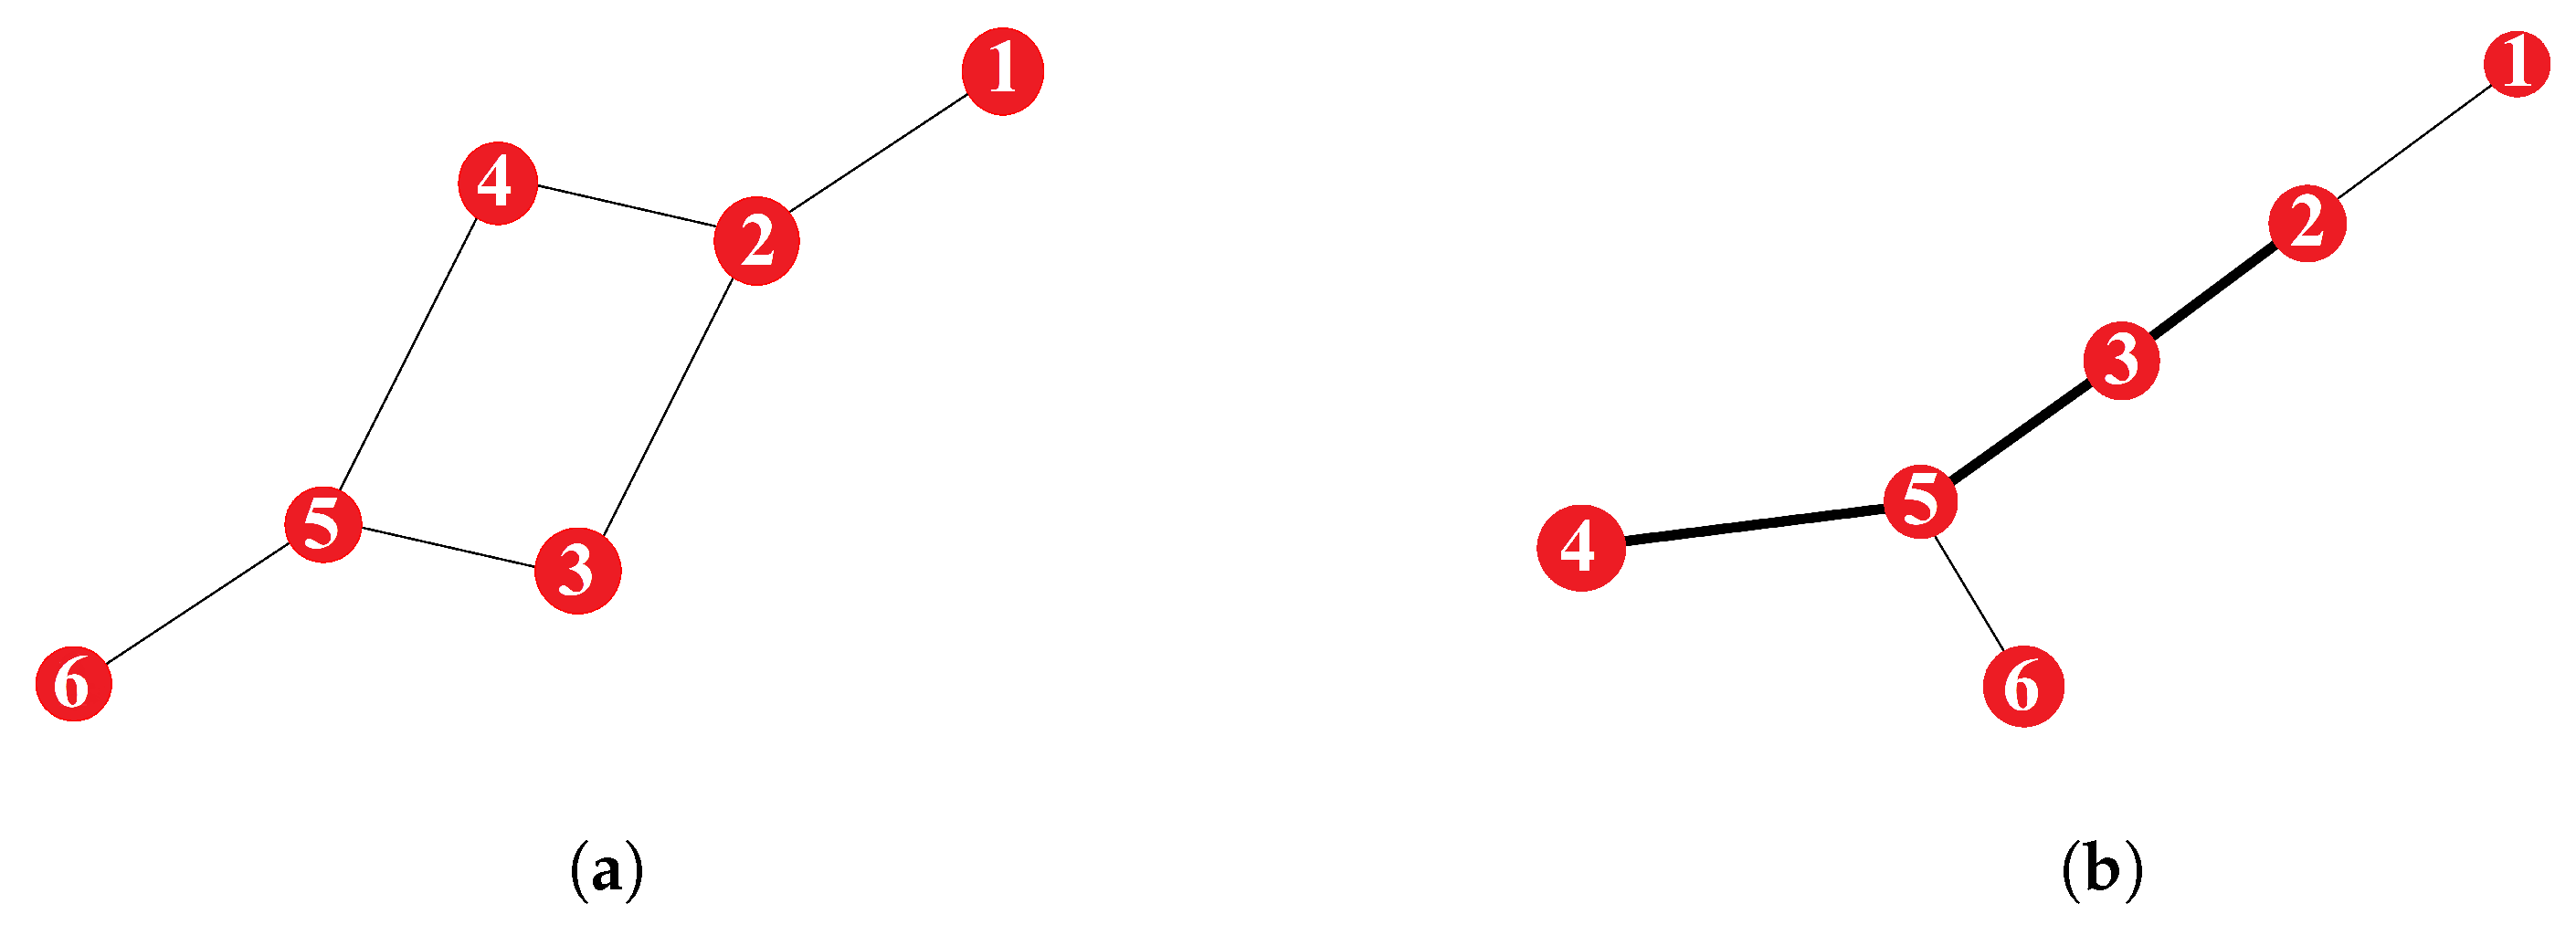
There are still loops in the segment-valve representation, making it computationally complex to identify how valves impact segments when any valves are inoperable. This is because there are many potential combinations of valves that can impact the isolation of a given segment. Consider the small network shown in Figure 1a, where node 1 (i.e., segment 1) contains the reservoir and node 6 (i.e., segment 6) contains a tank. In this figure, if segment 4 must be isolated, at least two operational valves must also exist (one on each path) between segment 2 and segment 4, so that segment 2 is not isolated unnecessarily. The combinations of two operable valves that allow segment 4 to be isolated without isolating segment 2 correspond to the minimum k-cut between segments 2 and 4, where k = 2 . A minimum k-cut between two nodes (i.e., segments) means that k edges (i.e., valves) are required to partition the two nodes (i.e., successfully isolate them from each other). If the valves between segments 2 and 4, and segments 4 and 5, are both inoperable, then to isolate segment 4, the entire network must also be isolated from the reservoir. This illustrates the combinatorial complexity of assessing the impact of failed valves on segments because of the existence of loops of segments.

2.2. Gomory–Hu Tree of Segment Connectivity to Address Combinatorial Complexity

The Gomory–Hu tree (G-H tree for short) simplifies the task of identifying the paths along which operational valves should exist to minimize unnecessary segment isolation (i.e., the minimum k-cuts between segments). When there are loops of segments, a set of valves instead of a single valve must be operational to minimize unnecessary segment isolation. The G-H tree contains nodes, which represent segments, and edges linking segments that represent the flow paths between each pair of connected segments. Specifically, edges represent the k valves (corresponding to all the minimum k-cut(s) in the segment valve network, or the minimum number of valves that must be operable) between two connected nodes for successful isolation. The G-H tree is also called a flow equivalent graph, because each minimum cut(s) represents all of the possible flow paths between two nodes (i.e., segments). The G-H tree of the small example is in Figure 1b. In this figure, the edge from segment 2 to segment 3 represents the following valves from Figure 1a: segment 2–segment 3, and either segment 2–segment 4, segment 4–segment 5, or segment 5–segment 3. The G-H tree of the segment valve representation of the network is obtained using the gomory_hu_tree function within networkx in Python. The valves that are part of the minimum cut(s) are stored in a data structure for the following step.

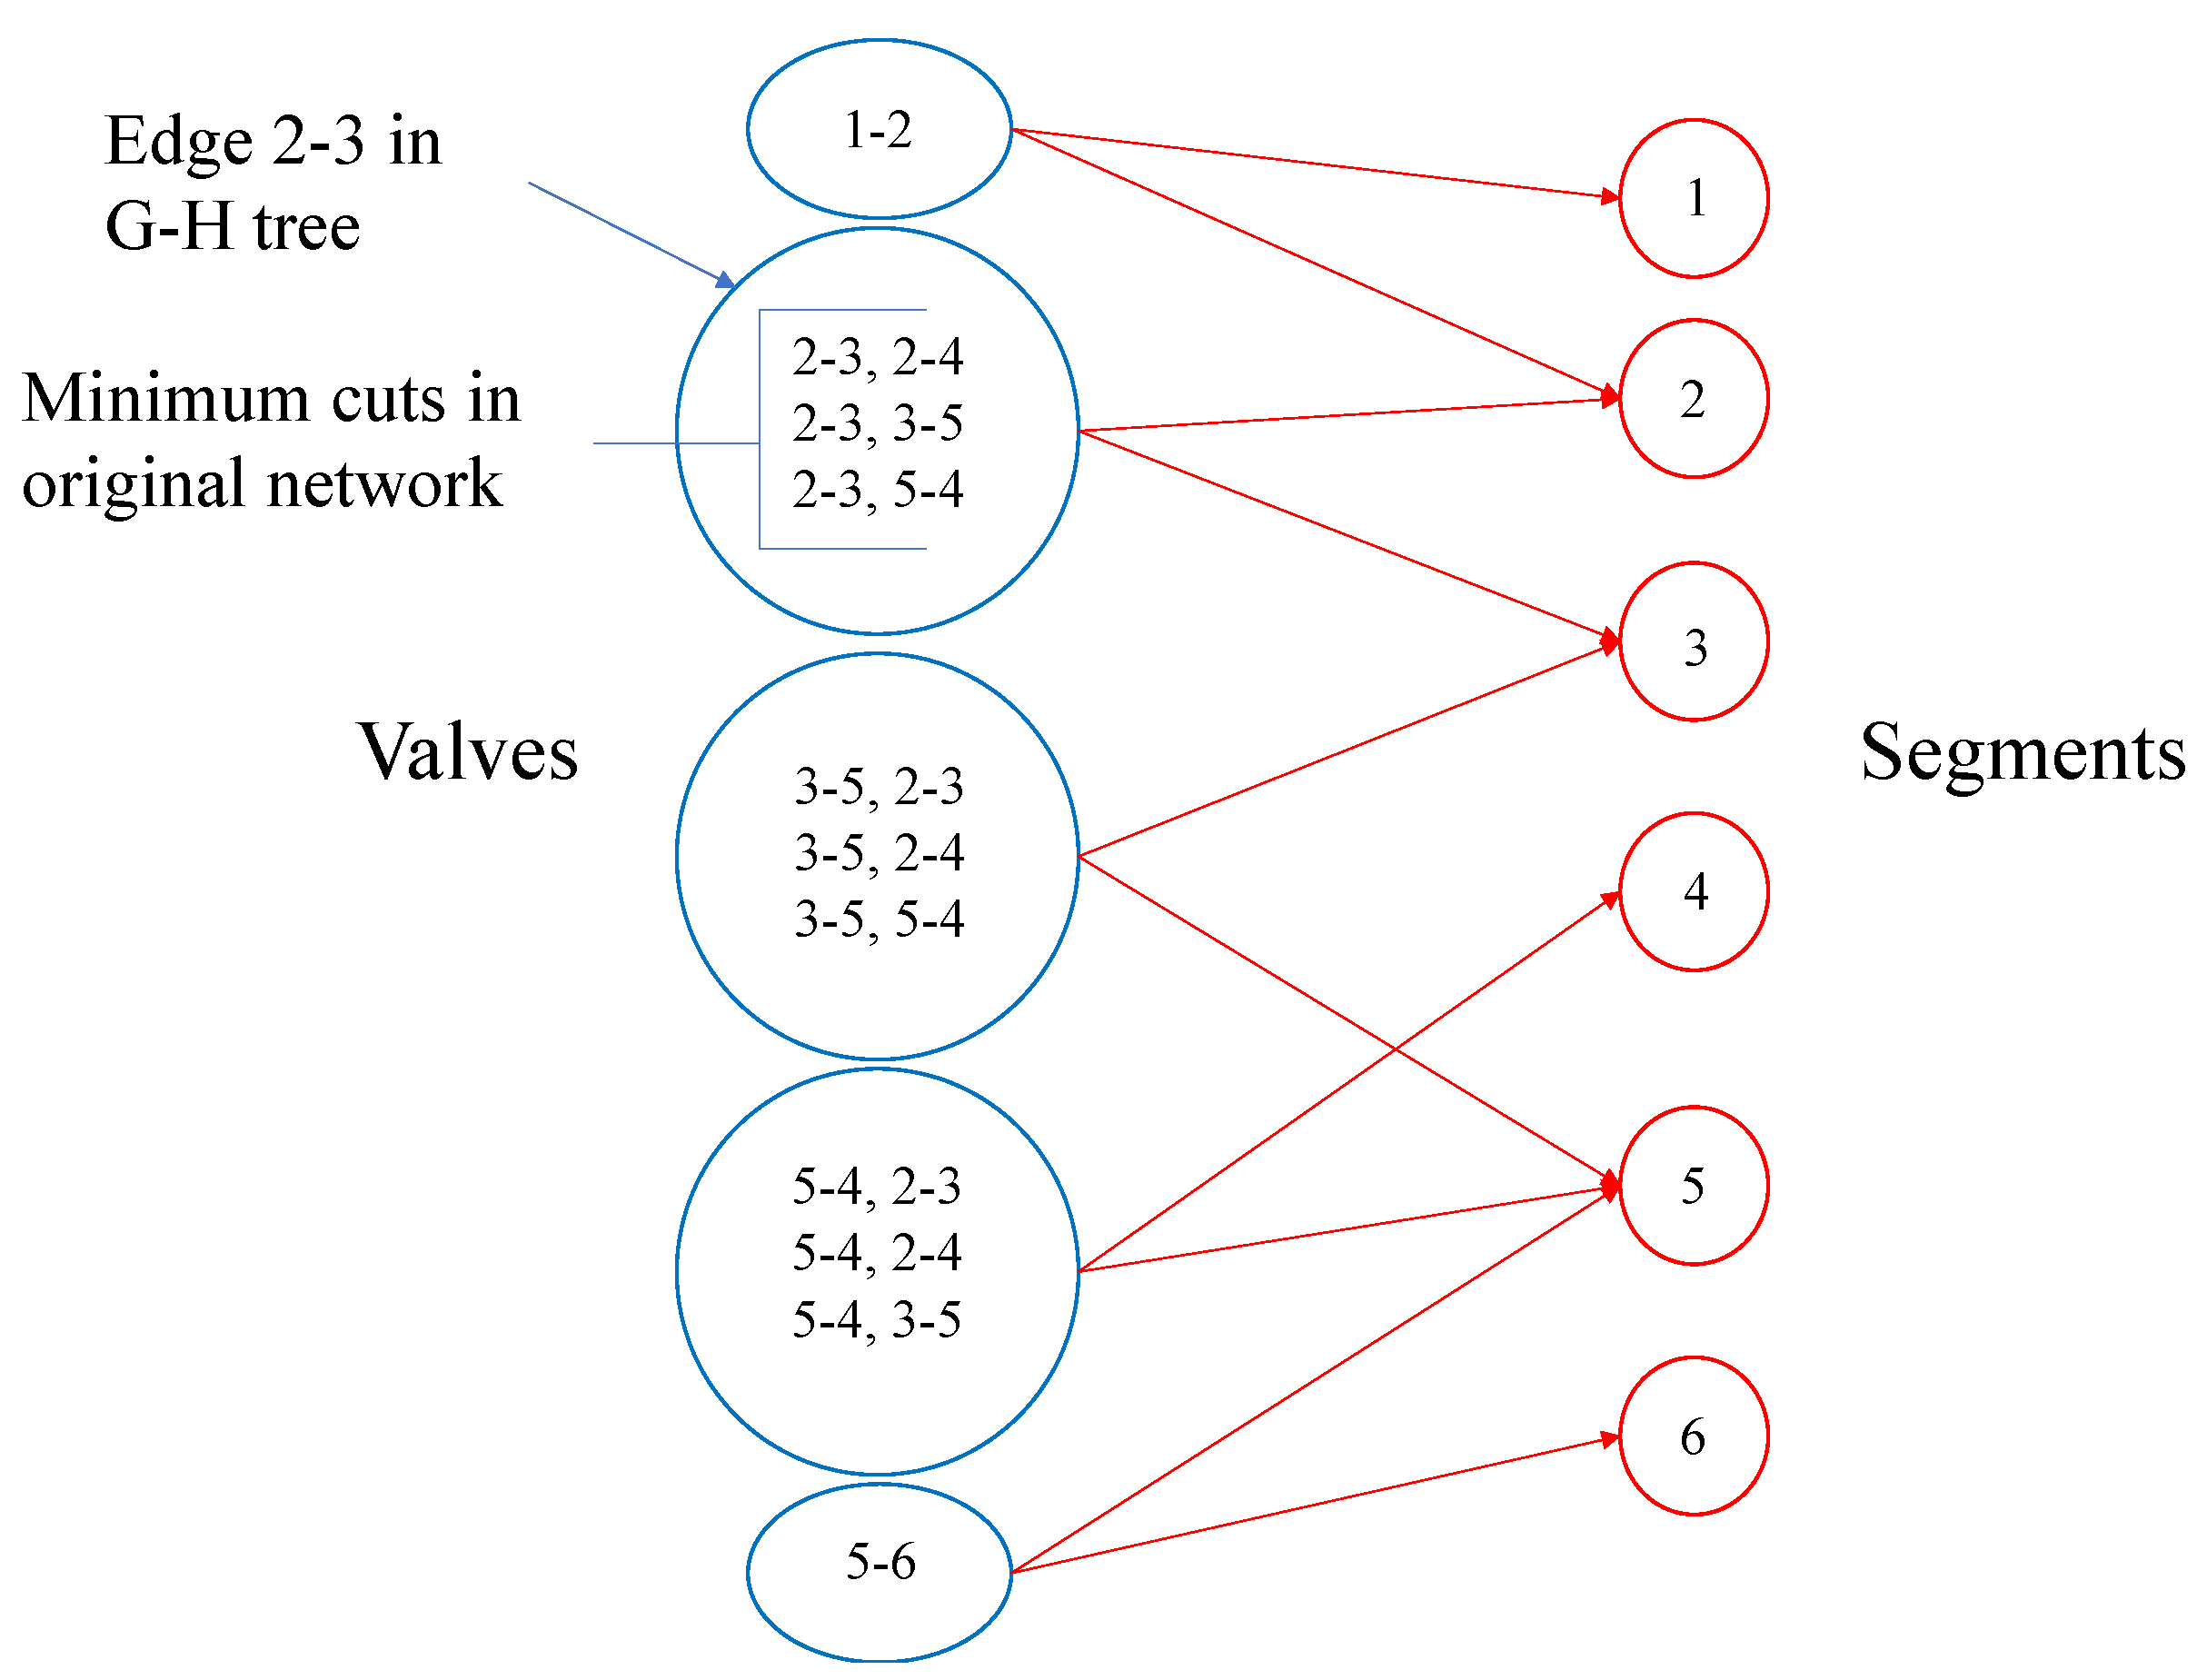
2.3. Logical Network

A logical network is constructed to represent the implications of valve failure on segment outages following a similar methodology to that presented in Abdel-Mottaleb et al. [3]. In this work, valve failure refers to valves that are in a failed (OPEN) state. In the logical network, there are two types of nodes. The nodes represent either segments (see the red nodes in Figure 2) or sets of valves (i.e., the edge of a G-H tree or minimum cut in the original network) (see the blue nodes in Figure 2). The edges in the logical network are directed and represent a logical implication that a given set of valves will have an adverse consequence on connected segments. For example, if the valve(s) represented by node 1-2 in Figure 2 fails, it will have adverse consequence on segments 1 and 2. If one of the k valves in a minimum cut between two segments is inoperable, then the segment it is connected to will have to be isolated in order to isolate adjacent segments (due to the valve failure). Figure 2 illustrates the construction of the logical network for the small example illustrated in Figure 1. If segments are identified as critical in the optimization, then the valves connected to them are also identified as critical. For example, if segments 2 and 5 are critical, 2-3, 2-4, 3-5, 5-4 and 5-6 are part of the solutions set.

2.4. Multi-Criteria Optimization

A multi-criteria optimization model is developed to identify critical valves based on their adverse impact to segments. The logical network relates valves to segments and is used as input for the optimization so that the impact of segment isolation can be quantified and the set of inoperable valves that would lead to the worst segment-isolation scenarios can be subsequently identified. The objective functions are quantified for each node representing valves in the logical network by aggregating the attribute value for the segments impacted by a selected valve or set of valves. Three objective functions (i.e., criteria) are used to quantify the impact to segments: reachability, segment flow volume, and social vulnerability. The attribute values for each segment under each criterion are calculated and stored as a dictionary object.
Reachability refers to how reachable the water source(s) is to other segments after a given segment isolation. In this study, reachability is quantified using the importance index, which is calculated from a matrix built from the segment-valve representation of the WDN, as described in Abdel-Mottaleb and Walski [19]. The matrix contains rows (m) representing isolated segments and columns (n) representing affected segments, where for each cell (m, n), a value of 2 is assigned if the isolation of segment m i causes segment n j to be isolated from all sources; a value of 1 is assigned if the isolation of segment m i causes segment n j to be isolated from the reservoir but remain connected to tanks; and a value of 0 is assigned if segment n j remains connected to the reservoir. The summation of each row is the importance index of the segment represented by that row. The importance index of a segment calculated from the matrix is an indicator of the system demand shortfall for that given segment isolation, and, more specifically, the number of segments that lose connection with water sources. In this manner, a segment with a high value for reachability (as measured by the importance index) is a segment that would cause many other segments to be disconnected from water sources. This objective function can be substituted with simulation data (e.g., demand shortfalls under segment isolation scenarios). In this study, reachability and segment flow volume are used separately to uncouple the topology from the hydraulics in the analysis and to compare the identified critical valves obtained with and without the inclusion of additional objectives. Reachability can be used to identify critical segments, and, subsequently, valves in two ways: graph theory and a single objective optimization by only including the objective function related to reachability. Graph theory can be used by applying the articulation_points function within networkx package in Python over the segment-valve representation, as demonstrated in Abdel-Mottaleb and Walski [30].
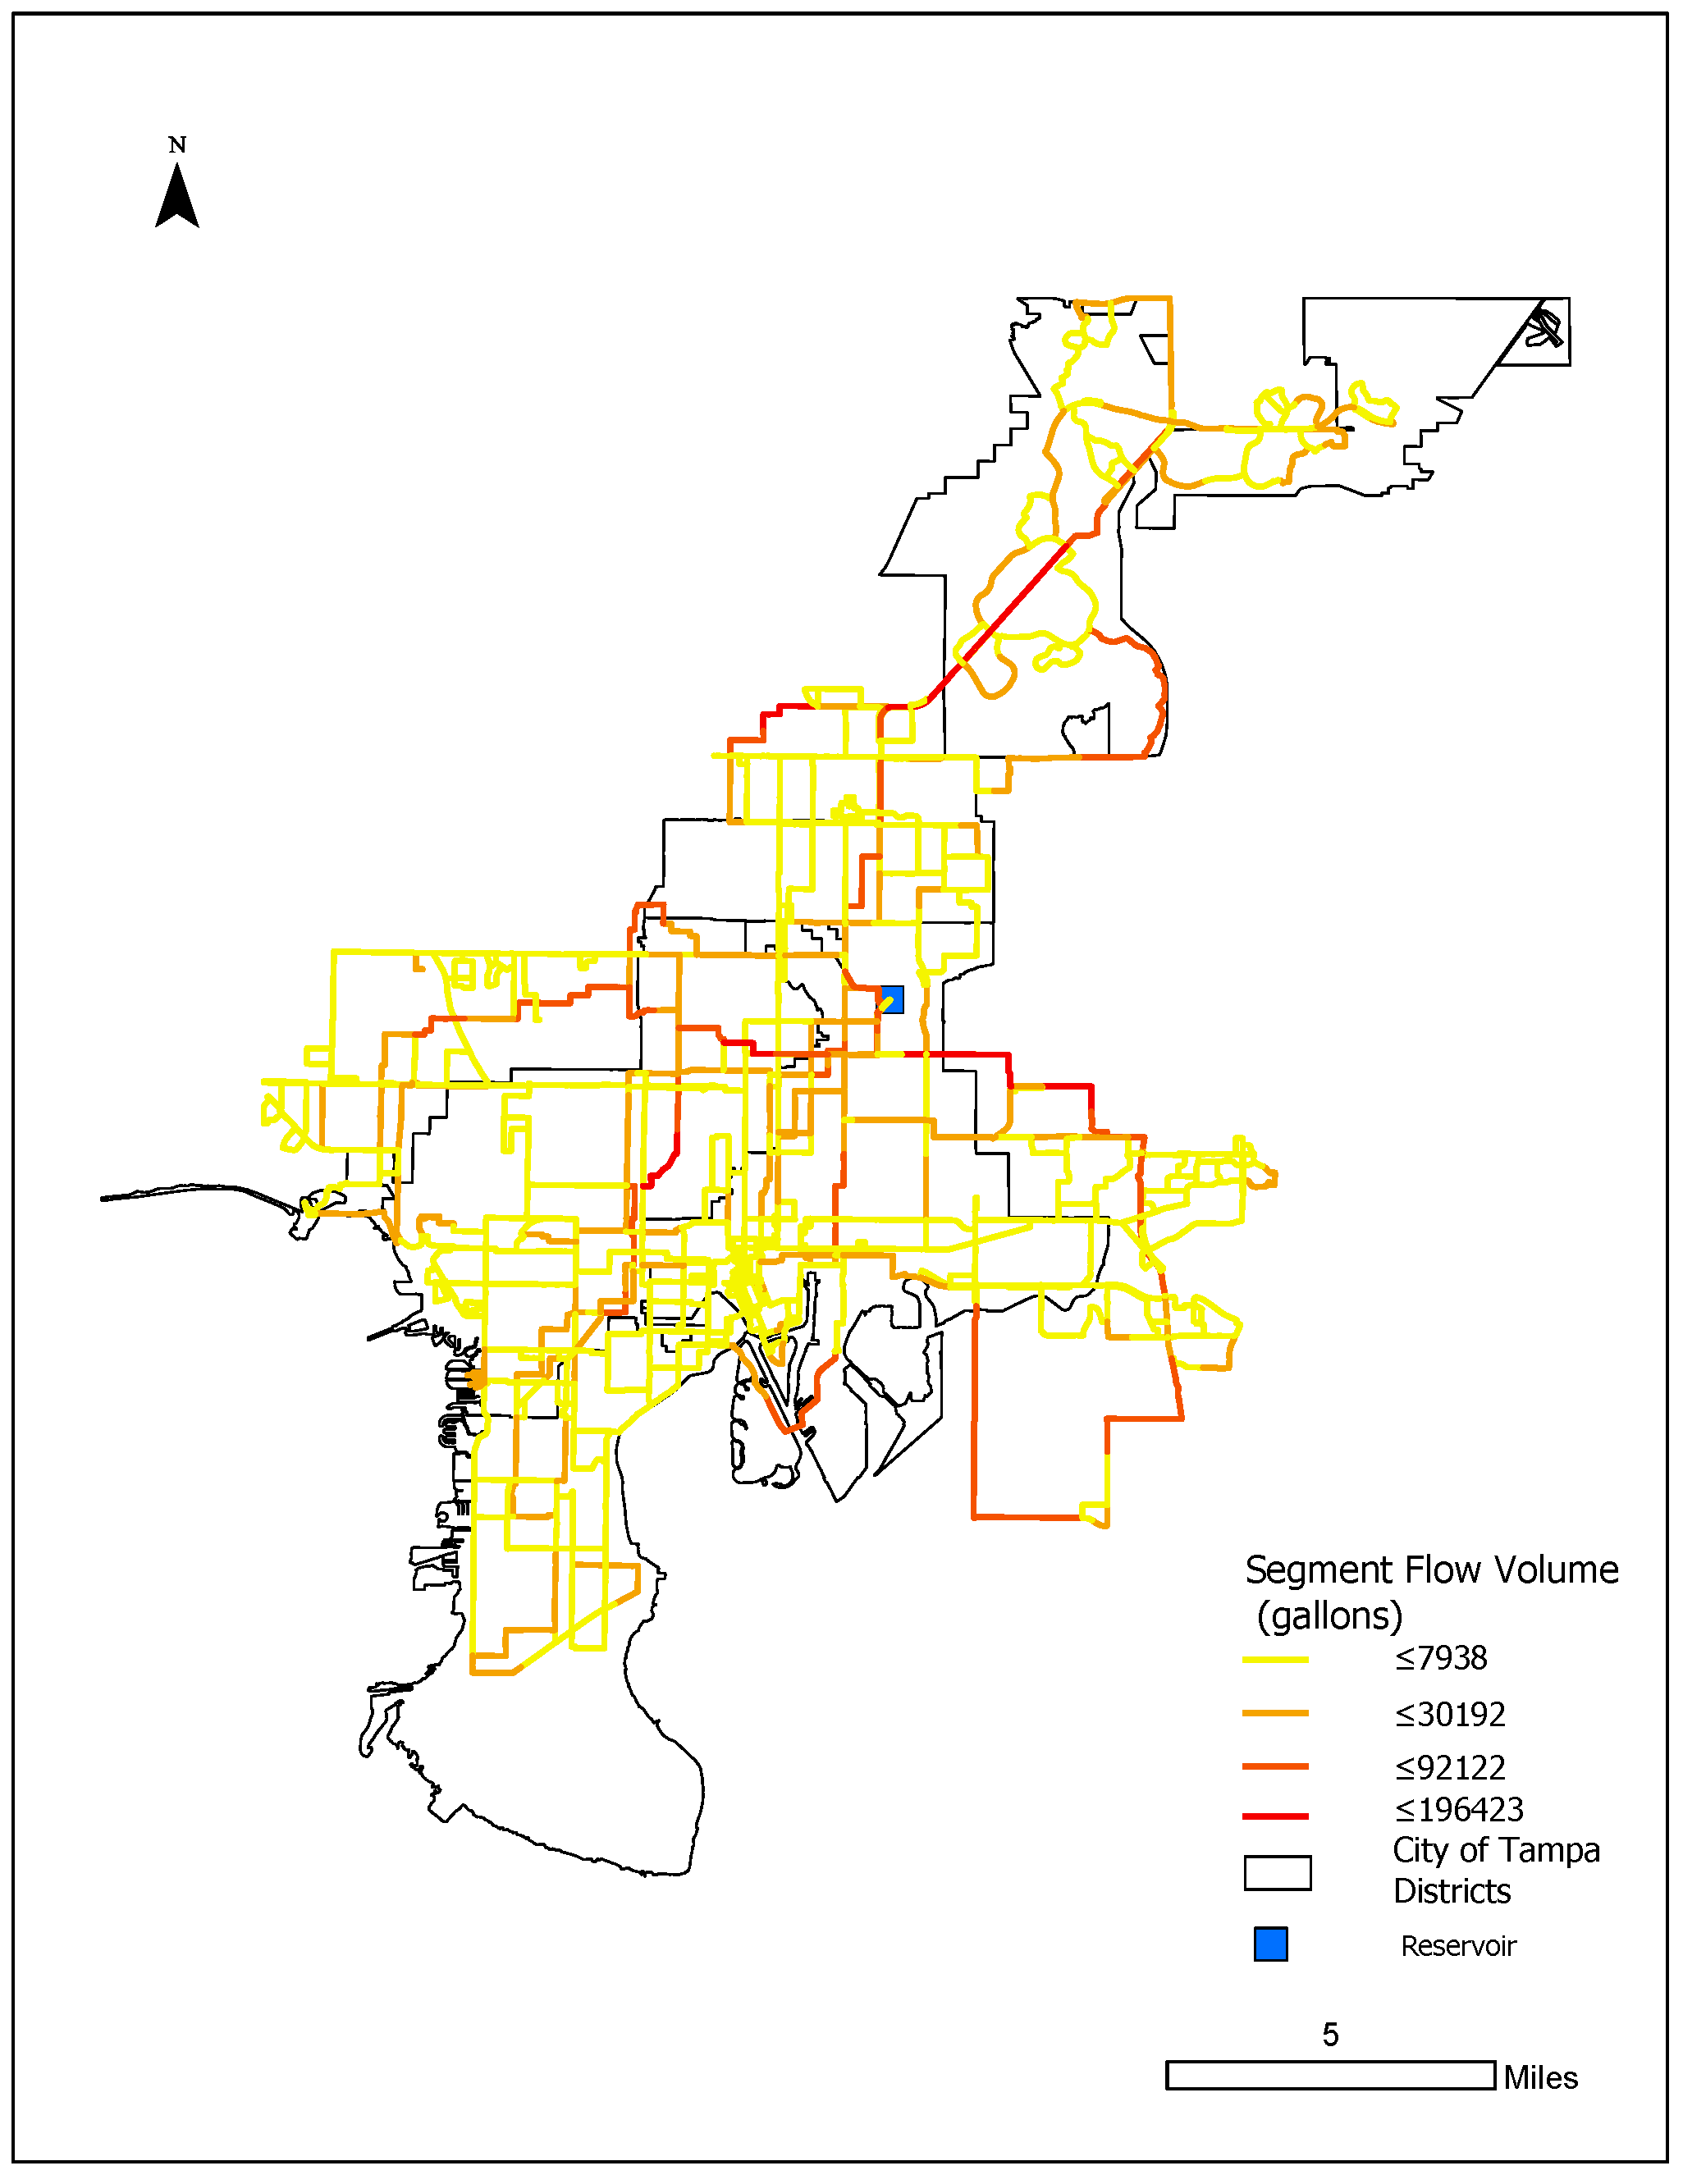
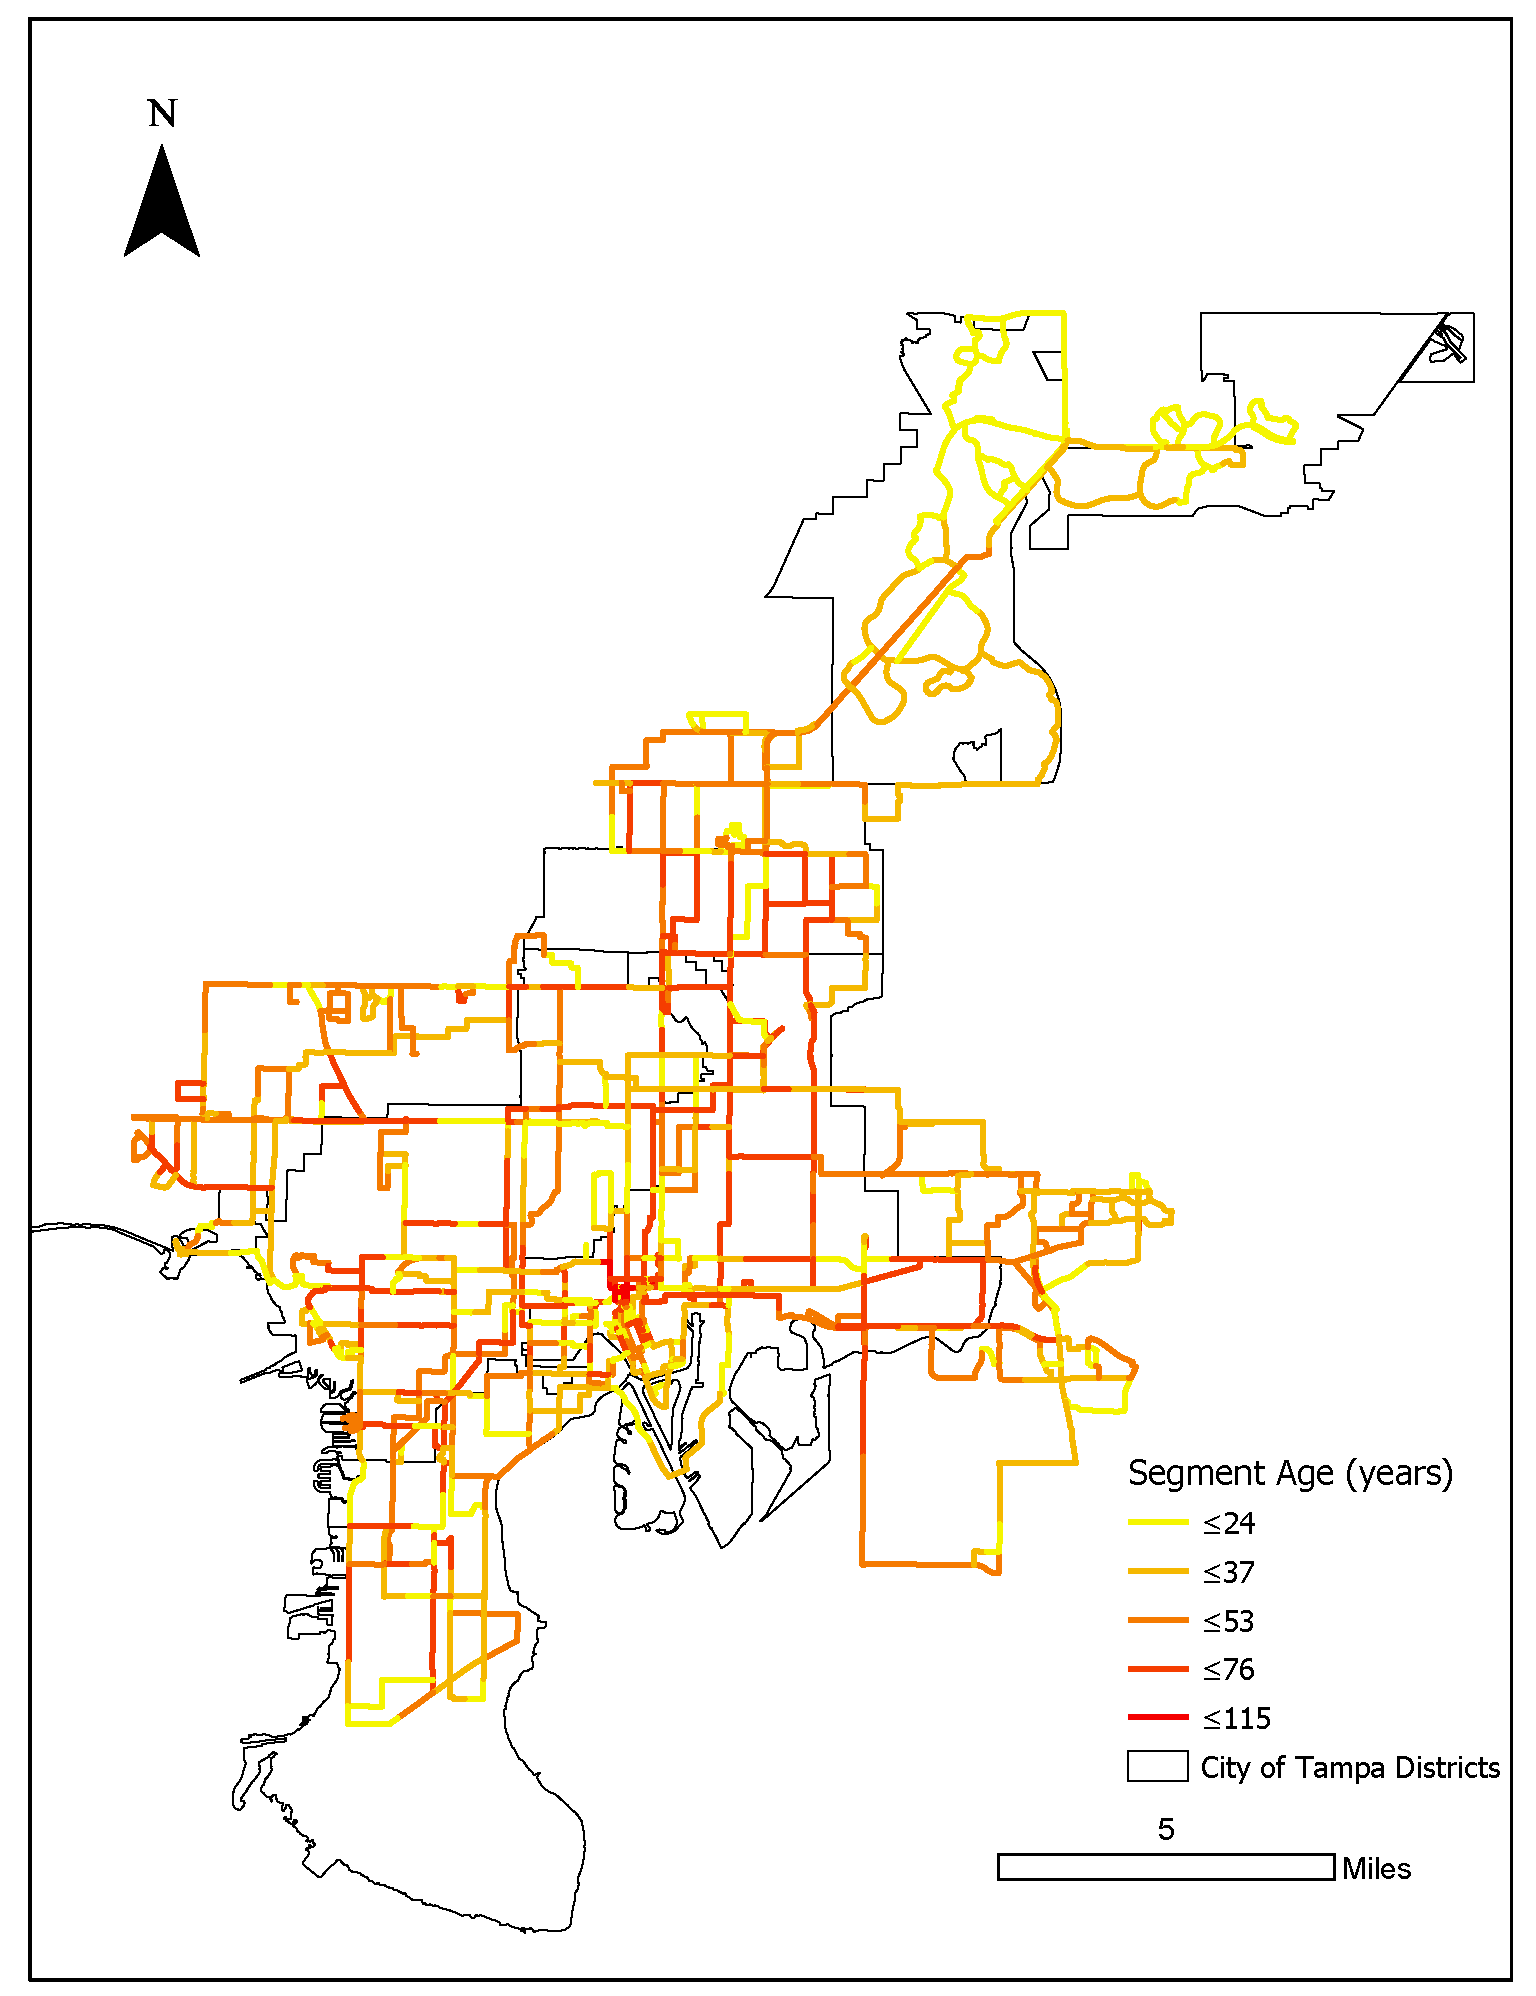
Segment flow volume is the second objective function used to assess the impact from valves to segments. The water flow volume in a segment is calculated using WaterGEMs [31] through pressure-driven extended period simulation, over a 24-h duration. In other case studies, it may be appropriate to substitute these two objective functions (reachability and segment flow volume) with just one using the system demand shortfall obtained from hydraulic simulations. The flow volume through segments varies from the initial design of a WDN and varies over time as customer demands change. It has been shown that larger pipes, holding more flow, have a larger adverse impact on WDNs than smaller counterparts [32]. Therefore, larger mains are typically designed with a longer design life than smaller pipes because of their high cost, and have lower uncertainties in flow volume. In this study, it is assumed that uncertainties in flow volume increase as pipe diameters decrease.
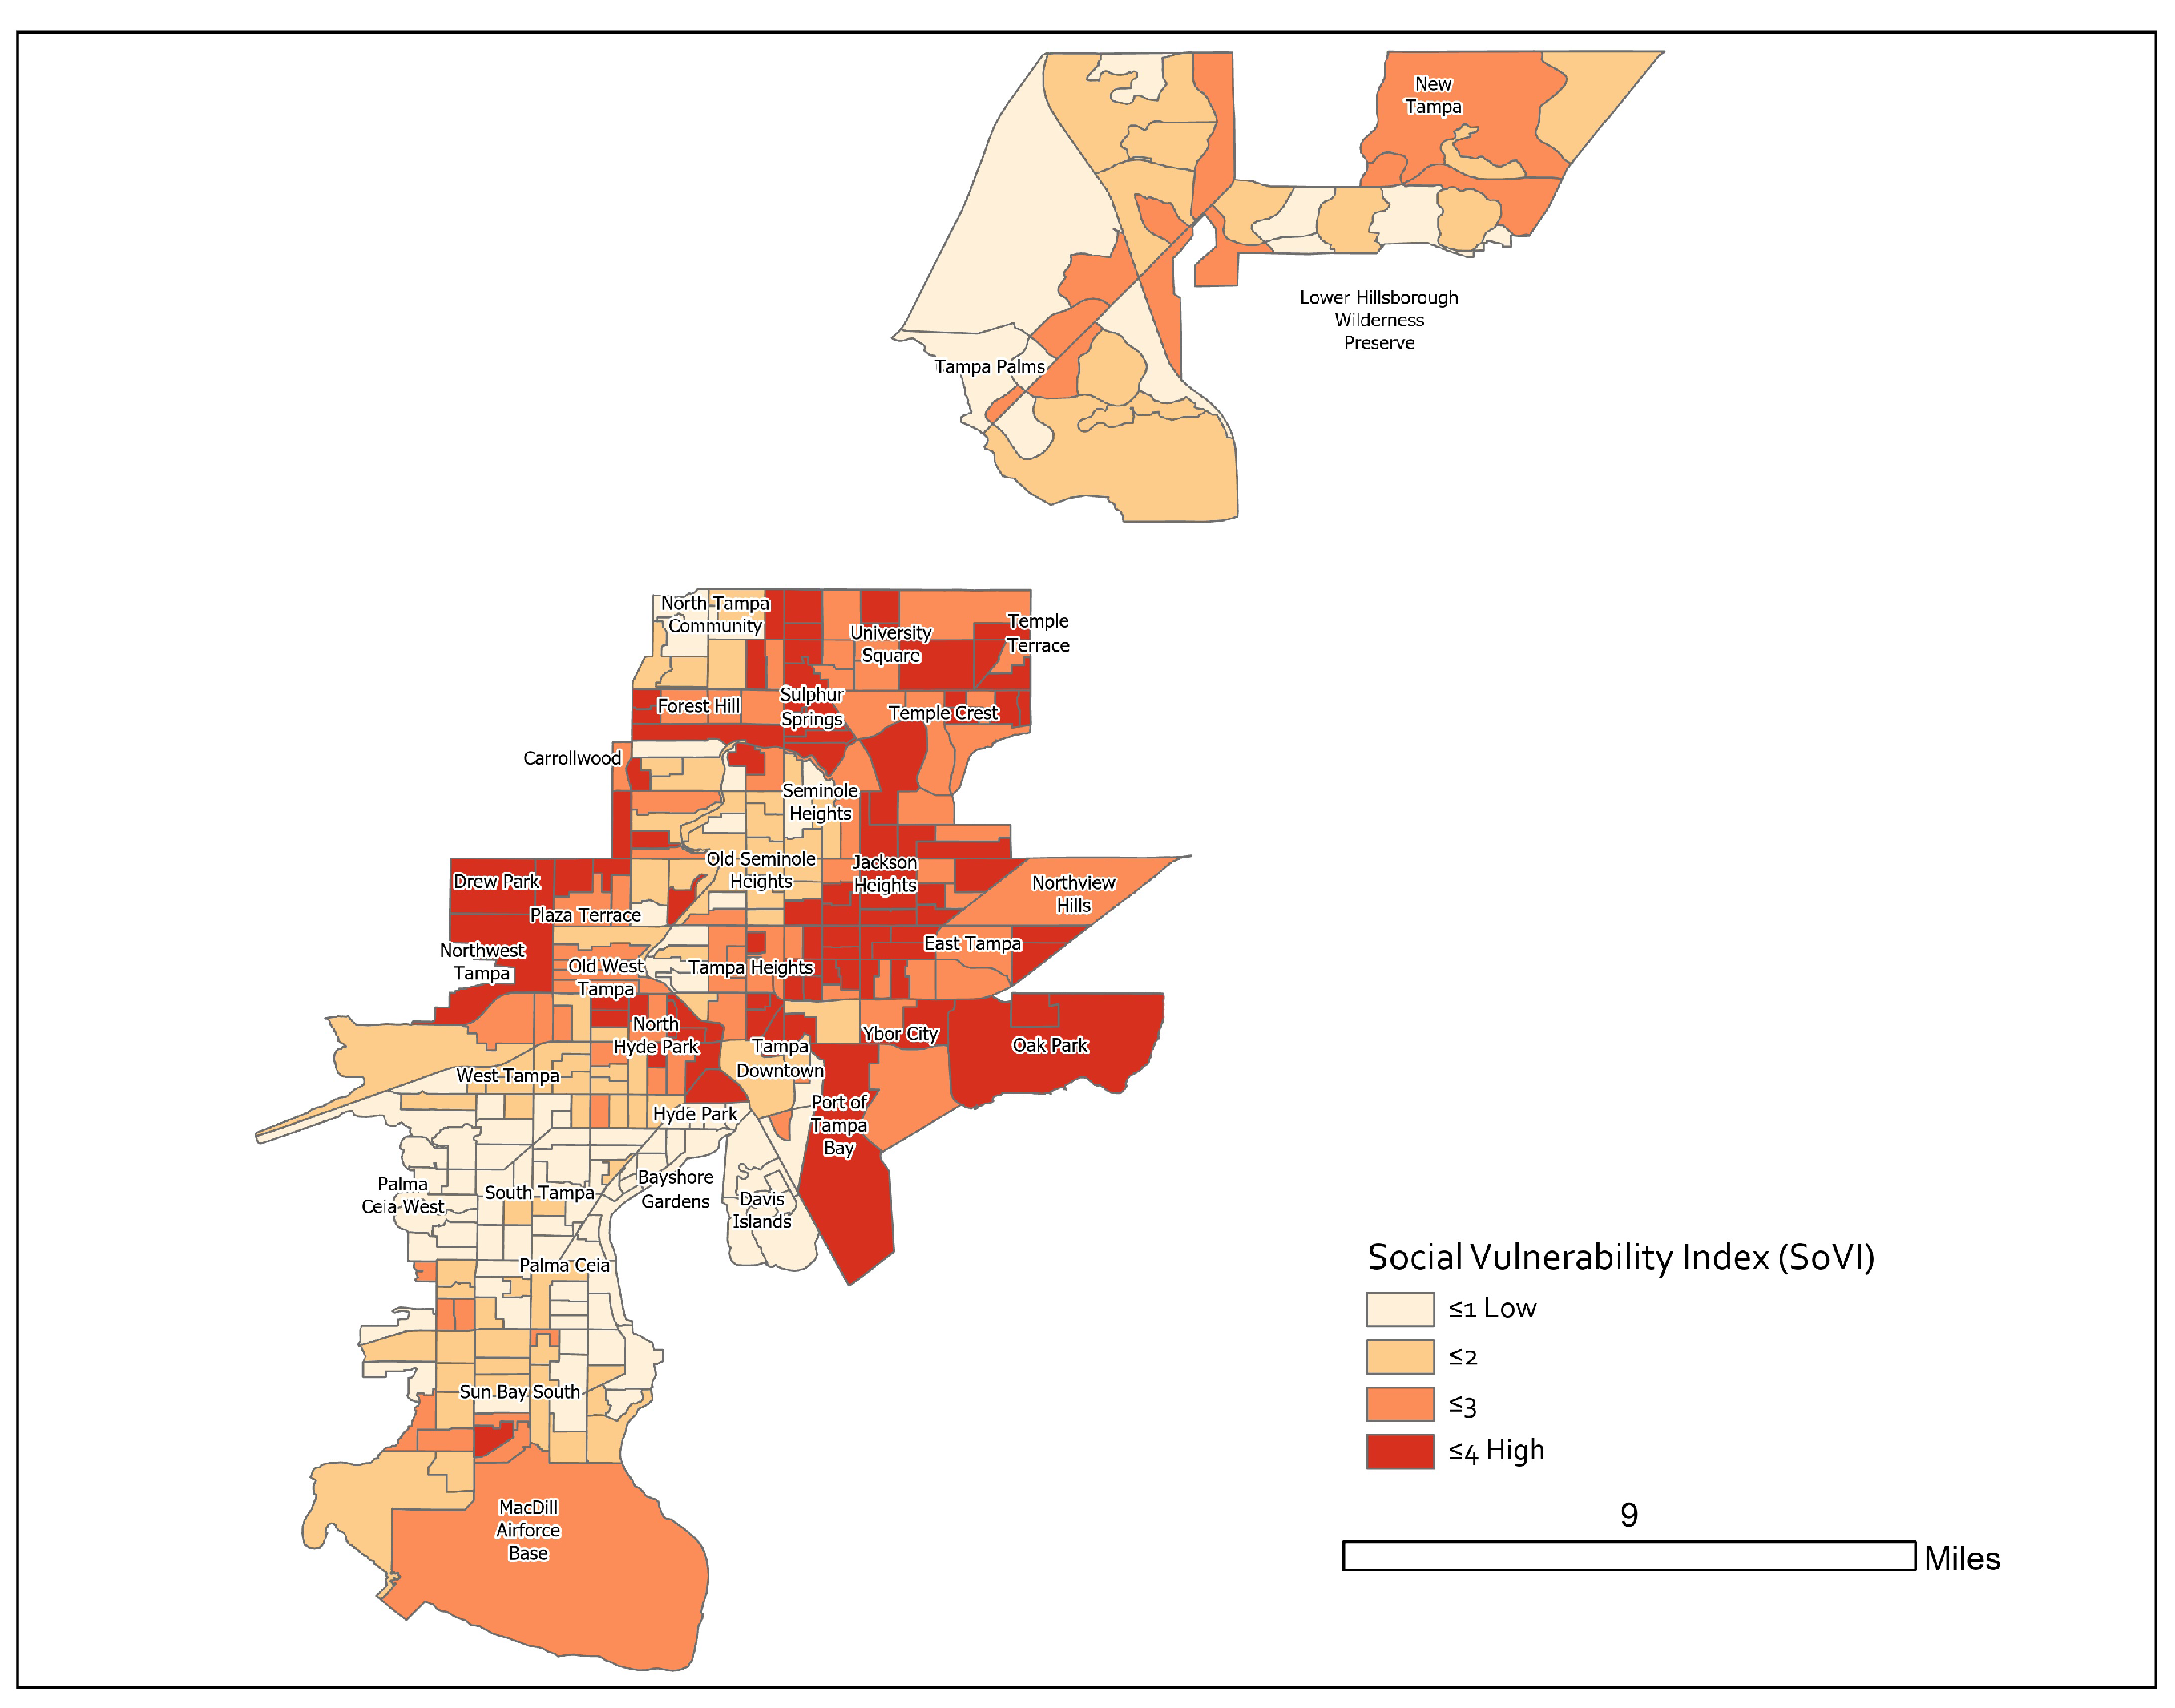
A novelty presented in this work is accounting for segments with populations that are vulnerable to water loss given their social class, household composition, sensitive population, minority, housing tenure, and quality of life (see Borden et al. [33], Cutter et al. [34]). The third objective function, therefore, accounts for the social vulnerability of populations associated with each segment. The social-vulnerability index (SVI) used in this study was developed by Wakhungu et al. [35]. The index was calculated using 2016 and 2017 sociodemographic data obtained from the American Community Survey and the U.S. Census Bureau. Using R-mode factor analysis in SPSS v. 25, the study considered 14 social vulnerability indicators to derive an SVI for each census block group in the City of Tampa. The analysis involved weighting component scores by the percentage of variance explained and aggregating the scores into a cumulative factor score indicating the vulnerability of a census block group. The social vulnerability of a community with a high SVI is also more likely to change than a community with a low SVI because of gentrification occurring in Tampa (see Wakhungu et al. [35], Chavez [36], Wakhungu [37]. In other words, there is more uncertainty associated with high SVI values than with low SVI values. Previous criticality analyses using the pipe-junction representation have taken key customer, or important demand, junctions into account (e.g., Giustolisi [13]). Similarly, the social-vulnerability index accounts for various household compositions and sensitive population variables per census block group, including the elderly, infants and children, people living with a disability or illness, and large households.

2.4.1. Formulation

In this study, three level of formulations are used to solve the problem accounting for different aspects. However, the overall formulation requires the decision-maker to provide the number of the critical sets of valves that the model should identify. In other words, for a given user-defined number, the model looks for the worst sets of valves to fail in the network.

Formulation One

The first formulation is the most straightforward one and is based on the two following assumptions. First, we assume that there does not exist any uncertainty in the objective functions over time or in their measurement. The second assumption is that the likelihood is the same for all valves to be operational (i.e., all segments have an equal likelihood of failure).
To mathematically formulate the model, we define S as the set of all segments, and s i as the binary decision variable related to segment i S , where s i = 1 means that segment i must be isolated and s i = 0 means otherwise. In addition, we let V be the set of all valves, and v j represent the binary decision variable related to valve j V , where v j = 1 means that valve is inoperable and v j = 0 means otherwise. Based on the logical network, V i is defined as the set of all the valves affecting segment i (i.e., must be operational such that segment i is not unnecessarily isolated) such that i = S V i = V . In addition, we define a : = ( a 1 , a 2 , , a | S | ) , b : = ( b 1 , b 2 , , b | S | ) , and c : = ( c 1 , c 2 , , c | S | ) as the vectors of non-negative real numbers where a i , b i and c i are the coefficients representing the social vulnerability, segment flow volume, and reachability impact of segment i S , respectively.
The optimization model includes three objective functions to be maximized for identifying the worst sets segments to be isolated. Subsequently, from the relationship between segments and valves in the logical network, the worst sets of valves to be inoperable are identified by selecting the sets of valves connected to the identified segments in the logical network. The objective functions of our optimization model are as below:
  • Social vulnerability:
    max i S a i s i
  • Segment flow volume:
    max i S b i s i
  • Reachability impact:
    max i S c i s i
The constraints of the optimization model are as follows:
s i j V i v j i S ,
| V i | s i j V i v j i S ,
i S j V i v j = k ,
v j { 0 , 1 } j V ,
s i { 0 , 1 } i S .
Constraints (4) and (5) define the relationship between valves and segments such that, if and only if at least one of the valves affecting segment i is inoperable (from the minimum set of valves that must be operable), then segment i must be unnecessarily isolated. Note that, since all the objective functions of our optimization problem are in maximization form, Constraint (5) will be naturally satisfied, and, therefore, can be removed from the model. Constraint (6) defines the user-imposed condition on the total number of valves to fail, where k is a positive integer number. Constraints (7) and (8) enforce that the variables representing valves and segments can only take a value of zero or one.
If each valve in the network only affects one segment, then the formulation can be simplified by replacing the constraints (4)–(7) with the following constraints
i S s i = k
Proof. 
Since, | V i | = 1 by assumption, we can rewrite Constraints (4) and (5) as follows:
s i j V i v j s i v i | V i | s i j V i v j s i v i } s i = v i ,
where v i is the binary decision variable showing whether the valve affecting segment i is inoperable or not. This, combined with Constraint (6), results in
i S j V i v j = k i S v i = k i S s i = k

Formulation Two

In this formulation, the model accounts for the uncertainties that are inherent in two of the objective functions of the study. Uncertainties in segment flow volume are assumed to increase (between 5 percent and 95 percent of a given flow value, evenly distributed based on quantile) as pipe diameters decrease. Uncertainties in social vulnerability are assumed to increase as the social-vulnerability index increases (also between 5 percent and 95 percent of a social-vulnerability index value, evenly distributed based on quantile). This assumption is specific to the case study and may differ for other cities.
In order to mathematically formulate the objectives of the new formulation, we define [ a i ̲ , a i ¯ ] and [ b i ̲ , b i ¯ ] as the intervals of the coefficients representing the social vulnerability and segment flow volume. In these intervals, the lower bounds are the estimated lowest values of the social-vulnerability index and segment flow volume, and the upper bounds are the highest values (i.e., the worst-case scenario) that the social vulnerability and segment flow volume impact can be. Furthermore, we define γ as a parameter that represents the level of conservatism of the decision maker. This parameter can take values between zero and one, where γ = 1 means that the decision maker is completely pessimistic and he/she believes that all the coefficients will take their worse values, i.e., a i ¯ and b i ¯ for all i S . However, if γ = 0 , then the decision maker is completely optimistic meaning that the coefficients will take their best values, i.e., a i ̲ and b i ̲ for all i S . If being set to a value in the interval ( 0 , 1 ) , then the decision maker believes that the ratio of parameters that take their worst values is γ .
Following these definitions, the objective functions of social vulnerability and segment flow volume impact are defined as follows:
  • Social Vulnerability:
    max i S a i ̲ s i + ( a i ¯ a i ̲ ) r i
  • Segment Flow Volume:
    max i S b i ̲ s i + ( b i ¯ b i ̲ ) r i
where r i is a binary variable that shows whether the worst-case is happening for segment i or not. The constraints of the robust optimization model include the constraints of formulation one, i.e., constraints (4)–(8), in addition to the following constraints:
r i s i i S ,
i S r i γ ( i S s i ) ,
r i { 0 , 1 } i S .

Formulation Three

This formulation is the most realistic model, which accounts for both the uncertainties that are inherent in two of the objective functions of this study as well as the likelihood of failure within segments (based on pipe failure within the segments). However, the likelihood of failure is complex and there are models that have been developed accounting for pipe length, age, size, and material, among many other things. To protect city data, we use age as the primary factor because most of the pipes in the City of Tampa are severely aged [38].
Based on the likelihood of failures in a given segment, we categorize the set of valves into three categories shown by V h , V m , and V l and representing the sets of valves affecting segments (i.e., the valves that successfully isolate given segments) with high, medium, and low likelihood of need to be operated, respectively. Following this definition, we simply substitute constraint (6) with the following set of constraints:
j V h v j = h
j V m v j = m
j V l v j = l
These constraints impose a user-defined condition on the total number of valves to fail. In these constraints, h, m, and l are the user-defined non-negative integer numbers that represent the number of failures in different categories based on their likelihood of needing to be operated. Note that, as V h , V m , and V l have high, medium, and low likelihoods of needing to be operated, respectively, their corresponding user-defined conditions should be defined such that l m h and h + m + l = k .

2.4.2. Solution Approach

The formulations defined in this study represent a multi-objective optimization problem with three conflicting objectives, or criteria: reachability, segment flow, and social vulnerability. The inclusion of three different objectives in the model makes it impossible to find a single solution that simultaneously optimizes all the objectives. Therefore, we focus on finding the set of solutions for which it is impossible to increase one objective without decreasing other objectives. Such solutions are referred to as efficient or non-dominated solutions in the literature of multi-objective optimization [39]. The importance of finding different efficient solutions is that they help the decision-maker better understand the trade-offs between the objective functions. Therefore, in this study, we only focused on approaches that can generate the entire set of efficient solutions of our problem. Specifically, we implemented two different algorithms, developed by Dächert and Klamroth [40] and Boland et al. [41], in C++ using Gurobi Optimizer V9.0.3 and tested their performance on our specific problem. Among the mentioned algorithms, we chose the method developed by Boland et al. [41], referred to as the “quadrant shrinking method,” as it resulted in the best performance in terms of time and computational complexity. Finally, we note that the computational experiments were conducted on a Dell PowerEdge R360 with two Intel Xeon E5-2650 2.2 GHz 12-Core Processors (30 MB), 128 GB RAM, the RedHat Enterprise Linux 6.8 operating system, and using Gurobi’s default setting.

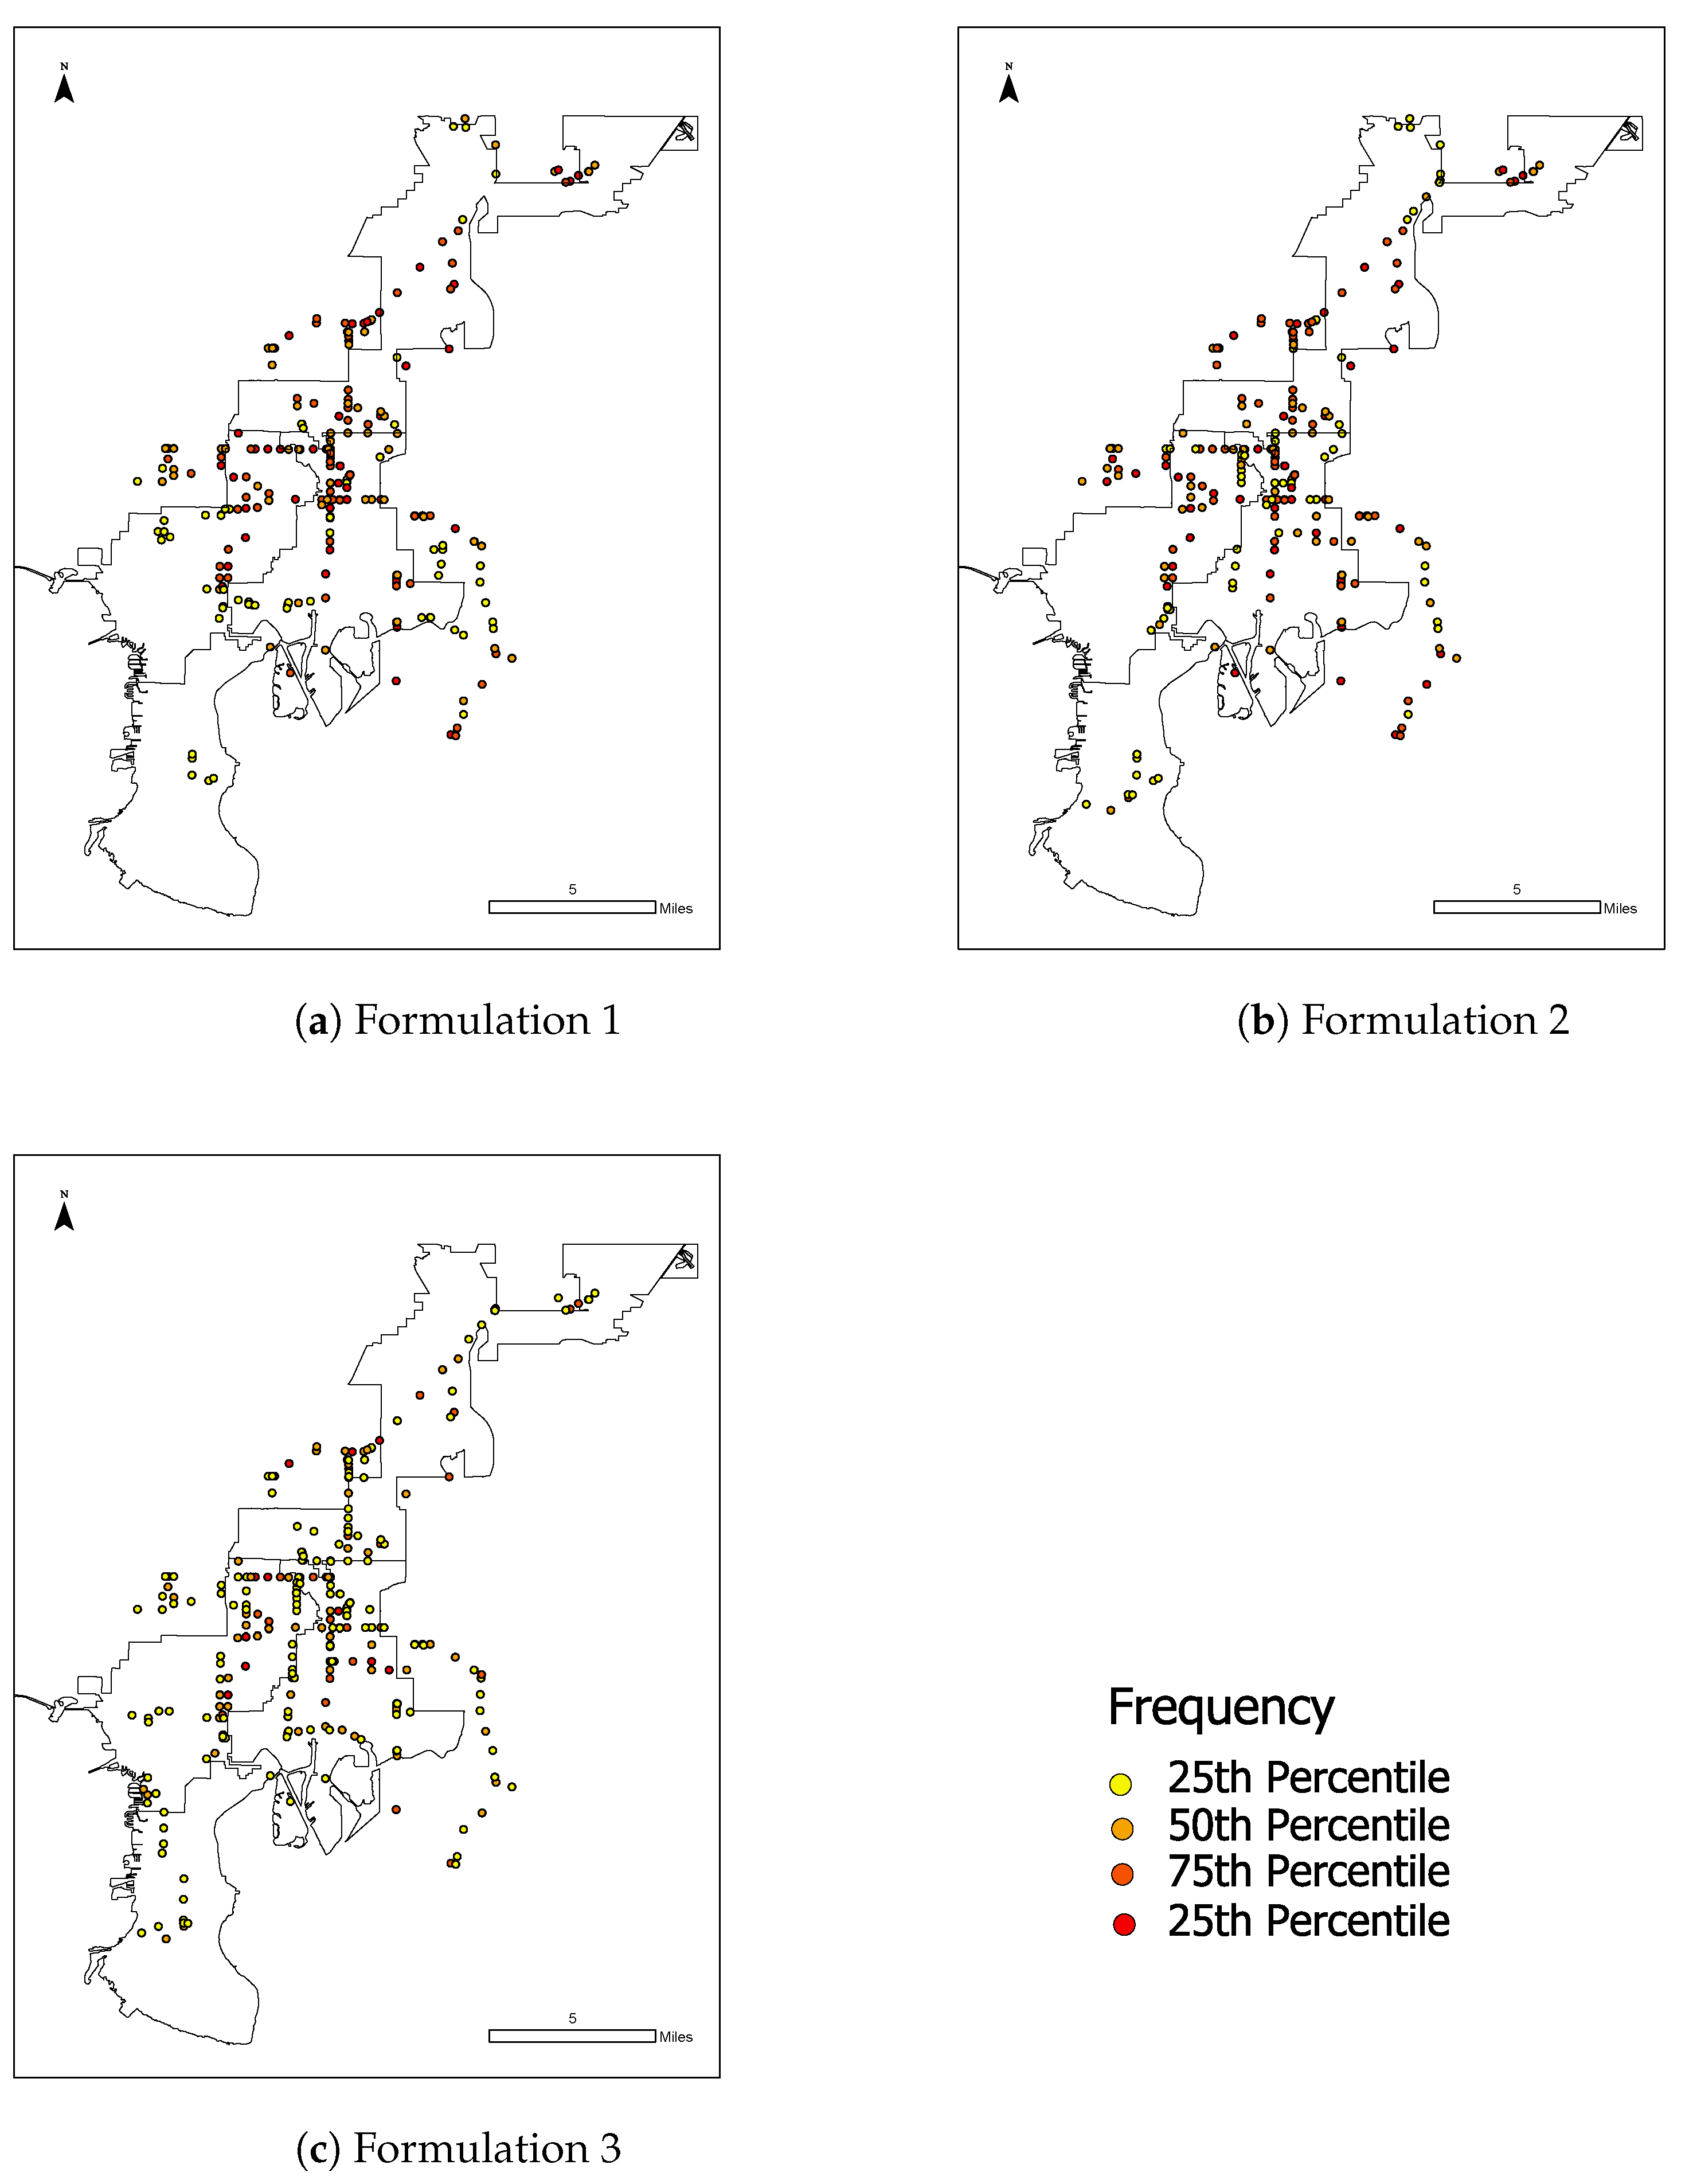
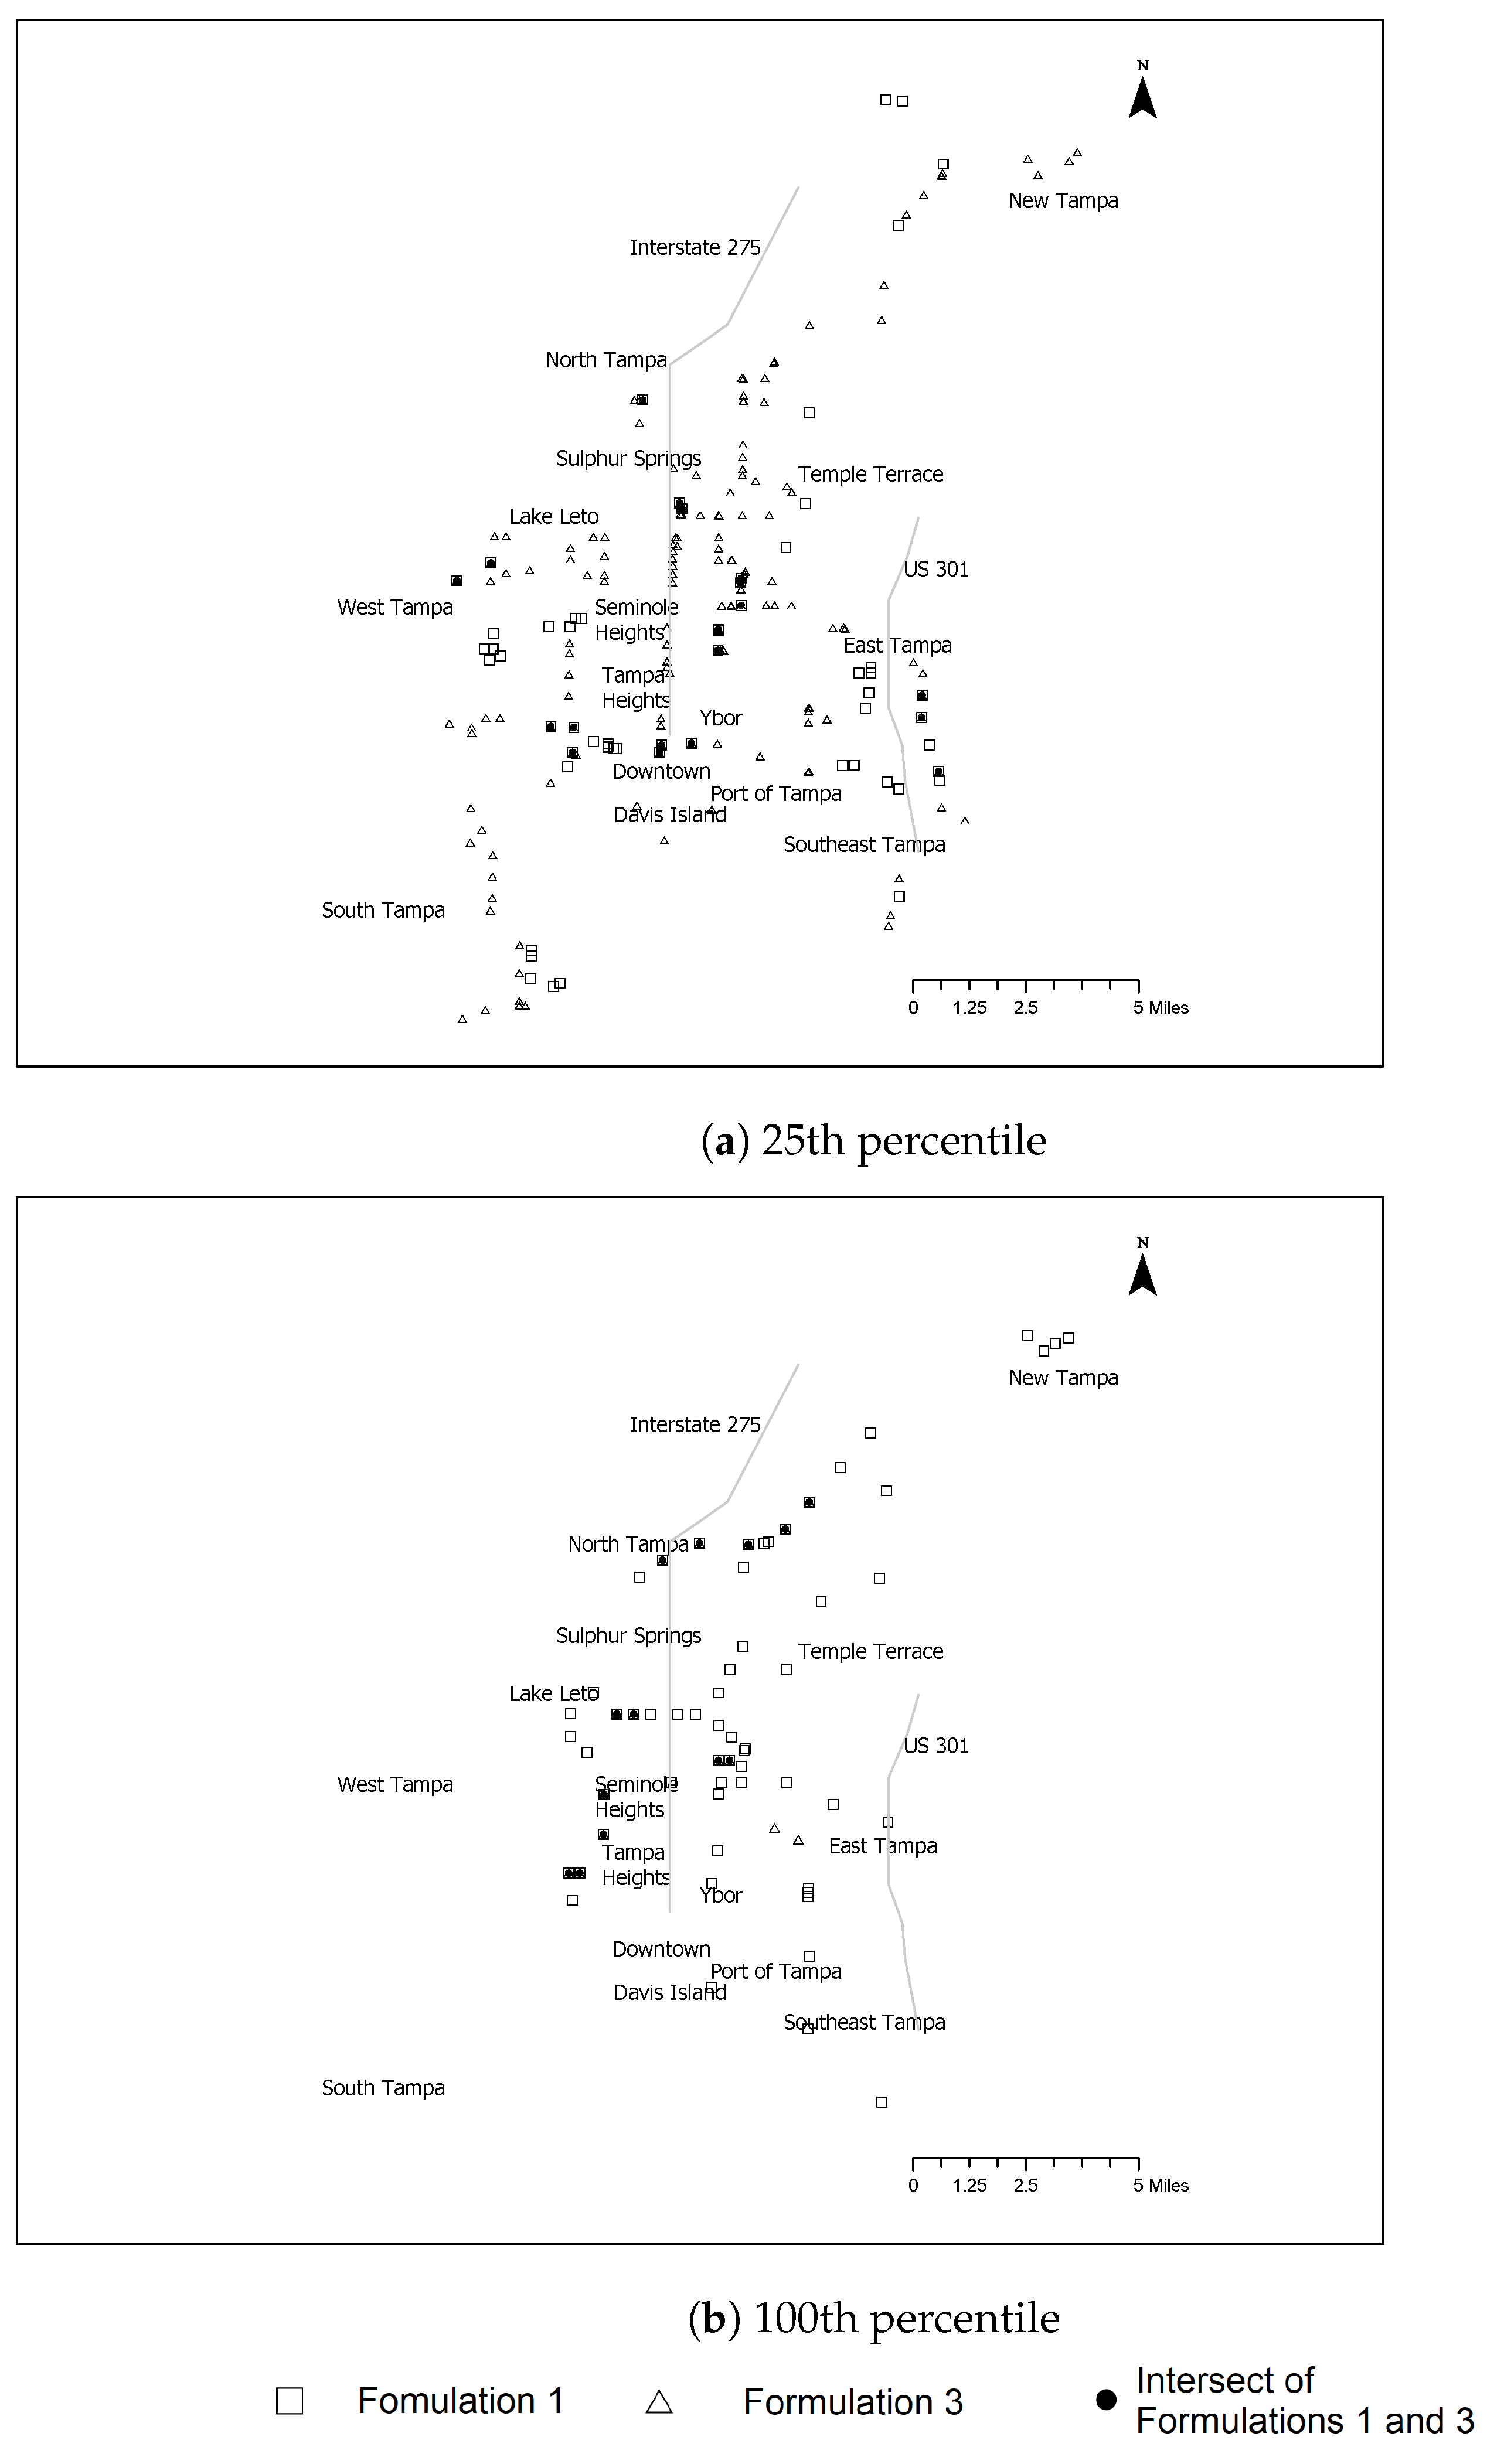
2.5. Post-Optimization Analysis

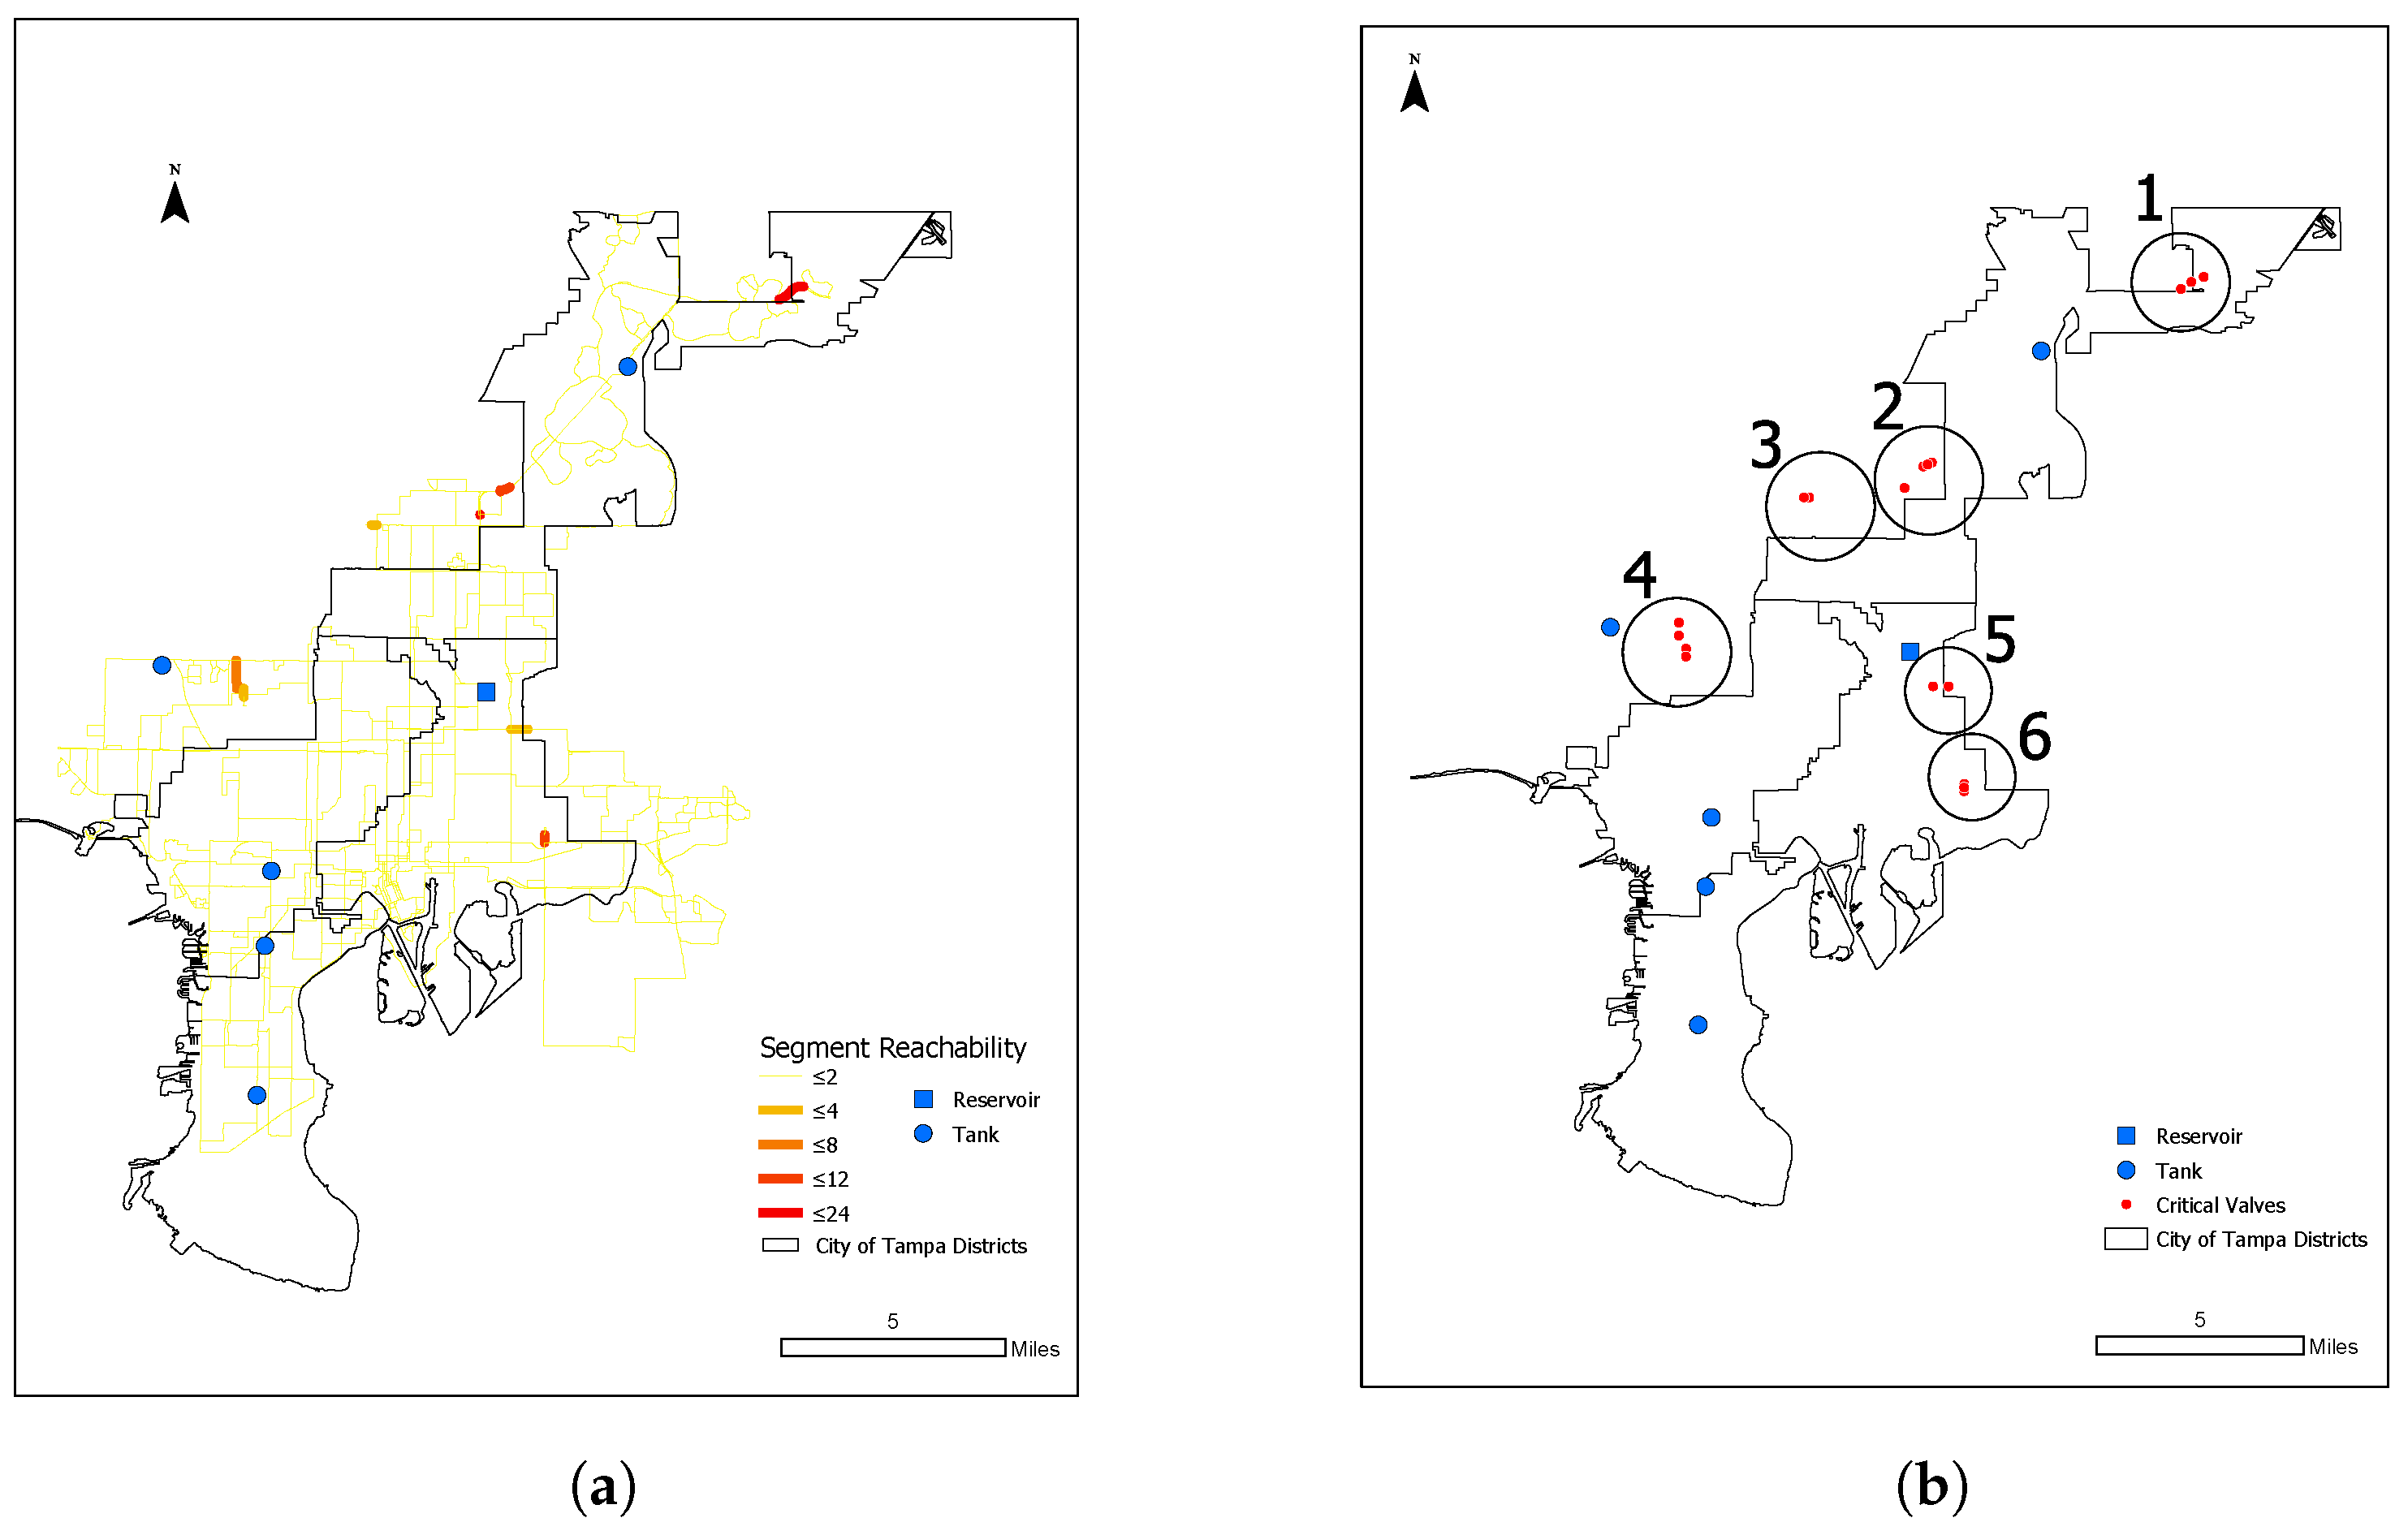
After sets of valves were identified from the optimization model, the number of times (or frequency) each valve appeared in the set of efficient solutions was stored as an attribute. The valves were mapped by their frequency of appearance in ArcGIS pro. To compare the reported valves from the different formulations, the frequencies of valves occurring in the solution set for each formulation were divided into their 25, 50, 75, and 100 percentile ranges. Then, the valves within the same percentile range were compared among model results.

3. Case Study

The model was applied to a field-validated, skeletonized WDN model from the City of Tampa (see [3] for network schematic). Tampa’s WDN has over 134,000 pipes serving over 600,000 customers [38]. There is a single reservoir and five tanks throughout the network (see Figure 3a). The network has approximately 50,000 isolation valves, many of which are inoperable. Therefore, the city is prioritizing valve rehab and replacement—providing impetus for this study. This study tested k = 10 , k = 20 , and k = 30 and k = 30 was selected because it is the most representative. In this study, γ was assigned a value of 0.5 and h, m, and l were assigned values of 15, 9 and 6, respectively.

4. Results and Discussion

4.1. Spatial Variation of Segment Attributes

Prior to applying the developed optimization models, critical WDN locations were mapped based on each segment attribute separately. Segment reachability is mapped in Figure 3a, where segments bridging water sources and more peripheral locations of the network are shown to have higher values. In Figure 3b, valves identified as critical using graph theory based on the reachability to the source are mapped. Only 22 valves were identified using this method, and the identified valves are clustered in 6 different locations in the city, as circled in Figure 3b. In the south-west of the city, where there are three different storage tanks, no critical valves were identified using reachability alone. Clusters 1 and 6 are located in north-east and south-east Tampa, respectively. The valves in these locations were selected due to a lack of redundancy in water pipes. The clusters are locations that bridge between the water reservoir and more remote water distribution segments.
The flow volume of segments is mapped in Figure 4. There are few segments in the highest percentile of flow volume, and they correspond to the distribution mains, which ensure there is sufficient volume being transported from the water source(s) to the sparser periphery of the network. It is interesting to note that the central-south of the city (corresponding to Downtown) has many segments with relatively low flow volume. This is likely because of the high redundancy in this part of the city. In contrast, in Sulphur Springs and Temple Terrace, near the water reservoir, the pipes are generally larger to convey flow to the rest of the network. It is interesting to note that these communities are socially vulnerable, as shown in Figure 5.
Many of the identified critical valves, shown in Figure 3b, also coincide with socially vulnerable communities. In Tampa, vulnerable and non-vulnerable neighborhoods are not completely isolated from each other. Figure 5 shows pockets of lower vulnerability blocks interspersed among neighborhoods with high vulnerability. However, there is generally less vulnerability in the south-west and north-east of the city, in comparison with the center. Interstate 275 (running approximately north–south) intersects the center of the city, dividing communities and highlighting where there are many pockets of socially vulnerable communities.
An interesting observation is that because many of the communities that are socially vulnerable in the city have been historically marginalized, they coincide with aging pipes and, thus, high likelihood of failure in the water distribution segments. However, there are also a few communities with historically very low social vulnerability, yet with aging pipes as well, in the south of the city, as shown in Figure 6.
By mapping the segment attributes (reachability, segment flow volume, and social vulnerability) individually, it is clear that there exist conflicting locations of criticality. For example, in the west of the city (near cluster 4 in Figure 3b), segments have high reachability values and high social vulnerability, but they are not severely aged, nor do they have high flow volume relative to other segments. Likewise, in the downtown area in the south-central location of the city, segment flow volume is relatively low due to the high level of redundancy; however, there are segments with highly aging pipes and high social vulnerability. Additionally, segment age, which is used as a surrogate for the likelihood of failure, follows a different spatial pattern (generally a lower age for locations further away from downtown) than the three segment attributes. Therefore, optimization models are useful to ensure decision-makers can identify the most critical sets of valves based on the three segment attributes (or three objectives), and to account for the likelihood of the failure of segments.

4.2. Critical Valves Based on the Optimization Models

When the multi-objective optimization models were used, more critical valves were identified than by only considering a single objective at a time. In other words, without running an optimization model, some critical valves were not identified. The pareto frontiers of the optimization models contained many repeated valves, allowing the valve criticality to be distinguished based on the percentile of the frequency of valves’ occurrence in the pareto frontier. The number of times a valve occurred in the pareto frontier was counted as a frequency to provide an indication of criticality (relatively low or high compared to other valves selected by the model). The frequencies that valves appeared in the solution set (or pareto frontier) from formulation 1, formulation 2 and formulation 3 are mapped in Figure 7. The deterministic model (formulation 1) selected 251 unique valves, the model accounting for uncertainties (formulation 2) selected 247 unique valves, and the model accounting for uncertainties and likelihood of failure (formulation 3) selected 278 unique valves. However, the results from formulation 2 had higher frequencies of valves occurring in the solution set because of the uncertainties accounted for. The results from Formulations 1 and 2 had more valves in the 75th and 100th percentile, as shown in Figure 7a,b, whereas formulation 3 diversified the selected valves, reducing their frequencies in the solution set (as can be seen in Figure 7c). This is because the constraints added in formulation 3 emphasize selecting a diverse set of solutions based on the likelihood of failure associated with segments.
Overall, the optimization models selected valves along the center of the city, near I-275 (see Figure 8) and in the south-west. The critical valves identified in the south-west increased when uncertainty and likelihood of failure were taken into account. The models also selected more valves along the pipes bridging central and north-east Tampa, whereas in the reachability map, only valves in the north-east and central locations were selected (and not along the pipes bridging the two locations). The optimization models selected valves in the Seminole Heights, Downtown, and Ybor locations, despite the redundancies of valves present in those particular areas. This is likely due to the social-vulnerability objective function because these locations have high social vulnerability. The optimization models also selected valves near the water reservoir, which is expected because of high reachability, segment flow volume, and social vulnerability associated with segments that would be isolated if valves near the reservoir were inoperable. This is consistent with findings from Liu et al. [6], Hernandez and Ormsbee [20] that identified the segments and valves close to the major water source(s) of a WDN as critical. It is also consistent with Paez et al. [32], who found that a disruption to a pipe conveying a larger flow volume has a more adverse impact on a WDN than a disruption to many smaller pipes.
It is important to note that many of the valves identified as critical by formulation 3 were also identified using formulation 2. This means that accounting for uncertainties associated with flow volume and social vulnerability is useful to utilities (even before considering likelihood of failure). In addition to the critical locations identified in formulation 1, formulation 2 selects more valves in East, West, and South-west Tampa. While West and East Tampa have high social vulnerability (and, thus, high uncertainty), South-west Tampa has low to moderate social vulnerability. Additionally, the segment flow volume of South-west Tampa is not high, but, rather, low to moderate. The reachability of South-west Tampa is also not high. For these reasons, the increased selection of critical valves in South-west Tampa was not expected. The optimization model captures the interplay between uncertainties that decision-makers would otherwise remain unaware of. Finally, the likelihood of failure of the segments in South-west Tampa is approximately average; therefore, it is not surprising that formulation 3 selected the same valves as formulation 2. The following section discusses the differences in the valves identified as critical by formulations 1 (deterministic) and 3 (accounting for uncertainties and likelihoods of failure), the valves selected by these two models are compared at varying percentiles (as shown in Figure 8).

4.3. Differences between the Formulations

Both formulations 1 and 3 identified critical valves in the North-east (New Tampa) and East Tampa, but the selected individual valves varied. These locations were selected by the model because they bridge between the reservoir and the periphery of the WDN. The variation in the individual valves is likely due to the likelihood of segment failure that is accounted for in formulation 3. In addition, there were more valves selected by the deterministic model (formulation 1) in East Tampa. When uncertainties and the likelihood of failure were included (i.e., formulation 3), they were not selected, as shown in Figure 8d. This may be because of more newly installed pipes (as shown in Figure 6) and pipe replacement projects [42,43], which contribute to a lower likelihood of failure in East Tampa. Additionally, social vulnerability is relatively low in East Tampa in comparison with locations such as Ybor or North Tampa, meaning there is lower uncertainty associated with the social vulnerability of segments in East Tampa, leading the model to select fewer valves in East Tampa when uncertainties are accounted for. Although the models selected many common valves (shown in Figure 8d), the deterministic model selected more valves in proximity to those common valves. This is likely due to the additional constraints (for the likelihood of failure) in formulation 3 limiting the selected valves in a given location. More importantly, the models can vary in the level of criticality assigned to selected valves. For example, formulation 3 selected valves in the Lake Leto area in the 25th percentile (Figure 8a), but formulation 1 selected valves from that location at the higher percentiles. In other words, the Lake Leto area is less critical when the likelihood of failure and uncertainty in flow volumes and social vulnerability are accounted for. This is an example of how including uncertainty and the likelihood of failure in the model provide more complete information for decision-makers. Additionally, including uncertainty and the likelihood of failure reduces the number of critical valves identified as the percentile (of the frequency of valves occurring in the solution set) increases. This is because formulation 3 includes additional constraints (i.e., based on their likelihood of failure), thereby eliminating solutions (i.e., sets of valves) that were identified by the exact method. The reduced number of critical valves identified at the higher percentiles makes the model results more readily considered by decision-makers. Another advantage of formulation 3 is that it allows valves to be identified as critical (even if at a lower percentile of frequency) where they otherwise may not have been selected at all. For example, if criticality is determined by the likelihood of failure alone, there would be fewer valves selected in the recently developed Northeast of the city (or the New Tampa location), but because the likelihood of failure is integrated within the model, there are still valves selected with high frequency in the north-east of the city. This is due to high values of reachability and flow volume of segments in the north-east.

4.4. Potential Implications of the Optimization Models

This study applied multi-objective optimization to identify critical isolation valves in a real WDN. The optimization models were solvable within a reasonable time and provided results that are useful to utilities. In particular, the models made it easier to identify valves as critical that may have been missed using single objectives. The optimization model formulations allow decision-makers to account for multiple facets of valve criticality. In particular, including social vulnerability in the optimization formulation identifies communities that may unduly suffer from an extended lack of water. If valves in these communities are operable, unsupplied demand to vulnerable customers may be reduced. Formulation 2, in particular, allows decision-makers to take uncertainties of segment attributes into account. Even more useful, formulation 3 prioritized the selection of valves based on the likelihood of failure. Ultimately, formulation 3 diversifies the identified valves while also selecting fewer unique valves at higher percentiles of criticality. Obtaining the common valves identified by both formulations 1 and 3 may help hone in on highly critical valves. This is because valves selected by both models are not only critical but also connect the segments with a high likelihood of failure and high uncertainties associated with flow volume and social vulnerability. As the models result in many repeated valves, the frequencies of valves occurring in the solution sets can be used to rank the selected valves or divide them into varying levels of priority. This can offer utilities a powerful alternative to the method used in traditional asset management, such as multiplying the consequence of failure and likelihood of failure [38,44,45], which limits the identified critical components (i.e., does not identify all of them) [3].
However, there remain limitations to this study. The consequence-of-failure scores used by utilities may have more than three variables factored in. In that case, when using the current models, some variables would be combined (i.e., weighted together), but the results would be more diverse than weighing all the variables as a single objective (i.e., traditional score of the consequence of failure) assigned to segments. Though social vulnerability is used as an objective function, it may be substituted with a lifeline facility indicator (e.g., number of hospitals and schools in a census block, number of shelters)—which may be more useful to utilities for analyzing the impact of inoperable valves after disturbances [33,46]. In this study, likelihood of failure was reduced to a surrogate based on pipe age, whereas, in reality, it is also affected by the length of pipe in a segment, soil conditions, and pipe safety factor, among many other things. However, this does not impact the methodology because the values from the function for the likelihood of failure that a utility uses for their asset management can be input to the model the same way.

5. Conclusions

This study formulated models for identifying critical isolation valves in WDNs. The study proposed the use of a Gomory–Hu tree to represent how segment isolation ultimately propagates within a given WDN. A major contribution of the study is applying graph theory to simplify the combinatorial problem of multiple valves affecting segments (because of multiple possible flow paths between segments). This can help identify critical valves without simulating many scenarios, including combinations of operable and inoperable valves. The Gomory–Hu tree may also be useful in the failure analysis of other flow-based infrastructure networks because it helps to ascertain the logical implications of component failure in a network. Further, this study evaluated the critical valves not only based on hydraulics, but also on social vulnerability. The identified critical valves differed when social vulnerability was included as an objective function in the optimization procedure—suggesting that social indicators (be they demographic or related to lifeline facilities) should be included in infrastructure criticality analyses. Another advance the study made is accounting for both uncertainties (in water flow and social vulnerability) and the likelihood of failure of segments when identifying critical valves; the model accounting for uncertainties and likelihood of failure was compared with the deterministic model.
Results showed that the formulation accounting for uncertainties selects more valves, including in unexpected locations. However, the formulation accounting for both uncertainties and likelihood of failure narrows the selection down due to additional constraints. All optimization models were solvable within a reasonable time and different formulations provide additional insights that are useful to utilities. The multi-objective optimization model makes it easier to identify critical valves that may have been missed using single objectives or traditional asset management methods. Future work can address the limitations of the current study by using the actual likelihood of failure from utilities instead of a surrogate based on pipe age. Additionally, including a lifeline facility indicator related to segments in the objective functions can help utilities determine critical valves, especially under extreme disturbances.

Author Contributions

Conceptualization, N.A.-M. and Q.Z.; methodology, N.A.-M., P.G.S., M.J.W., E.C.W., H.C. and Q.Z.; software, N.A.-M., P.G.S. and H.C.; formal analysis, N.A.-M., P.G.S. and M.J.W.; investigation, N.A.-M. and P.G.S.; data curation, N.A.-M., P.G.S., M.J.W. and Q.Z.; writing—original draft preparation, N.A.-M., P.G.S., M.J.W., H.C. and E.C.W.; writing—review and editing, N.A.-M., P.G.S., M.J.W., H.C., E.C.W. and Q.Z.; supervision, H.C., E.C.W. and Q.Z.; funding acquisition, H.C., E.C.W. and Q.Z. All authors have read and agreed to the published version of the manuscript.

Funding

This material is based upon work supported by the National Science Foundation under Grant Number 1638301. Any opinions, findings, and conclusions or recommendations expressed in this material are those of the authors and do not necessarily reflect the views of the National Science Foundation.

Institutional Review Board Statement

Not applicable.

Informed Consent Statement

Not applicable.

Data Availability Statement

The water distribution network for the city of Tampa is confidential due to security reasons. The code to obtain the Gomory–Hu Tree and to run the multi-objective optimization are available upon request from the corresponding author. All software used to obtain data and analyze results is cited in the paper. The commercial software Arcpro, WaterGEMS, and Gurobi were used for generating maps, hydraulic simulations and optimization, respectively. Open-source software Python and the networkx package were used for network analysis.

Acknowledgments

The authors are grateful for the water distribution network data provided by Brian Pickard and Seung Park from the City of Tampa Water Department. N. Abdel-Mottaleb is grateful for the valuable discussions with Tom Walski which helped develop the ideas for the study.

Conflicts of Interest

The authors declare no conflict of interest. The funders had no role in the design of the study; in the collection, analyses, or interpretation of data; in the writing of the manuscript; or in the decision to publish the results.

References

  1. Shuang, Q.; Zhang, M.; Yuan, Y. Performance and reliability analysis of water distribution systems under cascading failures and the identification of crucial pipes. PLoS ONE 2014, 9, e088445. [Google Scholar] [CrossRef] [PubMed]
  2. He, X.; Yuan, Y. A Framework of Identifying Critical Water Distribution Pipelines from Recovery Resilience. Water Resour. Manag. 2019, 33, 3691–3706. [Google Scholar] [CrossRef]
  3. Abdel-Mottaleb, N.; Ghasemi Saghand, P.; Charkhgard, H.; Zhang, Q. An Exact Multiobjective Optimization Approach for Evaluating Water Distribution Infrastructure Criticality and Geospatial Interdependence. Water Resour. Res. 2019, 55, 5255–5276. [Google Scholar] [CrossRef]
  4. Giustolisi, O.; Savic, D. Identification of segments and optimal isolation valve system design in water distribution networks. Urban Water J. 2010, 7, 1–15. [Google Scholar] [CrossRef]
  5. Santonastaso, G.; Di Nardo, A.; Creaco, E. Dual topology for partitioning of water distribution networks considering actual valve locations. Urban Water J. 2019, 16, 469–479. [Google Scholar] [CrossRef]
  6. Liu, H.; Walski, T.; Fu, G.; Zhang, C. Failure impact analysis of isolation valves in a water distribution network. J. Water Resour. Plan. Manag. 2017, 143, 04017019. [Google Scholar] [CrossRef] [Green Version]
  7. WaterWorld. Case Study: OK Water District Updates Distribution Systems with Isolation Valves. 2014. Available online: https://agupubs.onlinelibrary.wiley.com/doi/full/10.1029/2018WR024063 (accessed on 5 June 2018).
  8. Times, N.Y. Hard-Hit Parts of Florida Struggle to Find Clean Drinking Water. 2022. Available online: https://www.nytimes.com/2022/10/01/us/florida-water-hurricane-ian.html (accessed on 16 August 2022).
  9. Unicef. 1.4 Million People without Running Water Across War-Affected Eastern Ukraine. 2022. Available online: https://www.unicef.org/press-releases/14-million-people-without-running-water-across-war-affected-eastern-ukraine (accessed on 16 August 2022).
  10. Mays, L.W. Water Distribution Systems Handbook; McGraw-Hill: New York, NY, USA, 2000. [Google Scholar]
  11. Jun, H.; Loganathan, G. Valve-controlled segments in water distribution systems. J. Water Resour. Plan. Manag. 2007, 133, 145–155. [Google Scholar] [CrossRef]
  12. Creaco, E.; Haidar, H. Multiobjective Optimization of Control Valve Installation and DMA Creation for Reducing Leakage in Water Distribution Networks. J. Water Resour. Plan. Manag. 2019, 145, 04019046. [Google Scholar] [CrossRef]
  13. Giustolisi, O. Water Distribution Network Reliability Assessment and Isolation Valve System. J. Water Resour. Plan. Manag. 2020, 146, 04019064. [Google Scholar] [CrossRef]
  14. Yang, Z.; Guo, S.; Hu, Z.; Yao, D.; Wang, L.; Yang, B.; Liang, X. Optimal Placement of New Isolation Valves in a Water Distribution Network Considering Existing Valves. J. Water Resour. Plan. Manag. 2022, 148, 04022032. [Google Scholar] [CrossRef]
  15. Morosini, A.F.; Caruso, O.; Veltri, P. Management of water distribution systems in PDA condition with isolation valves. Multidiscip. Digit. Publ. Inst. Proc. 2018, 2, 672. [Google Scholar]
  16. Hernandez Hernandez, E.; Ormsbee, L. A heuristic for strategic valve placement. J. Water Resour. Plan. Manag. 2022, 148, 04021103. [Google Scholar] [CrossRef]
  17. Mahmoud, H.A.; Kapelan, Z.; Savić, D. Real-time operational response methodology for reducing failure impacts in water distribution systems. J. Water Resour. Plan. Manag. 2018, 144, 04018029. [Google Scholar] [CrossRef]
  18. Zischg, J.; Reyes-Silva, J.D.; Klinkhamer, C.; Krueger, E.; Krebs, P.; Rao, P.S.C.; Sitzenfrei, R. Complex network analysis of water distribution systems in their dual representation using isolation valve information. In Proceedings of the World Environmental and Water Resources Congress; ASCE: Pittsburgh, PA, USA, 2019; pp. 484–497. [Google Scholar]
  19. Abdel-Mottaleb, N.; Walski, T. Identifying Vulnerable and Critical Water Distribution Segments; American Society of Civil Engineers: New York, NY, USA, 2020. [Google Scholar]
  20. Hernandez, E.; Ormsbee, L. Segment-Based Assessment of Consequences of Failure on Water Distribution Systems. J. Water Resour. Plan. Manag. 2021, 147, 04021009. [Google Scholar] [CrossRef]
  21. Atashi, M.; Ziaei, A.N.; Khodashenas, S.R.; Farmani, R. Impact of isolation valves location on resilience of water distribution systems. Urban Water J. 2020, 17, 560–567. [Google Scholar] [CrossRef]
  22. Choi, Y.H.; Jung, D.; Jun, H.; Kim, J.H. Improving water distribution systems robustness through optimal valve installation. Water 2018, 10, 1223. [Google Scholar] [CrossRef] [Green Version]
  23. Giustolisi, O.; Ridolfi, L.; Simone, A. Embedding the intrinsic relevance of vertices in network analysis: The case of centrality metrics. Sci. Rep. 2020, 10, 1–11. [Google Scholar] [CrossRef] [Green Version]
  24. Simone, A.; Di Cristo, C.; Giustolisi, O. Analysis of the isolation valve system in water distribution networks using the segment graph. Water Resources Management 2022, 36, 3561–3574. [Google Scholar] [CrossRef]
  25. Giustolisi, O.; Ciliberti, F.G.; Berardi, L.; Laucelli, D.B. A Novel Approach to Analyze the Isolation Valve System Based on the Complex Network Theory. Water Resour. Res. 2022, 58, e2021WR031304. [Google Scholar] [CrossRef]
  26. Walski, T.M. The wrong paradigm—Why water distribution optimization doesn’t work. J. Water Resour. Plan. Manag. 2001, 127, 203–205. [Google Scholar] [CrossRef]
  27. Zischg, J.; Rauch, W.; Sitzenfrei, R. Morphogenesis of urban water distribution networks: A spatiotemporal planning approach for cost-efficient and reliable supply. Entropy 2018, 20, 708. [Google Scholar] [CrossRef] [PubMed]
  28. Shuang, Q.; Liu, H.J.; Porse, E. Review of the quantitative resilience methods in water distribution networks. Water 2019, 11, 1189. [Google Scholar] [CrossRef] [Green Version]
  29. Diao, K.; Sitzenfrei, R.; Rauch, W. The impacts of spatially variable demand patterns on water distribution system design and operation. Water 2019, 11, 567. [Google Scholar] [CrossRef] [Green Version]
  30. Abdel-Mottaleb, N.; Walski, T. Evaluating Segment and Valve Importance and Vulnerability. J. Water Resour. Plan. Manag. 2021, 147, 04021020. [Google Scholar] [CrossRef]
  31. Bentley Systems. Bentley WaterGEMS; Bentley Systems: Exton, PA, USA, 2020. [Google Scholar]
  32. Paez, D.; Filion, Y.; Castro-Gama, M.; Quintiliani, C.; Santopietro, S.; Sweetapple, C.; Meng, F.; Farmani, R.; Fu, G.; Butler, D.; et al. Battle of Postdisaster Response and Restoration. J. Water Resour. Plan. Manag. 2020, 146, 04020067. [Google Scholar] [CrossRef]
  33. Borden, K.A.; Schmidtlein, M.C.; Emrich, C.T.; Piegorsch, W.W.; Cutter, S.L. Vulnerability of US Cities to Environmental Hazards. J. Homel. Secur. Emerg. Manag. 2007, 4, 1–23. [Google Scholar]
  34. Cutter, S.L.; Boruff, B.J.; Shirley, W.L. Social vulnerability to environmental hazards. Soc. Sci. Q. 2003, 84, 242–261. [Google Scholar] [CrossRef]
  35. Wakhungu, M.J.; Abdel-Mottaleb, N.; Wells, E.C.; Zhang, Q. Geospatial Vulnerability Framework for Identifying Water Infrastructure Inequalities. J. Environ. Eng. 2021, 147, 04021034. [Google Scholar] [CrossRef]
  36. Chavez, M.A. Desert in the Springs: Ethnography of a Food Desert. Master’s Thesis, University of South Florida, Tampa, FL, USA, 2013. [Google Scholar]
  37. Wakhungu, M.J. An Ethnography of WaSH Infrastructures and Governance in Sulphur; Springs: Tampa, FL, USA, 2020. [Google Scholar]
  38. Park, S.; Vega, R.; Choto, Z.; Grewe, M. Risk-based asset prioritization of water transmission/distribution pipes for the City of Tampa. Fla. Water Resour. Dec. 2010, 22–28. [Google Scholar]
  39. Saghand, P.G.; Charkhgard, H.; Kwon, C. A branch-and-bound algorithm for a class of mixed integer linear maximum multiplicative programs: A bi-objective optimization approach. Comput. Oper. Res. 2019, 101, 263–274. [Google Scholar] [CrossRef]
  40. Dächert, K.; Klamroth, K. A linear bound on the number of scalarizations needed to solve discrete tricriteria optimization problems. J. Glob. Optim. 2015, 61, 643–676. [Google Scholar] [CrossRef] [Green Version]
  41. Boland, N.; Charkhgard, H.; Savelsbergh, M. The quadrant shrinking method: A simple and efficient algorithm for solving tri-objective integer programs. Eur. J. Oper. Res. 2017, 260, 873–885. [Google Scholar] [CrossRef]
  42. FDOT. Completed Project Finder; FDOT: Tallahassee, FL, USA, 2020. [Google Scholar]
  43. Tampa Bay Water Capital Improvements Program Fiscal Years 2019–2028; Tampa Bay Water: Clearwater, FL, USA, 2018.
  44. Ispass, A. A Practical Approach to Implementing Asset Management. In Proceedings of the 2008 WEF Utility Management Conference, Tampa, FL, USA, 24–27 February 2008. [Google Scholar]
  45. Pollard, S. Risk Management for Water and Wastewater Utilities; IWA Publishing: London, UK, 2016. [Google Scholar]
  46. Emrich, C.T. Social Vulnerability in US Metropolitan Areas: Improvements in Hazard Vulnerability Assessment. Ph.D. Thesis, University of South Carolina, Columbia, SC, USA, 2005. [Google Scholar]
Figure 1. Segment-valve represenation and Gomory–Hu tree of a network example. (a) Segment-valve representation of a small example network. (b) Gomory–Hu tree of small example, where edges that represent more than one valve are bolded.
Water 14 03587 g001
Figure 2. Representation of the logical network, where valves that were represented by edges are modeled as nodes and segments are also modeled as nodes, and the edges between valves and segments represent logical implications.
Water 14 03587 g002
Figure 3. Segment reachability values and the subsequently identified critical valves. (a) Map of segment reachability values. (b) Map of critical valves.
Water 14 03587 g003
Figure 4. Map of segment flow volume.
Water 14 03587 g004
Figure 5. Map of social-vulnerability index, adapted from [35].
Water 14 03587 g005
Figure 6. Segment age mapped by color; age is used as a surrogate for the likelihood of failure.
Water 14 03587 g006
Figure 7. Maps of identified valves using the three formulations, where formulation 1 is deterministic, formulation 2 accounts for uncertainty, and formulation 3 accounts for uncertainty and likelihood of failure.
Water 14 03587 g007
Figure 8. Maps of valves identified by formulations 1 and 3 at various percentiles for the frequency of occurrence in the solution set.
Water 14 03587 g008
Publisher’s Note: MDPI stays neutral with regard to jurisdictional claims in published maps and institutional affiliations.

