3.1. Influence of Rainfall Pattern Parameters on the Reduction of Heat Pollution Load of Rainwater Runoff
By changing the rain pattern parameters, the experimental study on heat-pollution reduction of rainwater runoff from bioretention facilities was carried out. During the experiment, the air temperature was 16~27 °C, and the heat-reduction rate (HR), volume-reduction rate (VR), the contribution of volume reduction (CVR), and contribution of heat exchange (CHE) were obtained. See
Table 3 below.
It can be seen from
Table 3 that, based on the abovementioned rain pattern parameters, the VR of the bioretention facilities was 13~61%, which is close to the 27~76% rainfall effluent results obtained by Jones M [
23] in the study on the thermal pollution of the bioretention facilities in the riparian biological reserve, so the experimental results are reliable. The reduction range of thermal pollution load of rainwater runoff was 21~63%. In addition to volume reduction, there was also heat exchange between the heat in runoff rainwater and the internal medium of bioretention facilities, so the overall reduction of thermal pollution load was slightly higher than the volume reduction rate. We created an HR and VR relation diagram, and obtained the results presented in
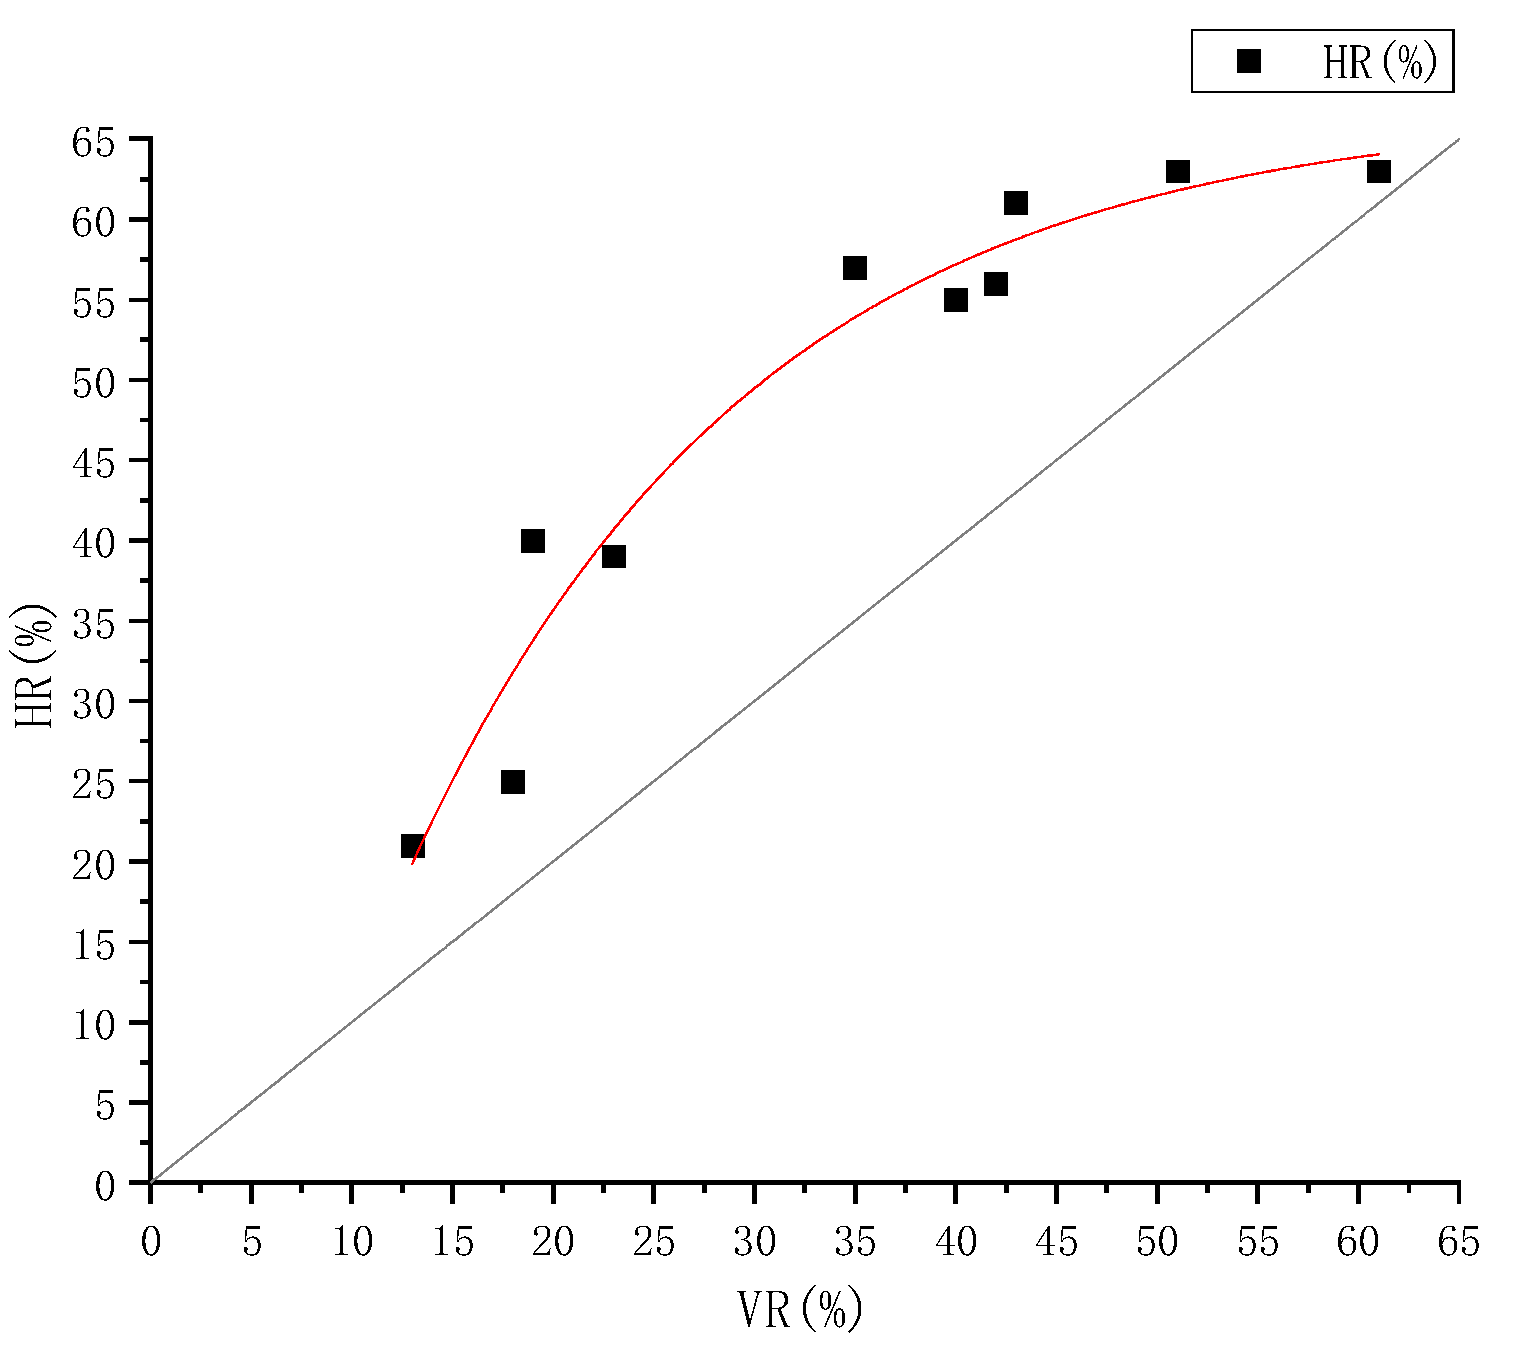
Figure 2. With the gradual increase of VR, the rising speed of HR began to accelerate gradually. When VR was greater than 30%, the rising speed slowed down gradually. According to the data in
Table 2, under the same rainfall temperature, with the increase of total rainfall volume, HR/VR also gradually increased, indicating that with the increase of rainfall volume, the contribution rate of volume reduction in heat exchange gradually decreases.
The rainfall volume is related to the rainfall return period, rainfall duration, and the catchment area of facility service. Draw
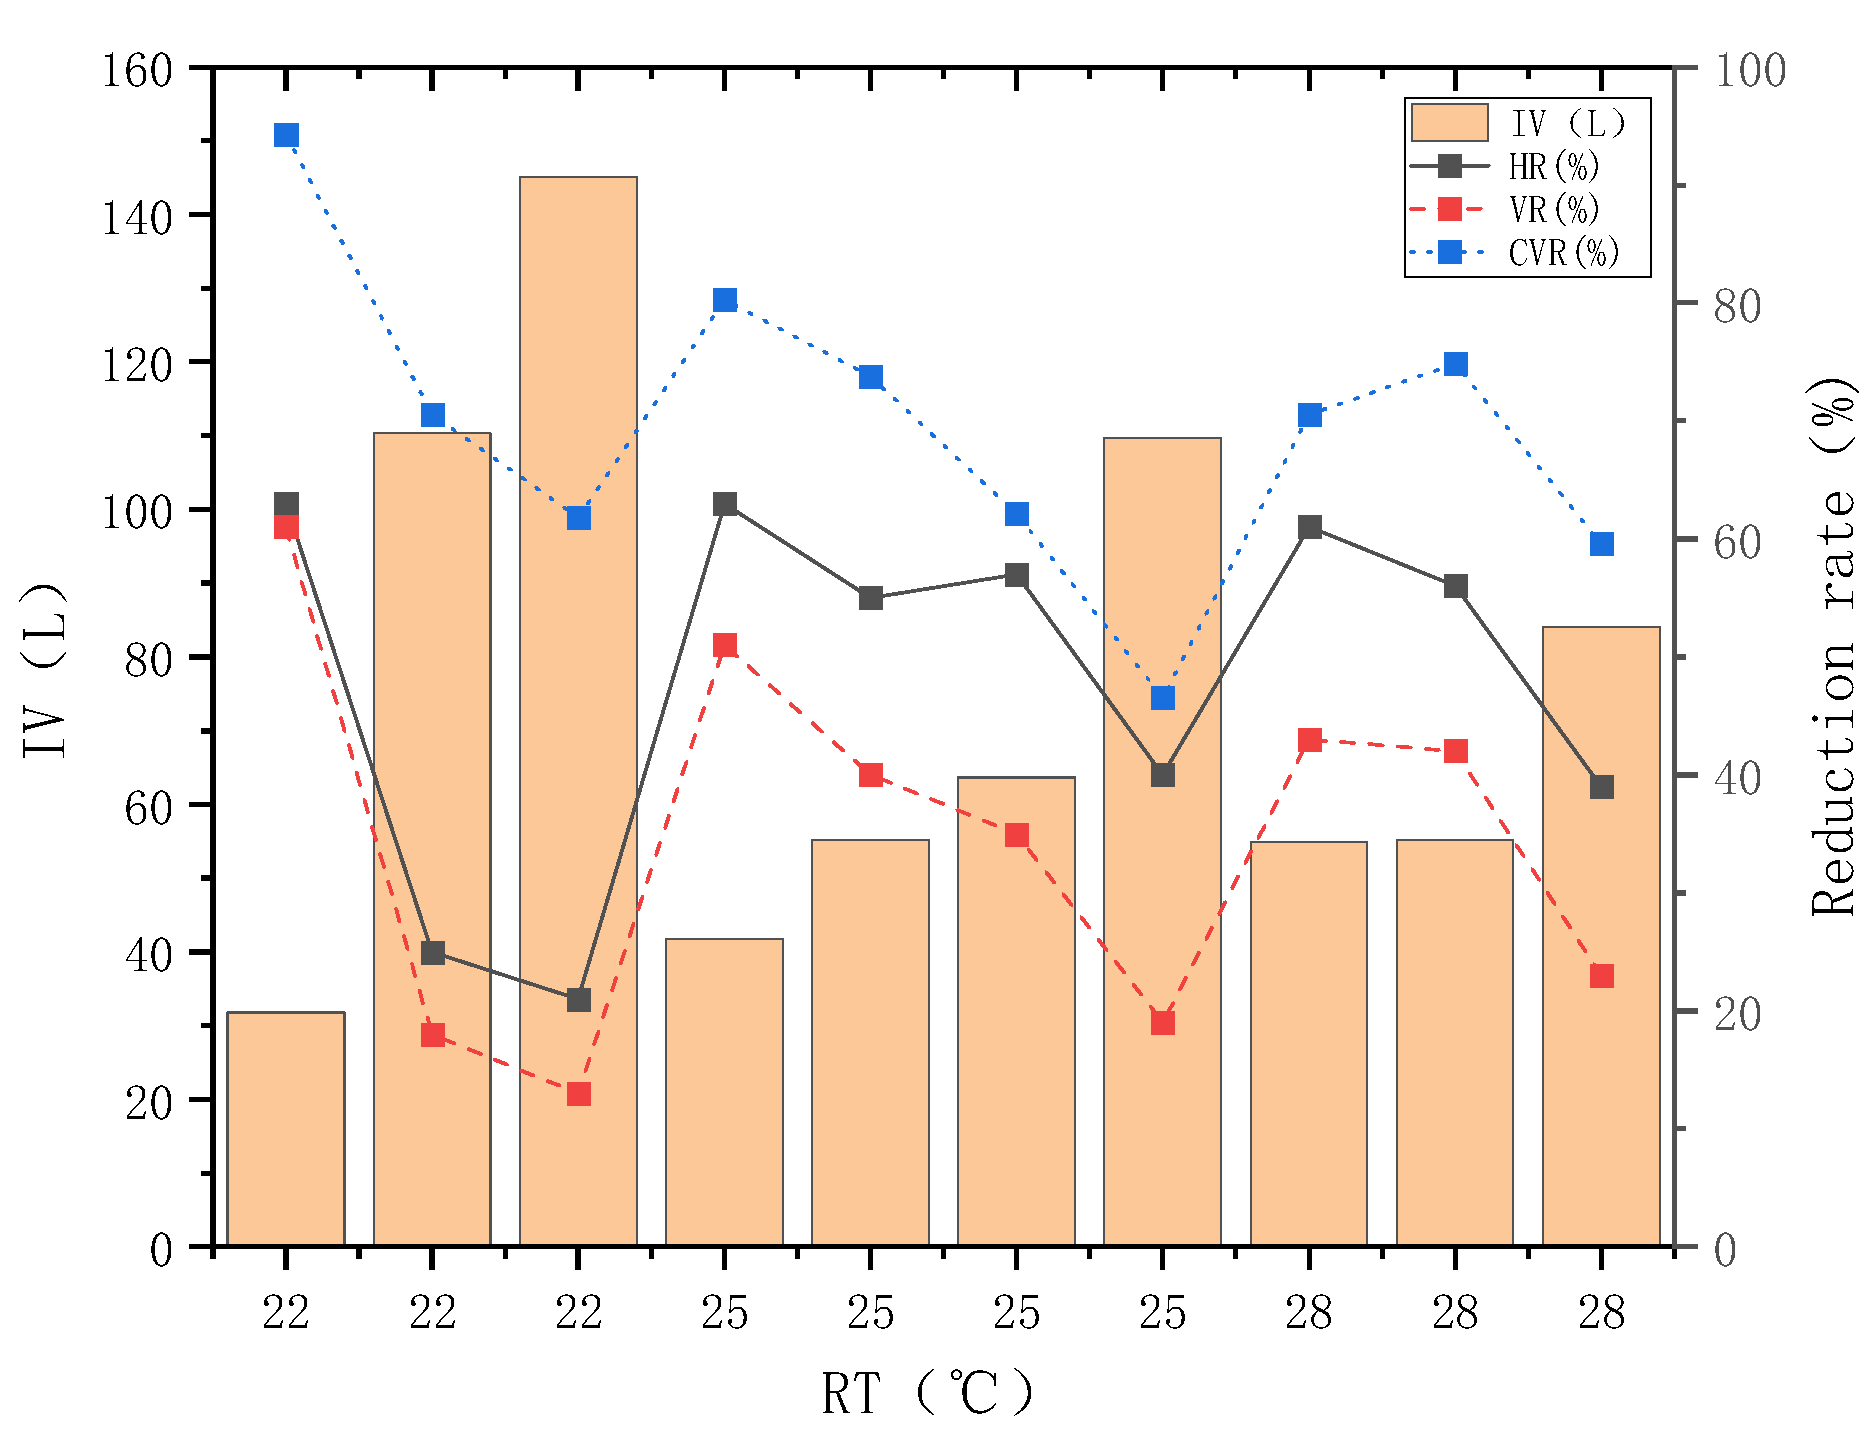
Figure 3 according to the sequence of temperature from low to high and volume from small to large. It can be found that with the increase of the total volume of rainfall, the reduction rate of heat pollution decreased on the whole. Under the condition of similar rainfall volume, combined with the parameters of rainfall temperature in
Table 3, it can be known that the higher the rainfall temperature, the higher the HR of facilities. The preliminary analysis of the cause of this phenomenon is that under the premise that the internal temperature of the bioretention facility is close, the RT increases, increasing the temperature difference between the rainwater and the internal medium of the facility, and enhancing heat exchange.
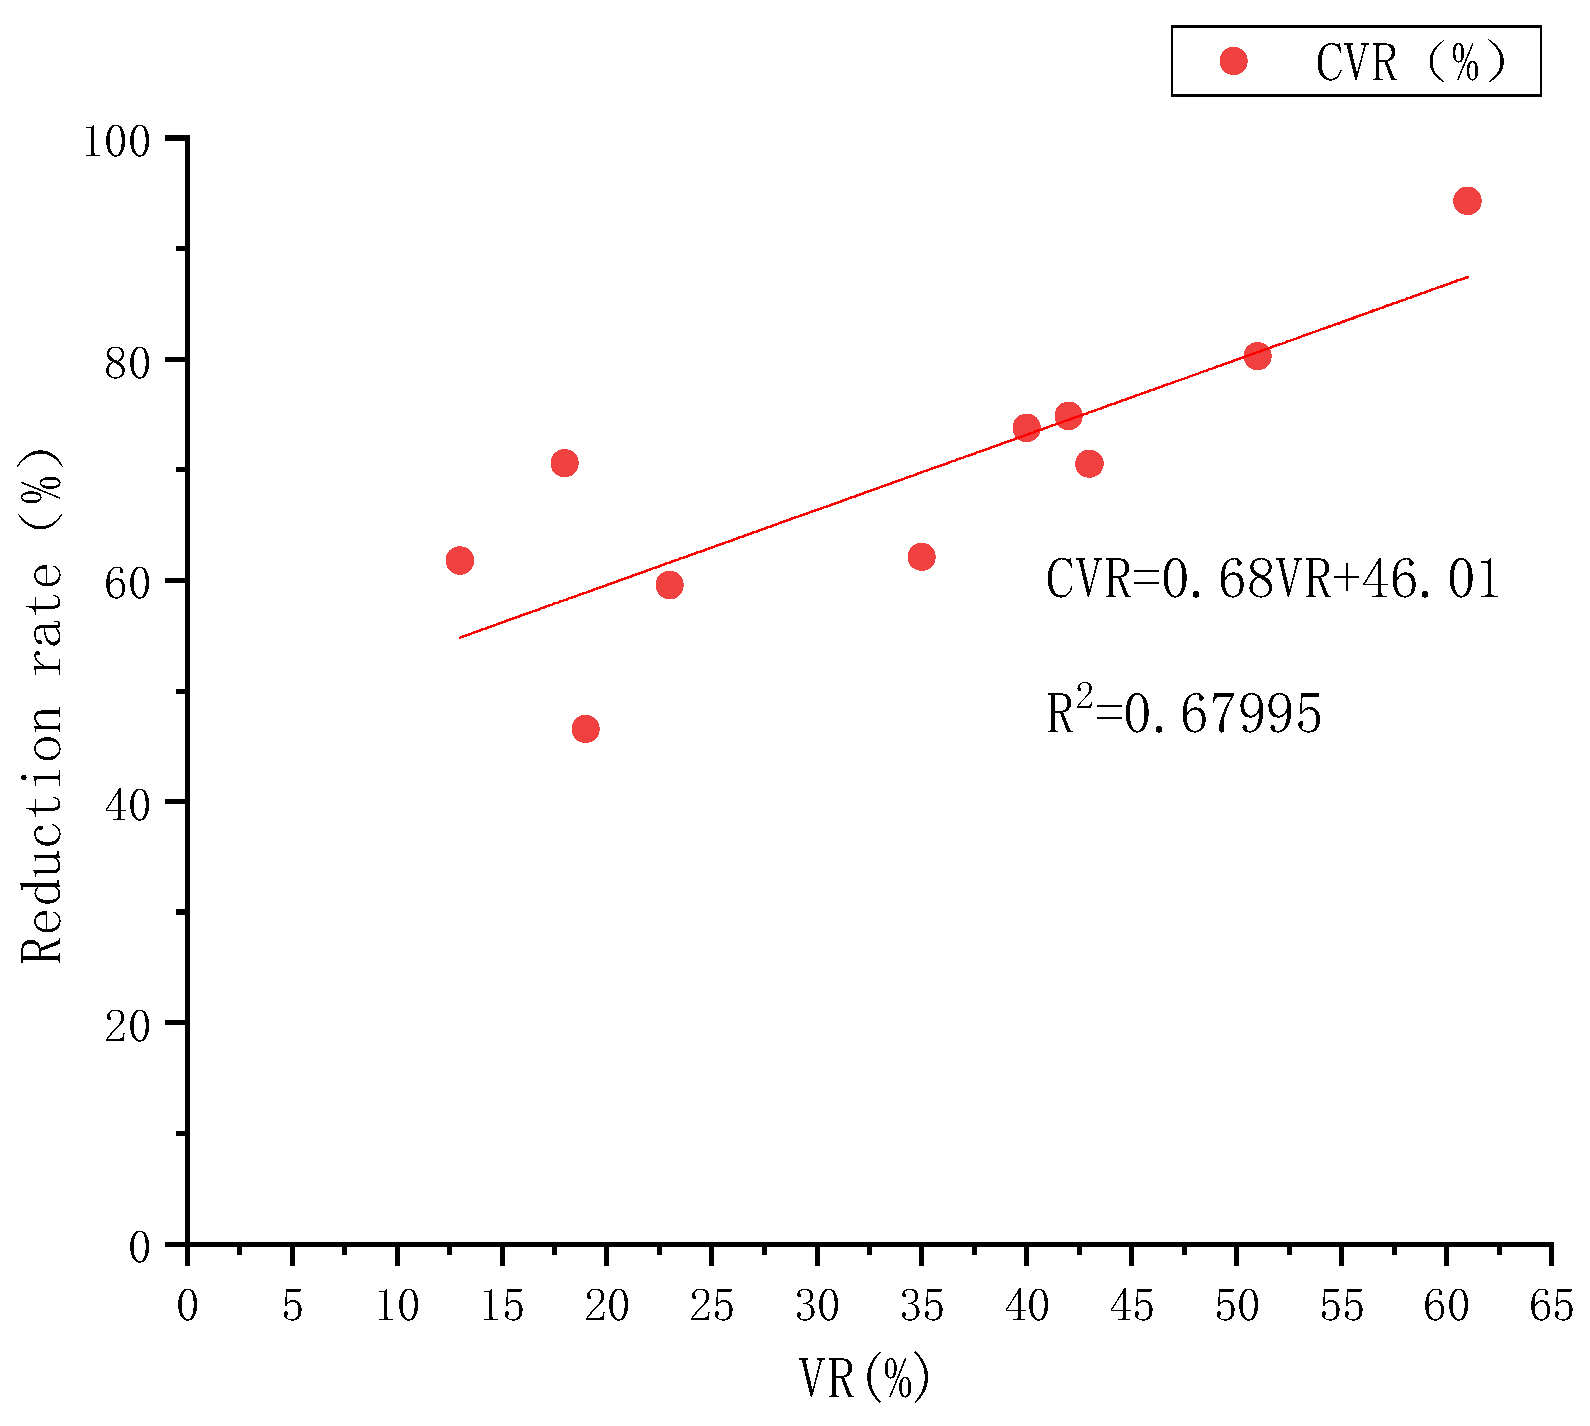
The three figures, representing the reduction rate of heat pollution, the volume reduction rate, and the volume reduction percentage, respectively, trend more closely together in
Figure 3. On this basis, taking the volume reduction rate of VR as the
x-axis, the linear fitting relationship between VR and CVR can be obtained, as shown in
Figure 4 below.
CVR and VR showed a linear correlation with a slope of 0.68. Therefore, with the gradual increase of VR, the growth rate of CVR slowed down, slightly lower than that of HR. As the reduction of thermal pollution is mainly caused by the volume reduction and the heat exchange inside the facility, with the increase of VR, the proportion of heat exchange (CHE) between the medium inside the bioretention facility and rainwater gradually decreased.
To further analyze the correlation between the parameters, based on the experimental results in
Table 3 and the design parameters in
Table 1, the Spearman’s Rank Correlation Coefficient Method was used to obtain
Figure 5.
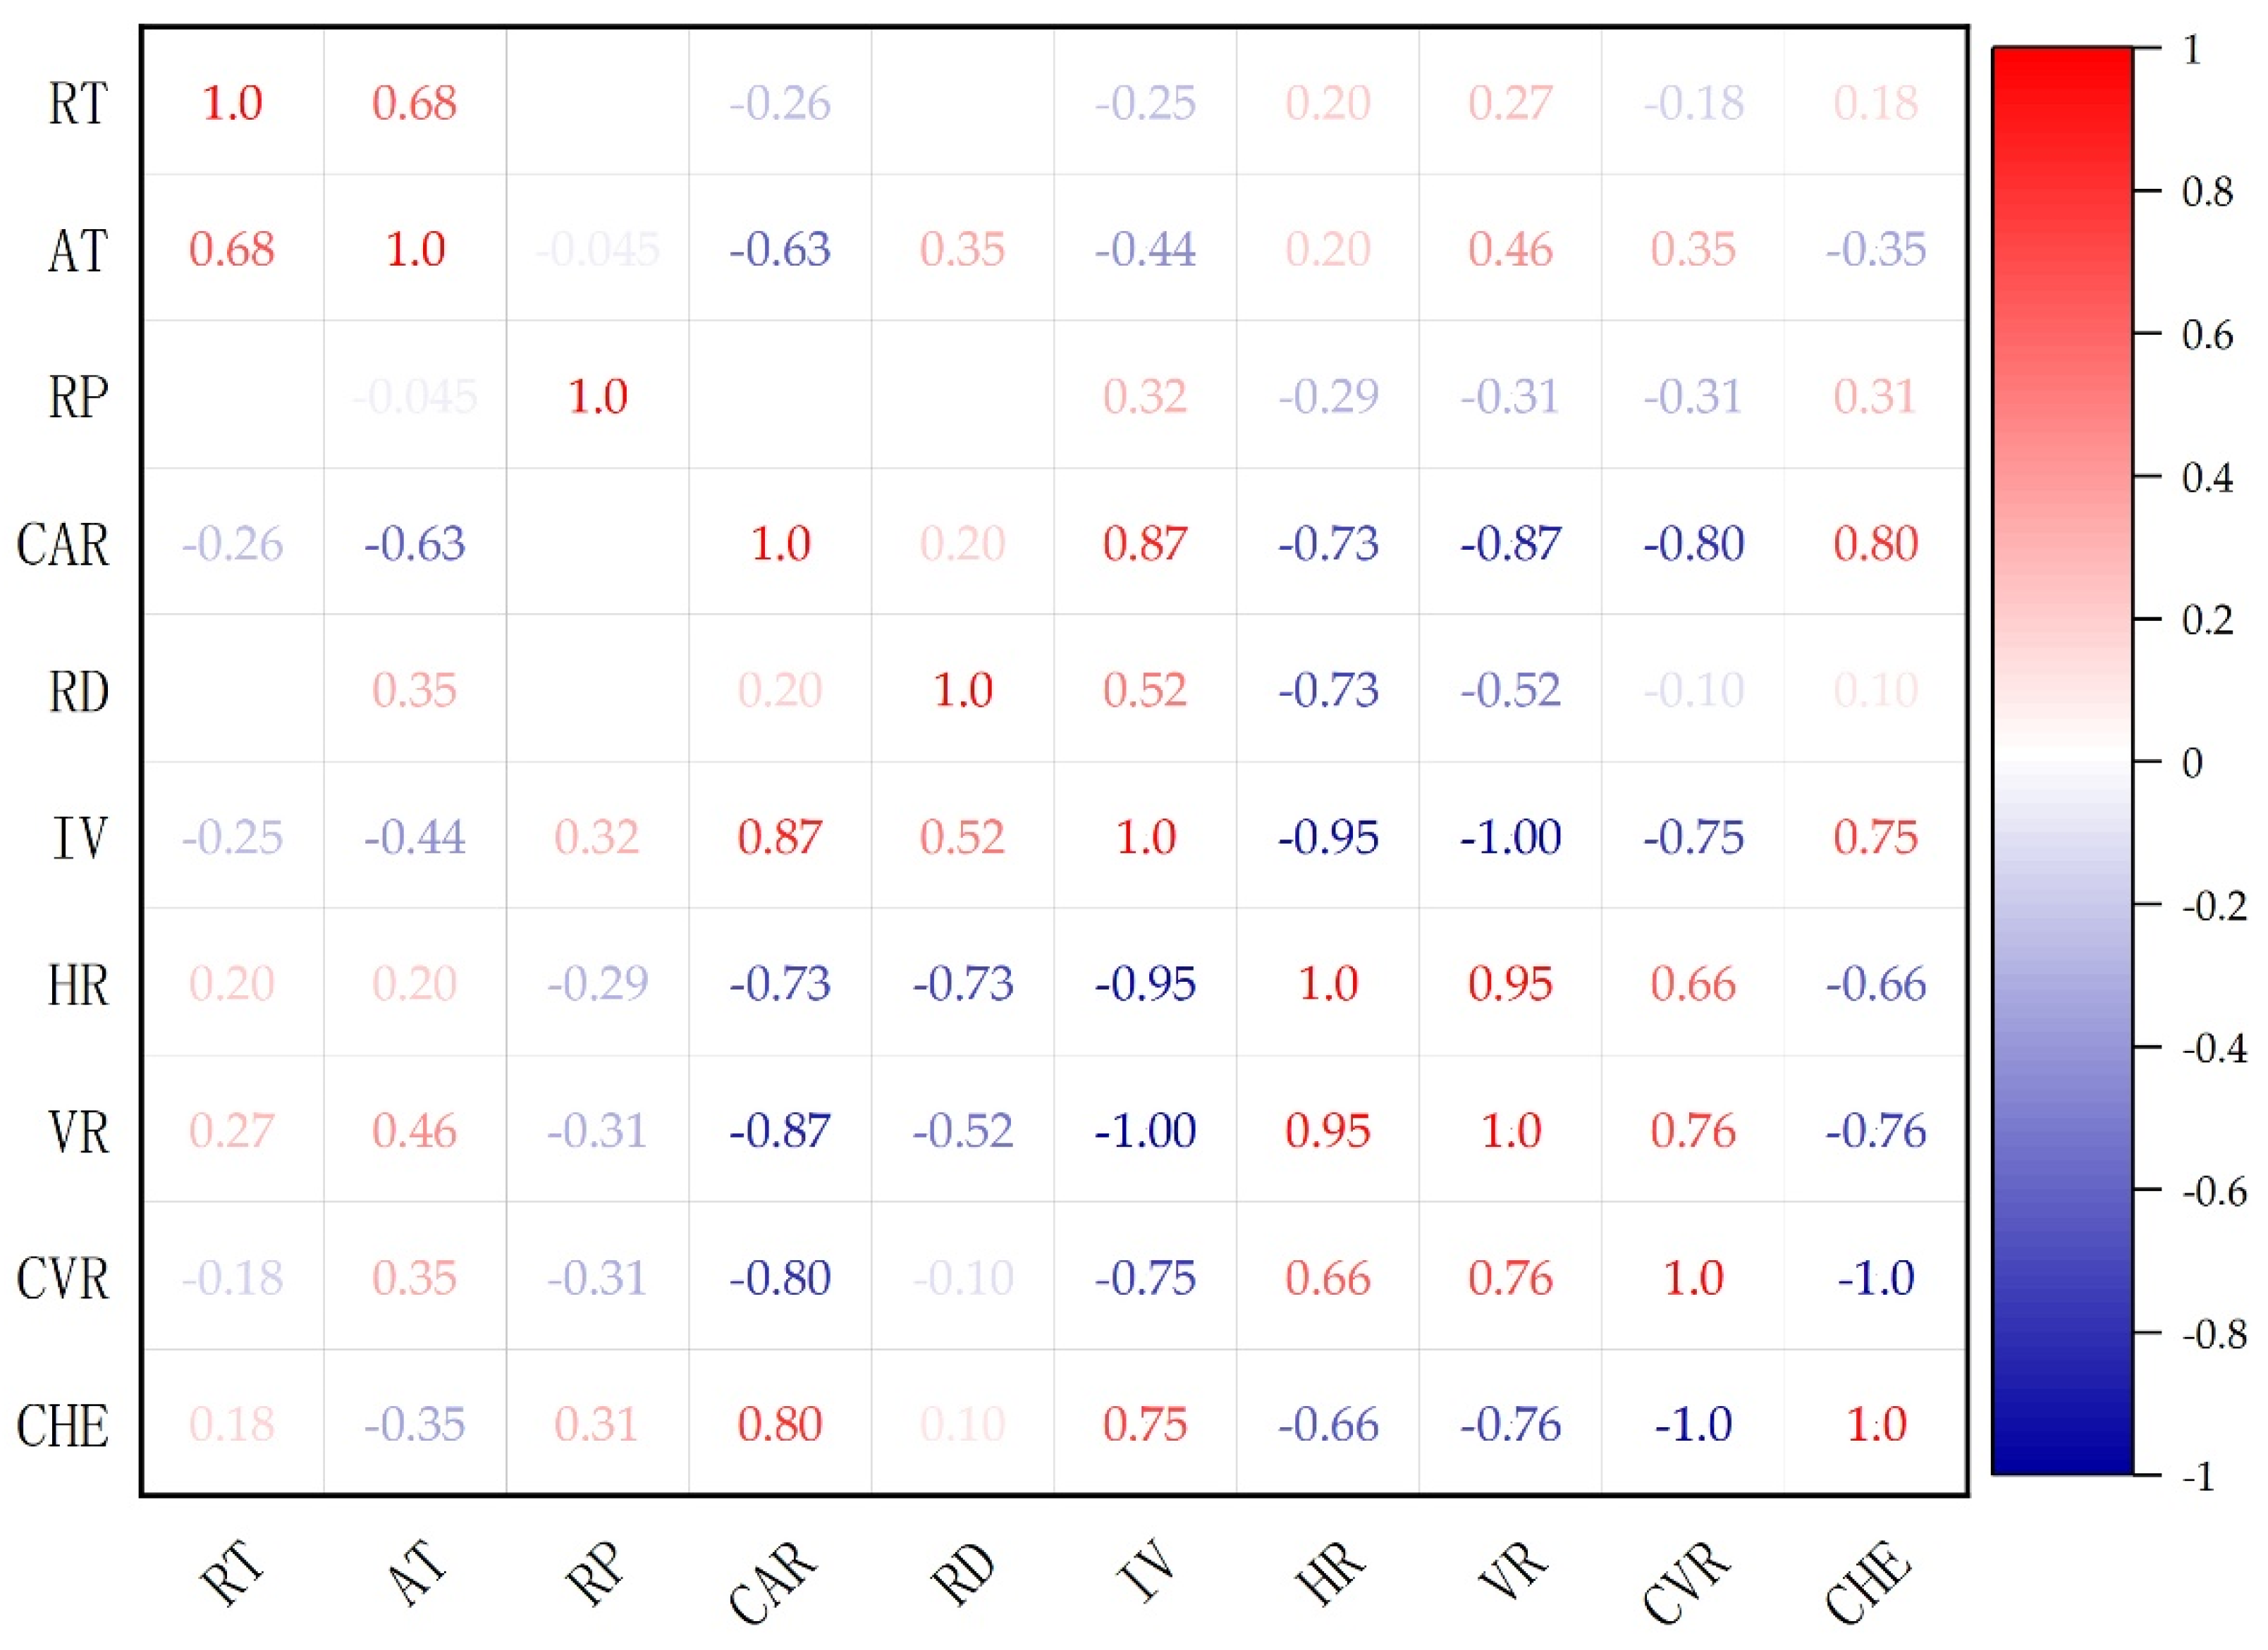
It can be seen from
Figure 5 that HR was affected by IV, RD, and CAR, showing a strong negative correlation. Among them, the correlation coefficient between IV and HR was as high as −0.95, and RD and CAR had the same impact on HR, both of which were −0.73. This result is consistent with the existing research contents [
24]. RP had a weak negative correlation with HR, which was −0.29. RT and AT had a weak positive correlation with HR, with a coefficient of 0.20. It can be found that during the experiment, the shorter the RD and the smaller the CAR, the more obvious the thermal pollution reduction effect of the bioretention facilities. However, the smaller the RP and the higher the RT were, the higher the thermal pollution reduction rate. Additionally, due to their weak positive correlation, the HR performance was still slightly improved. In the actual scene, the rainfall temperature is affected by the air temperature, and the positive correlation coefficient between AT and VR is 0.46. Therefore, in the summer when the AT is high, the thermal pollution of surface rainwater runoff will be better removed by the bioretention facilities due to the increase of VR. According to the analysis, the cause of this phenomenon is that as the air temperature rises, the surface evaporation rate increases and the water content inside the bioretention facilities decrease before rainfall. Therefore, more rainwater can be absorbed during rainfall, and the volume reduction rate is increased.
There are two ways to reduce the thermal pollution of bioretention facilities: (1) reducing the volume of rainfall; and (2) heat exchange between rainwater and internal media of bioretention facilities. It is obvious from
Figure 5 that VR and HR have a strong positive correlation, and the correlation coefficient was as high as 0.95. According to the data in
Table 3, the smaller the IV, the higher the VR, the higher the corresponding HR, and the larger the proportion of volume reduction in the removal of heat pollution load; when HR is low, IV is large, the heat exchange between rainwater and internal medium of bioretention facilities is more obvious, and the proportion of CHE gradually increases. Since RT also had a weak positive correlation with CHE with a coefficient of 0.15, it can be interpreted that the contribution of CHE will increase slightly with the increase in rainfall temperature. Therefore, the previous analysis suggesting that higher RT leads to higher HR is tenable.
3.2. Influence of Rain Pattern Parameters on HV and HT
During the experiment, EMT of effluent from bioretention facilities in each group was obtained, and HV and HT were obtained based on HR, as shown in
Table 4 below.
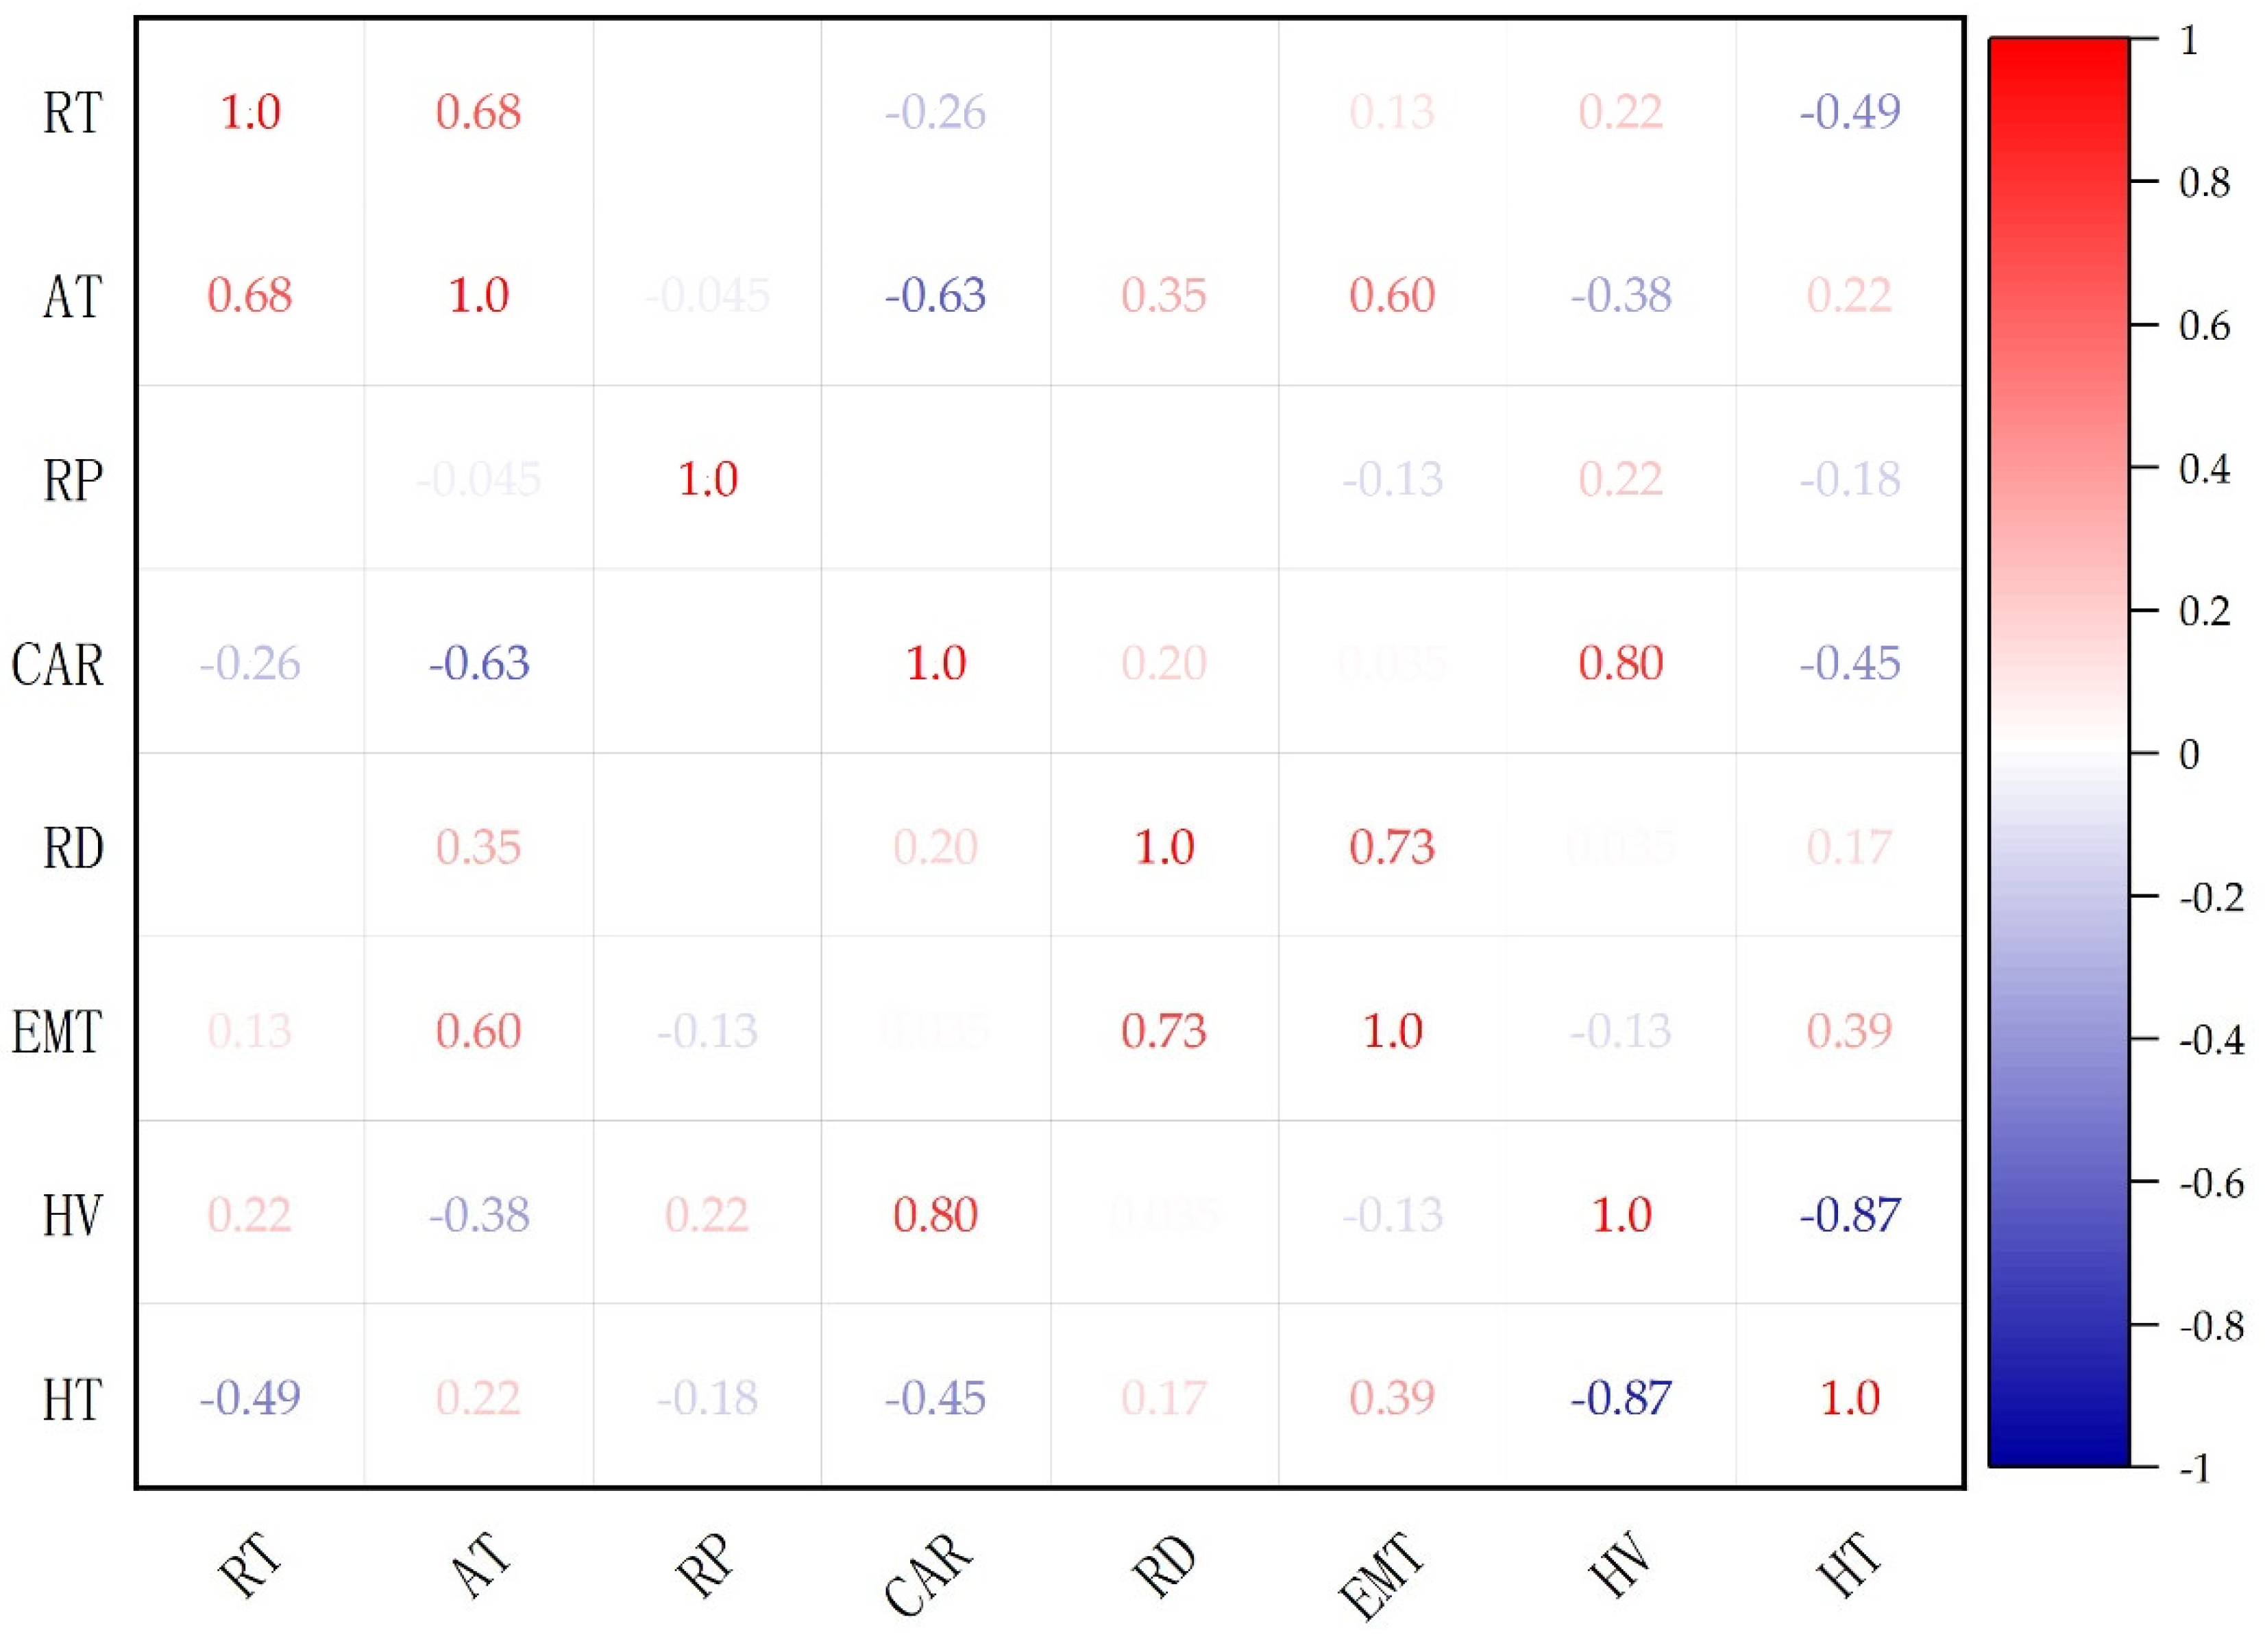
Based on the data in
Table 4, Spearman’s Rank Correlation Coefficient Formula was applied to obtain the experimental results in
Figure 6.
The average EMT of the effluent from the bioretention facilities was closely related to RD and AT during the experiment, showing a strong positive correlation, and the Spearman’s Coefficients were 0.73 and 0.60 respectively. Among them, the longer the RD, the higher the EMT of the outflow. During the experiment, the temperature was related to the experimental results. Through analysis, it can be understood that the higher the temperature, the higher the surface plant and soil temperature of the bioretention facilities, and the reduction effect of the bioretention on the rainwater temperature will be reduced. In the previous section, it was found that the higher the temperature is, the higher the VR of the bioretention facilities will be, and the better the effect of heat pollution reduction will be. Therefore, the reduction capacity of rainwater runoff heat pollution load and outlet temperature can not be generalized. HR is mainly affected by volume reduction. When the temperature is high, the contribution of volume reduction to the reduction of heat pollution load is enhanced, the heat exchange between the media is reduced, and the bottom outlet temperature of the bioretention facility will be higher than the bottom outlet temperature when the temperature is low, but the outlet volume will be reduced.
Based on the data in
Table 4 and
Figure 6, the following conclusions can be drawn based on removing the data with large deviation. Within the range of rainfall temperature of 22~28 °C and rainfall volume of 41.75~145.05 L, 1.235~1.696% of heat load could be controlled whenever 1% of runoff volume was controlled, and 1.517~2.778% of heat load could be controlled whenever 1% of runoff temperature was controlled. There was a strong negative correlation between HV and HT, and the coefficient was −0.87. With the increase of HV, the value of HT decreased, and both of them were affected by the catchment area. HV was also negatively correlated with AT; HT was greatly affected by RT, showing a moderate negative correlation and a correlation coefficient of −0.49. The outlet EMT of the facility also had a moderate positive impact on HT, with a coefficient of 0.39.
3.3. Analysis of the Heat-Emission Curve of Bioretention
Due to the different rainfall durations, the proportion of rainfall distribution every 5 min changed. Therefore, the occurrence time of rainfall peak in this experiment is only related to RD and has nothing to do with other rainfall parameters. On this basis, the experimental data were sorted out, and the peak time of rainfall heat (PTRH) and the peak time of outflow heat (PTOH) of 10 groups of experiments were obtained, as shown in
Table 5 below.
It can be seen from
Table 5 that under the conditions of 60 min and 120 min rainfall duration, the peak value of the rainfall heat of the P&C rainfall pattern in Beijing occurred every at 25 min at the beginning of rainfall. It can be seen from the analysis that under the above rainfall duration, the peak rainfall happened to occur at the same time, which is when the rainfall started at 25 min, while the inflow temperature of the bioretention facility remained unchanged during the experiment, so PTRH also occurred when the experiment started for 25 min.
According to the preliminary analysis, most of the PTOH during the experiment occurred at 35 min after the rainfall. When RT and IV gradually increased, the total heat of rainfall increased, and the PTOH of bioretention facilities moved back, which occurred 40 min after the rainfall began. The occurrence time of PTOH was related to RT and IV and had no obvious relationship with rainfall duration.
Based on the abovementioned results, to understand the relationship between the heat of rainwater entering and flowing out of the facility during the process from rainfall to outflow of the bioretention facility, two typical rainfall experiments of HR were selected for research under the rainfall duration of 60 min and 120 min respectively. The selected rainfall pattern parameters are shown in
Table 6 below.
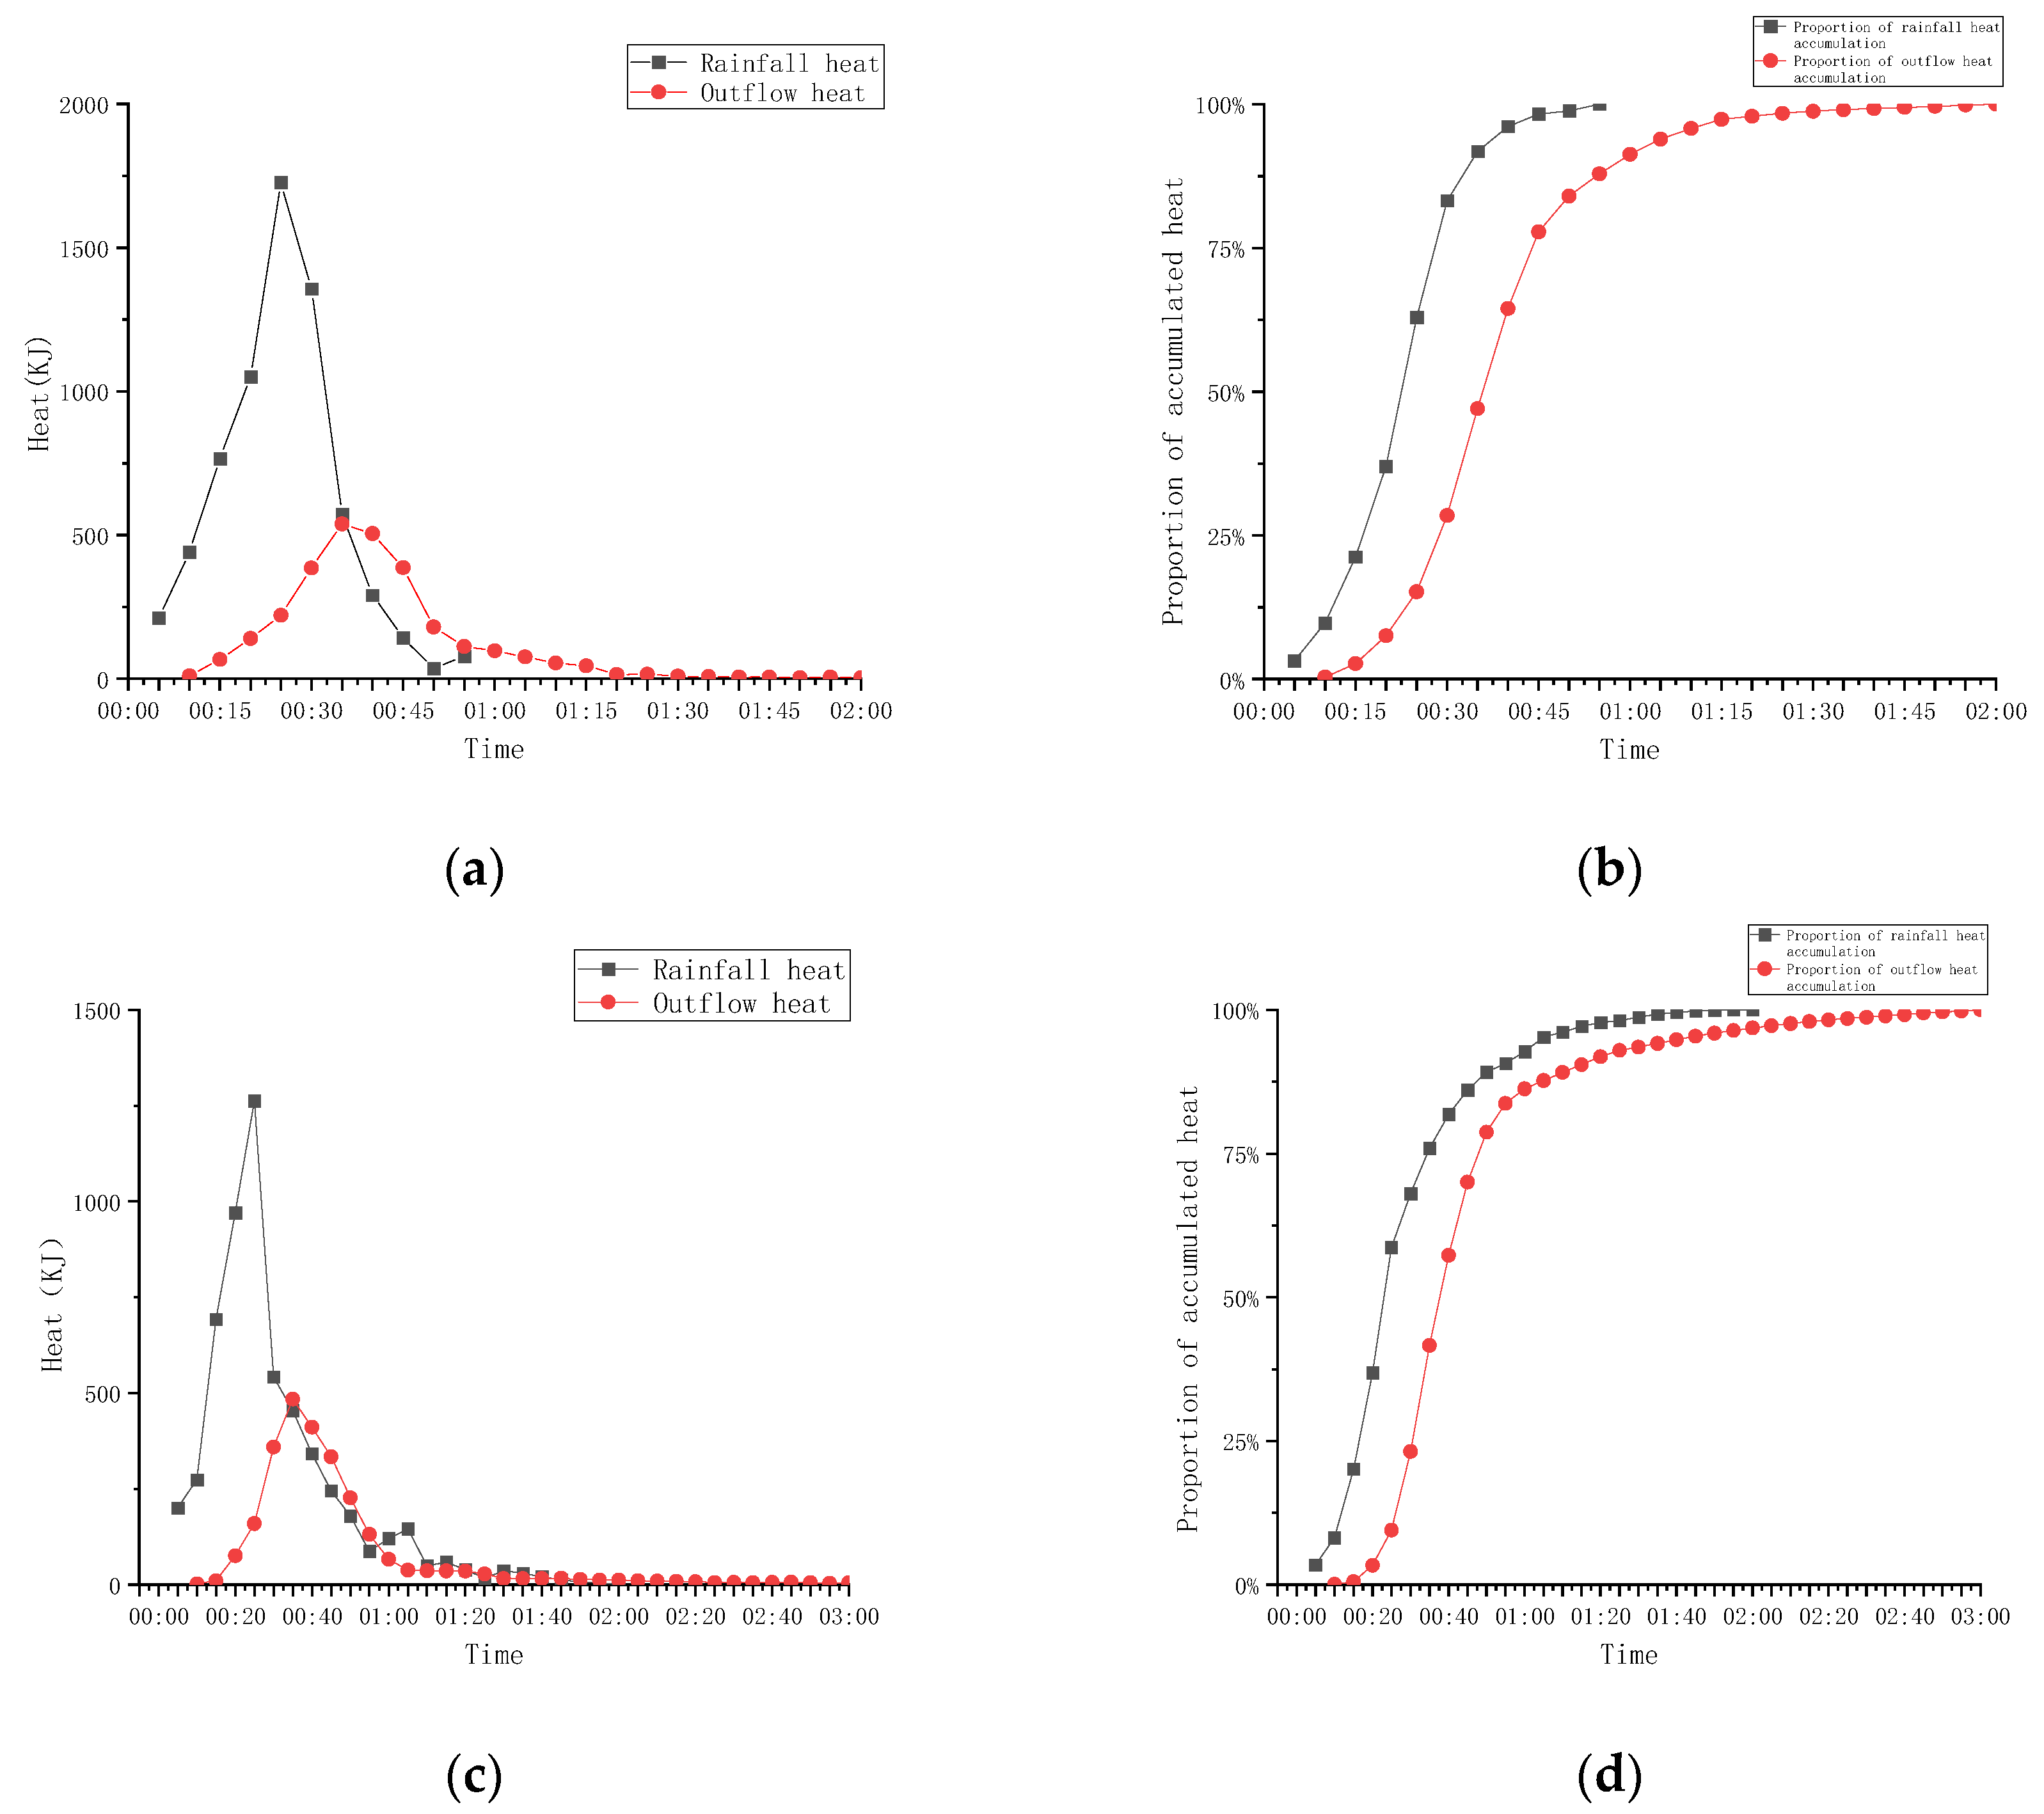
We calculated and counted the rainfall inflow heat and bottom outflow heat every 5 min during the experiment, and drew a cumulative curve of their percentage in the total rainfall heat and total emission heat to obtain the results shown in
Figure 7.
It could be found from the experimental results that under the condition of 60 min rainfall duration, the peak value of rainfall heat was 25 min at the beginning of rainfall, and the peak value of outflow heat was 35 min at the beginning of rainfall, with a delay of about 10 min. When the rainfall ended, the accumulated outflow heat at the bottom outlet accounted for 91.28% of the total outflow heat of the experiment; under the condition of 120 min rainfall duration, the peak value of rainfall heat and outflow heat was the same as that at 60 min, and the peak delay was 10 min. When the rainfall ended, the accumulated outflow heat at the bottom accounted for 96.84% of the total outflow heat of the experiment.
The experiment was ended by taking the accumulated outflow heat accounting for more than 95% of the total outflow heat as the standard. The 60 min rainfall duration experiment should be continued to observe and record for at least 10 min after the rainfall stops. At this time, the accumulated outflow heat accounted for 95.79% of the total outflow heat. In the 120 min rainfall duration experiment, when the rainfall stopped, the accumulated outflow heat accounted for more than 95% of the total outflow heat, which meets the standard, and the experimental observation could be ended.


