
Quantification and Evaluation of Grey Water Footprint in Yantai

Abstract
:1. Introduction
2. Materials and Methods
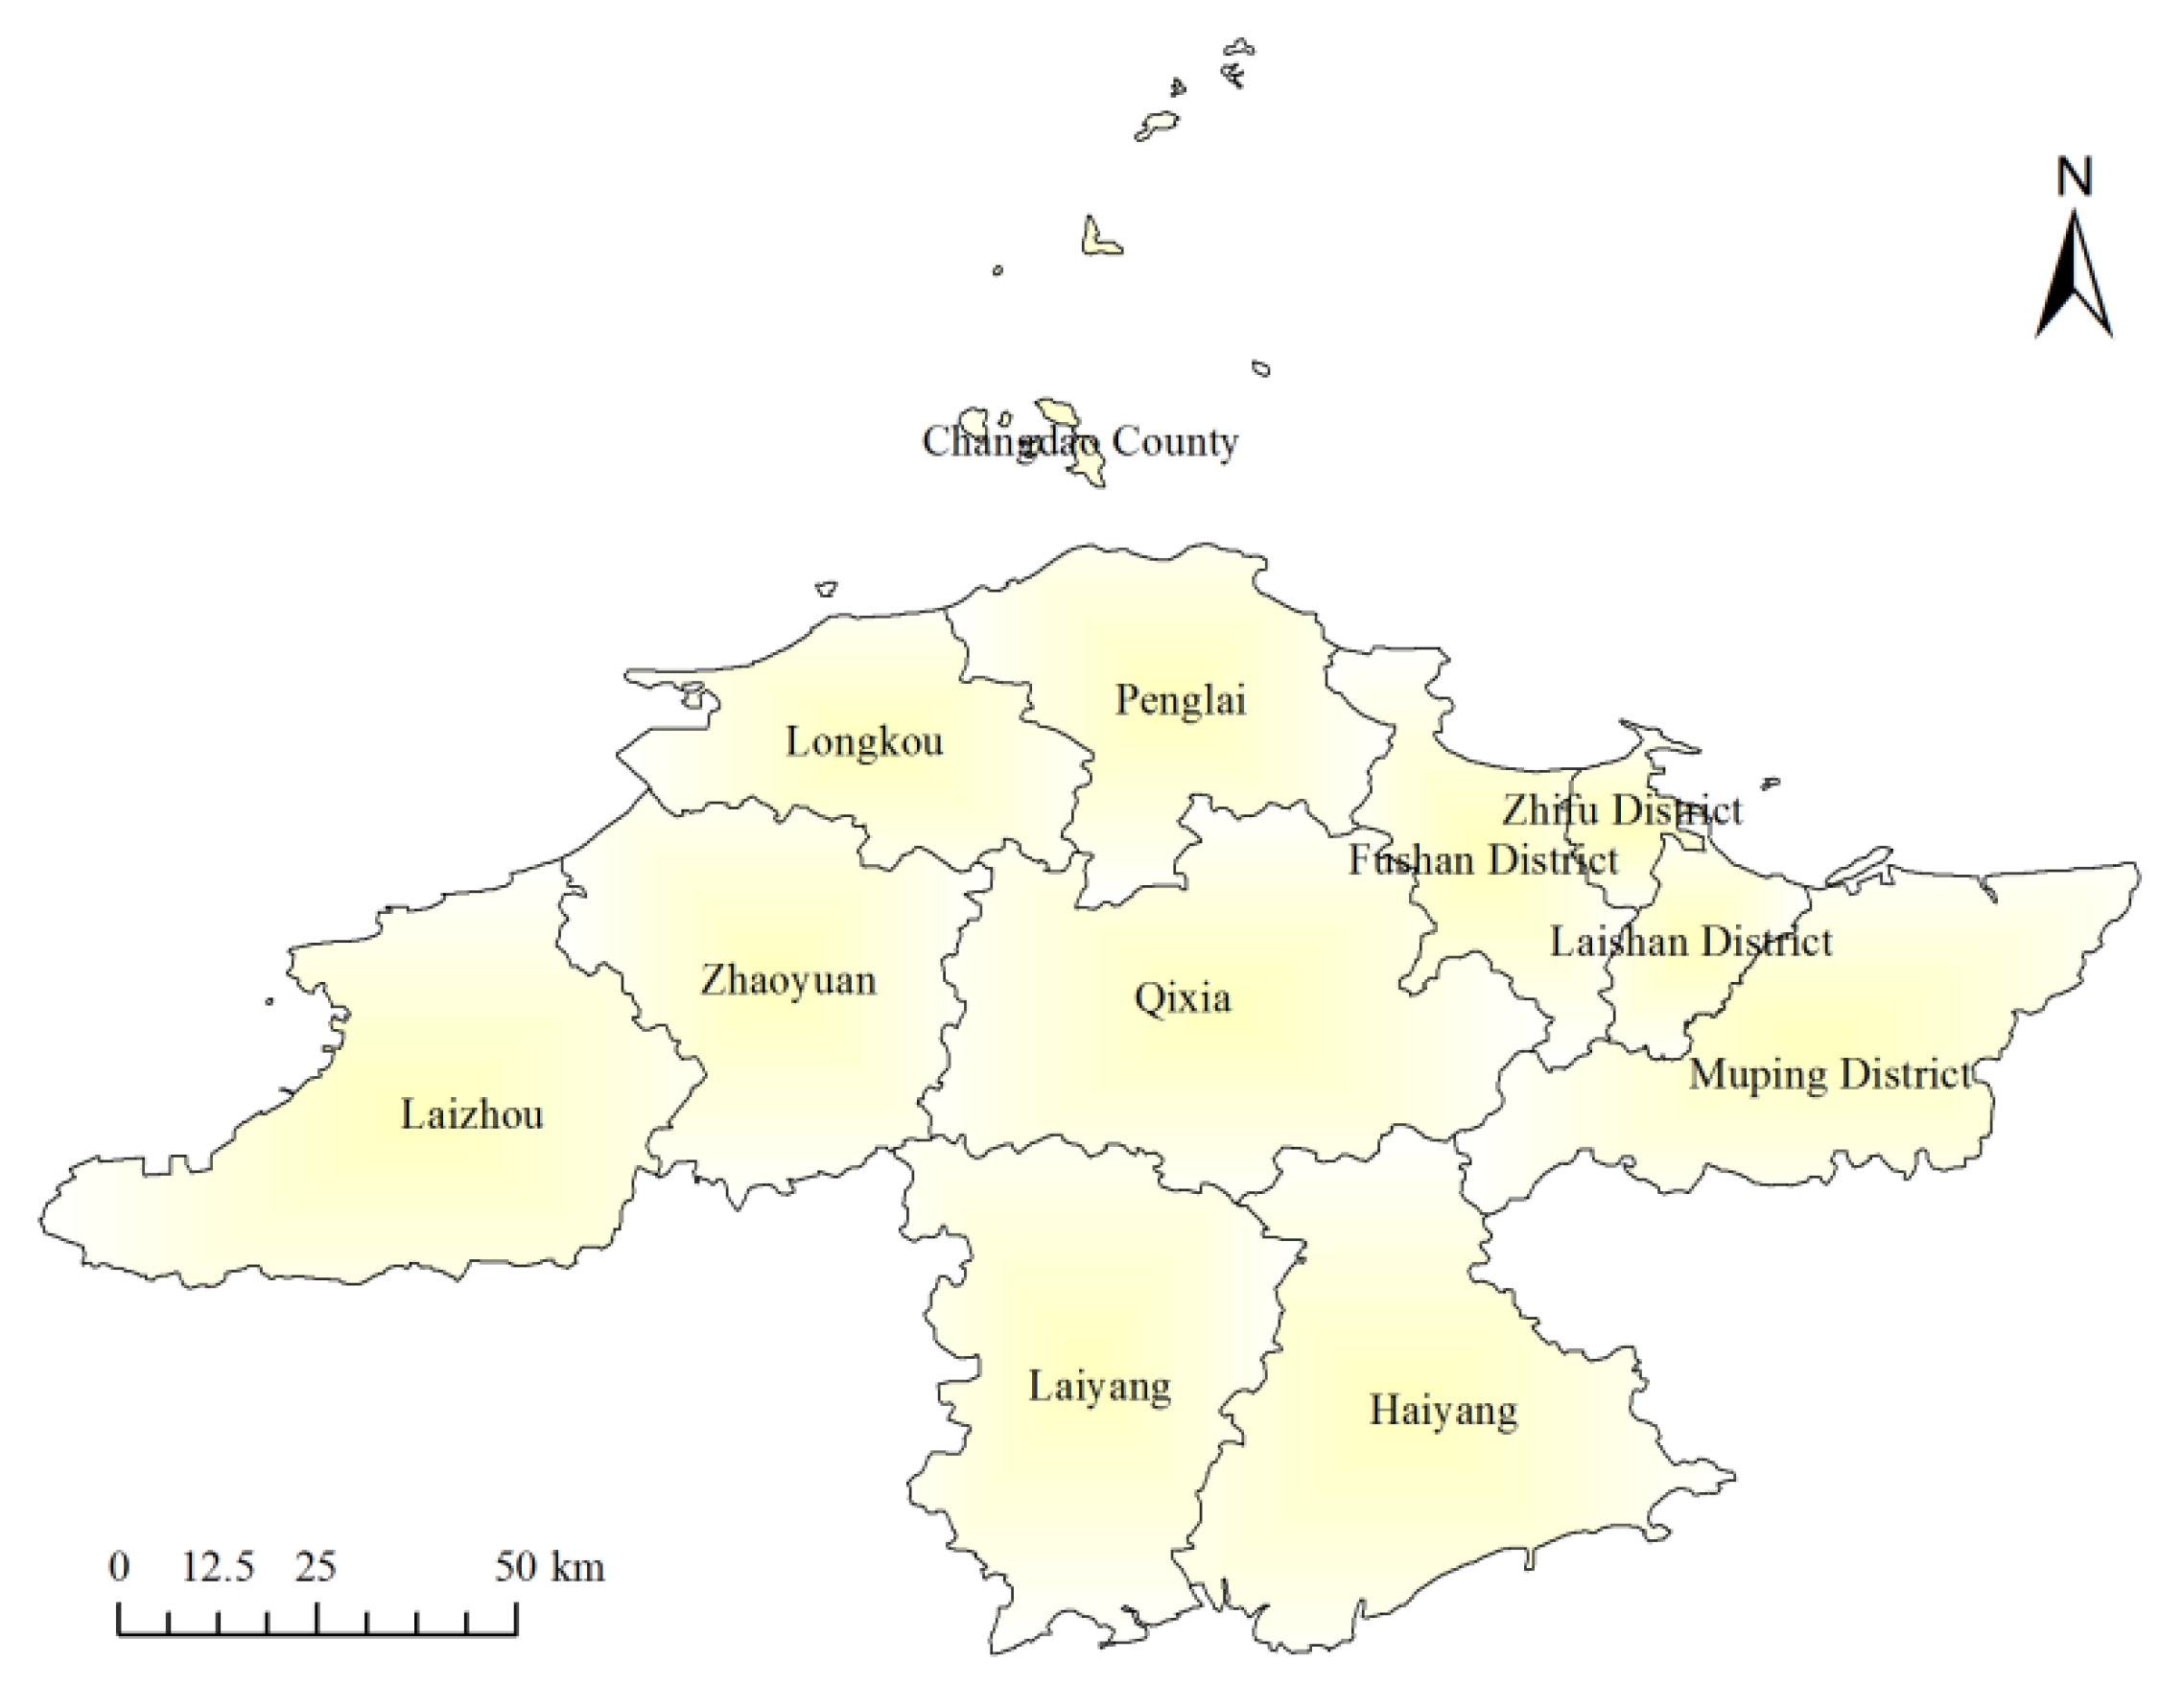
2.1. Overview of the Study Area
2.2. Data
2.3. Methods
2.3.1. Grey Water Footprint
- (1)
- Agricultural grey water footprint
- (2)
- Industrial grey water footprint
- (3)
- Domestic grey water footprint
2.3.2. Grey Water Footprint Sustainability
2.3.3. Grey Water Footprint Intensity
3. Results
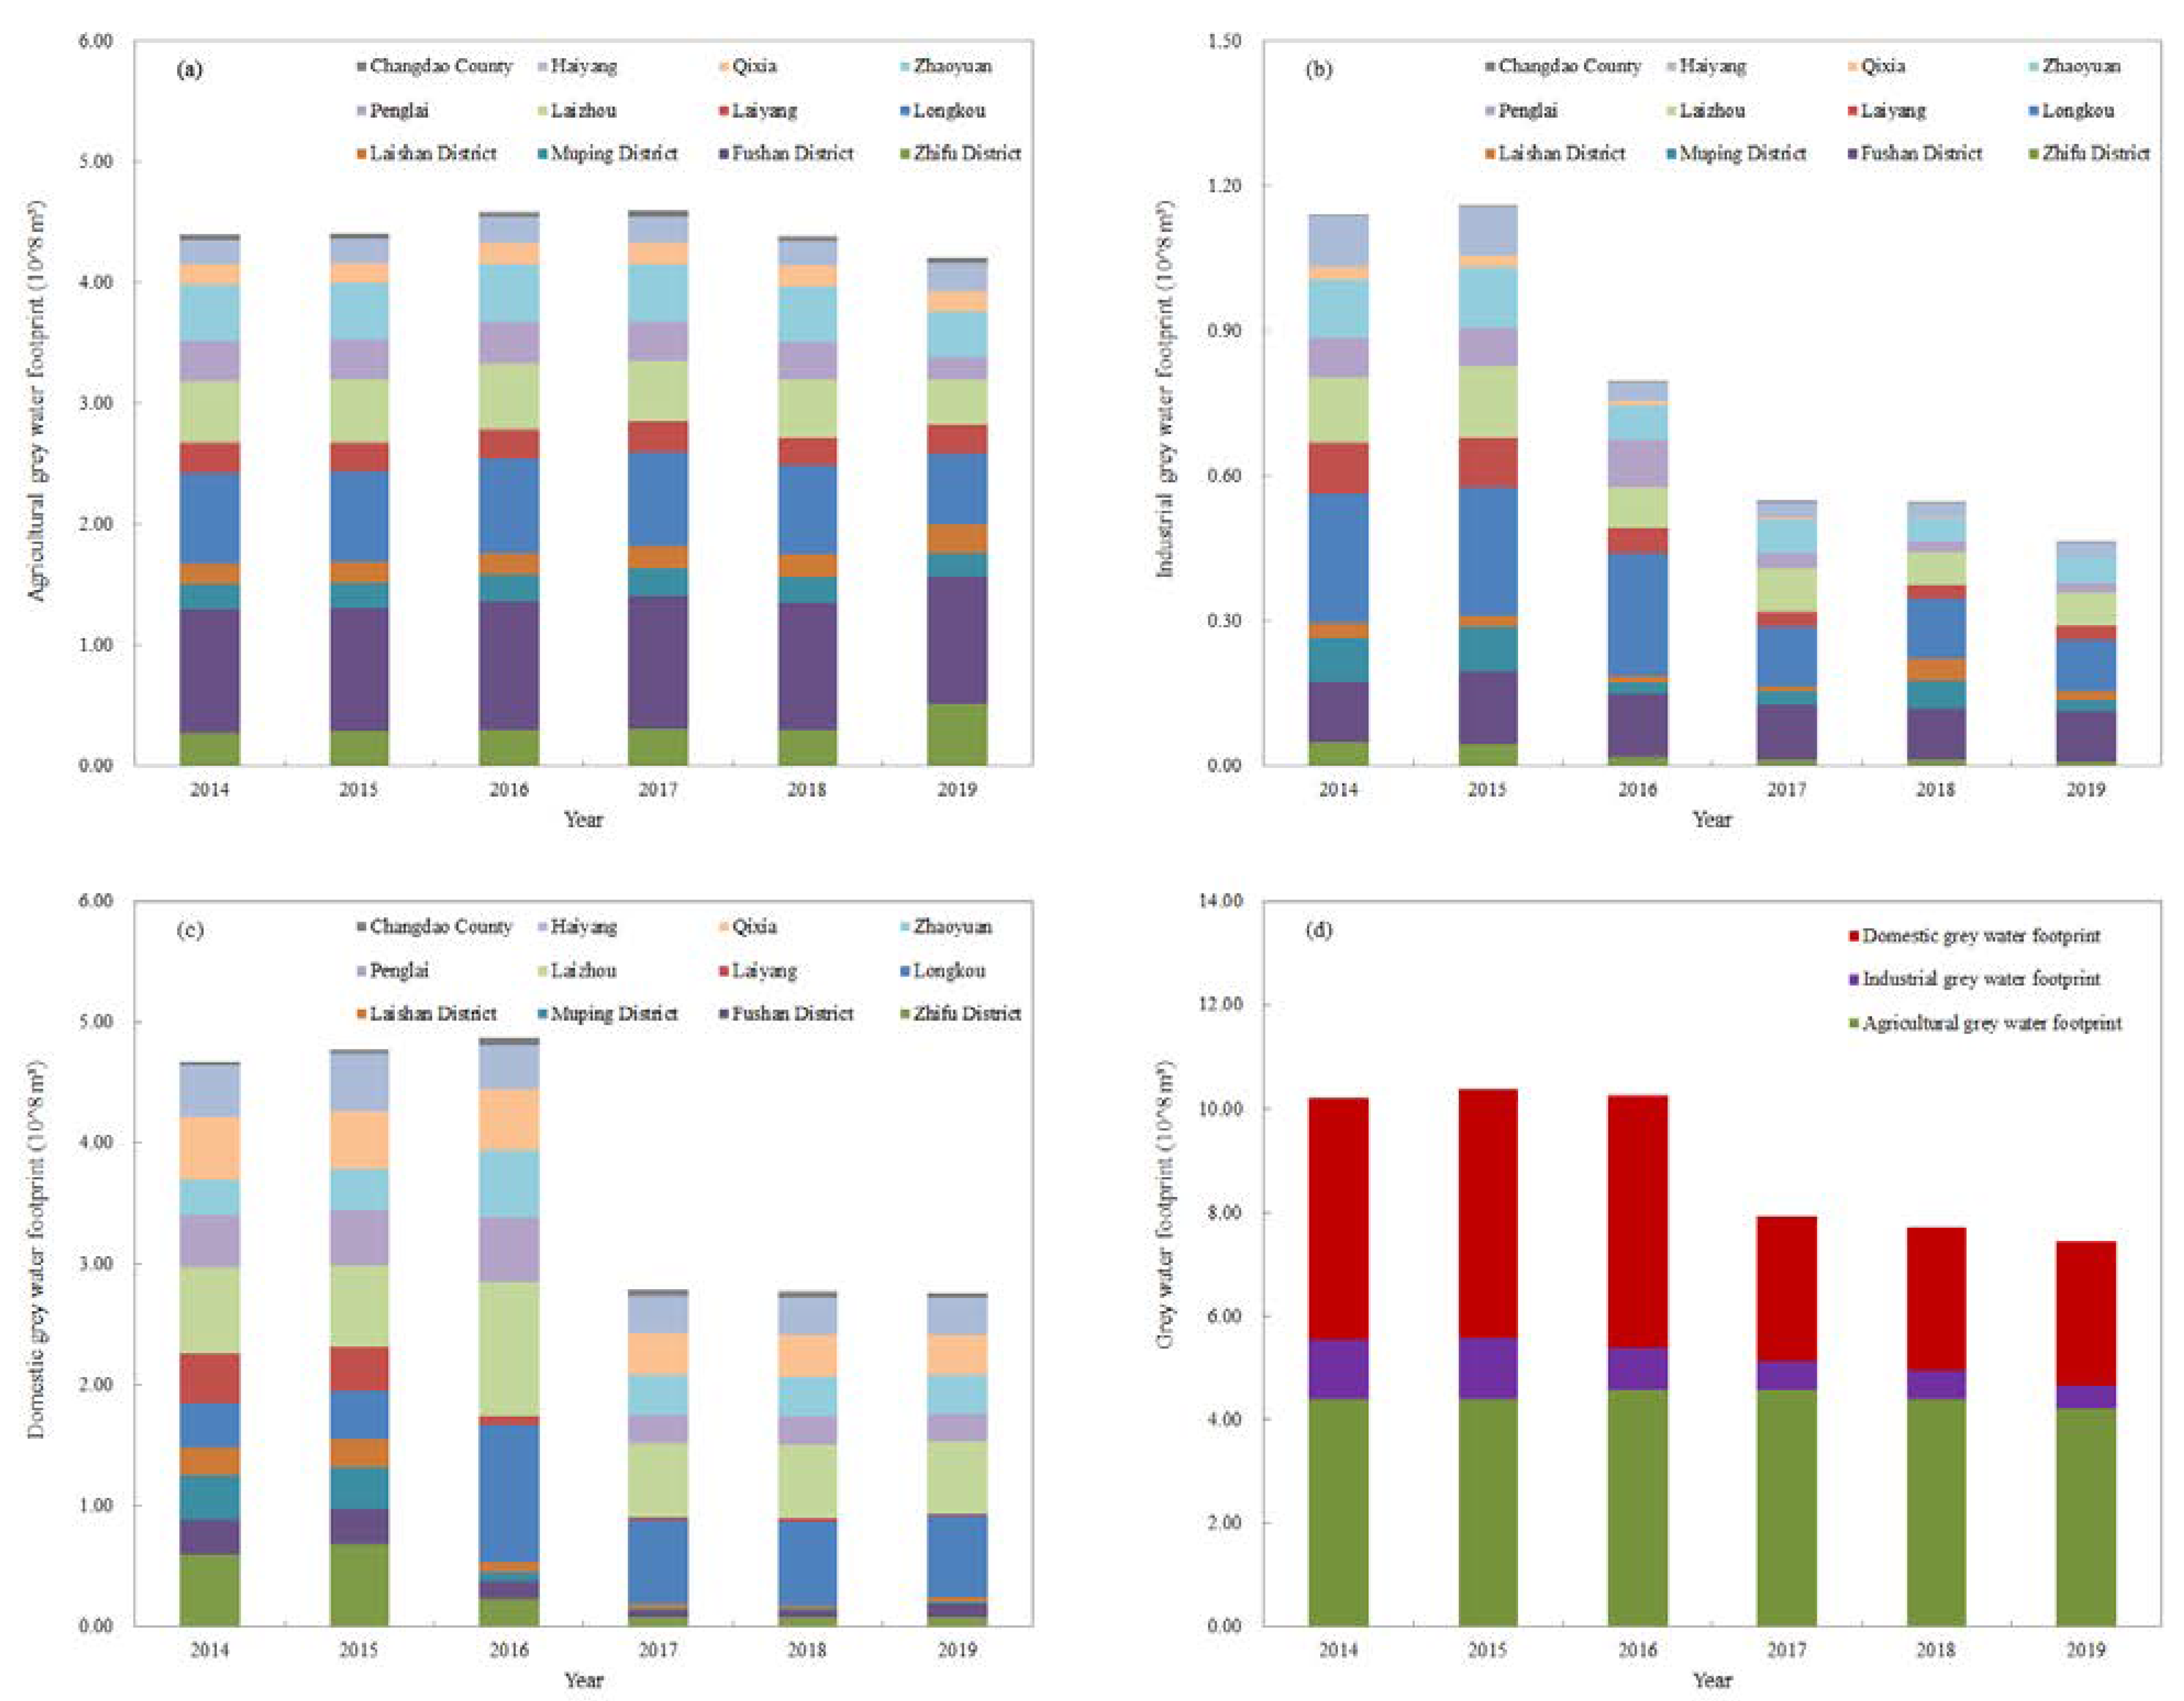
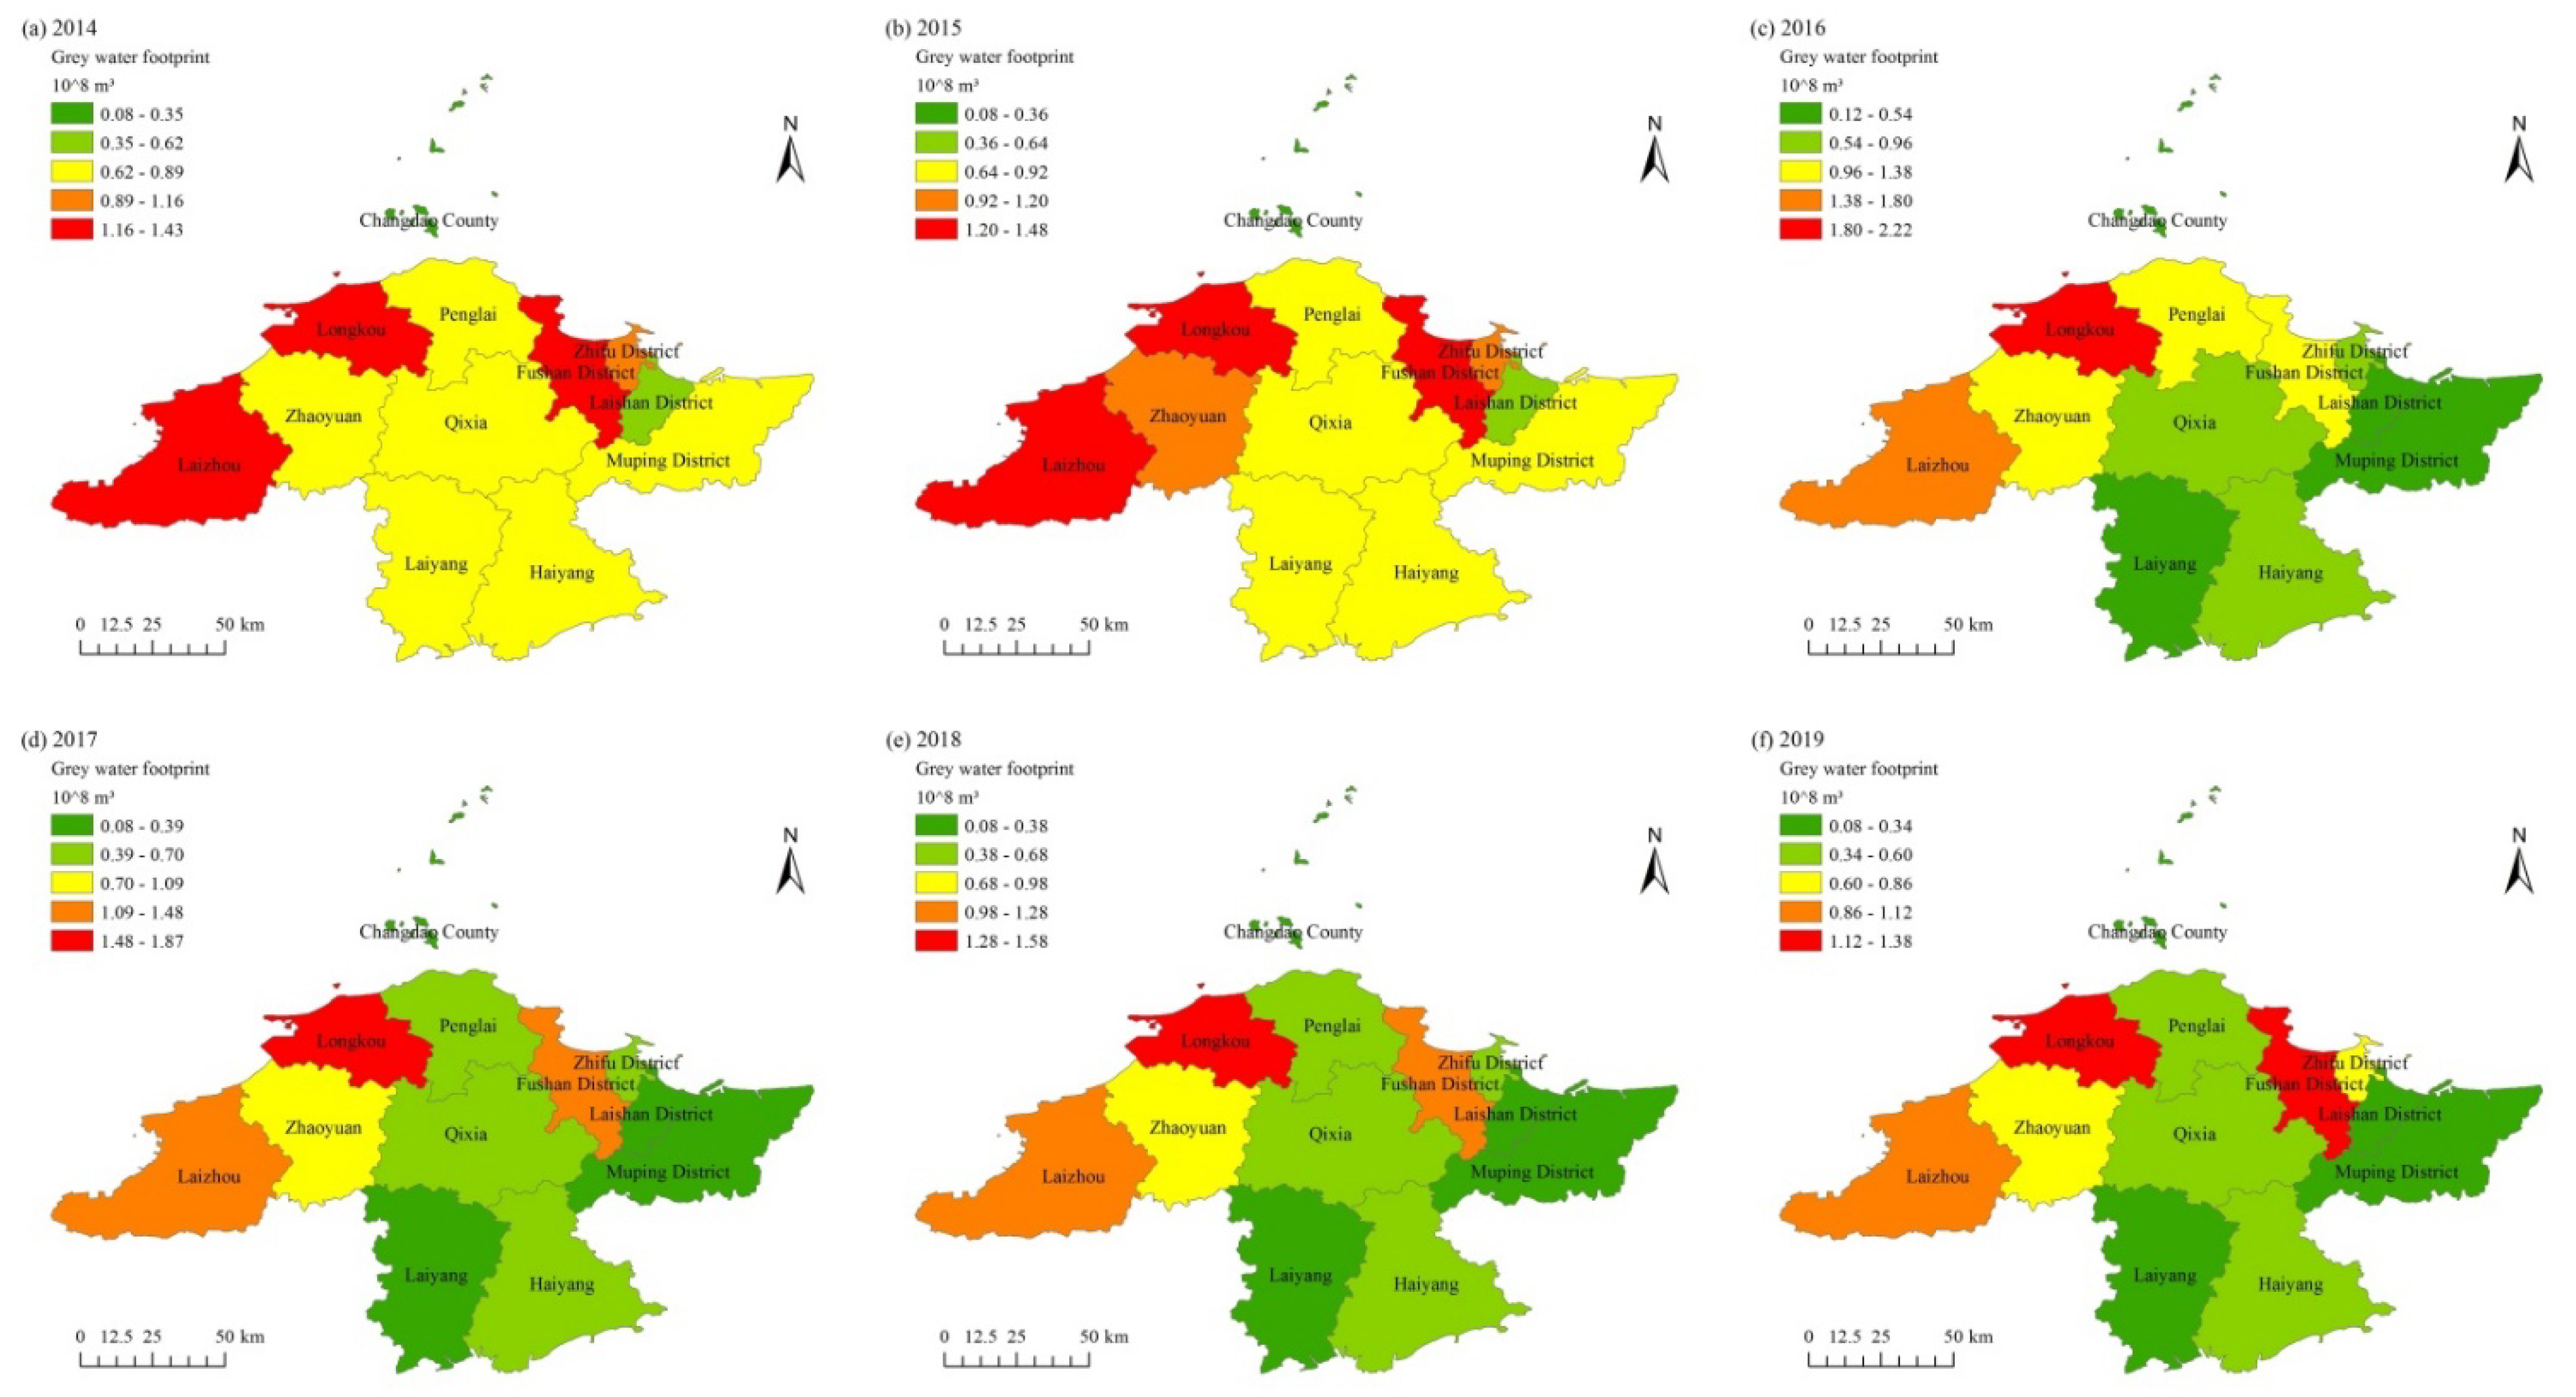
3.1. Grey Water Footprint
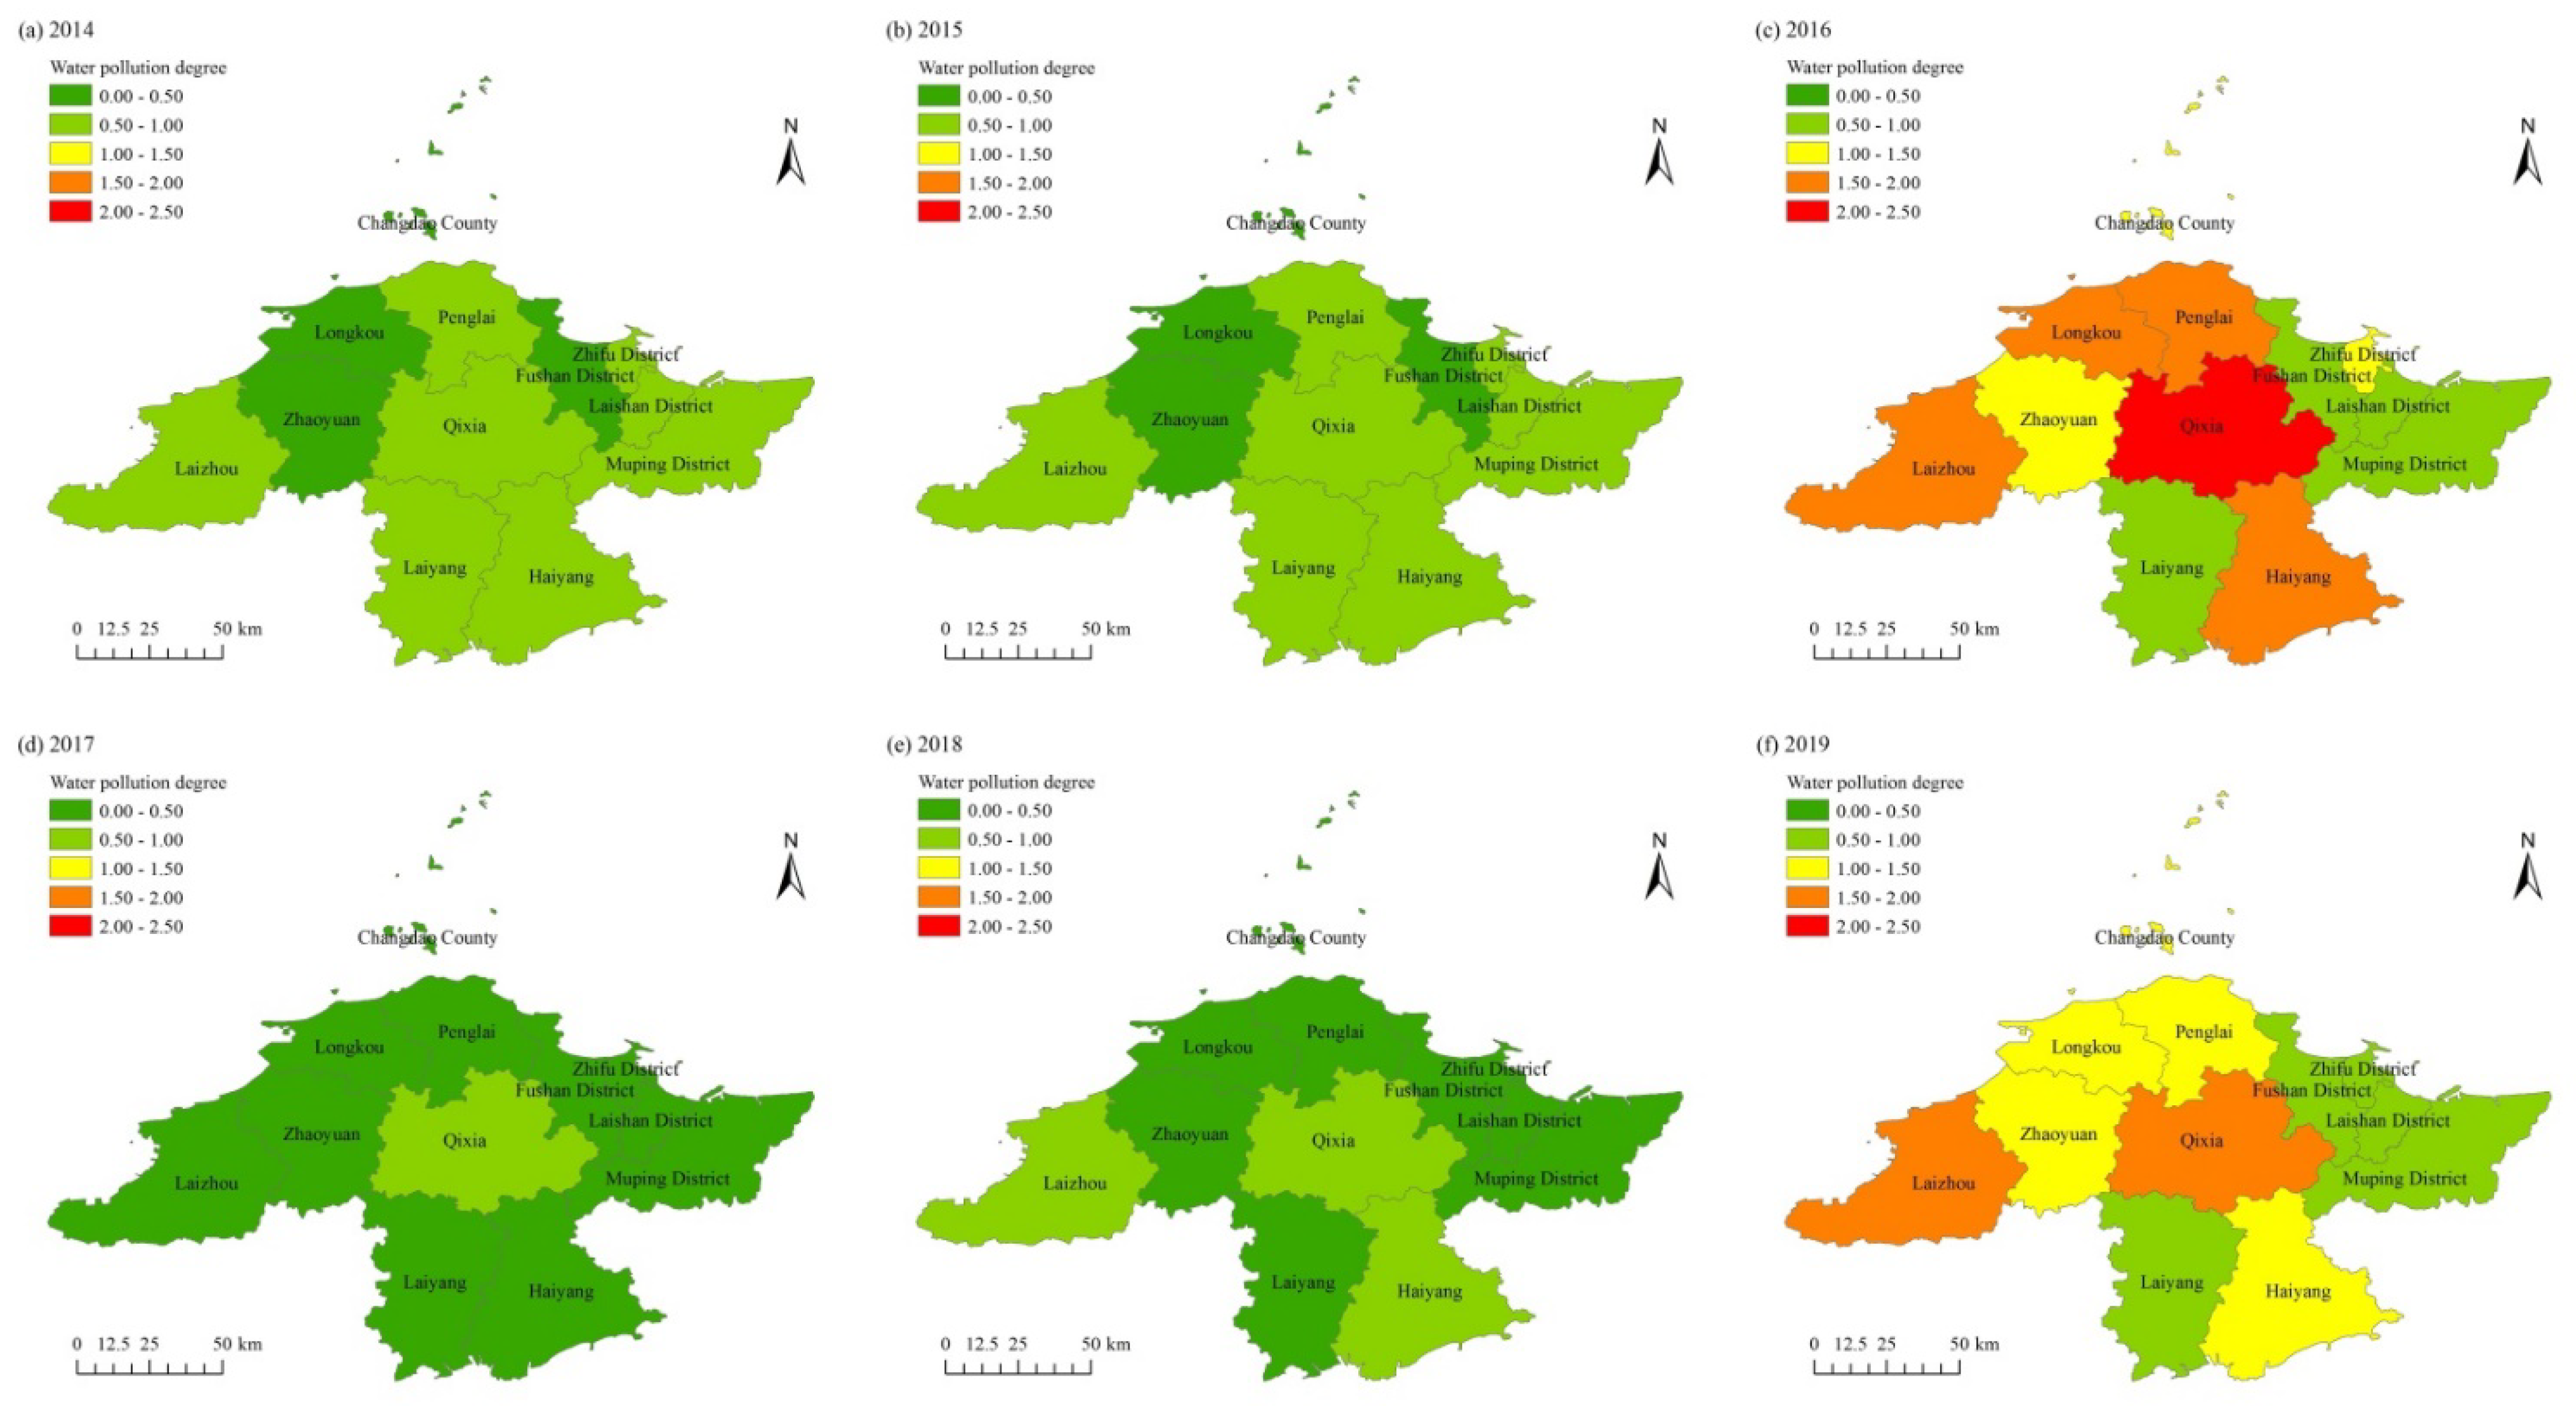
3.2. Grey Water Footprint Sustainability
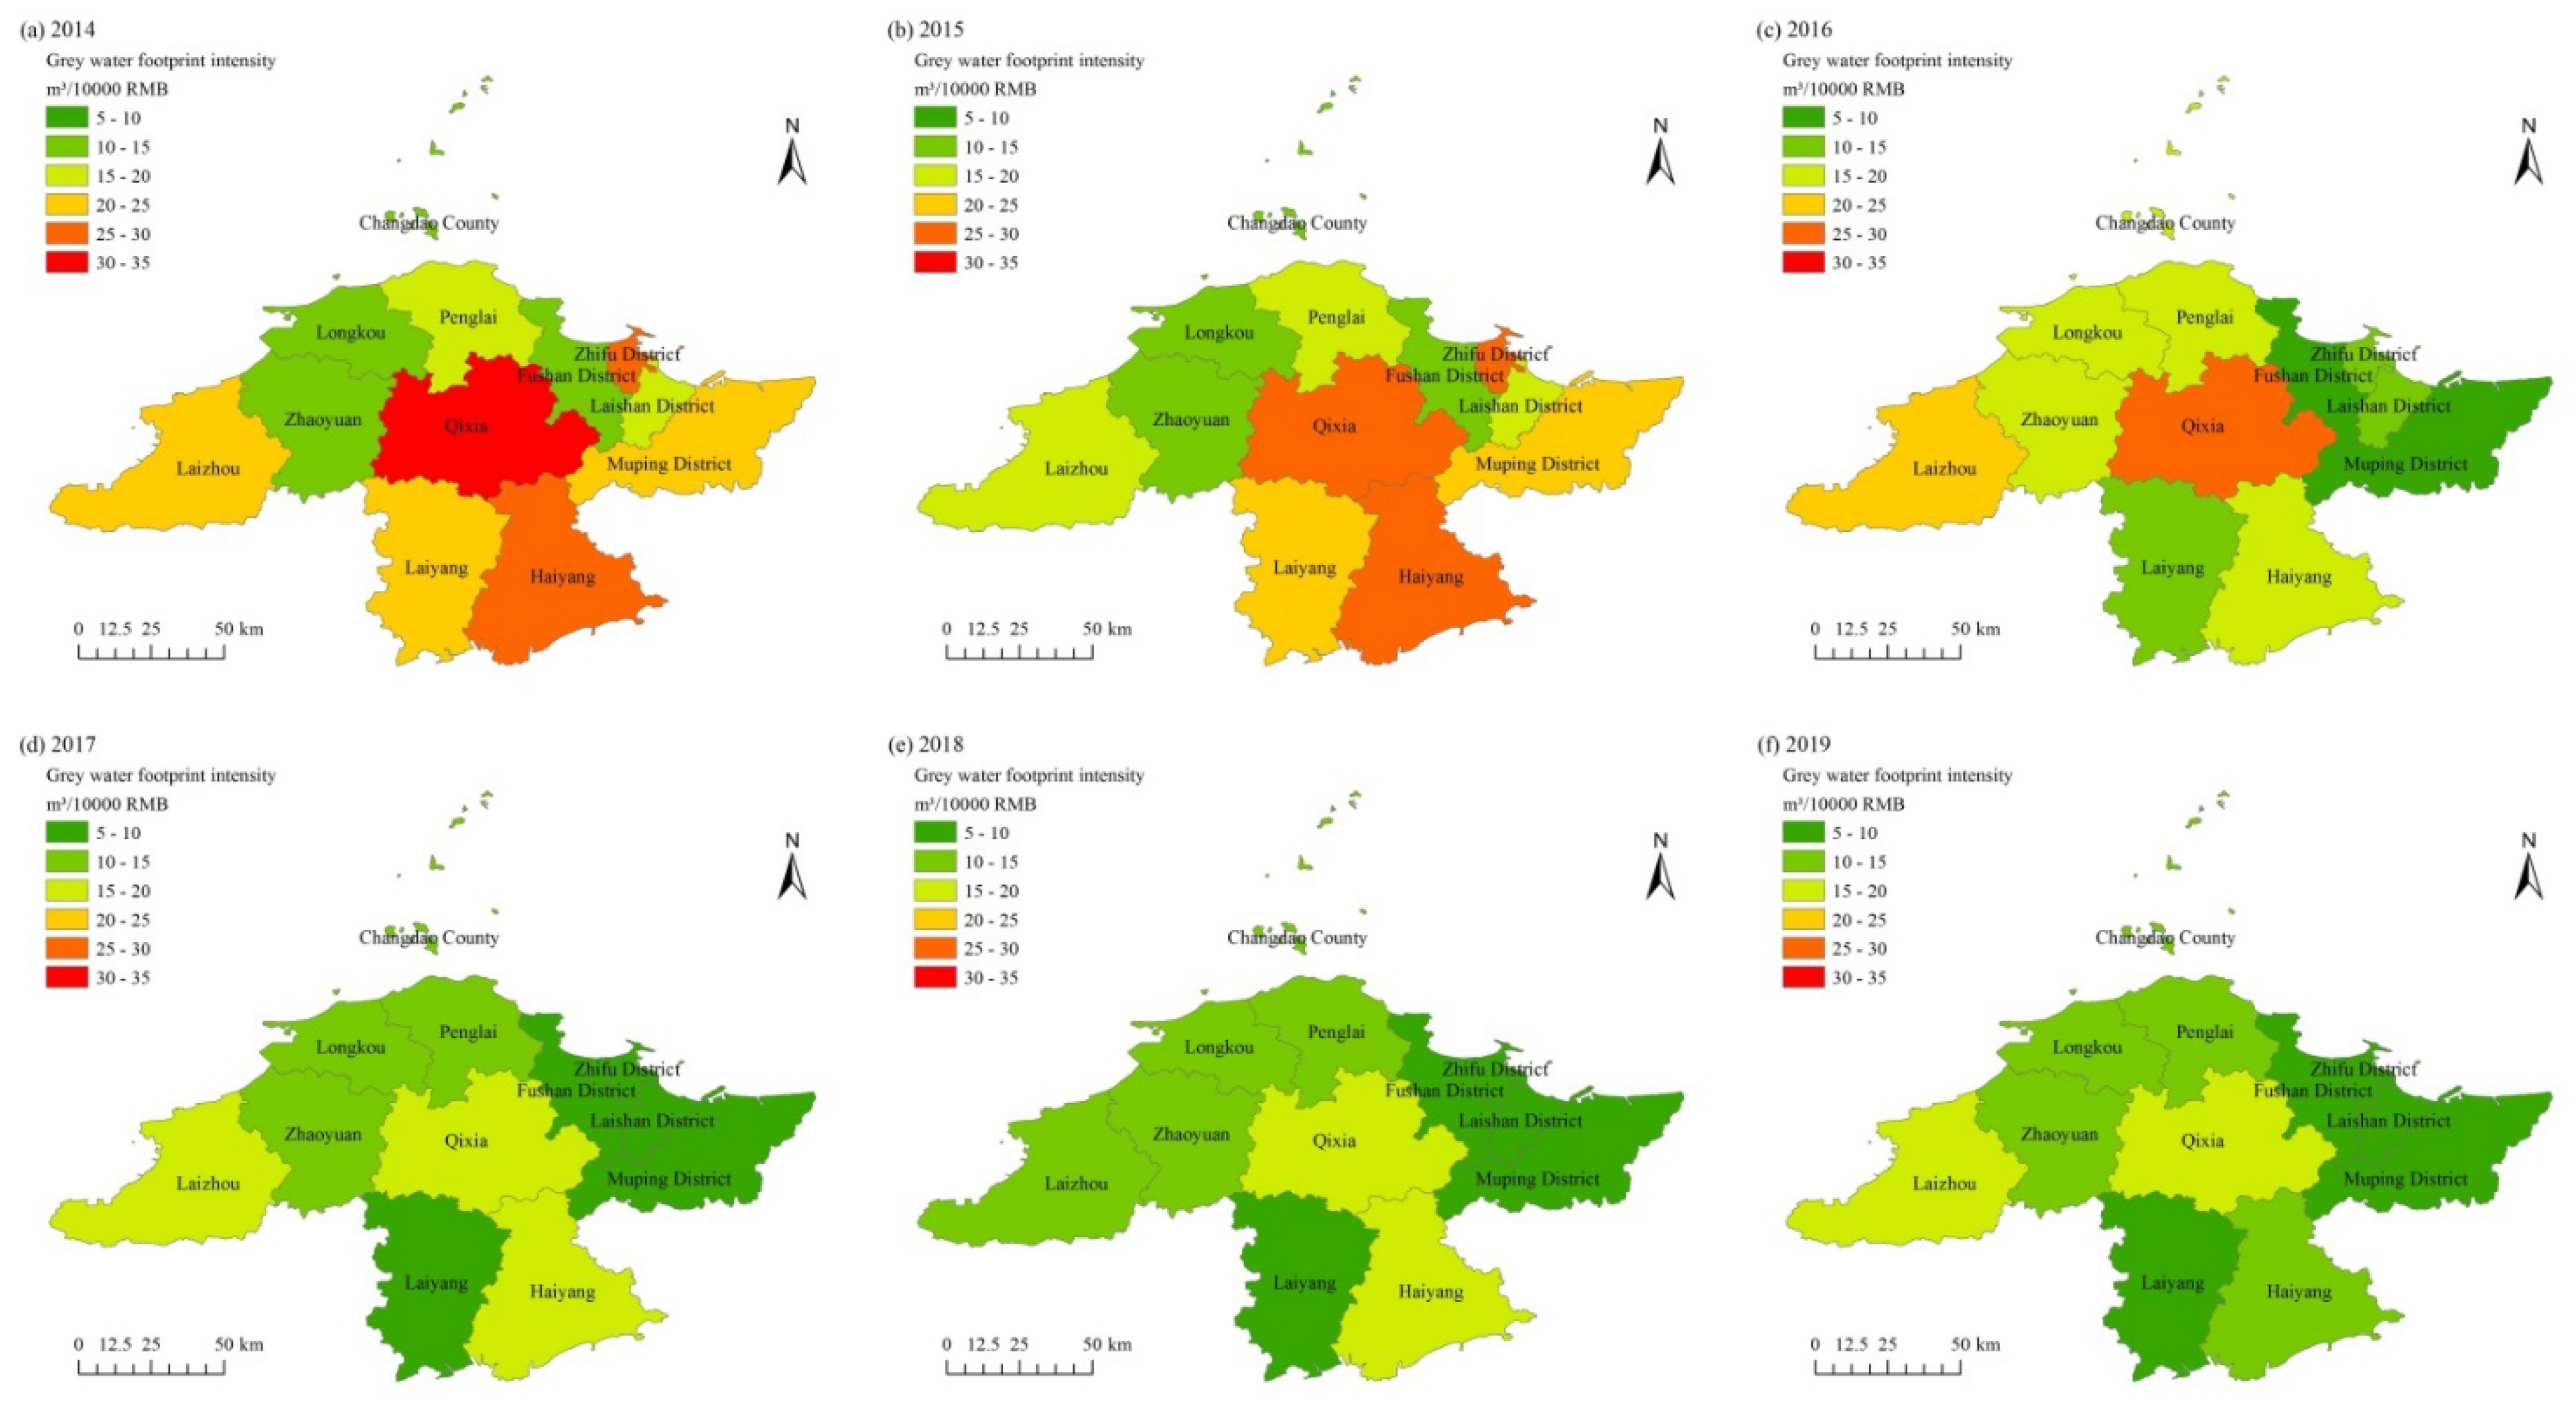
3.3. Grey Water Footprint Intensity
4. Discussion
4.1. Grey Water Footprint
4.2. Grey Water Footprint Sustainability
4.3. Grey Water Footprint Intensity
5. Conclusions
Author Contributions
Funding
Institutional Review Board Statement
Informed Consent Statement
Data Availability Statement
Acknowledgments
Conflicts of Interest
References
- Lu, J.; Lin, Y.; Wu, J.; Zhang, C. Continental-scale spatial distribution, sources, and health risks of heavy metals in seafood: Challenge for the water-food-energy nexus sustainability in coastal regions? Environ. Sci. Pollut. Res. 2021, 28, 63815–63828. [Google Scholar] [CrossRef] [PubMed]
- Lu, J.; Wu, J.; Wang, J. Metagenomic analysis on resistance genes in water and microplastics from a mariculture system. Front. Environ. Sci. Eng. 2022, 16, 4. [Google Scholar] [CrossRef]
- Lu, J.; Zhang, Y.; Wu, J.; Wang, J. Intervention of antimicrobial peptide usage on antimicrobial resistance in aquaculture. J. Hazard. Mater. 2022, 427, 128154. [Google Scholar] [CrossRef] [PubMed]
- Oki, T.; Kanae, S. Global Hydrological Cycles and World Water Resources. Science 2006, 313, 1068–1072. [Google Scholar] [CrossRef] [PubMed]
- Liu, J.; Zang, C.; Tian, S.; Liu, J.; Yang, H.; Jia, S.; You, L.; Liu, B.; Zhang, M. Water conservancy projects in China: Achievements, challenges and way forward. Glob. Environ. Chang. 2013, 23, 633–643. [Google Scholar] [CrossRef]
- Wu, L.; Qi, T.; Li, D.; Yang, H.; Liu, G.; Ma, X.; Gao, J. Current status, problems and control strategies of water resources pollution in China. Water Policy 2015, 17, 423–440. [Google Scholar] [CrossRef]
- She, Y.; Cui, B.; Sha, J. Analysis on the Sustainable Utilization of Water Resources in China. In Proceedings of the 3rd International Conference on Bioinformatics and Biomedical Engineering, Beijing, China, 11–16 June 2009; p. 5928. [Google Scholar]
- Zhang, H.; Jin, G.; Yu, Y. Review of River Basin Water Resource Management in China. Water 2018, 10, 425. [Google Scholar] [CrossRef]
- Wang, X.; Zhang, J.; Gao, J.; Shahid, S.; Xia, X.; Geng, Z.; Tang, L. The new concept of water resources management in China: Ensuring water security in changing environment. Environ. Dev. Sustain. 2018, 20, 897–909. [Google Scholar] [CrossRef]
- Han, D.; Currell, M.J.; Cao, G. Deep challenges for China’s war on water pollution. Environ. Pollut. 2016, 218, 1222–1233. [Google Scholar] [CrossRef]
- Qu, J.; Wang, H.; Wang, K.; Yu, G.; Ke, B.; Yu, H.; Ren, H.; Zheng, X.; Li, J.; Li, W.; et al. Municipal wastewater treatment in China: Development history and future perspectives. Front. Environ. Sci. Eng. 2019, 13, 88. [Google Scholar] [CrossRef]
- Liu, Y.; Du, J.; Ding, B.; Liu, Y.; Liu, W.; Xia, A.; Huo, R.; Ran, Q.; Hao, Y.; Cui, X.; et al. Water resource conservation promotes synergy between economy and environment in China’s northern drylands. Front. Environ. Sci. Eng. 2021, 16, 28. [Google Scholar] [CrossRef]
- Xue, J.; Wang, Q.; Zhang, M. A review of non-point source water pollution modeling for the urban–Rural transitional areas of China: Research status and prospect. Sci. Total Environ. 2022, 826, 154146. [Google Scholar] [CrossRef] [PubMed]
- Chen, J.; Gao, Y.; Qian, H.; Jia, H.; Zhang, Q. Insights into water sustainability from a grey water footprint perspective in an irrigated region of the Yellow River Basin. J. Clean. Prod. 2021, 316, 128329. [Google Scholar] [CrossRef]
- Bonamente, E.; Rinaldi, S.; Nicolini, A.; Cotana, F. National Water Footprint: Toward a Comprehensive Approach for the Evaluation of the Sustainability of Water Use in Italy. Sustainability 2017, 9, 1341. [Google Scholar] [CrossRef]
- Hossain, I.; Imteaz, M.A.; Khastagir, A. Water footprint: Applying the water footprint assessment method to Australian agriculture. J. Sci. Food Agric. 2020, 101, 4090–4098. [Google Scholar] [CrossRef] [PubMed]
- Hoekstra, A.Y.; Chapagain, A.K.; Aldaya, M.M.; Hoekstra, M. The Water Footprint Assessment Manual: Setting the Global Standard; Earthscan: London, UK, 2011. [Google Scholar]
- Chen, S.; Lu, H.; Li, S.; Liu, Y.; Zhang, Y.; Wang, H.; Song, X. Methods of comprehensive water footprint assessment for sustainable utilization of water resources. Water Resour. Prot. 2021, 37, 22–28. [Google Scholar]
- Zhao, L. Study on spatial convergence of grey water footprint intensity on provincial scale in China. J. Liaoning Norm. Univ. (Nat. Sci. Ed.) 2017, 40, 541–547. [Google Scholar]
- Hoekstra, A.Y.; Hung, P.Q. Virtual water trade: A quantification of virtual water flows between nations in relation to international crop trade. Water Sci. Technol. 2002, 49, 203–209. [Google Scholar]
- Hoekstra, A.Y.; Chapagain, A.K. Globalization of Water: Sharing the Planet’s Freshwater Resources; Blackwell Publishing: Oxford, UK, 2008. [Google Scholar]
- Ansorge, L.; Stejskalová, L.; Dlabal, J. Grey water footprint as a tool for implementing the Water Framework Directive–Temelín nuclear power station. J. Clean. Prod. 2020, 263, 121541. [Google Scholar] [CrossRef]
- Ruini, L.; Marino, M.; Pignatelli, S.; Laio, F.; Ridolfi, L. Water footprint of a large-sized food company: The case of Barilla pasta production. Water Resour. Ind. 2013, 1–2, 7–24. [Google Scholar] [CrossRef]
- Allocca, V.; Marzano, E.; Tramontano, M.; Celico, F. Environmental impact of cattle grazing on a karst aquifer in the southern Apennines (Italy): Quantification through the grey water footprint. Ecol. Indic. 2018, 93, 830–837. [Google Scholar] [CrossRef]
- Feng, H.; Sun, F.; Liu, Y.; Zeng, P.; Deng, L.; Che, Y. Mapping multiple water pollutants across China using the grey water footprint. Sci. Total Environ. 2021, 785, 147255. [Google Scholar] [CrossRef] [PubMed]
- Yapicioglu, P.; Yesilnacar, M.I. Grey water footprint assessment of groundwater resources in southeastern Turkey: Effect of recharge. Water Sci. Technol. Water Supply 2021, 22, 615–627. [Google Scholar] [CrossRef]
- Mekonnen, M.M.; Hoekstra, A.Y. The green, blue and grey water footprint of crops and derived crop products. Hydrol. Earth Syst. Sci. 2011, 15, 1577–1600. [Google Scholar] [CrossRef]
- Ming, J.; Liao, X.; Zhao, X. Grey water footprint for global energy demands. Front. Earth Sci. 2019, 14, 201–208. [Google Scholar] [CrossRef]
- Fu, T.; Xu, C.; Yang, L.; Hou, S.; Xia, Q. Measurement and driving factors of grey water footprint efficiency in Yangtze River Basin. Sci. Total Environ. 2021, 802, 149587. [Google Scholar] [CrossRef]
- Tian, Z.; Wang, S.; Chen, B. A three-scale input-output analysis of blue and grey water footprint for Beijing-Tianjin-Hebei Urban Agglomeration. Energy Procedia 2019, 158, 4049–4054. [Google Scholar] [CrossRef]
- Jamshidi, S.; Imani, S.; Delavar, M. An approach to quantifying the grey water footprint of agricultural productions in basins with impaired environment. J. Hydrol. 2022, 606, 127458. [Google Scholar] [CrossRef]
- Zhang, L.; Dong, H.; Geng, Y.; Francisco, M.-J. China’s provincial grey water footprint characteristic and driving forces. Sci. Total Environ. 2019, 677, 427–435. [Google Scholar] [CrossRef]
- An, Z.; Yan, J.; Sha, J.; Ma, Y.; Mou, S. Dynamic simulation for comprehensive water resources policies to improve water-use efficiency in coastal city. Environ. Sci. Pollut. Res. 2021, 28, 25628–25649. [Google Scholar] [CrossRef]
- Chen, N.; Hong, H.; Gao, X. Securing drinking water resources for a coastal city under global change: Scientific and institutional perspectives. Ocean. Coast. Manag. 2021, 207, 104427. [Google Scholar] [CrossRef]
- Liu, Y.; Yang, L.; Jiang, W. Coupling coordination and spatiotemporal dynamic evolution between social economy and water environmental quality–A case study from Nansi Lake catchment, China. Ecol. Indic. 2020, 119, 106870. [Google Scholar] [CrossRef]
- Leila, E.; Roy, B.; Saman, R. Integrated modelling to assess the impacts of water stress in a transboundary river basin: Bridging local-scale water resource operations to a river basin economy. Sci. Total Environ. 2021, 800, 149543. [Google Scholar]
- Cong, F.; Diao, Y. Sustainable Evaluation of Urban Water Resources and Environment Complex System in North Coastal Cities. In Proceedings of the 2nd International Conference on Challenges in Environmental Science and Computer Engineering (CESCE), Haikou, China, 14–15 December 2011; pp. 798–802. [Google Scholar]
- Li, X.; Zhao, Y.; Shi, C.; Sha, J.; Wang, Z.; Wang, Y. Application of Water Evaluation and Planning (WEAP) model for water resources management strategy estimation in coastal Binhai New Area, China. Ocean. Coast. Manag. 2015, 106, 97–109. [Google Scholar] [CrossRef]
- Liu, S.Y.; Zhang, J.J.; Han, M.Y.; Yao, Y.X.; Chen, G.Q. Multi-scale water use balance for a typical coastal city in China. J. Clean. Prod. 2019, 236, 117505. [Google Scholar] [CrossRef]
- Chen, H.J.; Huang, Y.P.; Ke, Y.K. Ubiquitous Computing and Evaluation of Water Quality by Grey Relational Analysis. In Proceedings of the IEEE 9th International Conference on Ubiquitous Intelligence and Computing (UIC)/IEEE 9th International Conference on Autonomic and Trusted Computing (ATC), Fukuoka, Japan, 4–7 September 2012; pp. 719–724. [Google Scholar]
- Xu, G.; Xie, J.; Zhang, Y.; Zhao, C.; Wu, Q. Application of Nemerow Pollution Index in Landscape River Water Quality Assessment of Tianjin. In Proceedings of the 4th International Conference on Bioinformatics and Biomedical Engineering (iCBBE), Chengdu, China, 18–20 June 2010. [Google Scholar]
- Sarkar, A.; Pandey, P. River Water Quality Modelling using Artificial Neural Network Technique. In Proceedings of the International Conference on Water Resources, Coastal and Ocean Engineering (ICWRCOE), Natl Inst Technol Karnataka, Mangaluru, India, 11–14 March 2015; pp. 1070–1077. [Google Scholar]
- Ginters, E.; Aizstrauts, A.; Eroles, M.A.P.; Buil, R.; Wang, B. Economic Development Assessment Simulator Based on Yantai Use Case. Procedia Comput. Sci. 2015, 77, 22–32. [Google Scholar] [CrossRef]
- Du, Y.; Wang, Y. Evaluation of marine ranching resources and environmental carrying capacity from the pressure-and-support perspective: A case study of Yantai. Ecol. Indic. 2021, 126, 107688. [Google Scholar] [CrossRef]
- Wang, H.; Qin, D.; Wang, J.; Zhou, Z. State Identification and Multiple Regulation of Regional Water Resources Shortage. Resour. Sci. 2003, 25, 2–7. [Google Scholar]
- Wang, S.; Lin, Y. Spatial evolution and its drivers of regional agro-ecological efficiency in China’s from the perspective of water footprint and gray water footprint. Sci. Geogr. Sin. 2021, 41, 290–301. [Google Scholar]
- Gai, L.; Xie, G.; Li, S.; Zhang, C.; Chen, L. A study on production water footprint of winter-wheat and maize in the North China Plain. Resour. Sci. 2010, 32, 2066–2071. [Google Scholar]
- Han, Q.; Sun, C.; Zou, W. Grey water footprint efficiency measure and its driving pattern analysis on provincial scale in China from 1998 to 2012. Resour. Sci. 2016, 38, 1179–1191. [Google Scholar]
- Liu, H.; Chen, M.; Tang, Z. Study on Ecological Compensation Standards of Water Resources Based on Grey Water Footprint: A Case of the Yangtze River Economic Belt. Resour. Environ. Yangtze Basin 2019, 28, 2553–2563. [Google Scholar]
- Khan, T.; Khan, H. Environmental sustainability of grey water footprints in Peshawar Basin: Current and future reduced flow scenarios for Kabul River. Int. J. Agric. Biol. Eng. 2019, 12, 162–168. [Google Scholar] [CrossRef]
- Ansorge, L.; Stejskalová, L.; Dlabal, J. Effect of WWTP size on grey water footprint-Czech Republic case study. Environ. Res. Lett. 2020, 15, 104020. [Google Scholar] [CrossRef]
- Huang, R.; Xu, J.; Xie, L.; Wang, H.; Ni, X. Energy neutrality potential of wastewater treatment plants: A novel evaluation framework integrating energy efficiency and recovery. Front. Environ. Sci. Eng. 2022, 16, 117. [Google Scholar] [CrossRef]
- Sun, K.; Xu, Z. The impacts of human driving factors on grey water footprint in China using a GWR model. Geogr. Res. 2016, 35, 37–48. [Google Scholar]
- Zhang, Z.; Sun, C. Driving effect measurements and spatial-temporal variation of the per capita gray water ecological footprint in China. Acta Ecol. Sin. 2018, 38, 4596–4608. [Google Scholar]
- Bai, T.; Sun, C.; Zhao, L. Influence of human factors on the economic productivity of grey water in China. Acta Ecol. Sin. 2018, 38, 2536–2546. [Google Scholar]
- Wang, Y.; Xian, C.; Ouyang, Z. Integrated assessment of sustainability in urban water resources utilization in China based on grey water footprint. Acta Ecol. Sin. 2021, 41, 2983–2995. [Google Scholar]


Publisher’s Note: MDPI stays neutral with regard to jurisdictional claims in published maps and institutional affiliations. |
© 2022 by the authors. Licensee MDPI, Basel, Switzerland. This article is an open access article distributed under the terms and conditions of the Creative Commons Attribution (CC BY) license (https://creativecommons.org/licenses/by/4.0/).
Share and Cite
Meng, X.; Lu, J.; Wu, J.; Zhang, Z.; Chen, L. Quantification and Evaluation of Grey Water Footprint in Yantai. Water 2022, 14, 1893. https://doi.org/10.3390/w14121893
Meng X, Lu J, Wu J, Zhang Z, Chen L. Quantification and Evaluation of Grey Water Footprint in Yantai. Water. 2022; 14(12):1893. https://doi.org/10.3390/w14121893
Chicago/Turabian StyleMeng, Xue, Jian Lu, Jun Wu, Zhenhua Zhang, and Liwei Chen. 2022. "Quantification and Evaluation of Grey Water Footprint in Yantai" Water 14, no. 12: 1893. https://doi.org/10.3390/w14121893