Article

Characterization of South African Brewery Wastewater: Oxidation-Reduction Potential Variation

by
Siphesihle Mangena Khumalo
1,2,*,
Babatunde Femi Bakare
2,
Sudesh Rathilal
1 and
Emmanuel Kweinor Tetteh
1
1
Green Engineering Research Group, Department of Chemical Engineering, Faculty of Engineering and The Built Environment, Durban University of Technology, Steve Campus, S3 L3, P.O. Box 1334, Durban 4000, South Africa
2
Department of Chemical Engineering, Faculty of Engineering, Mangosuthu University of Technology, P.O. Box 12363 Jacobs, Durban 4026, South Africa
*
Author to whom correspondence should be addressed.
Water 2022, 14(10), 1604; https://doi.org/10.3390/w14101604
Submission received: 9 April 2022 / Revised: 30 April 2022 / Accepted: 13 May 2022 / Published: 17 May 2022
(This article belongs to the Special Issue New Technology Development for Wastewater and Solid Waste Treatment)

Abstract

:
Conventional wastewater treatment processes are challenged by the need to effectively reduce pollutant loads before disposal or reuse, as the composition and concentration of contaminants in brewery wastewater change with time. This results in the variation of the oxidation-reduction potential (ORP) of the affluent. Hence, the current study is aimed at the application of ORP as a real-time tool to monitor brewery wastewater quality. Other physicochemical parameters of the local brewery in South Africa investigated included temperature (T), pH, conductivity, turbidity, total chemical oxygen demand (TCOD), soluble chemical oxygen demand (SCOD), particulate chemical oxygen demand (PCOD), total solids, orthophosphate, ammoniacal nitrogen, total Kjeldahl nitrogen (TKN), total nitrogen (TN), nitrate, and nitrite nitrogen. It was found that the ORP decreased (135 to −305 mV) with an increase in alkalinity (pH 4.4 to 12.2) with linear regression coefficient fit (R2 = 0.9994). The ORP facilitated the wastewater nutrient constituent degradability which improved the water quality. Furthermore, the high organic content of the brewery wastewater was found as measured by total COD (3447–11,813 mg/L). This suggests remediation before reuse of the brewery wastewater will require a robust integrated wastewater treatment process.

1. Introduction

In South Africa, most municipal wastewater treatment plants designed to handle domestic wastewater are under-operated and have difficulty meeting water needs. Herein, high concentrations of organic and inorganic matter in industrial wastewater, such as brewery effluent, tends to upset the treatment plants [1,2]. Since beer is the world’s fifth most consumed beverage, the brewing industry is very essential to both developed and developing countries’ economies [1]. So, knowing the brewing effluent composition to develop a robust abatement technology comes in handy.
Generally, brewing of beer require substantial amounts of water: to make 1 m3 of beer, a volume of wastewater of 10–20 m3 is produced [3]. The brewing process includes malting, mashing, wort filtering, wort boiling, fermentation, maturation, stabilization, and clarification [4,5]. These processes influence the qualities of the wastewater produced, which means it must be treated by the municipal treatment plants before discharge into the environment [4]. Most brewers handle wastewaters aerobically with the aid of pretreatment process such as chemical coagulation [6]. These techniques are highly expensive and energy-intensive, making them unsustainable in the long term [5,6]. This warrants the development of viable and sustainable technologies for the treatment of brewing wastewater for reuse.
Wastewater generated from breweries is characterized by high concentrations of both organic and inorganic pollutants, which may contribute to environmental and water pollution when discharged without pretreatment [1]. Brewery wastewater composition includes high-strength chemical oxygen demand (COD), together with 5-day biochemical oxygen demand, total solids, nitrogen, and phosphorus pollutants, volatile fatty acids, etc. [1,2,7,8]. However, nitrogen and phosphorus concentrations are dependent on the type of chemicals that are used in the brewing house as well as the amount of yeast used in the effluent [6,7].
Due to the worldwide challenge of fresh water scarcity, particularly in the sub-Saharan region, industrial wastewater reuse seems to be necessary [9]. Hence, it is imperative to monitor and control industrial wastewater being discharged into water-receiving bodies to prevent any or further environmental pollution. The choice of industrial wastewater treatment, which could be either biological or chemical methods, depends solely on the composition of the pollutants [10]. The measurement of the oxidation-reduction potential (ORP) or redox in wastewater can be used as a quick indication of whether biological treatment will be permitted [11,12,13]. By definition, oxidation-reduction potential is a measurement of the ability of wastewater to allow the occurrence of specific biological reactions [14]. The ORP can be used to monitor biological reactions during the biodegradation of organic pollutants in wastewater, as well as being a process control parameter [14,15,16,17]. Several new processes for the simultaneous removal of nitrogen and phosphorus from wastewater have been developed recently, including partial nitrification (nitritation), anaerobic ammonium oxidation (ANAMMOX), autotrophic nitrogen removal over nitrite, and other approaches [3,4]. Yu et al. [18] reported an artificial neural networks (ANN) model R2 values ranging from 0.96 to 0.99, which explicitly explains that online ORP, pH, and dissolved oxygen monitoring data can be used as input parameters to the ANN model, and used to predict their system performance. Chen et al. [16] investigated the performance of an immobilized-cell reactor for simultaneous carbon–nitrogen removal in synthetic wastewater using ORP as a process monitoring parameter. The study gave distinctive turning points, which directly correlated with the changes in the system biochemistry; the ORP–time profile was implemented in finding nitrate breakpoint of the aeration cycle.
Furthermore, there are emerging advanced wastewater treatment techniques, such as advanced oxidation processes for the removal of persistent organic compounds and/or pollutants from wastewater streams. The photodegradation process was designed on the basis of a material to absorb a photon of energy at least equal to its band gap energy, and its generation of hydroxyl and superoxide radicals has cemented its application in the degradation of organic pollutants [19]. Sambaza et al. [20] used polyaniline-coated titanium dioxide (PANI/TiO2) nanorods to study the effect of nitrate ions concentration in photocatalytic degradation of bisphenol in aqueous environments. The findings of their study demonstrated that the removal efficiency of bisphenol, which is an organic pollutant, increased with an increase in nitrate ions concentration in bisphenol solution. The increase in the degradation rate was attributed to the ability of nitrate ions to induce the production of hydroxyl radicals, which are imperative for the photocatalytic degradation process. The findings reported by Sambaza et al. [20] suggest that brewery wastewater can be treated using advanced oxidation techniques, such as the photocatalytic degradation process, for organic pollutants removal, such as COD. However, it is apparent that an additional treatment stage will be essential for the removal of nitrate ions prior to the effluent discharge into water-receiving bodies.
Consequently, the purpose of this study is to contribute new knowledge on characteristic features of wastewater generated from a local South African brewery, as well as contributing knowledge on how well these attributes have been influenced by the ORP. Therefore, this will help in the development of robust wastewater treatment systems capable of significantly reducing brewery wastewater pollutants and mitigating environmental pollution.

2. Materials and Methods

2.1. Raw Brewery Wastewater Sample

Brewery wastewater composite samples were collected from the influent stream (Figure 1) of a local South African brewery wastewater treatment plant. Wastewater from breweries is first sent to settling tanks where physical separation of solids takes place by gravity prior being sent to the brewery wastewater treatment plant. Effluent from the settling tanks is then sent to an aerobic–anaerobic digester as influent stream (Figure 1) to the brewery wastewater treatment plant. In the digester, biodegradation of pollutants in brewery wastewater occurs. The aerobic–anaerobic digester effluent is sent to a clarifier, where the supernatant leaves as the treatment plant effluent stream did, and is sent to the local municipality wastewater treatment works for further processing prior being discharged into water-receiving bodies.
Brewery wastewater composite samples were collected daily for 2 weeks using 1 L sterile-glass sampling bottles. Samples were transported to the laboratory in a cooler box full of ice to maintain a temperature of 4 °C. Upon arrival to the laboratory, samples were allowed to warm up to room temperature and analyses were conducted within 48 h from time of sampling in accordance with standard methods [21].

2.2. Analytical Technique

The physicochemical properties of the brewery effluent were analyzed in accordance with the Standard Methods for the Examination of Water and Wastewater [21]. This included temperature (T), pH, oxidation-reduction potential (ORP), conductivity, turbidity, total chemical oxygen demand (TCOD), soluble chemical oxygen demand (SCOD), particulate chemical oxygen demand (PCOD), total solids, orthophosphates, ammoniacal nitrogen, total Kjeldahl nitrogen (TKN), total nitrogen (TN), nitrate, and nitrite nitrogen. Temperature, pH, ORP, and conductivity were measured using a Thermo Scientific Orion Star A215 pH/conductivity meter (Waltham, MA, USA). Furthermore, the COD was measured colorimetrically using a Hach DR 3900 spectrophotometer with test vials ranging from 200 to 15,000 COD mg/L. Orthophosphates, ammoniacal nitrogen, TKN, TN, nitrates, and nitrites were all measured colorimetrically using a Hach DR 3900 spectrophotometer. The VSS was measured gravimetrically in mg VSS/L by igniting samples to constant weight in a muffle furnace at 550 °C. The portion lost during the ignition process is equivalent to the organic fraction. The TS was also measured gravimetrically in mg TS/L by drying a well-mixed sample at 105 °C for 24 h, the TS fraction was given by the weight of the residue after drying. For data credibility samples were measured in triplicates and statistically validated at 95% confidence level.

2.3. Statistical Analysis

All data obtained for the current study were statistically analyzed by calculating the mean, standard deviation (SD), and range. Equations (1) and (2) were used to calculate the mean and SD, respectively.
x ¯ = X n
S D = X x ¯ 2 n 1
where, x ¯ is the mean, X is the numerical value of each sample, and n is the total number of samples analyzed.

3. Results and Discussion

As mentioned, the goal of this study was to improve the treatability efficiency of a local South Africa brewery wastewater treatment, via observation and characterisation of the influent over 2 weeks. It was observed the plant treatment (Figure 1) efficiency was within 50–65% with organic load of 68 kg COD/m3.day. This was due to the insufficient oxygen intake of the aeration system, which affected the enzymatic activity or biological reactions [15]. Ideally, the nitrification–denitrification reactions enhanced the nutrients removal and ORP of the effluent, as presented in Table 1 [15]. The ORP measurement was cemented as the process monitoring parameter to ascertain the system performance as well as the wet chemistry of the effluent [12,16]. The result obtained affirms the report of Yu et al. [18] on the effectiveness of a nZVI-Fenton process for the removal of colour and chemical oxygen demand from textile effluent. Herein, the physiochemical parameters monitored had a meaningful correlation with the ORP.

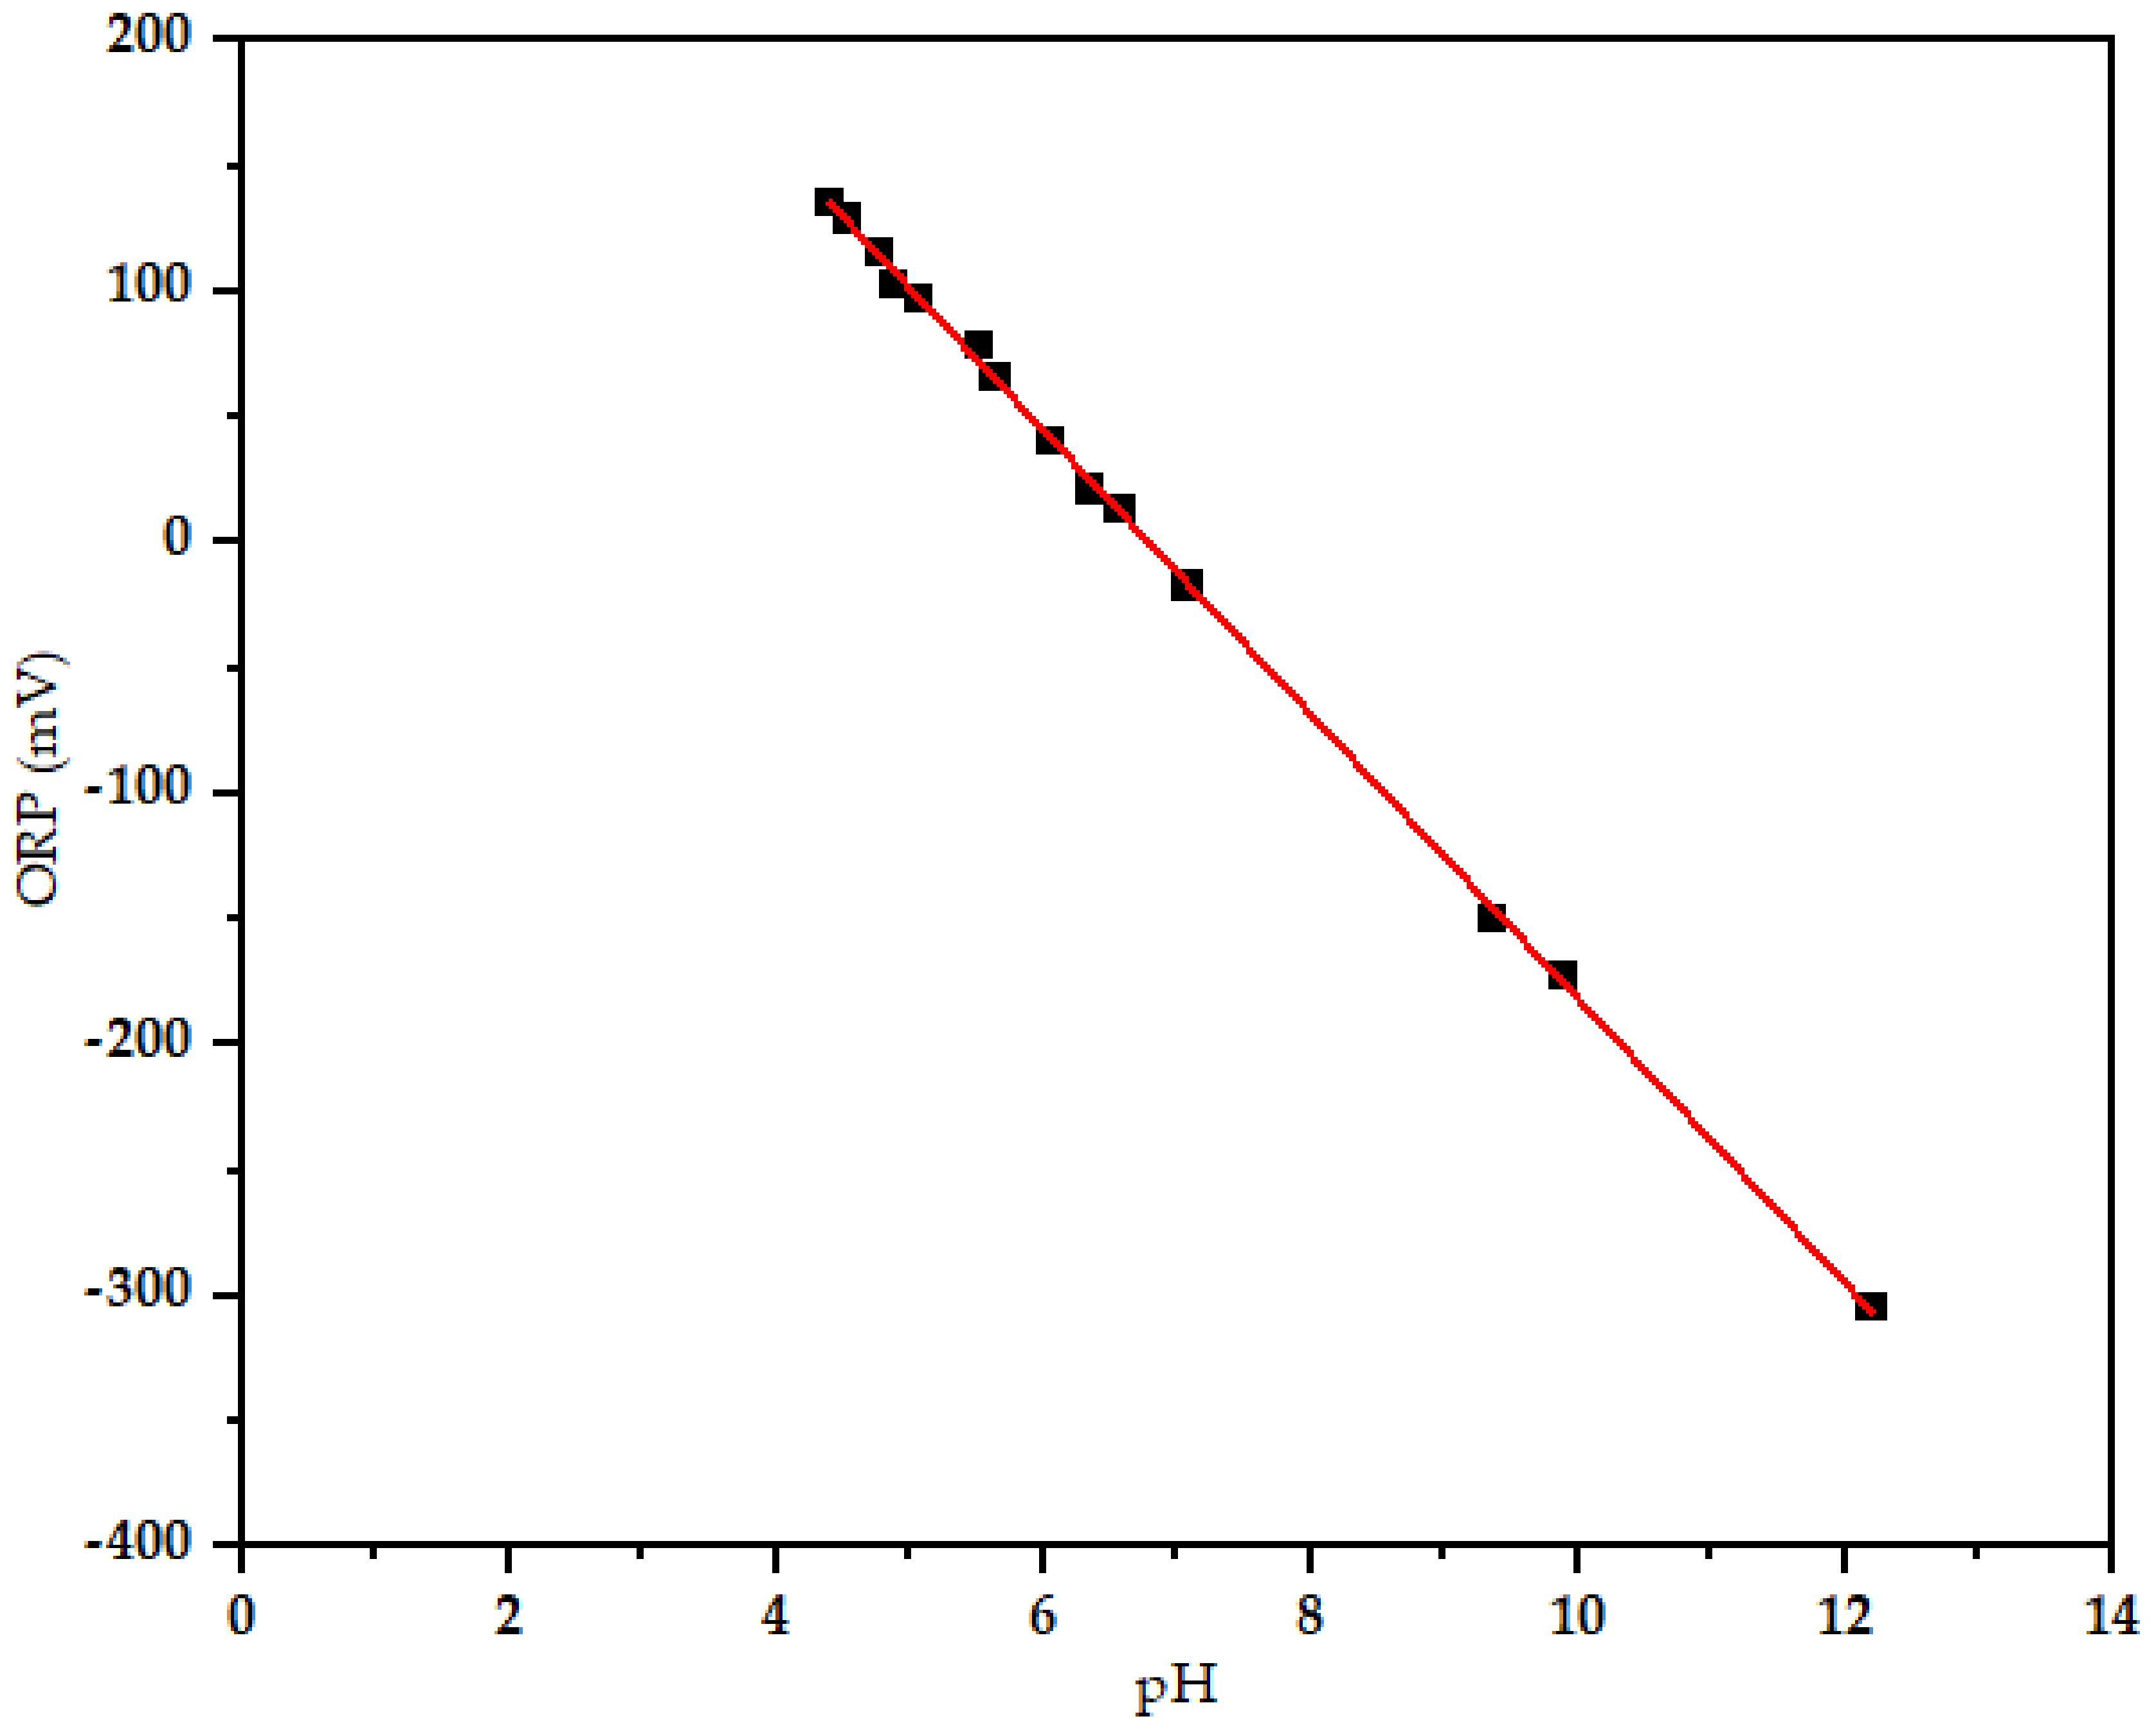
3.1. Oxidation Reduction Potential (ORP) versus pH

The pH and ORP of the brewery effluent were monitored, respectively, to ascertain the alkalinity and oxidation-reduction reactions [16], via the nitrification–denitrification mechanism as well as the phosphorus removal. The ORP versus pH profile presented in Figure 2 clearly shows the synergistic effect of the alkalinity region (>7) and acidic region (<7) of the effluent on the ORP. The ORP decreases with an increase in pH, the trend gave a linear correlation fit constant of R2 = 0.9994, which statistically confirms that there was a significant correlation between pH and ORP. The positive ORP values were attained within the acidic medium (pH < 7), whereas the negative ORP values were observed at pH > 7. This means that wastewater emanated from the brewery was characterized by an ORP ranging between −305 and 135 mV. The fluctuated pH and ORP values can be alluded to the biological activity as well as the effluent composition [18]. Moreover, the findings of the study on ORP as a function of pH suggest that brewery wastewater can be treated by biological processes on the basis that the reported ORP range permits biological activities as reported from Table 1 [15].

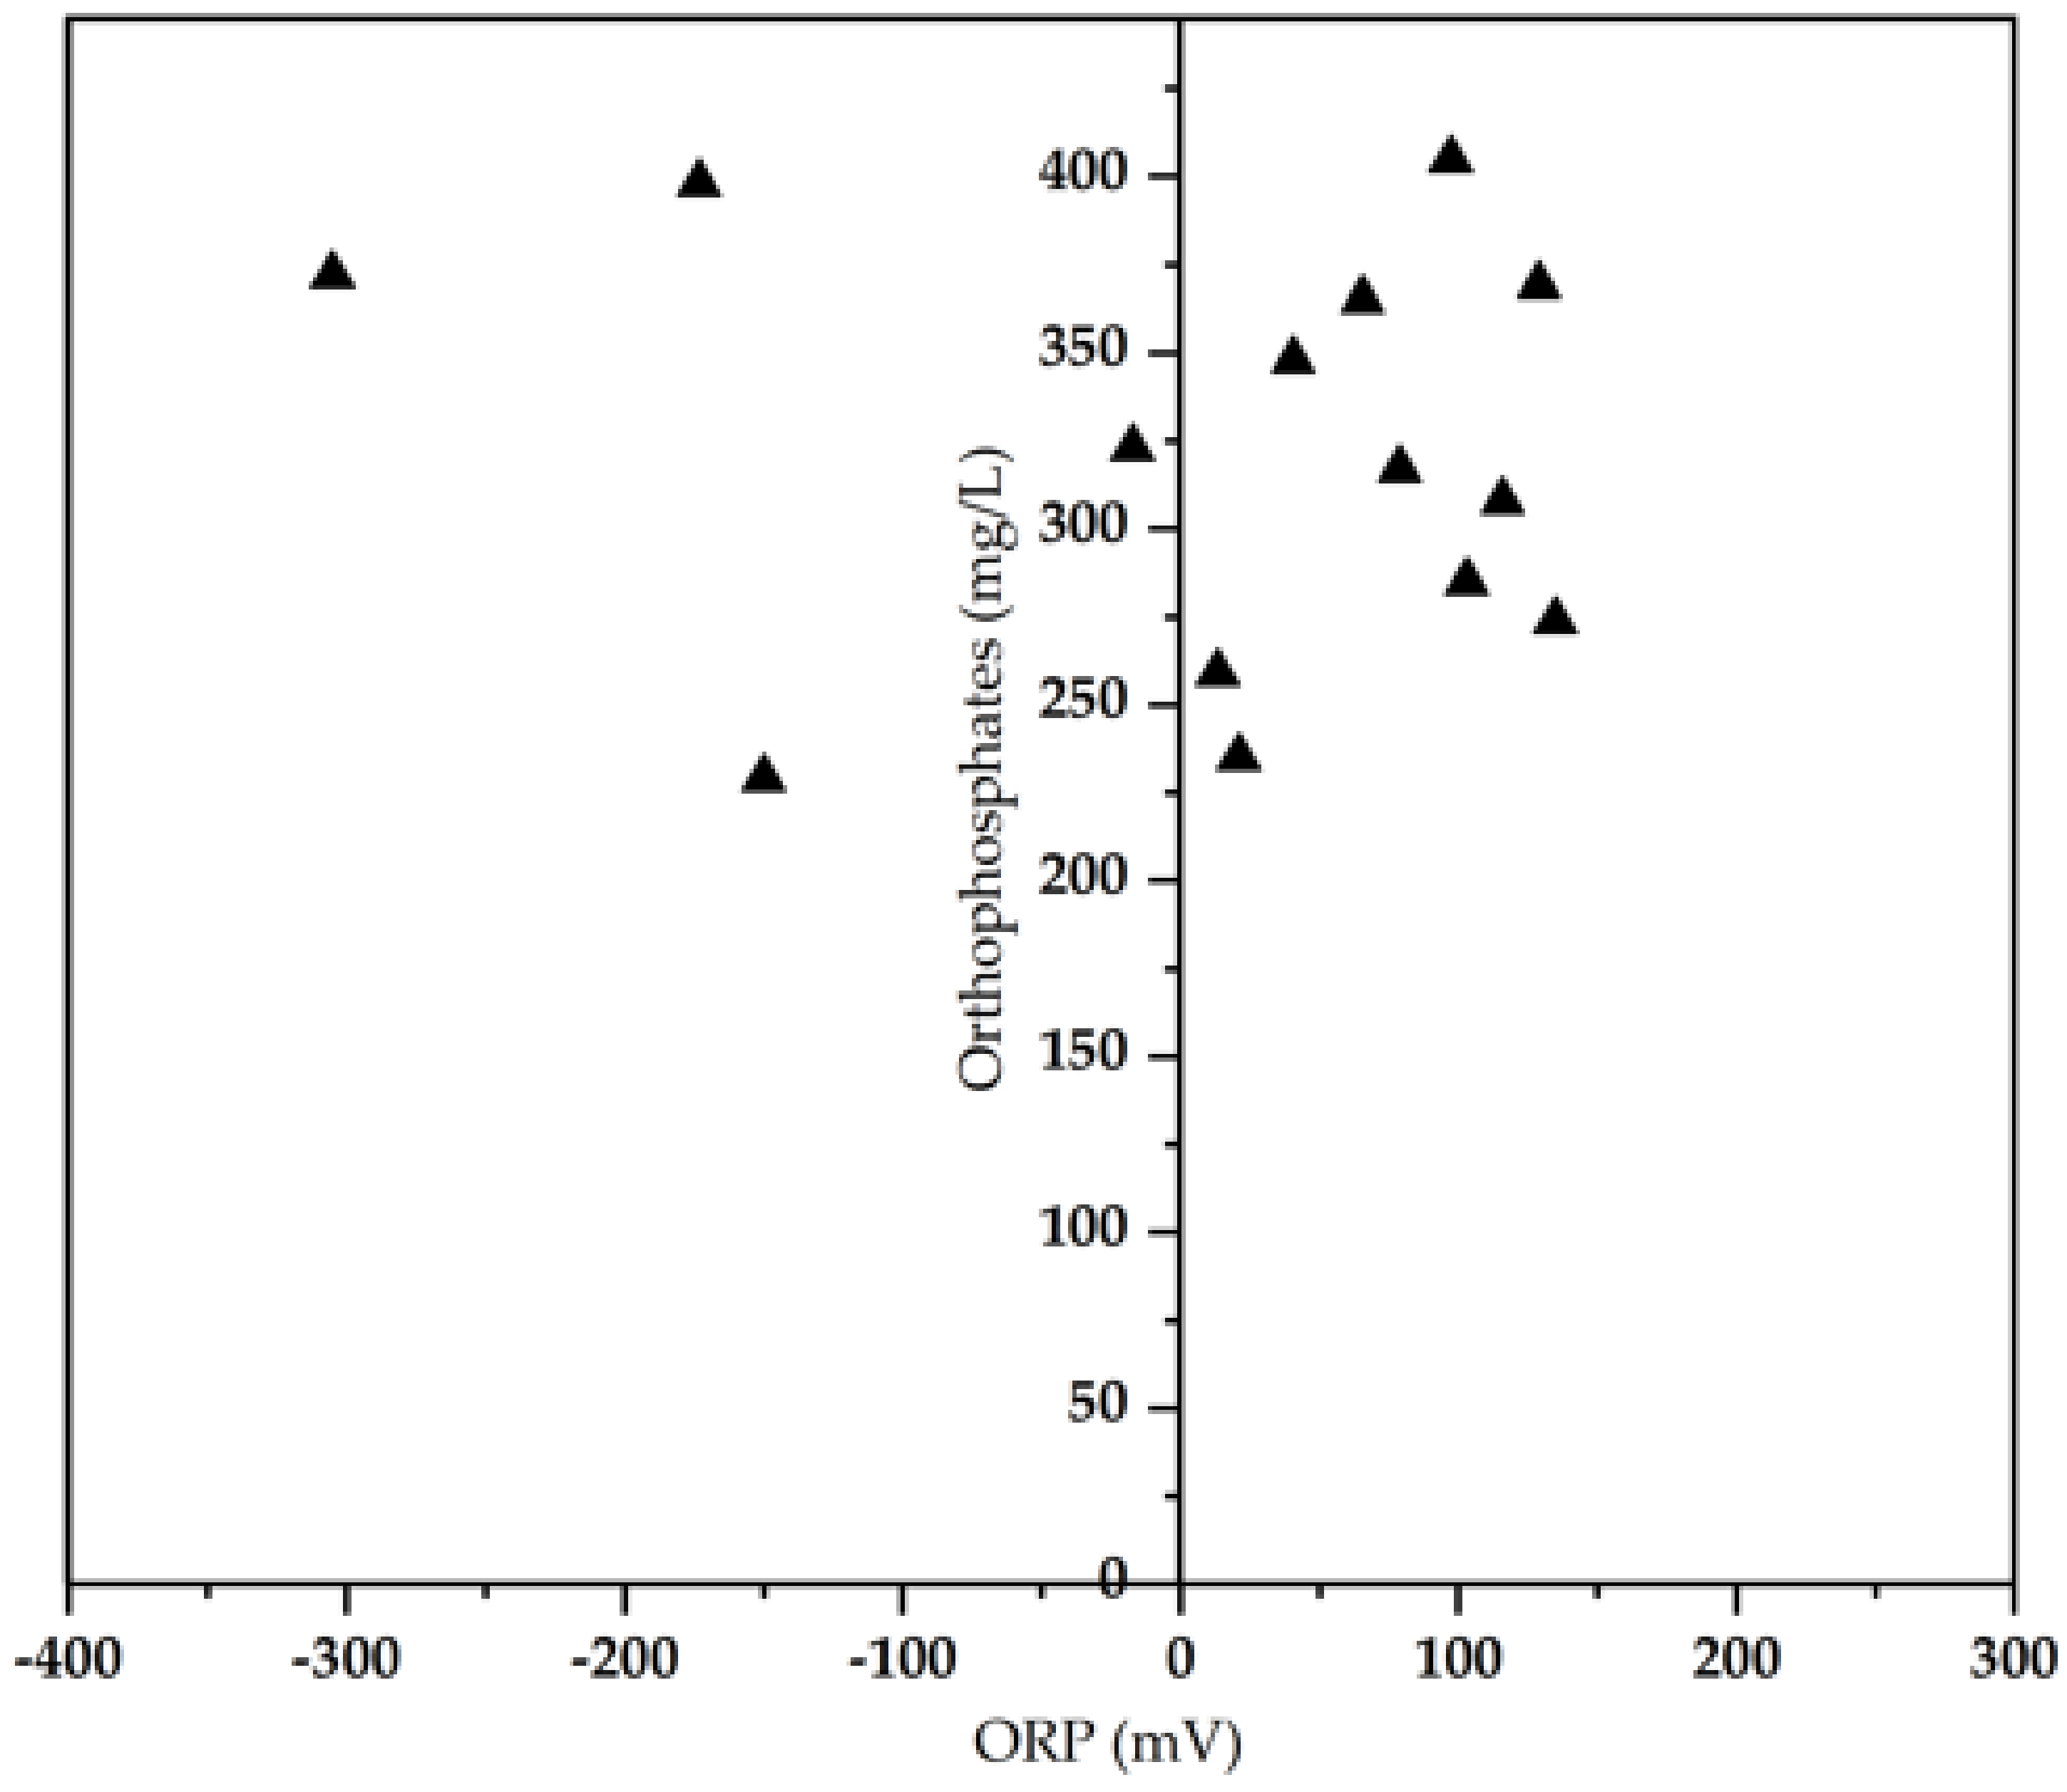
3.2. Biological Pollutants Composition versus ORP

In general chemistry, the ORP is characterised as the measure of the tendency of a given system to donate electrons (i.e., oxidizers) or receive electrons (i.e., reducers) involved in a system. Therefore, in a typical wastewater treatment system, free oxygen, nitrite, and nitrate are characterised as oxidising species. On the other hand, a number of organic and/or biological compounds which are not explicitly accounted for in this current work are typically reducing species. Moreover, based on the ORP definition, it is apparent that ORP values can be used as measurement for the redox potential of biological and chemical activities within a given system. Hence, the higher the concentration of reducing compounds, i.e., organic and/or biological compounds, the lower the ORP values. The findings of the current study in this subsection are discussed aimed at studying the correlation between ORP values and pollutants concentration.
The microbial activities, such as the phosphorus uptake and the nitrification–denitrification process, were observed to occur at different ORP levels. The profile, respectively, for the nitrate, and nitrite–nitrogen, ammonia–nitrogen, and orthophosphates concentrations with variation of the ORP are presented in Figure 3, Figure 4 and Figure 5, respectively. As nitrification is a two-step process that takes place in the presence of oxygen involving two groups of autotrophic bacteria, i.e., Nitrosomonas and Nitrobacteria. Ammonia (NH4) as a toxic nitrogen compound in the wastewater was found to decrease with an increase in the ORP profile for the removal of nitrogen and phosphorus by aerated system. The biochemical pathway for the nitrification–denitrification process is expressed by Equations (3) and (4), whereby the ammonia is oxidized into nitrite by Nitrosomonas bacteria (3). Subsequent to this is the nitrification phase (4), which involves the oxidation of the nitrite into nitrate by Nitrobacteria.
2 N H 4 + + 3 O 2 N i t r o s o m o n a s   2 N O 2 + 4 H + + 2 H 2 O
2 N O 2 + O 2 N i t r o b a c t e r i a     2 N O 3
Figure 3 and Figure 4 presents the nitrate, nitrite, and ammoniacal nitrogen concentration versus ORP profiles, respectively. When studying Figure 3, it is apparent that high ORP values with the maximum being 135 mV were recorded for nitrate and nitrite concentrations of less than 7.5 mg/L combined. Moreover, the ORP decreased significantly for nitrate and nitrite concentration above 9.0 mg/L. The findings suggest that the is a correlation between the ORP and brewery wastewater quality, on the basis that it is apparent that high ORP values denotes low nitrate and nitrite concentrations. This is attributed to the concept that simultaneous nitrification and denitrification occur at a ORP range of between 118–150 mV [12]. On the other hand, the low ORP values of less than 0 mV suggest moderately high nitrate, and nitrite concentrations in the brewery wastewater under investigation. The findings of the study can be related to the ORP definition, suggesting that at low ORP values the brewery wastewater has high concentration of oxidizing species, i.e., nitrite and nitrate as presented in Figure 3.
Moreover, apart from the peculiar observation from Figure 3, at which the highest concentration (49 mg/L) of nitrate and nitrite was recorded for an ORP value of 129 mV, a similar trend was observed in Figure 4. However, it is worth noting that for ORP values of 35 mV, brewery wastewater recorded slightly high concentration on ammoniacal nitrogen. This is attributed to fact that the reduction in nitrogenous species by simultaneous nitrification and denitrification is favored at ORP values of 118–150 mV. Furthermore, ammoniacal nitrogen exists as ammonium ions in wastewater, the low ORP values with increases in ammoniacal nitrogen concentration suggest that ammoniacal nitrogen exists as a reducing species in brewery wastewater as per the ORP definition. The findings of the current study suggest that ORP cannot only be used as an online brewery wastewater quality monitoring parameter over wet chemistry, but also as a real-time biological reaction (i.e., nitrification–denitrification)-monitoring tool in wastewater treatment processes.
Furthermore, it is worth noting that phosphates in an aqueous environment exist as orthophosphate ion on the basis that it is more thermodynamically stable as compared with any other phosphorus ions [22]. The findings of the study presented in Figure 5 do not explicitly demonstrate any correlation on the recorded ORP values with variation in orthophosphate concentration. Note that relatively high orthophosphate concentrations were recorded despite the significant variation in ORP ranging from −305 to 135 mV. The findings suggest that ORP cannot be effectively used as a real-time brewery wastewater quality monitoring parameter in terms of orthophosphate monitoring.

3.3. Brewery Wastewater Composition

The brewery wastewater treatment plant influent stream composition fluctuates significantly owing to the brewery in-house activities (i.e., washing of malted barley, which is rich in carbohydrates, brewing kettles, yeast fermentation tanks [4,5,6], as well as other beer processing units) and the chemicals utilized. Table 2 presents the summarised averaged concentrations levels of the contaminants observed during the two weeks of monitoring. The high organic strength expressed in terms of COD was found to be ranging from 3447 to 11,813 mg/L, whereas the nutrient strengths measured in terms of orthophosphates and ammoniacal nitrogen were 229–424 PO43− mg/L and 2.21–27.8 NH3-N mg/L, respectively. The high concentration in terms of orthophosphates and ammoniacal nitrogen could be a result of the type of acids used during brewing yeast cleaning, such as phosphoric acid and nitric acid [6].
Additionally, the brewery wastewater influent had high strength of total solids (TS) ranging from 2942 to 14,981 mg/L, with a mean value of 5951 mg/L with a standard deviation of ±3387 mg/L. The fixed volatile solids (FVS) account for a greater proportion of TS than volatile suspended solids (VSS). This suggests that the brewery effluent in this study contained a greater proportion of inorganic particles than organic solids, as the FVS are a component of inorganic matter.
Moreover, when studying Table 2, it is apparent that the ORP recorded a higher SD of ±132. Such a high SD value is attributed to the statistical analysis method that was used in evaluating SD as indicated in Section 2.3. Note that SD was evaluated by reducing the sample size from n to n − 1, on the basis that using a sample size of n would give a biased estimate of ORP values that consistently underestimates the variability. On the other hand, reducing the sample size to n − 1 yields a higher SD, thus resulting in a conservative estimate of variability. The unbiasedness of SD evaluation is not explicitly accounted for in this study; however, reducing the sample size to n − 1 gives a less biased estimate not only for ORP but for all physicochemical parameters reported in Table 2. Furthermore, it is essential to overestimate rather than to underestimate the variability of samples to provide solid data for the design and/or optimization of wastewater treatment processes. Additionally, the high SD values for ORP can be attributed to the recorded low mean of 11.0 mV as a result of the ORP ranging from −305 to 135 mV subsequently resulting in high SD values, as indicated from Equation (2).
The findings of the current study showed to be congruent with previously performed similar work on brewery wastewater, as presented in Table 3.

3.4. Orthophosphate Material Balance

The findings of the study in correlating orthophosphates concentration variation with ORP in brewery wastewater did not yield a conclusive relationship between the variables. Furthermore, to the best of our knowledge, the is no available literature relating orthophosphates concentration in brewery wastewater with ORP. However, there are reported studies on the application of ORP as a real-time tool to monitor biological reactions, as presented in Table 1. Hence, based on the findings of the study on ORP with orthophosphate concentration variation, a laboratory-scale sequencing batch reactor system was then monitored in terms of biological orthophosphates removal for the reported ORP range. Table 4 presents the material balance of the orthophosphate estimated based on the influent stream with orthophosphate of 0.34 PO43− kg/day, microbial take-up of 0.235 PO43− kg/day, and the throughput of 0.105 PO43− kg/day. This resulted in an overall of 69% orthophosphate retained by the sludge and the remaining 31% in the effluent. The results suggest that, for the reported brewery wastewater ORP, the range of −305–135 mV simultaneous orthophosphates release and uptake took place. This is attributed to the fact that, under anaerobic zone, phosphates are released by phosphorus accumulating bacteria at an ORP range from −100 to −225 mV with phosphorus uptake taking place under aerobic zone at an ORP range of 25–250 mV [15]. The results demonstrated that there was a significant orthophosphate reduction between the influent and effluent streams of the reactor. The variation on the orthophosphates removal is attributed to the growth rate of orthophosphates accumulating bacteria which is not explicitly accounted for the current study.

4. Conclusions

In this study, the wastewater of a local South Africa brewery was monitored and characterised to ascertain a robust technological for its treatment. The results showed the brewery wastewater contained high strength of organic and inorganic pollutants and nutrients characterised by total COD, orthophosphates, ammoniacal nitrogen, and total solids. Based on the finding of the current study, it was deduced that the oxygen reduction potential (ORP) varies with brewery wastewater composition. This demonstrated the ORP range of brewery wastewater can permit biological reactions for the biodegradation of the high-strength organic matter as well as the nutrient pollutants. Therefore, ensuring environmental sustainability the rich nutrients in the brewery wastewater can be mitigated via partial nitrification–denitrification technique or anaerobic ammonium oxidation (ANAMMOX) technology. This study’s findings suggest that the brewery wastewater has the potential to be valorised into bioenergy due to its high organic strength via a robust anaerobic technology.

Author Contributions

Conceptualization, S.M.K., B.F.B. and S.R.; methodology, S.M.K. and E.K.T.; validation, S.M.K., B.F.B., S.R. and E.K.T.; formal analysis, S.M.K. and E.K.T.; investigation, S.M.K.; resources, B.F.B. and S.R.; data curation, S.M.K.; writing—original draft preparation, S.M.K.; writing—review and editing, B.F.B., S.R. and E.K.T.; visualization, S.M.K. and E.K.T.; supervision, B.F.B. and S.R.; project administration, S.M.K.; funding acquisition, B.F.B. and S.R. All authors have read and agreed to the published version of the manuscript.

Funding

This research received no external funding.

Institutional Review Board Statement

Not applicable.

Informed Consent Statement

Not applicable.

Data Availability Statement

Not applicable.

Acknowledgments

The authors wish to express their appreciation to the Green Engineering Research Group under the department of chemical engineering at the Durban University of Technology for proving necessary equipment to make this study a success. The authors also wish to express their appreciation to the department of chemical engineering at the Mangosuthu University of Technology for granting access to their well-equipped research laboratory.

Conflicts of Interest

The authors declare no conflict of interest. The funders had no role in the design of the study; in the collection, analyses, or interpretation of data; in the writing of the manuscript, or in the decision to publish the results.

References

  1. Simate, G.S. The treatment of brewery wastewater for reuse by integration of coagulation/flocculation and sedimentation with carbon nanotubes ‘sandwitched’ in a granular filter bed. J. Ind. Eng. Chem. 2015, 21, 1277–1285. [Google Scholar] [CrossRef]
  2. Chen, H.; Chang, S.; Guo, Q.; Hong, Y.; Wu, P. Brewery wastewater treatment using an anaerobic membrane bioreactor. Biochem. J. 2016, 105, 321–331. [Google Scholar] [CrossRef]
  3. Enitan, A.M.; Adeyemo, J.; Kumari, S.; Swalaha, F.M.; Bux, F. Characterization of Brewery Wastewater Composition. Int. J. Environ. Eng. 2015, 9, 1073–1076. [Google Scholar] [CrossRef]
  4. Tetteh, E.K.; Asante-Sackey, D.; Armah, E.K.; Rathilal, S. Tapping wastewater resource: Why and how? In Handbook of Biofuels; Sahay, S., Ed.; Academic Press: Bhopal, India, 2022; pp. 125–146. [Google Scholar]
  5. Kumar, J.A.; Sathish, S.; Krithiga, T.; Praveenkumar, T.R.; Lokesh, S.; Prabu, D.; Renita, A.A.; Prakash, P.; Rajasimman, M. A comprehensive review on bio-hydrogen production from brewery industrial wastewater and its treatment methodologies. Fuel 2022, 319, 123–594. [Google Scholar]
  6. Simpson, W.J.; Hammond, J.R.M. The response of brewing yeasts to acid washing. J. Inst. Brew. 1989, 95, 347–354. [Google Scholar] [CrossRef]
  7. Corsino, S.F.; di Biase, A.; Devlin, T.R.; Munz, G.; Torregrossa, M.; Oleszkiewicz, J.A. Effects of extended famine conditions on aerobic granular sludge stability in the treatment of brewery wastewater. Bioresour. Technol. 2017, 226, 150–157. [Google Scholar] [CrossRef] [PubMed] [Green Version]
  8. Xu, F.; Huang, Z.; Miao, H.; Ren, H.; Zhao, M.; Ruan, W. Identical full-scale biogas-lift reactors (BLRs) with anaerobic granular sludge and residual activated sludge for brewery wastewater treating and kinetic modeling. Res. J. Environ. Sci. 2013, 25, 2031–2040. [Google Scholar]
  9. Goldammer, T. The Brewers’s Handbook; Keen Vision Publishing: Huntsville, AL, USA, 1999. [Google Scholar]
  10. Simate, G.S.; Cluett, J.; Iyuke, S.E.; Musapatika, E.T.; Ndlovu, S.; Walubita, L.F.; Alvarez, A.E. The treatment of brewery wastewater for reuse: State of the art. Desalination 2011, 273, 235–247. [Google Scholar] [CrossRef]
  11. Atalay, S.; Ersöz, G. Novel Catalysts in Advanced Oxidation of Organic Pollutants; Springer International Publishing: New York, NY, USA, 2016; pp. 23–34. [Google Scholar]
  12. Li, B.; Bishop, P.L. Oxidation-Reduction Potential Chnages in Aeration Tanks and Microprofiles of Activated Sludge Floc in Medium and Low-Strength Wastewaters. Water Environ. Res. 2004, 76, 394–403. [Google Scholar] [CrossRef] [PubMed]
  13. Charpentier, J.; Godart, G.; Martin, G.; Mogno, Y. Oxidation-Reduction Potential (ORP) regulation as a way to optimize aeration and C, N and P removal: Experimental basis and various full-scale examples. Water Sci. Technol. 1989, 21, 1209–1223. [Google Scholar] [CrossRef]
  14. Copeland, A.; Lytle, D.A. Measuring the oxidation-reduction potential of important oxidants in drinking water. J. Am. Water Works Assoc. 2014, 106, E10–E20. [Google Scholar] [CrossRef]
  15. Environmental Yellow Springs Instruments. Available online: http://www.ysi.com/media/pdfs/A567-ORP-Management-in-Wastewater-as-an-Indicator-of-Process-Efficiency.pdf (accessed on 1 May 2022).
  16. Chen, K.C.; Chen, C.Y.; Peng, J.W.; Houng, J.Y. Real-time control of an immobilized-cell reactor for wastewater treatment using ORP. Water Res. 2002, 36, 230–238. [Google Scholar] [CrossRef]
  17. Nghiem, L.D.; Manassa, P.; Dawson, M.; Fitzgerald, S.K. Oxidation reduction potential as a parameter to regulate micro-oxygen injection into anaerobic digester for reducing hydrogen sulphide concentration in biogas. Bioresour. Technol. 2014, 173, 443–447. [Google Scholar] [CrossRef] [PubMed] [Green Version]
  18. Yu, R.F.; Chen, H.W.; Cheng, W.P.; Lin, T.Y.J.; Huang, C.L. Monitoring of ORP, pH and DO in heterogeneous Fenton oxidation using nZVI as a catalyst for the treatment of azo-dye textile wastewater. J. Taiwan Inst. Chem. Eng. 2014, 45, 947–954. [Google Scholar] [CrossRef]
  19. Wang, M.; Loccozia, J.; Sun, L.; Lin, C.; Lin, Z. Inorganic-modified semiconductor TiO2 nantotube arrays for photocatalysis. Enegry Environ. Sci. 2014, 7, 2182–2202. [Google Scholar]
  20. Sambaza, S.S.; Maity, A.; Pillay, K. Polyaniline-coated TiO2 nanorods for photocatalytic degradation of bisphenol A in water. ACS Omega 2020, 5, 29642–29656. [Google Scholar] [CrossRef] [PubMed]
  21. APHA. Standard Methods for the Examination of Water and Wastewater; American Public Health Association: Washington, DC, USA, 2005. [Google Scholar]
  22. Kent, R.; Johnson, T.D.; Rosen, M.R. Status and trends of orthophosphate concentrations in groundwater used for public supply in California. Environ. Monit. Assess. 2020, 192, 550. [Google Scholar] [CrossRef] [PubMed]
Figure 1. Schematic representation of a local South African brewery wastewater treatment plant.
Water 14 01604 g001
Figure 2. The ORP versus pH for raw brewery wastewater profile.
Water 14 01604 g002
Figure 3. Nitrate–nitrogen and nitrite–nitrogen (NO3-N + NO2-N) concentration versus ORP.
Water 14 01604 g003
Figure 4. Ammoniacal nitrogen (NH3-N) versus ORP profile.
Water 14 01604 g004
Figure 5. Orthophosphates versus ORP profile.
Water 14 01604 g005
Table 1. Biological reactions and corresponding ORP values [15].
Biological ReactionORP Range (mV)
Nitrification+100 to +350
BOD degradation+50 to +250
Biological phosphorus removal+25 to 250
Denitrification−50 to +50
Biological phosphorus release−100 to −250
Table 2. Results on brewery wastewater characteristics.
ParameterMean ± SDRange
Temperature (°C)31 ± 3.725.3–37
pH6.5 ± 2.44.4–12.2
ORP (mV)13.7 ± 1.4−305–135
Conductivity (µS/cm)2718 ± 10.201893–6017
Turbidity (NTU)570 ± 16.4303–1039
TCOD (mg/L)7687 ± 20.303447–11,813
SCOD (mg/L)6323 ± 15.422287–8627
PCOD (mg/L)1454 ± 91.7127–3693
PO43− (mg/L)343 ± 6.4229–424
NH3-N (mg/L)12.2 ± 7.52.21–27.8
TKN (mg/L)29.3 ± 2.66.24–94.7
Total Nitrogen (mg/L)38.6 ± 2.913.7–106
NO3-N + NO2-N (mg/L)10 ± 1.12.87–49.4
Total Organic Nitrogen (mg/L)8.92 ± 11.10–39.1
Total Inorganic Nitrogen (mg/L)34.4 ± 2.27.78–93
Total solids (mg/L)5951 ± 33.92942–14,981
Total Dissolved Solids (mg/L)4121 ± 15.032198–7400
Fixed VS (mg/L)2327 ± 11.2825–4975
Volatile Suspended Solids (mg/L)1799 ± 57.11043–2572
Table 3. Comparing the present study with previously performed similar work on brewery wastewater.
ParameterPresent Study[17][18]
Temperature (°C)25.3–3724–30.525–35
pH4.4–12.24.6–7.33.3–6.3
ORP (mV)−305–135------
Conductivity (µS/cm)1893–60171.044–1.622---
Turbidity (NTU)303–1039------
TCOD (mg/L)3447–11,8131096–89268240–20,000
SCOD (mg/L)2287–86271178–5847---
PCOD (mg/L)127–3693------
PO43− (mg/L)229–4247.51–74.116–124
NH3-N (mg/L)2.21–27.80.48–13.1---
TKN (mg/L)6.24–94.7------
Total Nitrogen (mg/L)13.7–106---0.0196–0.0336
NO3-N + NO2-N (mg/L)2.87–49.41.14–11.6---
Total Organic Nitrogen (mg/L)0–39.10–5.36---
Total Inorganic Nitrogen (mg/L)7.78–93------
Total Organic Nitrogen (mg/L)2942–14,9811289–12,2485100–8750
Total Inorganic Nitrogen (mg/L)2198–7400---2020–5940
Total solids (mg/L)825–4975------
Total Dissolved Solids (mg/L)1043–2572804–1278---
Table 4. Orthophosphates material balance.
Batch NoSBR Influent (g/d)SBR Consumption (g/d)SBR Effluent (g/d)SBR Removal Efficiency (%)
10.2750.0910.18433
20.3170.1300.18741
30.2350.1690.06672
40.2290.1690.06074
50.2850.2250.05579
60.2740.2190.07380
70.3480.2750.24779
80.3980.1510.14838
90.3080.1600.06652
100.3650.2990.09382
110.4050.3120.05477
120.2590.2050.06179
130.3230.2620.08981
140.3720.2830.18776
150.4240.2370.13356
160.3690.2360.11864
170.4230.3050.11872
180.3960.3170.07980
190.3920.3060.08678
200.4030.3260.07781
Publisher’s Note: MDPI stays neutral with regard to jurisdictional claims in published maps and institutional affiliations.

