
Analysis of Spatiotemporal Heterogeneity of Glacier Mass Balance on the Northern and Southern Slopes of the Central Tianshan Mountains, China

 ,
,
Abstract
:1. Introduction
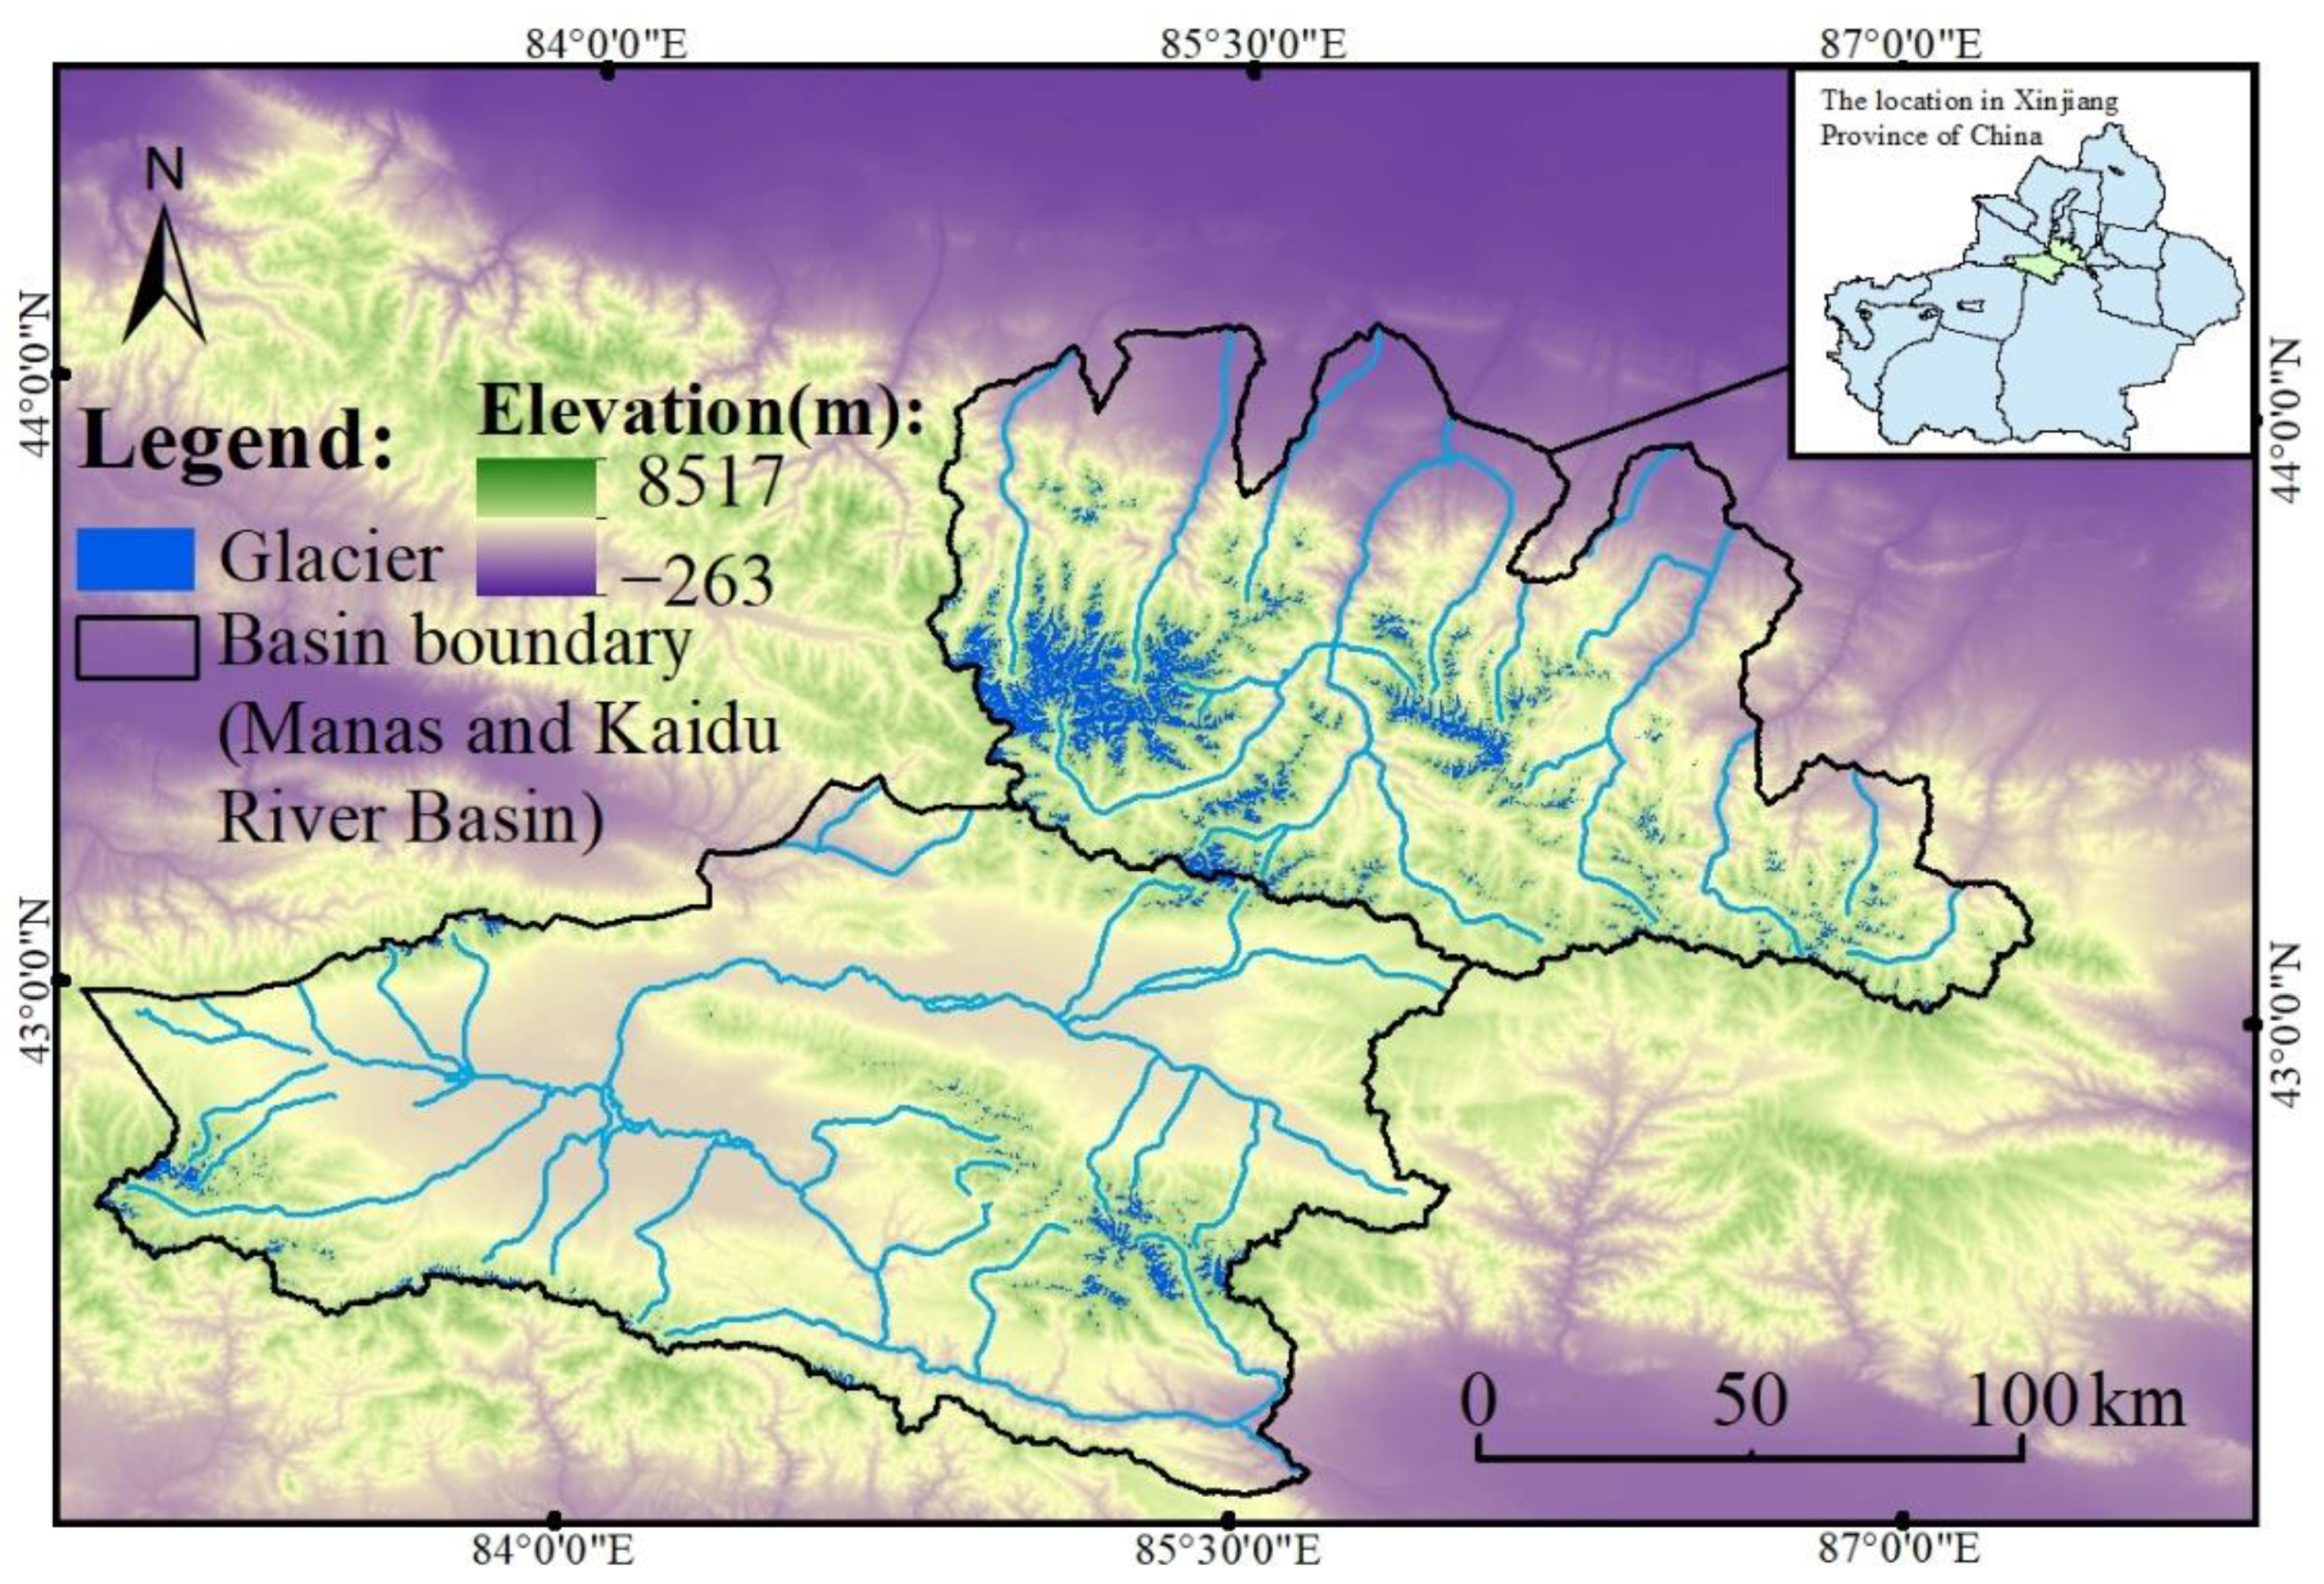
2. Study Area
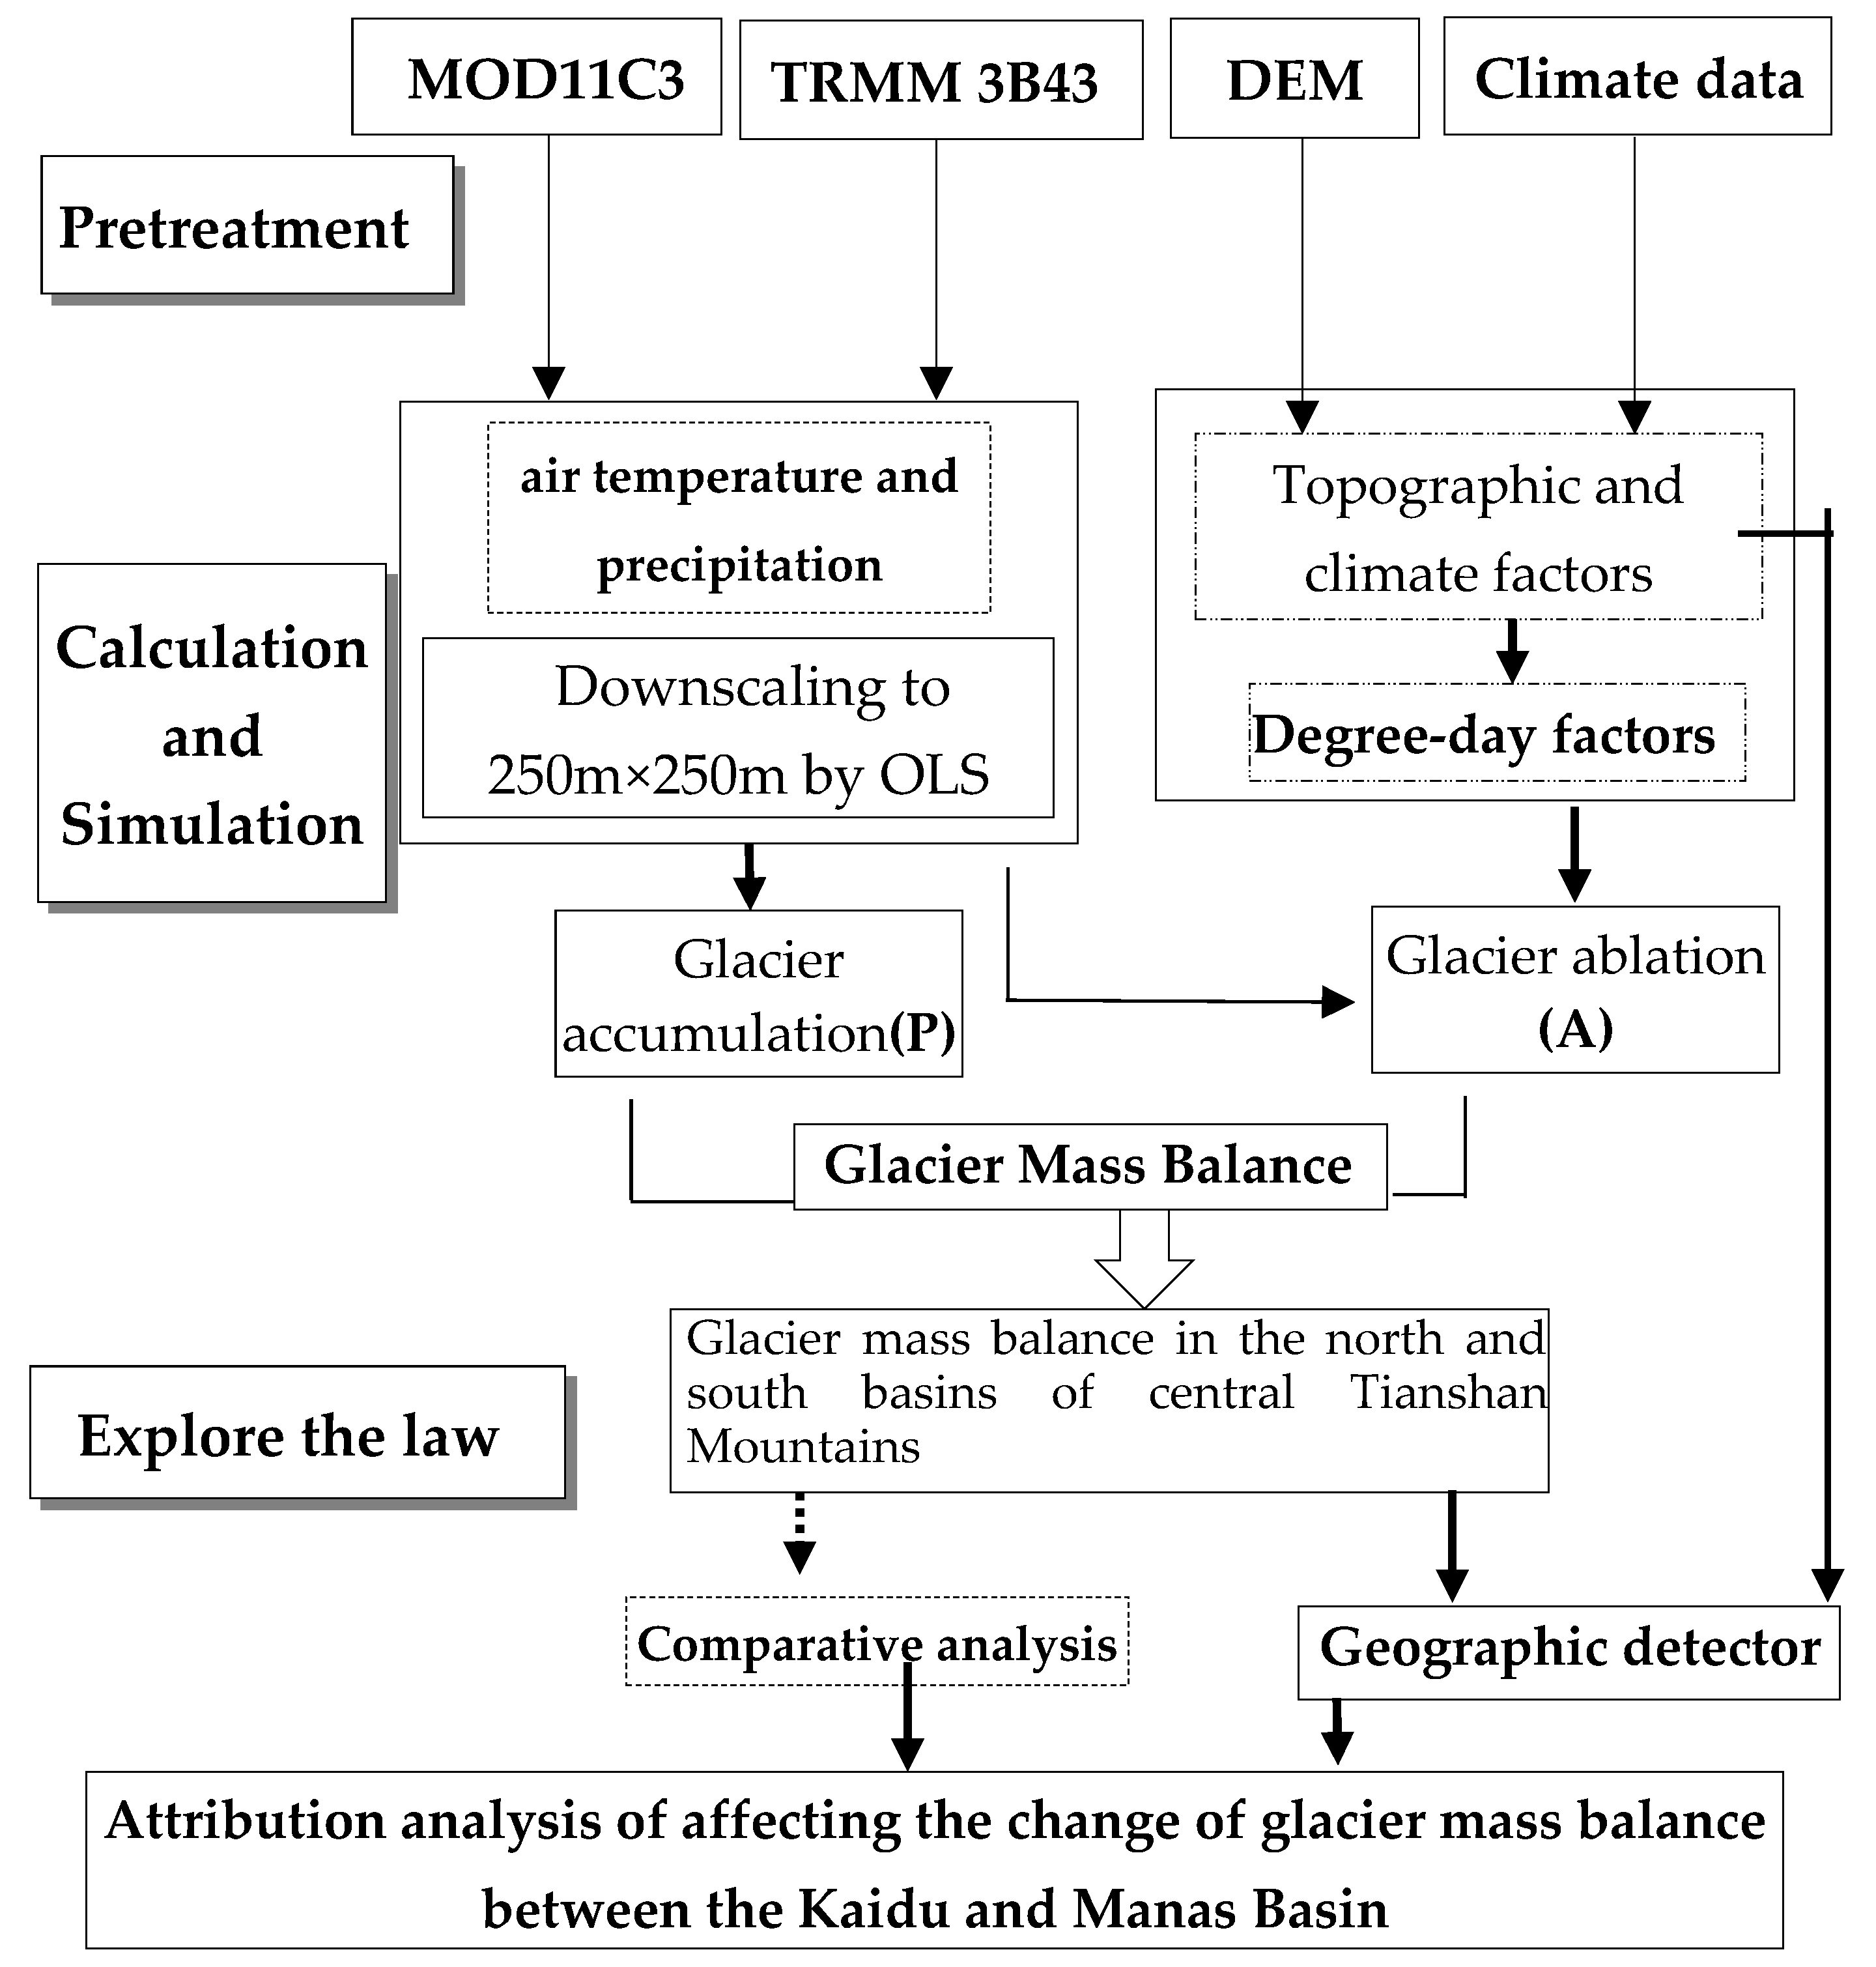
3. Data and Methods
3.1. Simulated Glacier Mass Balance
3.2. Attribution of Glacier Mass Balance Change
4. Results
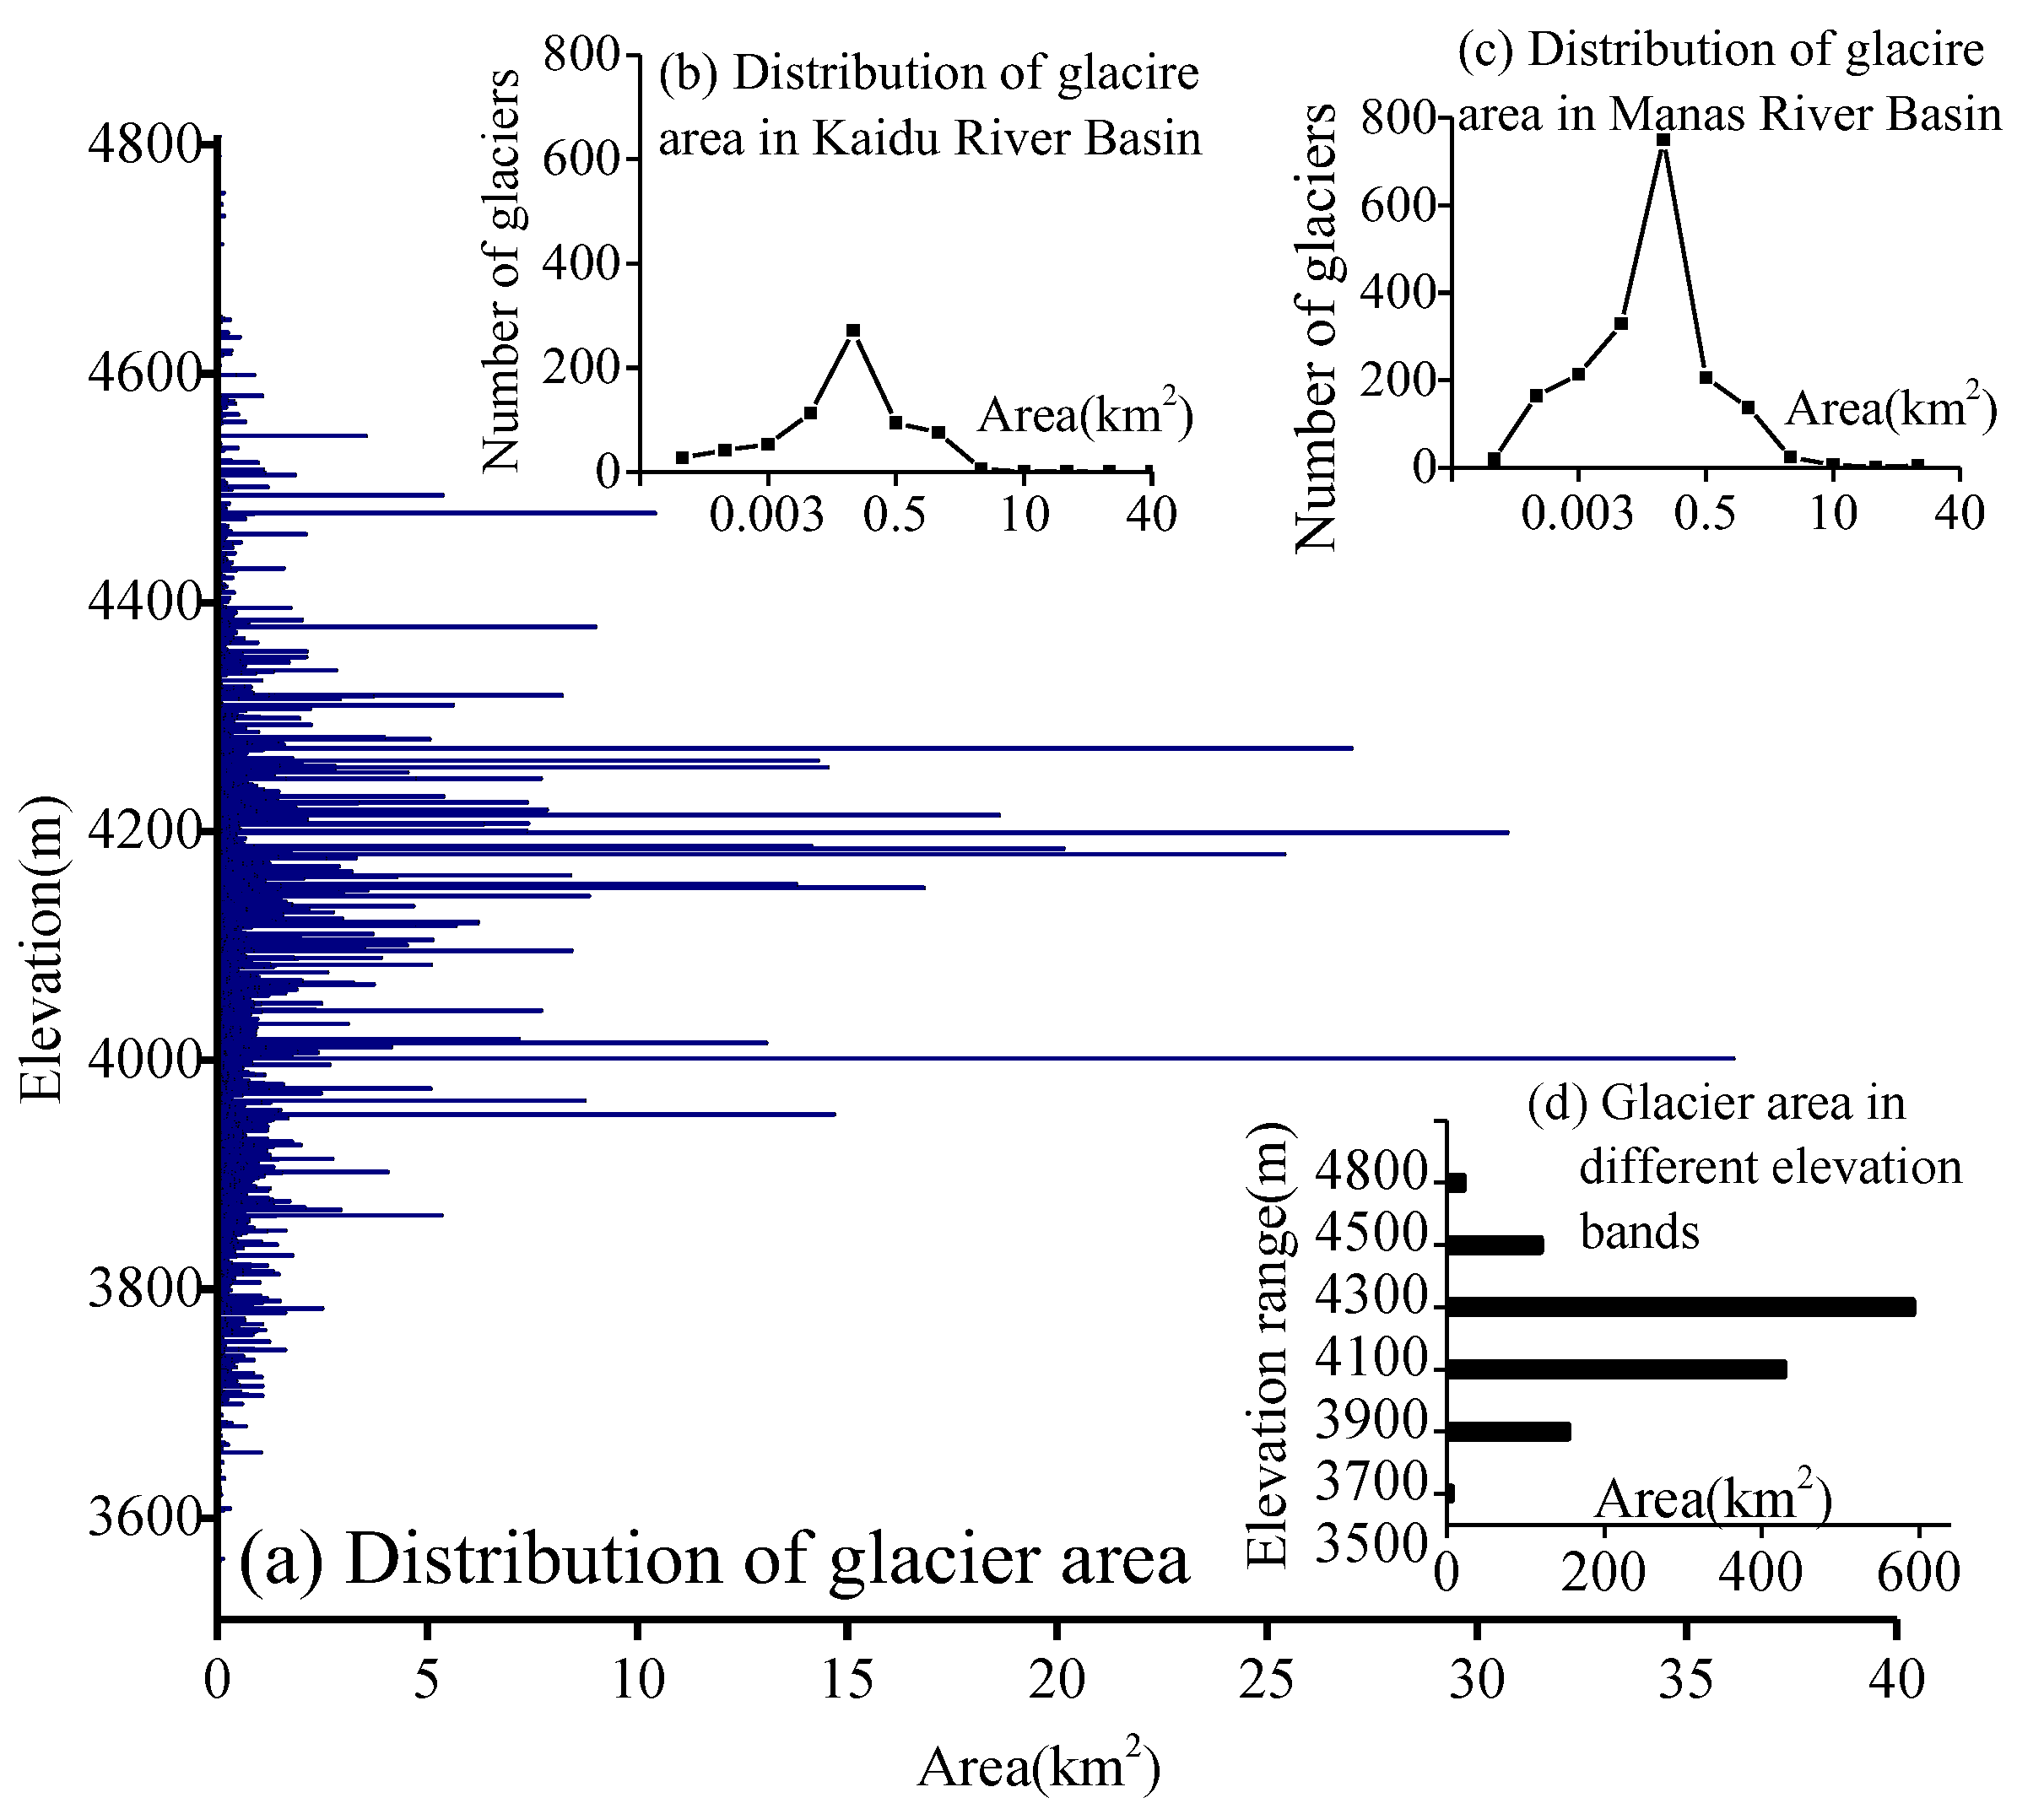
4.1. Analysis of Glacier Area in the Central Tianshan Mountains
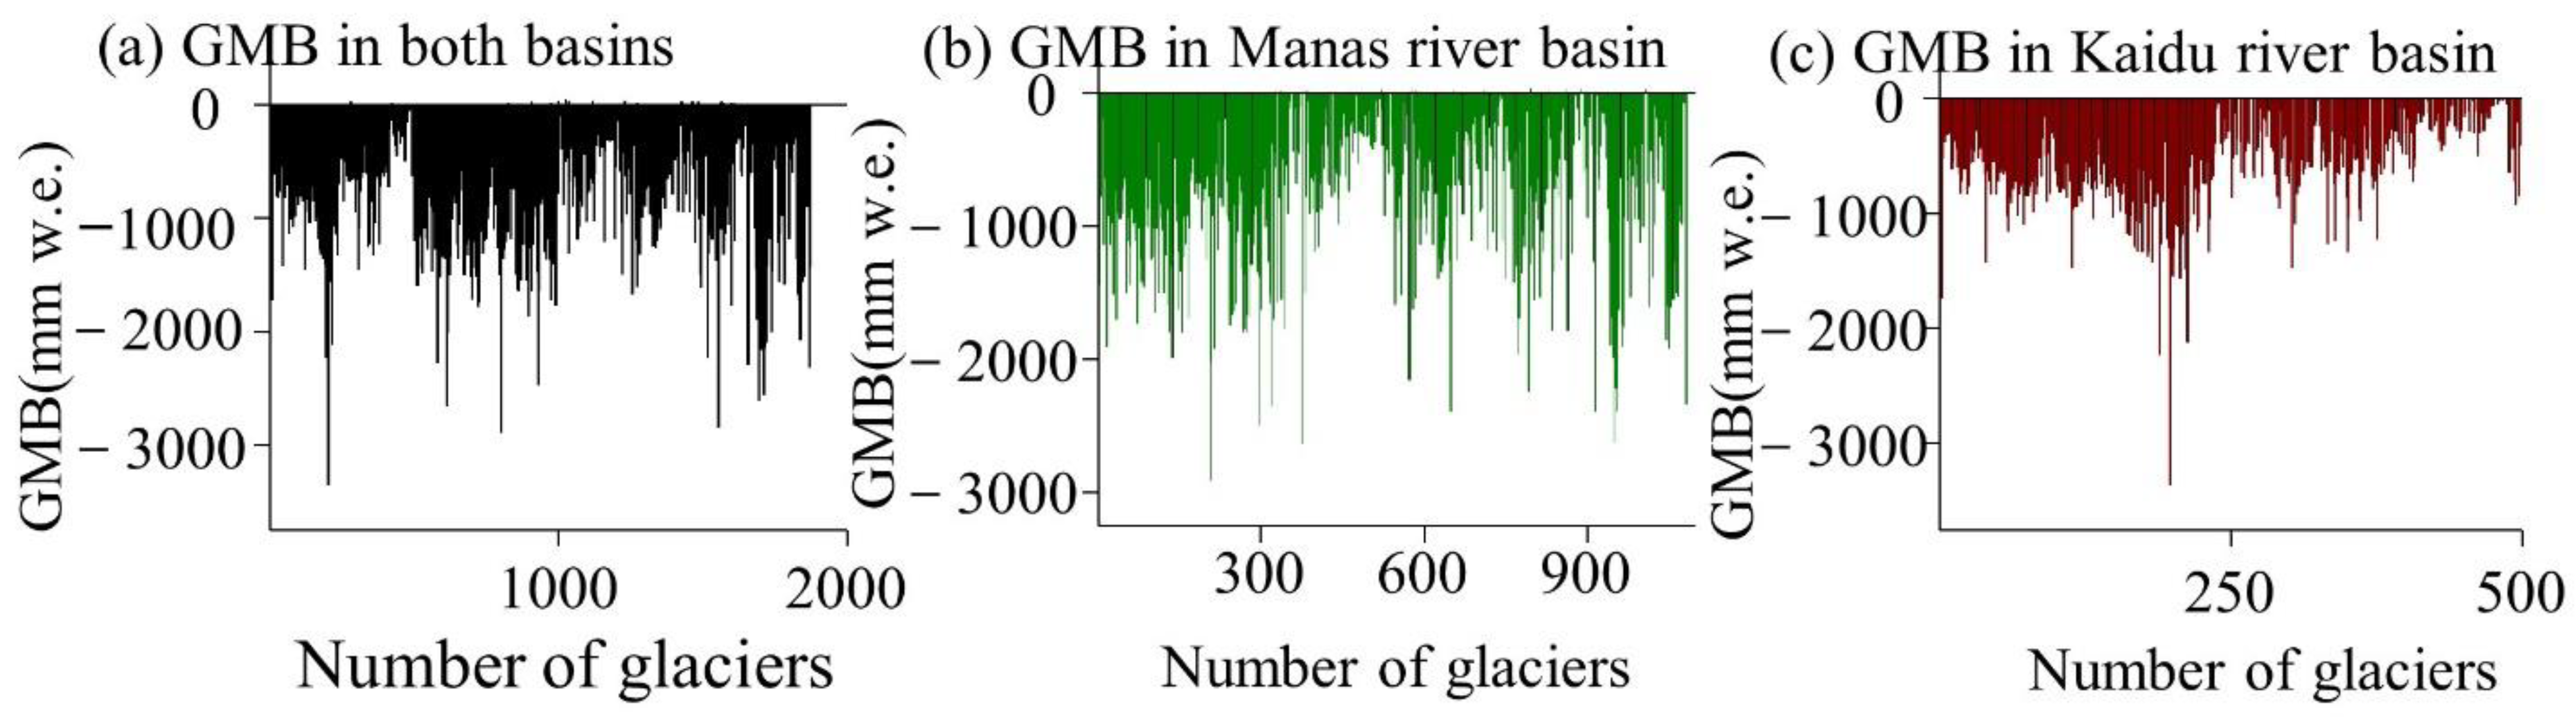
4.2. Comparison of Glacier Mass Balance between Both Basins in the Central Tianshan Mountains
4.3. The Attribution of Glacier Mass Balance Change in the North–South Slope Basin in the Central Tianshan Mountains
5. Discussion
5.1. Contribution Analysis of Influencing Factors Based on Positive and Negative Mass Balance Area
5.2. Attribution Comparison of Both Basins Based on Positive and Negative Balance Area
6. Conclusions
- (1)
- In terms of glacier distribution, the glaciers in both basins are mainly distributed in the altitude range of 3500–4800 m. Most glaciers are distributed in 3900–4300 m, and the total area in this altitude range accounts for 85.71%. Due to the altitude and mountain trend, the glaciers in Kaidu are mainly concentrated in the southwest and northeast, which are mainly concentrated in the south of Manas. In terms of glacier scale, the number of less than 1 km2 glaciers is the most, and the number of glaciers over 10 km2 is rare; in terms of glacier quantity and scale, the Manas river basin is more than the Kaidu river basin.
- (2)
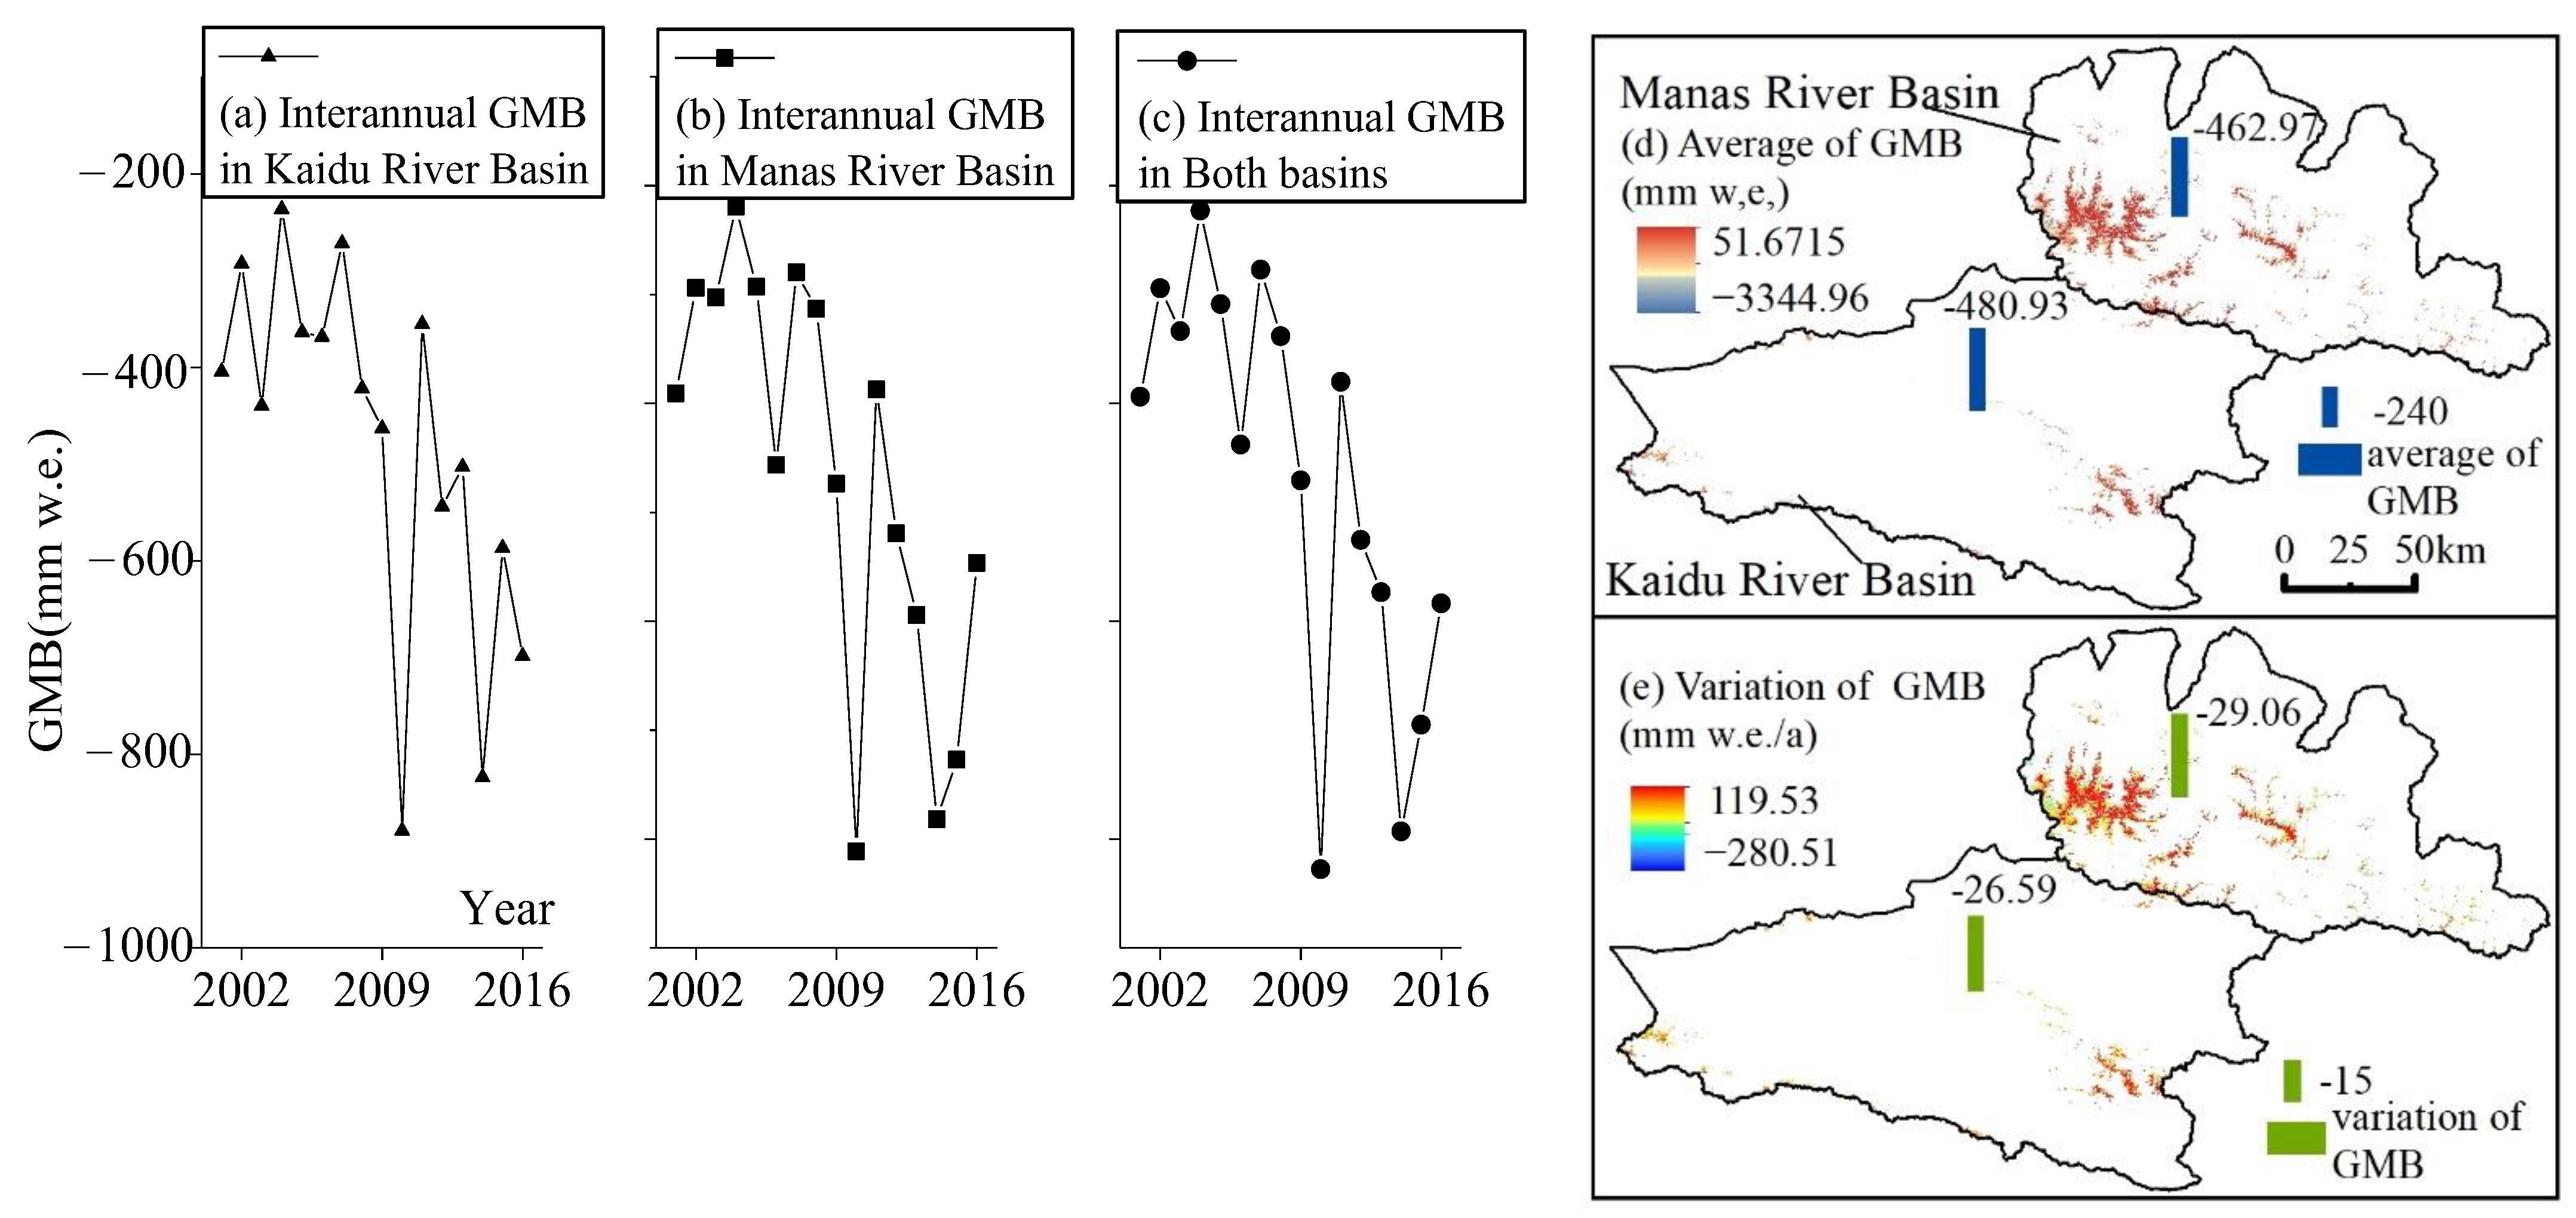
- During the study period, the glaciers in both basins were continuously melting. They were in negative balance (−465.95 mm w.e.), and the interannual change rate was −28.36 mm w.e./a. among them, the glacier melting was the most obvious in 2010. The melting trend can be divided into two stages: the persistence increased from 2000 to 2010a, and the volatility decreased from 2010 to 2016a. Compared with both basins, the amount of glacier melting in Kaidu is 3.79% higher than that in Manas, but the change rate of glacier mass balance in Manas (−28.85 mm w.e./a) is slightly higher than that in Kaidu (−26.34 mm w.e./a).
- (3)
- In the attribution of mass balance, the factors affecting glacier mass balance can be divided into climate and topography. The total contribution rate of topographic factors is 44.87%, which is slightly lower than that of climatic factors (51.27%). Therefore, climatic factors are still the dominant factors affecting the difference in glacier mass balance between both basins; however, in Kaidu, the contribution rate of climatic factors is nearly 20% higher than that of topographic factors. The contribution rate of climate factors in Manas is only 7.3% higher, so the change of glacier mass balance in Kaidu is more driven by climate factors, while the glacier mass balance in Manas is more affected by the combination of climate and topographic factors.
- (4)
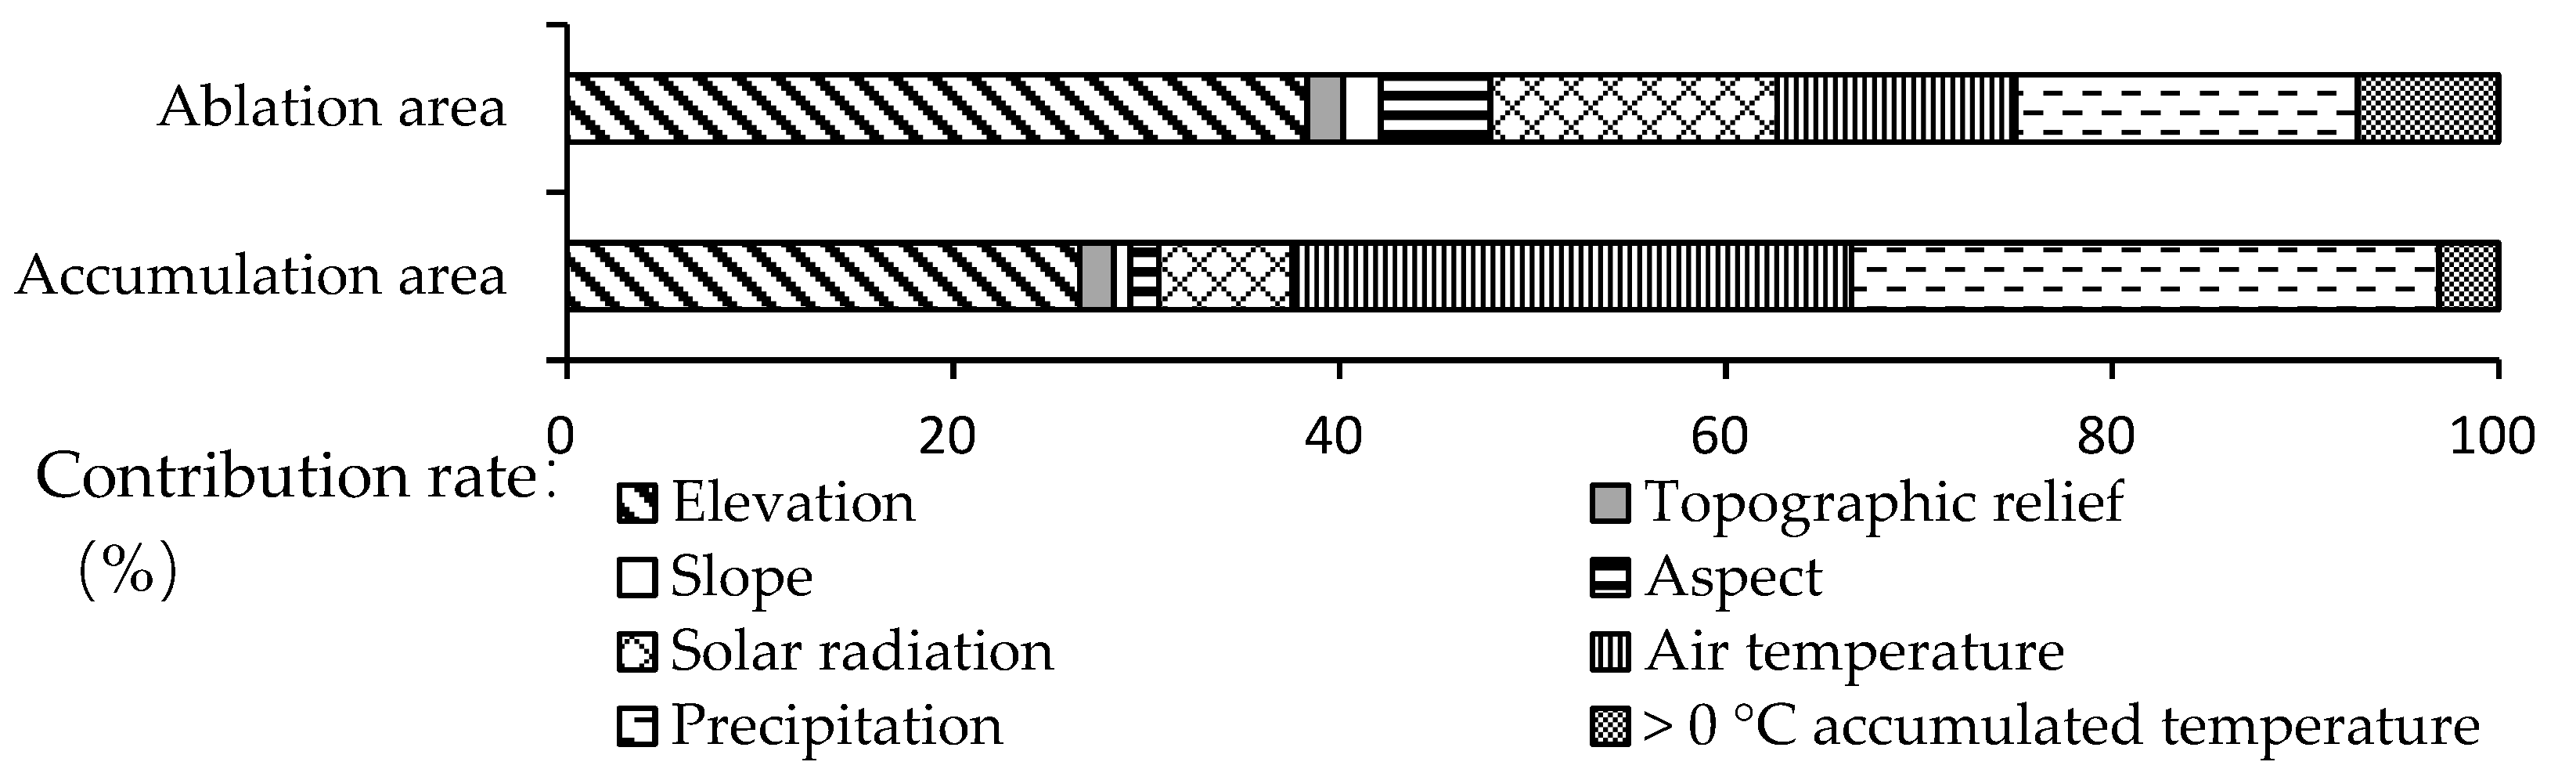
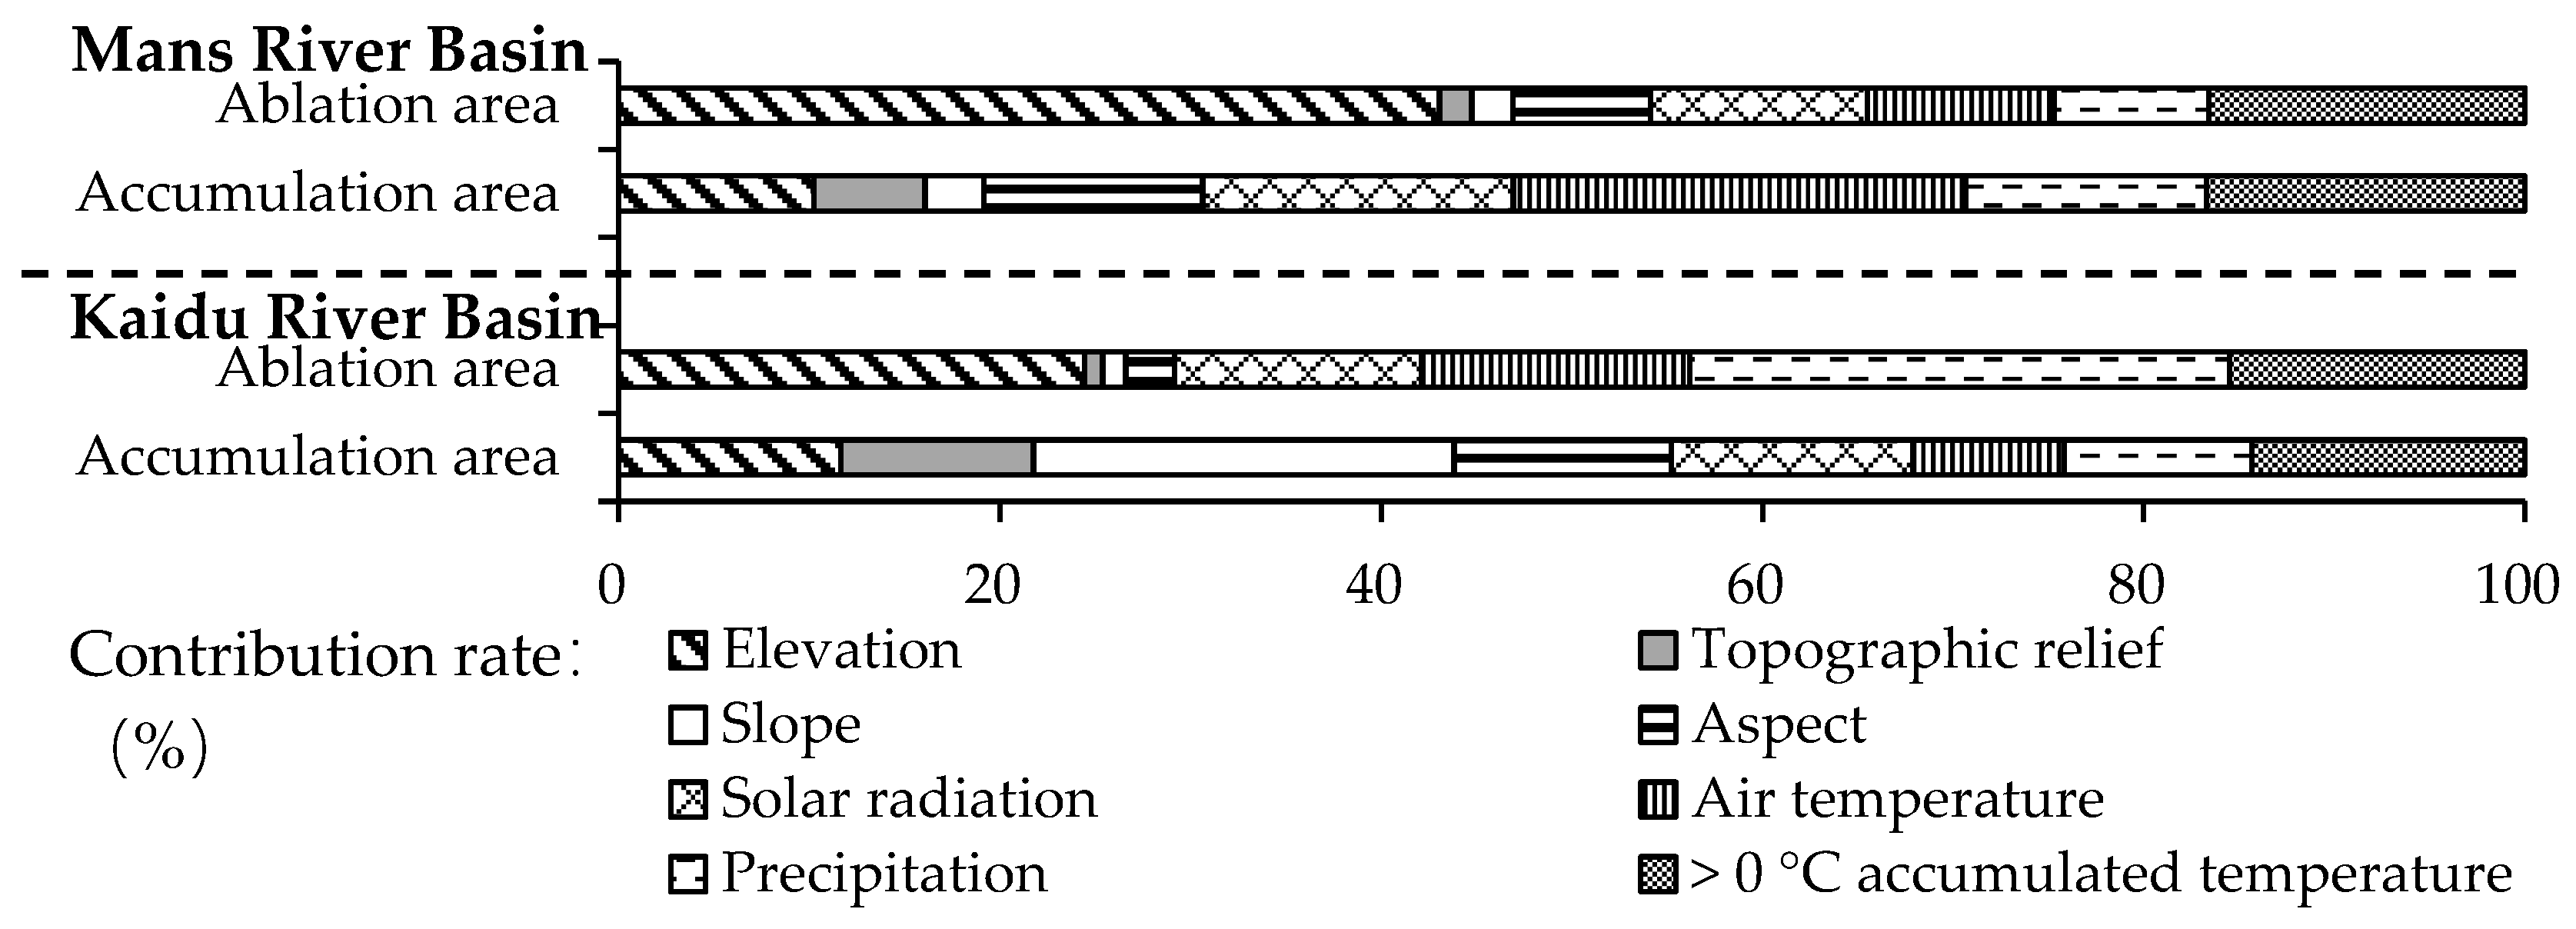
- The factors affecting the positive/negative mass balance of glaciers in both basins are dominated by climate factors (69.37%, 52.2%). Still, the contribution gap between climate and terrain factors in the ablation area is smaller. In terms of accumulation area, the positive mass balance in Kaidu is dominated by topographic factors (55.2%), while that in Manas is dominated by climatic factors (69.37%). For the ablation area, climate factors are dominated in Kaidu (70.85%), and topographic factors are dominated in Manas (54.11%). The driving forces of climate and terrain factors and the different coupling modes lead to the spatiotemporal heterogeneity of glacier mass balance in the north and south slope basins in the central Tianshan Mountain.
Author Contributions
Funding
Data Availability Statement
Acknowledgments
Conflicts of Interest
References
- Garg, V.; Kudekar, A.R.; Thakur, P.K.; Nikam, B.R.; Aggarwal, S.P.; Chauhan, P. Glacier Change Studies under Changing Climate Using Geospatial Tools and Techniques. J. Indian Soc. Remote Sens. 2021, 49, 2387–2406. [Google Scholar] [CrossRef]
- Xingran, C.; Zhongqin, L.; Hui, Z.; Chunhai, X. Vulnerability of glacier change in the Tianshan Mountains region of China. J. Geogr. Sci. 2021, 31, 1469–1489. [Google Scholar]
- Shugar, D.H.; Jacquemart, M.; Shean, D.; Bhushan, S.; Westoby, M.J.J.S. A massive rock and ice avalanche caused the 2021 disaster at Chamoli, Indian Himalaya. Science 2021, 373, eabh4455. [Google Scholar] [CrossRef] [PubMed]
- Xingran, C.; Chunhai, X.; Zhongqin, L. Glacier changes and its effect on water resources in the upper reaches of Aksu River, Tien Shan, China, from 1989 to 2016. Arab. J. Geosci. 2022, 15, 1–11. [Google Scholar]
- Liu, Q.; Liu, S.J.C.D. Response of glacier mass balance to climate change in the Tianshan Mountains during the second half of the twentieth century. Clim. Dyn. 2016, 46, 303–316. [Google Scholar] [CrossRef]
- Braithwaite, R.J.; Hughes, P.D. Regional Geography of Glacier Mass Balance Variability Over Seven Decades 1946–2015. Front. Earth Sci. 2020, 8, 302. [Google Scholar] [CrossRef]
- Duan, K.; Yao, T.; Wang, N.; Liu, H. Numerical simulation of Urumqi Glacier No. 1 in the eastern Tianshan, central Asia from 2005 to 2070. Chin. Sci. Bull. 2012, 57, 4505–4509. [Google Scholar] [CrossRef] [Green Version]
- Xu, C.; Li, Z.; Wang, P.; Anjum, M.N.; Li, H.; Wang, F. Detailed comparison of glaciological and geodetic mass balances for Urumqi Glacier No.1, eastern Tien Shan, China, from 1981 to 2015. Cold Reg. Sci. Technol. 2018, 155, 137–148. [Google Scholar] [CrossRef]
- Guining, Z.; Zhengyong, Z.; Lin, L.; Zhongqin, L.; Puyu, W.; Liping, X. Simulation and construction of the glacier mass balance in the Manas River Basin, Tianshan, China from 2000 to 2016. J. Geogr. Sci. 2020, 30, 988–1004. [Google Scholar]
- Kenzhebaev, R.; Barandun, M.; Kronenberg, M.; Chen, Y.; Usubaliev, R.; Hoelzle, M. Mass balance observations and reconstruction for Batysh Sook Glacier, Tien Shan, from 2004 to 2016. Cold Reg. Sci. Technol. 2017, 135, 76–89. [Google Scholar] [CrossRef] [Green Version]
- Wang, P.; Li, Z.; Li, H.; Wang, W.; Yao, H. Comparison of glaciological and geodetic mass balance at Urumqi Glacier No. 1, Tian Shan, Central Asia. Glob. Planet. Change 2014, 114, 14–22. [Google Scholar] [CrossRef]
- Bhattacharya, A.; Muhuri, A.; De, S.; Manickam, S.; Frery, A.C. Data on Earth Observations and Remote Sensing Reported by Researchers at Federal University (Modifying the Yamaguchi Four-Component Decomposition Scattering Powers Using a Stochastic Distance). IEEE J. Sel. Top. Appl. Earth Obs. Remote Sens. 2015, 8, 3497–3506. [Google Scholar]
- Ridha, T. Target Scattering Decomposition in Terms of Roll-Invariant Target Parameters. IEEE Trans. Geosci. Remote Sens. 2007, 45, 73–84. [Google Scholar]
- Muhuri, A.; Manickam, S.; Bhattacharya, A. Scattering Mechanism Based Snow Cover Mapping Using RADARSAT-2 C-Band Polarimetric SAR Data. IEEE J. Sel. Top. Appl. Earth Obs. Remote Sens. 2017, 10, 3213–3224. [Google Scholar] [CrossRef]
- Reeh, N.J.P. Parameterization of melt rate and surface temperature on the Greenland ice sheet. Polarforschung 1991, 5913, 113–128. [Google Scholar]
- Jóhannesson, T.; Sigurdsson, O.; Laumann, T.; Kennett, M. Degree-day glacier mass-balance modelling with applications to glaciers in Iceland, Norway and Greenland. J. Glaciol. 2017, 41, 345–358. [Google Scholar] [CrossRef] [Green Version]
- Yuhuan, C.; Baisheng, Y.; Jie, W.; Youcun, L. Influence of Degree-Day Factor Variation on the Mass Balance of Glacier No. 1 at the Headwaters of ürümqi River, China. J. Earth Sci. 2013, 24, 1008–1022. [Google Scholar]
- Lihua, W.; Huilin, L.; Lin, W. Application of a Degree-Day Model for Determination of Mass Balance of Urumqi Glacier No. 1, Eastern Tianshan, China. J. Earth Sci. 2011, 22, 470–481. [Google Scholar]
- Baumann, S. Comparison of Glacier Mass Balance Data in the Tien Shan and Pamir, Central Asia. Arct. Antarct. Alp. Res. 2017, 49, 133–146. [Google Scholar] [CrossRef]
- Wang, P.; Li, Z.; Li, H.; Yao, H.; Xu, C.; Zhou, P.; Jin, S.; Wang, W. Analyses of recent observations of Urumqi Glacier No. 1, Chinese Tianshan Mountains. Environ. Earth Sci. 2016, 75, 720. [Google Scholar] [CrossRef]
- Xu, M.; Wu, H.; Kang, S. Impacts of climate change on the discharge and glacier mass balance of the different glacierized watersheds in the Tianshan Mountains, Central Asia. Hydrol. Processes 2018, 32, 126–145. [Google Scholar] [CrossRef]
- Yanjun, C.; Mingjun, Z.; Zhongqin, L.; Yanqiang, W.; Zhuotong, N.; Huilin, L.; Shengjie, W.; Bo, S. Energy balance model of mass balance and its sensitivity to meteorological variability on Urumqi River Glacier No.1 in the Chinese Tien Shan. Sci. Rep. 2019, 9, 13958. [Google Scholar]
- Zhang, Z.; Liu, L.; He, X.; Li, Z.; Wang, P. Evaluation on glaciers ecological services value in the Tianshan Mountains, Northwest China. J. Geogr. Sci. 2019, 29, 101–114. [Google Scholar] [CrossRef] [Green Version]
- Tongxia, W.; Zhengyong, Z.; Lin, L.; Zhongqin, L.; Puyu, W.; Liping, X.; Guining, Z.; Hao, T.; Ziwei, K.; Hongjin, C.; et al. Simulation of the Potential Distribution of the Glacier Based on Maximum Entropy Model in the Tianshan Mountains, China. Water 2021, 13, 1541. [Google Scholar]
- Ren, L.; Xue, L.-Q.; Liu, Y.-H.; Shi, J.; Han, Q.; Yi, P.-F. Study on Variations in Climatic Variables and Their Influence on Runoff in the Manas River Basin, China. Water 2017, 9, 258. [Google Scholar] [CrossRef] [Green Version]
- Zhang, F.; Bai, L.; Li, L.; Wang, Q. Sensitivity of runoff to climatic variability in the northern and southern slopes of the Middle Tianshan Mountains, China. J. Arid. Land 2016, 8, 681–693. [Google Scholar] [CrossRef] [Green Version]
- Davide, F.; Veronica, M.; Antonella, S.; Guglielmina, D.; Maurizio, M. Snow Cover Variability in the Greater Alpine Region in the MODIS Era (2000–2019). Remote Sens. 2021, 13, 2945. [Google Scholar]
- Yaping, C.; Yongjian, D.; Qiudong, Z.; Shiqiang, Z. A Comprehensive Evaluation of 4-Parameter Diurnal Temperature Cycle Models with In Situ and MODIS LST over Alpine Meadows in the Tibetan Plateau. Remote Sens. 2019, 12, 103. [Google Scholar]
- Zhao, W.; He, J.; Wu, Y.; Xiong, D.; Wen, F.; Li, A. An Analysis of Land Surface Temperature Trends in the Central Himalayan Region Based on MODIS Products. Remote Sens. 2019, 11, 900. [Google Scholar] [CrossRef] [Green Version]
- Shukla, A.K.; Ojha, C.S.P.; Singh, R.P.; Pal, L.; Fu, D. Evaluation of TRMM Precipitation Dataset over Himalayan Catchment: The Upper Ganga Basin, India. Water 2019, 11, 613. [Google Scholar] [CrossRef] [Green Version]
- Xiao, P.; Yunfei, F.; Sen, Y.; Ying, G.; Deqin, L. Diurnal Variations of Precipitation over the Steep Slopes of the Himalayas Observed by TRMM PR and VIRS. Adv. Atmos. Sci. 2021, 38, 641–660. [Google Scholar]
- Luo, Y. The mass balances modeling and the relationship with meteorological parameters GlaciersinTianshan. Master Thesis, Northwest Normal University, Lanzhou, China, 2012. [Google Scholar]
- Yong, Z.; Shiyin, L.; Yongjian, L.; Jing, L.; Donghui, S.G. Preliminary Study of Mass Balance on the Keqicar BaxiGlacier on the South Slopes of Tianshan Mountains. J. Glaciol. Geocryol. 2006, 28, 477–484. [Google Scholar]
- Braithwaite, R.J.; Zhang, Y.; Raper, S.C.B. Temperature sensitivity of the mass balance of mountain glaciers and ice caps as a climatological characteristic. Z. Für Gletsch. Und Glazialgeol. 2002, 38, 35–61. [Google Scholar]
- Braithwaite, R.J.; Glaciology, O.O.J.J.o. Seasonal variation of ice ablation at the margin of the Greenland ice sheet and its sensitivity to climate change, Qamanrssp sermia, West Greenland. J. Glaciol. 1993, 39, 267–274. [Google Scholar] [CrossRef] [Green Version]
- Kang, E.; Cheng, G.; Lan, Y.; Jin, H.S. A model for simulating the response of runoff from the mountainous watersheds of inland river basins in the arid area of northwest China to climatic changes. Sci. China Ser. D Earth Sci. 1999, 42, 52–63. [Google Scholar] [CrossRef]
- Wang, G.; Peng, W. Quantifying spatiotemporal dynamics of vegetation and its differentiation mechanism based on geographical detector. Environ. Sci. Pollut. Res. 2022, 29, 32016–32031. [Google Scholar] [CrossRef]
- Jinfeng, W.; Chengdong, X. Geodetector: Principle and prospective. Acta Geogr. Sin. 2017, 72, 116–134. [Google Scholar]
- Arindam, C.; Chand, S.M.; Sunil, K.D.; Manasi, D. Glacier changes in the Chhombo Chhu Watershed of the Tista basin between 1975 and 2018, the Sikkim Himalaya, India. Earth Syst. Sci. Data. 2021, 13, 2923–2944. [Google Scholar]
- Jing, H.; Ninglian, W.; An’an, C.; Xuewen, Y.; Ting, H. Glacier Changes in the Qilian Mountains, Northwest China, between the 1960s and 2015. Water 2019, 11, 623. [Google Scholar]
- Zhang, Q.; Chen, Y.; Li, Z.; Li, Y.; Xiang, Y.; Bian, W. Glacier changes from 1975 to 2016 in the Aksu River Basin, Central Tianshan Mountains. J. Geogr. Sci. 2019, 29, 984–1000. [Google Scholar] [CrossRef] [Green Version]
- Yajuan, C.; Junping, Y. A comparison on characteristics of climate change in the north and south of Tianshan Mountain. J. Arid. Land Resour. Environ. 2011, 25, 92–96. [Google Scholar] [CrossRef]
- Hongzheng, P.; Tianding, H.; Peng, C.; Xiangying, L.; Keqin, J. Characteristics of Air Temperature in the Southern and Northern Slopes of Tianshan Mountains. Plateau Meteorol. 2015, 34, 753–761. [Google Scholar]
- Zhang, X.; Liu, L.; Zhang, Z.; Kang, Z.; Tian, H.; Wang, T.; Chen, H. Spatial and Temporal Variation Characteristics of Glacier Resources in Xinjiang over the Past 50 Years. Water 2022, 14, 1057. [Google Scholar] [CrossRef]
- Wucheng, X.; Zhongqin, L.; Hui, Z.; Mingjun, Z.; Pengbin, L.; Jianxin, M. Spatial-temporal variation of glacier resources in Chinese Tianshan Mountains since 1959. Acta Geogr. Sin. 2017, 72, 1594–1605. [Google Scholar]
- Xiaohui, Y.; Jingdong, Z.; Hui, H. Study on glacier mass balance in the Karlik Range, East Tianshan Mountains, 1972–2016. J. Glaciol. Geocryol. 2019, 41, 1–11. [Google Scholar]
- Ninglian, W.; Tandong, Y.; Baiqing, X.; Anan, C.; Weicai, W. Spatiotemporal Pattern, Trend, and Influence of Glacier Change in Tibetan Plateau and Surroundings under Global Warming. Bull. Chin. Acad. Sci. 2019, 34, 1220–1232. [Google Scholar] [CrossRef]
- Puyu, W.; Zhongqin, L.; Huilin, L.; Lihua, W.; Shuang, J.; Ping, Z. Changes of Ice-thickness and Volume for Representative Glaciers in ’Tianshan Mountains in the Past 50 Years. Acta Geogr. Sin. 2012, 67, 929–940. [Google Scholar]
- Yanjun, C.; Mingjun, Z.; Zhongqin, L.; Shuang, J.; Wenbin, W.; Shengjie, W. Understanding the mass balance characteristics of Qingbingtan Glacier No.72 during the period of 2008–2014. J. Glaciol. Geocryol. 2020, 42, 318–331. [Google Scholar]
- Chaturvedi, R.K.; Kulkarni, A.; Karyakarte, Y.; Joshi, J.; Bala, G. Glacial mass balance changes in the Karakoram and Himalaya based on CMIP5 multi-model climate projections. Clim. Change 2014, 123, 315–328. [Google Scholar] [CrossRef]
- Colucci, R.R.; Filippo, G.; Csaba, T. Unprecedented heat wave in December 2015 and potential for winter glacier ablation in the eastern Alps. Sci. Rep. 2017, 7, 7090. [Google Scholar] [CrossRef]
- Yulan, Z.; Tanguang, G.; Shichang, K.; Donghui, S.; Xi, L. Albedo reduction as an important driver for glacier melting in Tibetan Plateau and its surrounding areas. Earth-Sci. Rev. 2021, 220, 103735. [Google Scholar]
- Yongpeng, G.; Xiaojun, Y.; Shiyin, L.; Miaomiao, Q.; Hongyu, D.; Juan, L.; Dahong, Z. Spatial-temporal variation of glacier resources in the Hexi interior from 1956 to 2017. J. Glaciol. Geocryol. 2019, 41, 1313–1325. [Google Scholar]
- Wuchao, Y. Runoff Characteristics, Attribution Analysis and Futureprediction of the Cold and Arid Regions: A Case Study of Headwater of the Manas. Master Thesis, Northwest A&F University, XianYang, China, 2021. [Google Scholar]
- Yanlong, G. Changes of Global Climate Landscape Pattern and lts Impact on Surface Water Resource in Qinghai-Tibet Plateau. Doctor Thesis, North China Electric Power University, Beijing, China, 2021. [Google Scholar]
- Zongli, J.; Lei, W.; Zhen, Z.; Shiyin, L.; Yong, Z.; Zhiguang, T.; Junfeng, W.; Danni, H.; Shasha, Z. Surface elevation changes of Yengisogat Glacier between 2000 and 2014. Arid. Land Geogr. 2020, 43, 12–19. [Google Scholar]
- Li, Z.; Shi, X.; Tang, Q.; Zhang, Y.; Gao, H.; Pan, X.; Déry, S.J.; Zhou, P. Partitioning the contributions of glacier melt and precipitation to the 1971–2010 runoff increases in a headwater basin of the Tarim River. J. Hydrol. 2020, 583, 124579. [Google Scholar] [CrossRef]
- Megumi, W.; Aki, Y.; Yukiko, H.; Satoshi, W.; Akiko, S.; Shinjiro, K. Uncertainty from climate forcing of projections in glacier melt for high mountain asia. J. Jpn. Soc. Civ. Eng. Ser. B1 2018, 74. [Google Scholar]
- Wang, J.; Chen, X.; Liu, J.; Hu, Q. Changes of Precipitation-Runoff Relationship Induced by Climate Variation in a Large Glaciated Basin of the Tibetan Plateau. J. Geophys. Res. Atmos. 2021, 126, e2020JD034367. [Google Scholar] [CrossRef]


| Type of Data | Resolution | Data Sources (Accessed on 17 November 2021) |
|---|---|---|
| DEM | 30 m × 30 m | RESDC (https://www.resdc.cn/data.aspx?DATAID=217) |
| MOD11C3 | 0.05° × 0.05° | NASA (https://lpdaac.usgs.gov/products/mod11c3v006/) |
| TRMM3B43 | 0.25° × 0.25° | NASA (https://disc.gsfc.nasa.gov/datasets/TRMM_3B43_7/) |
| Solar radiation | 10 km × 10 km | TPDC (https://data.tpdc.ac.cn/) |
| ≥0 °C accumulated temperature | 0.5 km × 0.5 km | RESDC (https://www.resdc.cn/DOI/doi.aspx?DOIid=39) |
| Air temperature | ||
| Precipitation | ||
| The Second China Glacier Catalog Dataset | — | NCDC (http://www.ncdc.ac.cn/) |
| Basins | Elevation | Topographic Relief | Slope | Aspect | Solar Radiation | Air Temperature | Precipitation | >0 °C Accumulated Temperature |
|---|---|---|---|---|---|---|---|---|
| Both Basins | 42.75 | 1.06 | 1.07 | 3.85 | 11.08 | 14.41 | 10.14 | 15.64 |
| Kaidu | 30.88 | 0.77 | 0.79 | 2.09 | 14.73 | 11.31 | 26.90 | 12.53 |
| Manas | 40.44 | 1.02 | 1.02 | 3.85 | 11.00 | 14.70 | 8.02 | 19.95 |
| Area | GMB (mm/w.e.) | Elevation (m) | Topographic Relief (°) | Slope (°) | Aspect (°) | Solar Radiation (W/m2) | Air Temperature (°C) | Precipitation (mm) | >0 °C Accumulated Temperature (°C) |
|---|---|---|---|---|---|---|---|---|---|
| Accumulation | 30.21 | 4502.18 | 60.19 | 37.67 | 128.92 | 157.41 | −14.16 | 241.94 | 128.84 |
| Ablation | −718.97 | 3980.93 | 37.64 | 25.34 | 187.71 | 175.67 | −11.45 | 254.88 | 260.91 |
| Basins | GMB (mm/w.e.) | Elevation (m) | Topographic Relief (°) | Slope (°) | Aspect (°) | Solar Radiation (W/m2) | Temperature (°C) | Precipitation (mm) | >0 °C Accumulated Temperature (°C) |
|---|---|---|---|---|---|---|---|---|---|
| Accumulation Area | |||||||||
| Kaidu | 20.37 | 4346.73 | 52.94 | 33.90 | 135.01 | 170.08 | −9.16 | 138.38 | 400.76 |
| Manas | 31.18 | 4517.40 | 60.90 | 38.04 | 128.33 | 167.11 | −14.65 | 252.08 | 102.21 |
| Ablation Area | |||||||||
| Kaidu | −591.73 | 3944.43 | 36.80 | 24.79 | 184.22 | 178.11 | −9.78 | 219.20 | 333.47 |
| Manas | −769.77 | 4006.34 | 38.06 | 25.62 | 189.70 | 174.71 | −12.12 | 268.97 | 231.87 |
Publisher’s Note: MDPI stays neutral with regard to jurisdictional claims in published maps and institutional affiliations. |
© 2022 by the authors. Licensee MDPI, Basel, Switzerland. This article is an open access article distributed under the terms and conditions of the Creative Commons Attribution (CC BY) license (https://creativecommons.org/licenses/by/4.0/).
Share and Cite
Liu, L.; Tian, H.; Zhang, X.; Chen, H.; Zhang, Z.; Zhao, G.; Kang, Z.; Wang, T.; Gao, Y.; Yu, F.; et al. Analysis of Spatiotemporal Heterogeneity of Glacier Mass Balance on the Northern and Southern Slopes of the Central Tianshan Mountains, China. Water 2022, 14, 1601. https://doi.org/10.3390/w14101601
Liu L, Tian H, Zhang X, Chen H, Zhang Z, Zhao G, Kang Z, Wang T, Gao Y, Yu F, et al. Analysis of Spatiotemporal Heterogeneity of Glacier Mass Balance on the Northern and Southern Slopes of the Central Tianshan Mountains, China. Water. 2022; 14(10):1601. https://doi.org/10.3390/w14101601
Chicago/Turabian StyleLiu, Lin, Hao Tian, Xueying Zhang, Hongjin Chen, Zhengyong Zhang, Guining Zhao, Ziwei Kang, Tongxia Wang, Yu Gao, Fengchen Yu, and et al. 2022. "Analysis of Spatiotemporal Heterogeneity of Glacier Mass Balance on the Northern and Southern Slopes of the Central Tianshan Mountains, China" Water 14, no. 10: 1601. https://doi.org/10.3390/w14101601