Article

Genesis of Geothermal Waters in Suichuan County, China: An Integrated Method Constrained by the Hydrochemical and Isotopic Characteristics

1
Wuhan Center of Geological Survey CGS, Wuhan 430205, China
2
Geological Survey and Research Institute, China University of Geosciences, Wuhan 430074, China
3
Jiangxi Mineral Resources Guarantee Service Center, Nanchang 330025, China
4
Hydrogeological Brigade of Jiangxi Geological Bureau, Nanchang 330095, China
5
Oil and Natural Gas Engineering, China University of Geosciences, Wuhan 430074, China
6
Faculty of Engineering, China University of Geosciences, Wuhan 430074, China
*
Authors to whom correspondence should be addressed.
Water 2022, 14(10), 1591; https://doi.org/10.3390/w14101591
Submission received: 15 April 2022 / Revised: 11 May 2022 / Accepted: 12 May 2022 / Published: 16 May 2022
(This article belongs to the Topic Geothermal Energy Technology and Current Status)

Abstract

:
Numerous geothermal resources of medium to low temperature have been reported in southern China. Suichuan County is one of the regions where thermal manifestations are abundant. However, the study regarding the understanding of geothermal water sources, hydrochemical composition and fluid-rock interaction lacks behind. Therefore, this study has characterized the slightly acidic to slightly alkaline bicarbonate geothermal waters of medium-low temperature of the Suichuan area. Geothermal waters of the study area have been evaluated mainly as of HCO3-Ca-Na hydrochemical type with a maximum temperature of 80 °C. The results indicate the low hydrochemical concentration where HCO3 acts as a principal anion. Furthermore, the F content in geothermal and two cold water samples have been found high with a maximum value of 13.4 (mg/L), showing high pH of 9.6 as well. Here, the compilation of deuterium and oxygen-18 isotopic data of geothermal waters showed a local precipitation origin with a recharge elevation ranging from 630–1000 m. The circulation depth and reservoir temperatures are estimated, explaining the deep thermal water behavior. Additionally, the estimation of saturation indices of various minerals shows the geothermal waters’ corrosive or scaling behavior. Subsequently, the geothermal water points in the study area represent a fracture convection formation pattern. Finally, by integrating conventional hydrochemistry along with isotopic data, and considering the geological framework, a conceptual genetic model of the Suichuan thermal ground waters has been discussed. Hydrochemistry and isotopic features along with a conceptual circulation model have been provided by the foundation towards the sustainable management of hydrothermal resources in Suichuan. Proper management policies and practices are required for further development of Suichuan hydrothermal waters.

1. Introduction

Geothermal resources are the sources of renewable clean energy and can be used in all aspects of peoples’ lives such as bathing, space heating, and recuperation. The scientific and rational development of these resources promotes the tourism industry and improves the regional economy. Geothermal energy resources are classified as hydrothermal systems, conductive systems, and deep aquifers carrying energy from the earth’s interior and stored in rocks, trapped steam, and liquid water [1]. Over the past few decades, this field of research has gained the attention of many scientists and researchers who have done significant research and continue doing so under different prospects [2,3,4,5,6,7]. Knowledge of the geothermal waters concerning their origin is very important in geothermal studies because it helps to explain and differentiate the chemical properties of the thermal waters and their recharge sources. The study of stable H and O isotopes plays an important role in hydrogeological investigations of both thermal and non-thermal waters because the isotopes carry the record of the fluid origin [8]. Another fact is that the altitude effect can influence the composition of stable deuterium and oxygen isotopes of thermal groundwater [9].
The interaction of fluids with host rocks in geothermal reservoirs may alter their chemical and isotopic compositions that are important archives to investigate geothermal waters. Therefore, geothermal fluids rising to shallow depths carry steam with dissolved solutes and gases and the composition of these circulating fluids shows an obvious relationship with their local flow mechanism. The hydrochemistry discloses important information such as underground hydrological conditions, distribution of cations and anions, and type of water. As per studies carried out by [10], the different geochemical processes played a key role in affecting the chemistry of eastern Anatolian thermal waters.
It is significant to examine the evolution of the hydrogeochemical processes and the genesis of the thermal ground waters, which can provide support for hydrogeological exploration, geothermal resource development, and mineral resource prospecting [11,12,13]. The widely applicable fundamental tools for studying thermal waters include regional scale hydraulics, water chemistry, stable isotopic composition, and geothermometry [14].
China is rich in geothermal resources [15] consisting of about 8% of the world’s total geothermal resources [16,17,18], with almost 4000 hot water points [19]. Despite the considerable development in other parts of the country, the thermal resources of Suichuan County have not been exploited because of the lack of research. Therefore, it is extremely important to develop the resources of this region to improve the lives of the local population. Under these circumstances, we introduced a new schematic approach to understanding the mechanism of thermal groundwater flow through different permeable conduits. In addition, we analyzed the geothermal waters of Suichuan according to their (1) hydrochemical and isotopic characteristics, (2) explanation of the origin of geothermal waters, and (3) conceptual genetic model developed for the Suichuan geothermal waters. Moreover, the simulation technique carried out by PHREEQCI contributed to the best understanding of the fluid-rock interactions. The results of the present study are expected to contribute to the development of Suichuan geothermal water resources.

2. Materials and Methods

2.1. Study Area

Suichuan County is located at the southwest border of Jiangxi Province (Figure 1). The overall terrain of the County is mountainous, and is high in the southwest and low in the northeast, comprising a subtropical humid monsoon climate zone. Including Suichuan, approximately 100 hot springs with the highest temperature up to 83 °C have been reported in the province [20].
Suichuan County is the main source of underground hot water in the region. It is located in China’s medium and high temperature hot water zones with a subtropical humid monsoon climate. The terrain in the area has an obvious topography and signatures of strong tectonic activity have been observed (Figure 2A). The north and southeast of the study area have folded basement strata of Caledonian and Ordovician ages. The stratigraphy of almost all the epochs is well developed and the most recent formation is the Quaternary Holocene Ganjiang formation. The most widely distributed strata in the region with an area of approximately 1400 square kilometers is Cambrian. The Caledonian and Yanshan tectonic cycles are the most intensive, showing large scale magmatic activities, granitization, and migmatization (Figure 2B).
Suichuan is bounded by two river systems, the Suichuan River and the Shujiang River. Both the rivers are the tributaries of the Ganjiang River. Because of intense tectonic activities, groundwater in the study area shows different conditions of occurrence and is divided into four major types such as (a) pore water of loose rocks, (b) karst water of carbonated rocks, (c) fissure water of red clastic rocks, (d) bedrock fissure water. According to the data from the Suichuan County Meteorological Bureau, the average temperature for the past few years (2000–2016) is 19.17 °C, the maximum monthly average temperature is 32.1 °C (July 2003), and the minimum monthly average temperature is 3.2 °C (January 2011).

2.2. Field Investigation

For the possible evaluation of thermal groundwater sources and the estimation of hydrochemical and isotopic characteristics, field sampling was carried out in the Suichuan area (Figure 1) in March 2017 and December 2019. The sampling point Xianzikou (XZK-1) is situated very close to the study area, so we considered it a part of Suichuan. A total of 13 samples were collected, out of which 6 were from thermal wells and two from cold wells, while five were river water samples. Precautionary measurements were the priority during sampling because all of the geothermal sites that belonged to the artesian well bore type and samples were collected in a clean overflow state of geothermal groundwater. Cold water samples from LX-1 (monitoring wellbore) and RSZ02-1 (drill hole) sites were collected. River water samples were collected when the flow speed was moderate to avoid impurities with an average annual air temperature value of 19.58 °C (approx. 20 °C).

2.3. Data Processing

2.3.1. Experimental Analysis

In-situ measurements were carried out for unstable hydro-chemical parameters such as water temperature, electric conductivity, and pH. The measurement of temperature was taken by a portable thermometer, whereas pH was calculated by a FE28 pH meter (acidity meter) (D554). 500 mL polyethylene bottles rinsed with distilled water were used for sampling. To avoid contamination, sampled bottles were kept bubble-free and carefully sealed with a 3M sealing strip. All of the samples were preserved in a cool dry place to avoid direct sunlight for laboratory analyses. Thermal groundwater and cold water samples were sent to BEAT laboratory USA for the analyses of δD and δ18O. These analyses of δD and δ18O were performed by gas stage isotope ratio mass spectrometry and expressed in per mil‰ in notation delta (δ) relative to Vienna Standard Mean Ocean Water (V-SMOW) with analytical precision of ±0.1‰ δ18O and ±1‰ for δD.
Later on, all the samples were sent to the laboratory of the Nanchang Mineral Resources Supervision and Testing Center, Ministry of Land and Resources (Jiangxi Institute of Geological Survey) for the analyses of major indexes such as cations, anions, total dissolved solids (TDS), and alkalinity (HCO3). Major anions (Cl, SO42−, NO3, and F) were analyzed by ion chromatograph IC-1100 (D480), while the major cations (Mg2+, Na+, K+, Ca2+, and Li+) were measured by ICAP-Q quadrupole rod ICP-MS mass spectrometer (D523). The analytical error for major cations and anions was ±2% with an accuracy 0.01 mg/L. Alkalinity (HCO3) was analyzed by the standard titration method with HCl and the analytical values are accurate up to 0.01 mg/L. The concentrations of other chemical elements were estimated by AFS-8800 double-channel atomic fluorescence photometer (D507), UV-1800 ultraviolet, and visible spectrophotometer (D528). The saturation indices (SI) regarding the main minerals such as (anhydrite, aragonite, calcite, dolomite, and fluorite) were calculated using the PHREEQCI computer software [21]. The solution is under-saturated when SI < 0 and saturated if SI = 0, which means the equilibrium between mineral dissolution and precipitation has been achieved. In the same way, when SI > 0, the solution will be considered as supersaturated and the precipitation of extra minerals will take place [14]. The calculated charge balance (CBR) error is calculated according to [22] and the range is ±5%. It is shown in Table 1.

2.3.2. Geothermometry

It is very important to select a suitable geothermometer to estimate reservoir temperature with a minimum margin of error. In the case of definite differences in measured temperature values, it points out the selection of an appropriate geothermometer. To carry out the calculation of reservoir temperatures of thermal waters, the following geothermometers are being used in this study.
(1)
Quartz geothermometer: TSiO2 = [1309/(5.19 − lgS)] − 273.15 and
(2)
Chalcedony geothermometer: TSiO2 = [1032/(4.69 – lgS)] – 273.15 [23];
(3)
Improved SiO2 geothermometer: TSiO2 =–44.119 + 0.24469S – 1.7414 × 10⁻⁴ + 79.305lgS [24];
(4)
K-Mg: TK-Mg = 4410/[14 – lg(k2/Mg)] – 273.15 and
(5)
Na-K: TNa-K = 1390/[1.75 – lg(Na/K)] – 273.15 [25];
(6)
Na-Li: 1049/[lg(Na/Li) + 0.44] – 273.15 [26];
(7)
Na-K-Ca-Mg: 14920/[3lg(Na/K) + 3lg(Ca/Na2) – lg(Mg/Na) + 40.91] – 273.15 [27]. S denotes the concentration of SiO2. All of the concentrations are in mg/L.

2.3.3. Depth of Circulation

Generally, it has been reported that circulation depth in case of thermal fluids has a direct relation to reservoir temperatures. The meteoric water percolates into the ground surface through various permeable zones and to reach a considerable depth. If it is assumed that the geothermal water temperature might increase due to heat flow then the following expression can be used for general estimations [13,28].
Z = G (T − T0) + Z0
where Z is the circulation depth of geothermal fluids in (m), T is the reservoir temperature (°C), T0 is the annual average temperature as of 21.2 °C, Z0 denotes the thickness of a constant temperature zone (and it is 20 m) and G is the geothermal gradient of 3.12 °C/100 m [29].

2.3.4. Recharge Altitude and Annual Air Temperature (Average)

Based on the deuterium δD isotope, recharge altitude and its variance among thermal ground waters can be estimated by using the following standard expressions for China [14]. The degree of error in the estimated results of altitude is within 1 m.
δD =−0.03 ALT–27
where ALT stands for the altitude in (m).
Whereas, for annual average air temperature another equation has been used, as below.
δD = 3T–92
T represents annual air temperature in (°C).

3. Results

3.1. Physicochemical Characteristics

Water samples show quite high pH values ranging from 6.65 to 9.60. The discharge temperatures of geothermal waters show a wide range from 39 °C (XZK-1) to 80 °C (TH-1). XZK-1 has the lowest temperature among all the geothermal waters that might be due to the mixing with surrounding cold waters. The Lingxia cold water has a pH of 6.95 and a temperature of 23 °C was recorded. Electrical conductivity (EC) for geothermal waters varies from 169 µS/cm to 400 µS/cm, LX-1 and RSZ02-1 showed 134 µS/cm and 212 µS/cm, respectively (see Table 1).
The hydrochemical type of the studied waters is mainly categorized as the HCO3-Ca-Na type (Figure 3). It can be concluded that HCO3 is the dominant anion in all of the water samples, showing a proportion of more than 50% and a mean concentration value of 47.31 mg/L respectively, while Ca2+ and Na+ are the main cations in geothermal waters, having mean concentrations of 8.14 mg/L and 15.05 mg/L. The total dissolved solids (TDS) vary from 53.56 mg/L to 240.27 mg/L. The maximum TDS was recorded for TH-1 geothermal water point Table 1. According to the contents of TDS, all the geothermal waters and cold waters are considered freshwater types, as the TDS ranges from 0.08 g/L to 0.24 g/L [30].
Table 2 shows the low concentrations of alkaline earth metal (Sr) and alkali metal (Li) in all of the thermal and non-thermal water samples. They can be useful to trace the signatures of magmatic water. Low content of Sr in natural water is mainly due to the low solubility of carbonate and sulfate, unlike bicarbonates. Lithium (Li) content in geothermal water generally increases with the increase in salinity, temperature, pressure, and its content in the surrounding rocks. The dissolved silica (SiO2) exhibits considerable measured values.

3.2. Geothermometry and Reservoir Temperature

Different geothermometers are the source of important indications for the utilization of geothermal fluids, as they carry significant information about hydrothermal systems. Using Quartz and Chalcedony geothermometers [23], the calculated temperatures are 64.48–127.06 °C and 32.44–99.31 °C, respectively. [24] An improved SiO2 geothermometer determines temperature 65.04–128.40 °C. K-Mg and Na-K yield 68.80–105.80 °C and 4401.26–700.46 °C [25]. Na-Li gives elevated temperatures of 91.66–176.61 °C [26]. Na-K-Ca-Mg yield 94.80–120.35 °C [27].

3.3. Stable Isotope Composition

Stable isotopic data (Table 3) for six thermal and two cold groundwater show δD from −57.84‰ to −46.84‰, while δ18O values exhibit from −8.61‰ to −7.53‰. Overall variations are not very high but significant (Figure 4). XZK-1 shows an interesting difference when compared with other samples.

3.4. Saturation Indices

The SIs of most of the minerals yield negative results (less than 0), implying unsaturation of thermal and cold well samples regarding the minerals mentioned in Table 4. Overall, few exceptions were observed in the case of RSZ04-1, showing saturation to near oversaturation of aragonite and calcite minerals while dolomite shows an oversaturation state as well. In the same way, XZK-1 exhibits the saturation of fluorite mineral.

4. Discussion

4.1. Hydrochemical Characteristics of Thermal and Non-Thermal Groundwater

Generally, the low concentrations of hydrochemical parameters show that water-rock interaction is not intense [31]. The considerable spatial inconsistency in EC and TDS concentrations proposed that groundwater chemistry was not homogeneous and was controlled by different processes [32]. The isotopic and hydrochemical composition of groundwater during their ascent to the ground surface may have been altered because of the steam separation caused by adiabatic expansion and dilution by mixing with shallow groundwater [
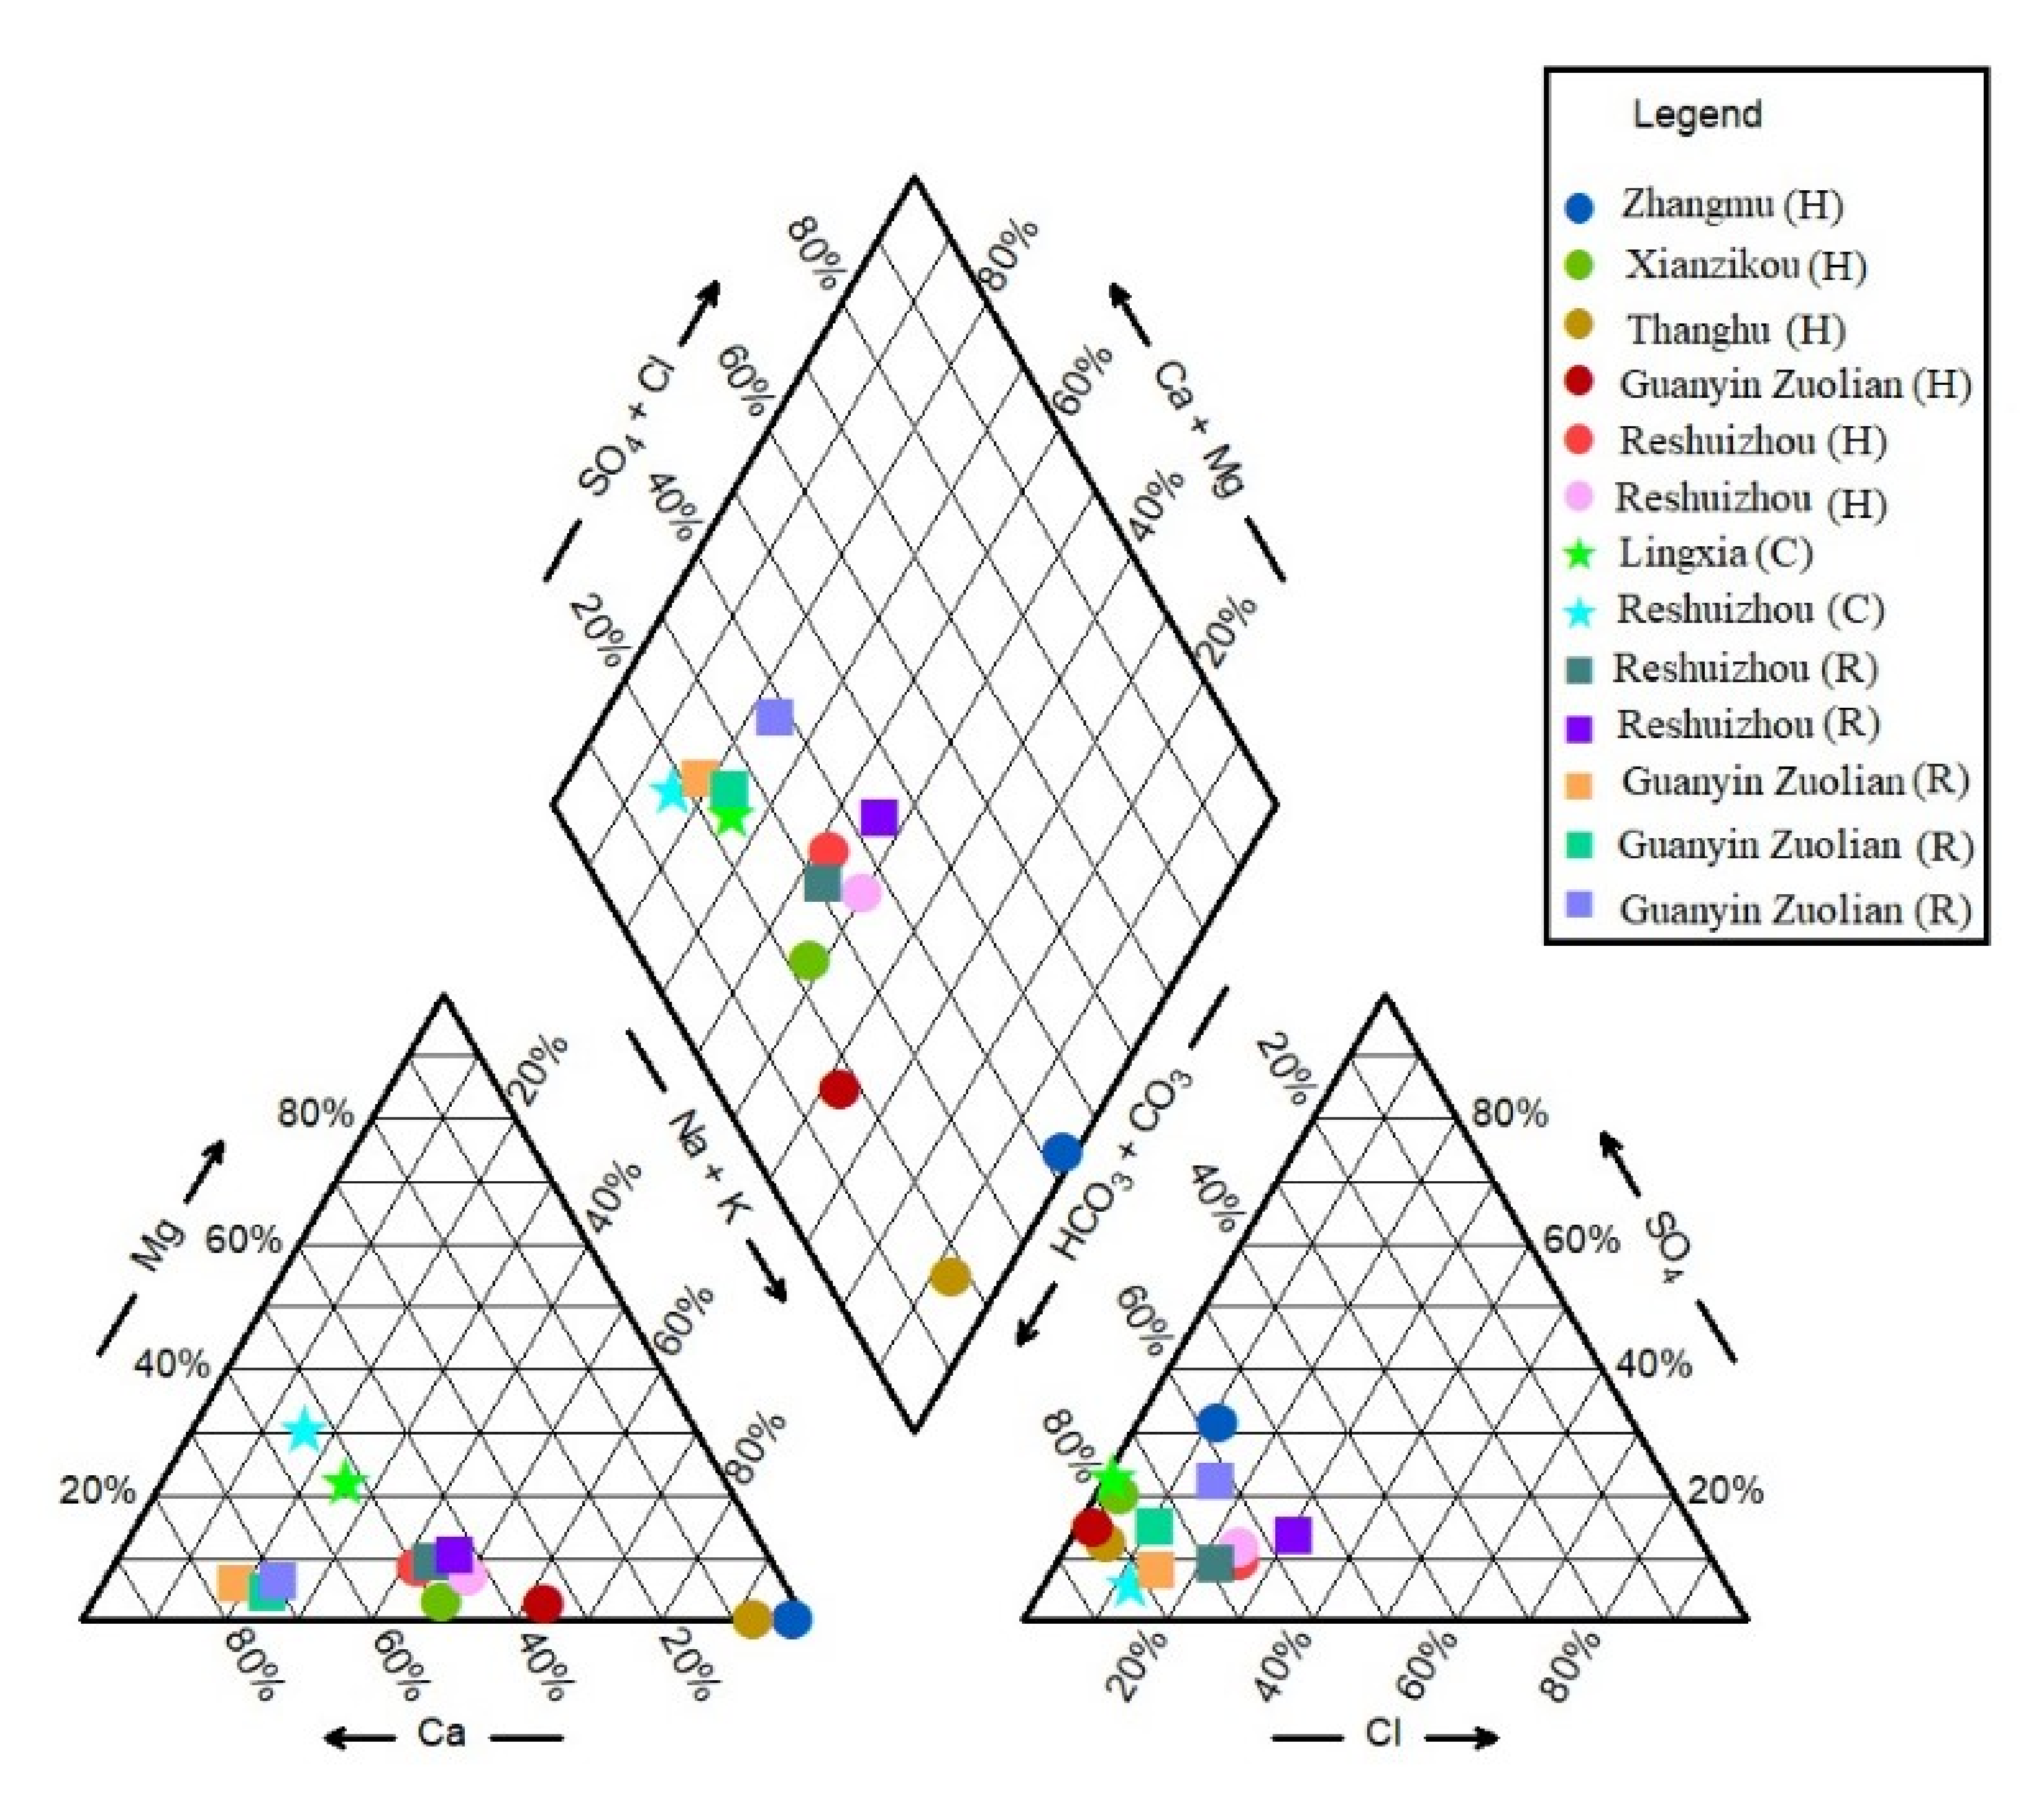
12]. As described earlier in Figure 3, the dominant water type is HCO3-Ca-Na. Due to the variability in hydrochemistry, however, the Na-HCO3-SO4 type can be seen exhibiting approximately 32% SO4. RSZ04-1 belongs to the Na-Ca-HCO3-Cl type. Coldwater sample RSZ02-1 belongs to the Ca-Mg-HCO3 type containing Mg content up to 25%.
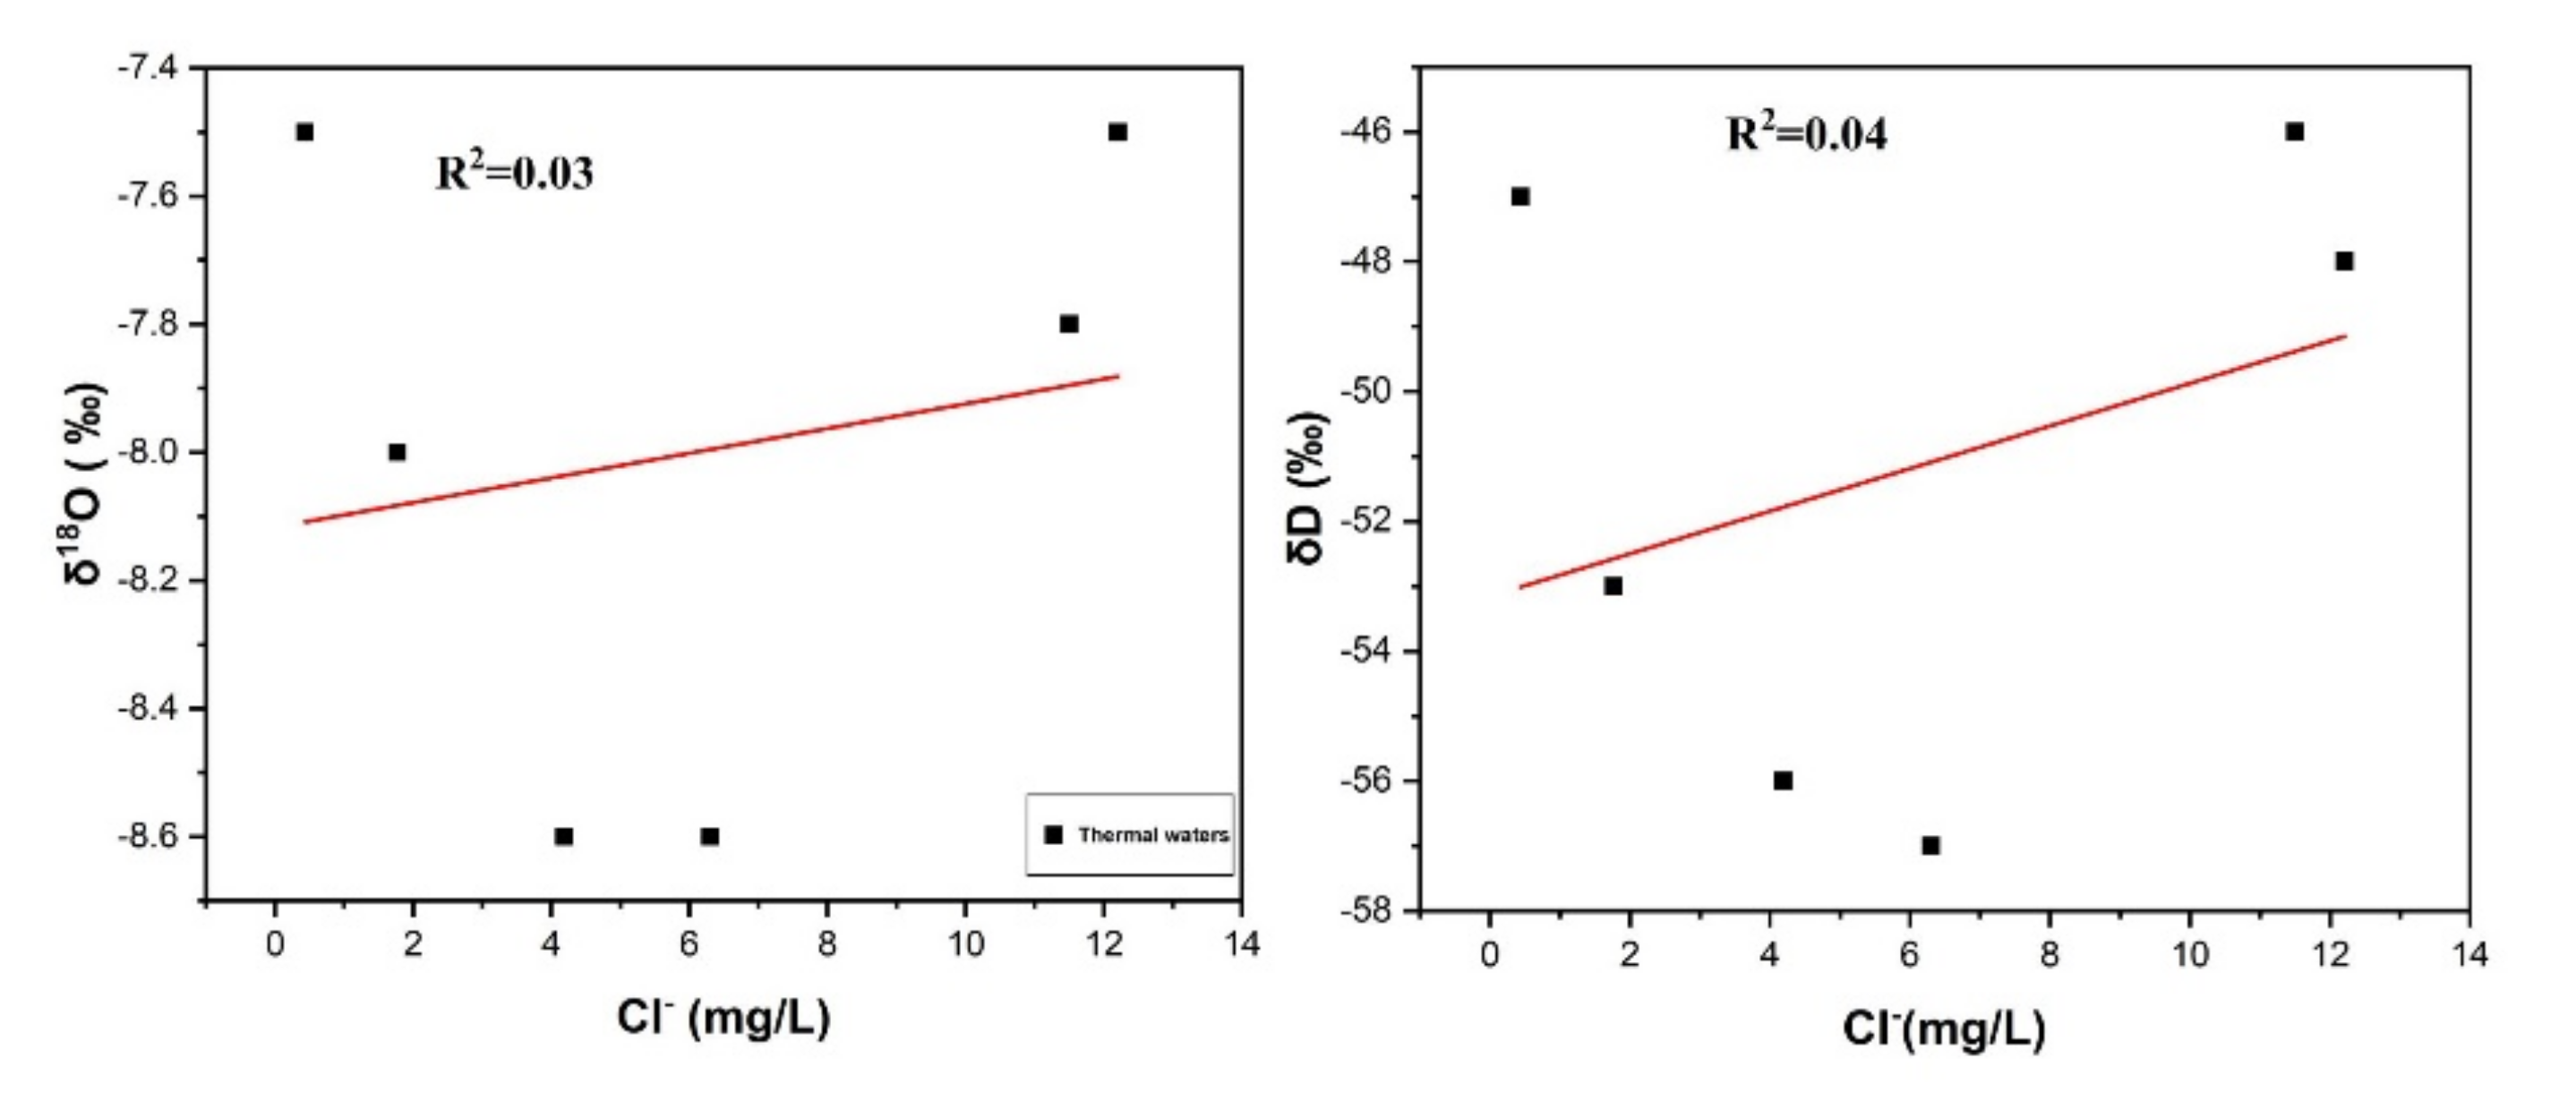
Cl is an important tool for assessing the mixing of geothermal water with cold groundwater in upflow zones of geothermal water systems. The correlation of δD and δ18O with Cl is insignificant confirming the mixing of geothermal waters with shallow cold waters [33,34], as shown in Figure 5. If the steam separation/evaporation process was dominant, then Cl enrichment would have been observed, but in the present study, low Cl contents minimized this possibility and supports the mixing process [35,36].
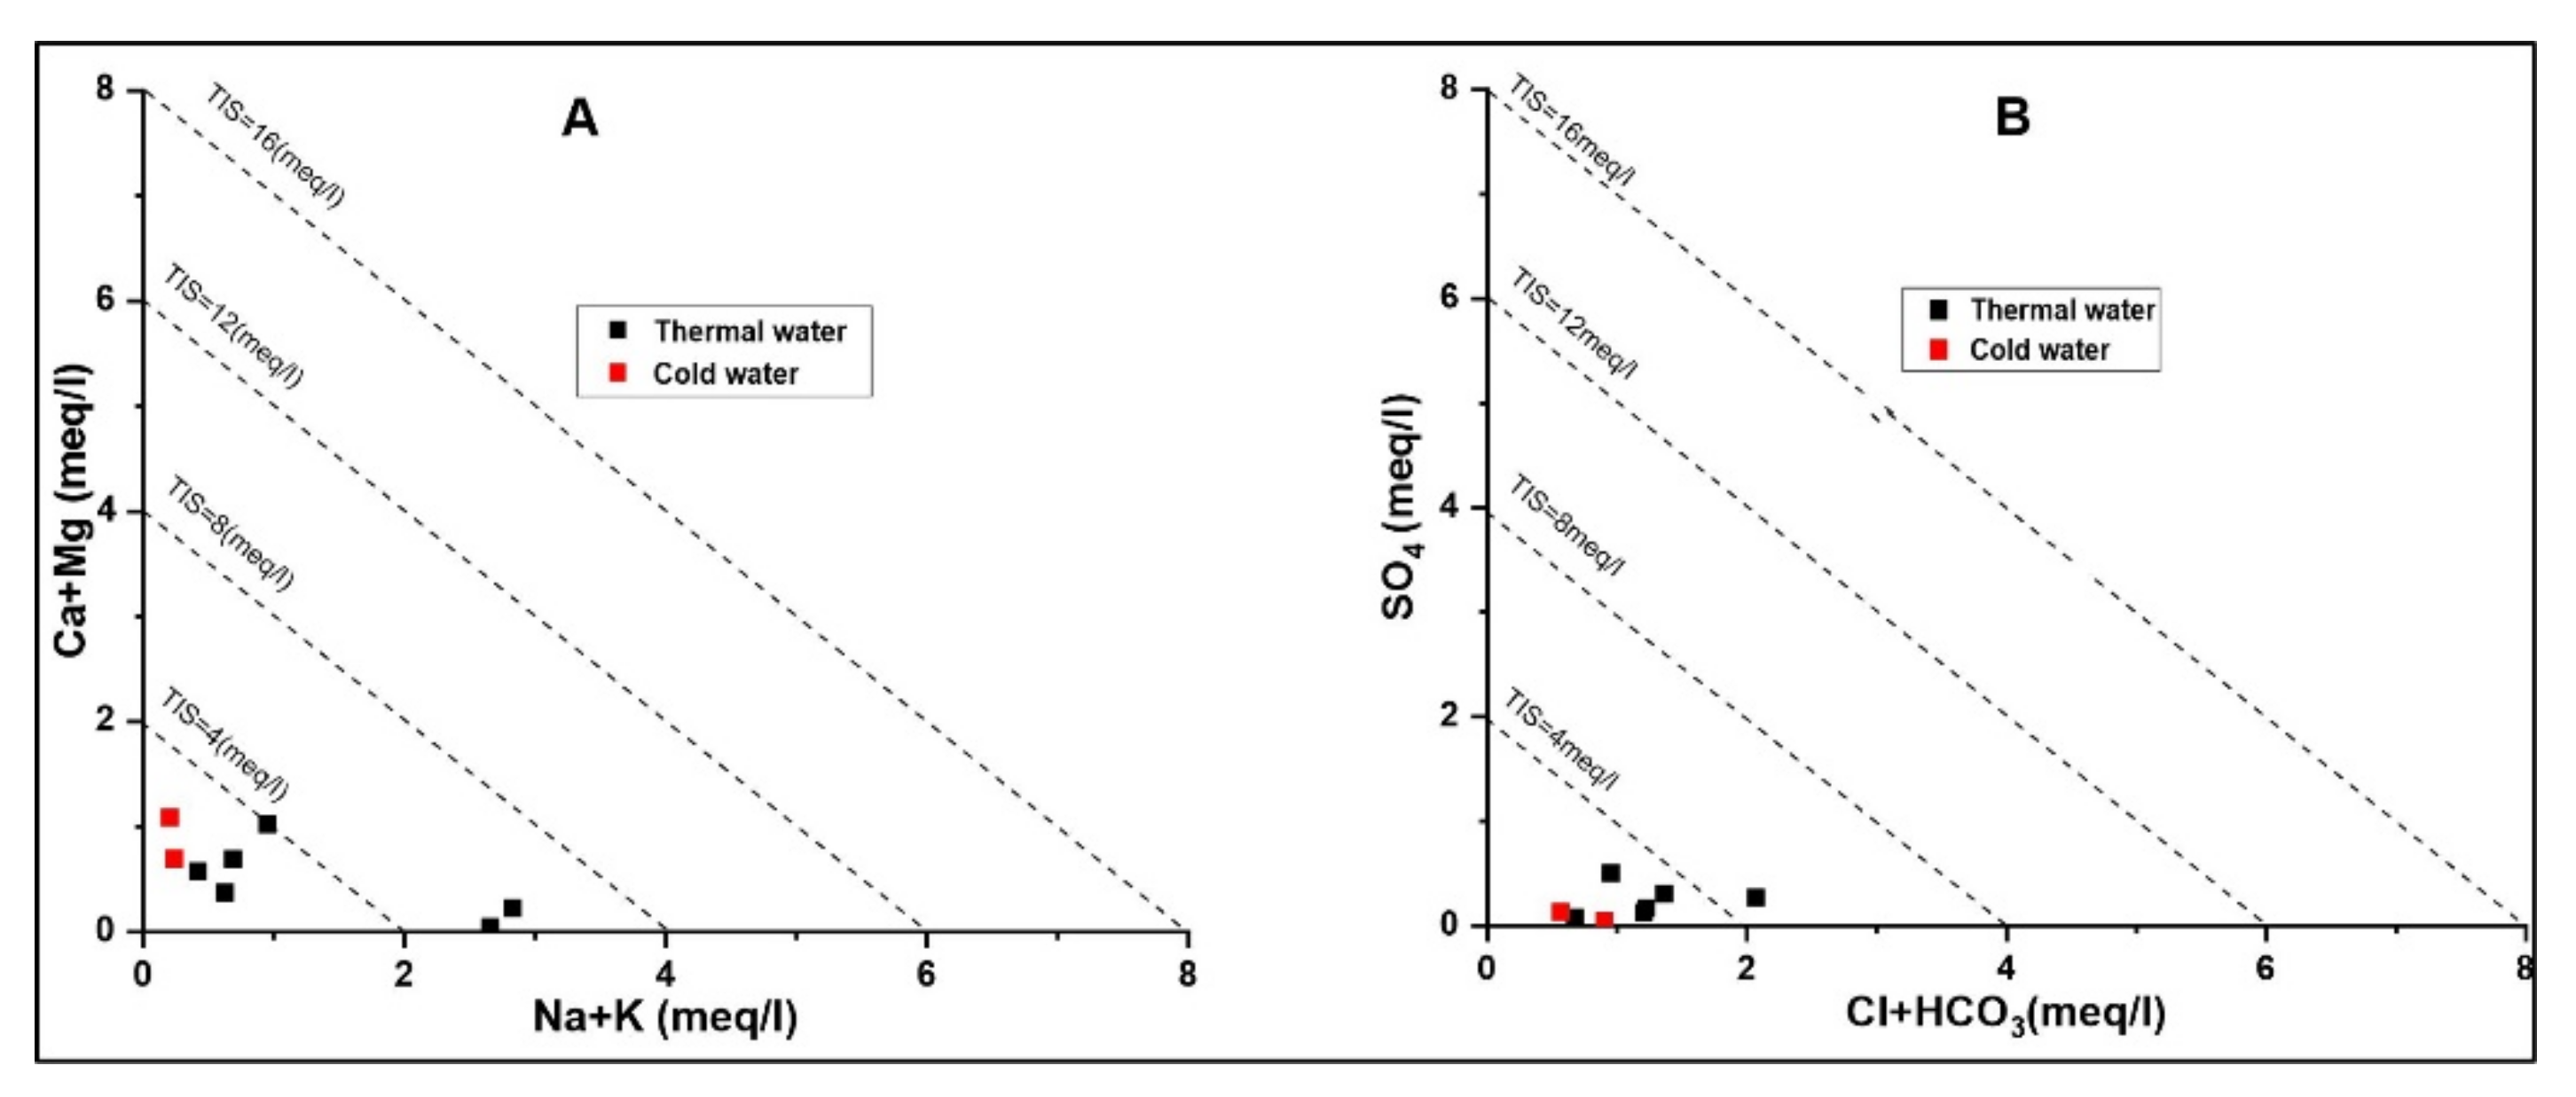
The TIS salinity plot is also an important index used for the classification of hydrochemistry where the (Figure 6A) Ca + Mg vs. Na + K diagram shows the low salinity with minimum variations. Usually the high Ca and Mg concentrations are likely due to re-equilibration or mixing with Ca and Mg rich cold waters during infiltration of thermal waters [37]. Furthermore, SO4 vs. Cl + HCO3 in the TIS salinity plot shows that the thermal and cold waters accounted for low salinity content (Figure 6B).
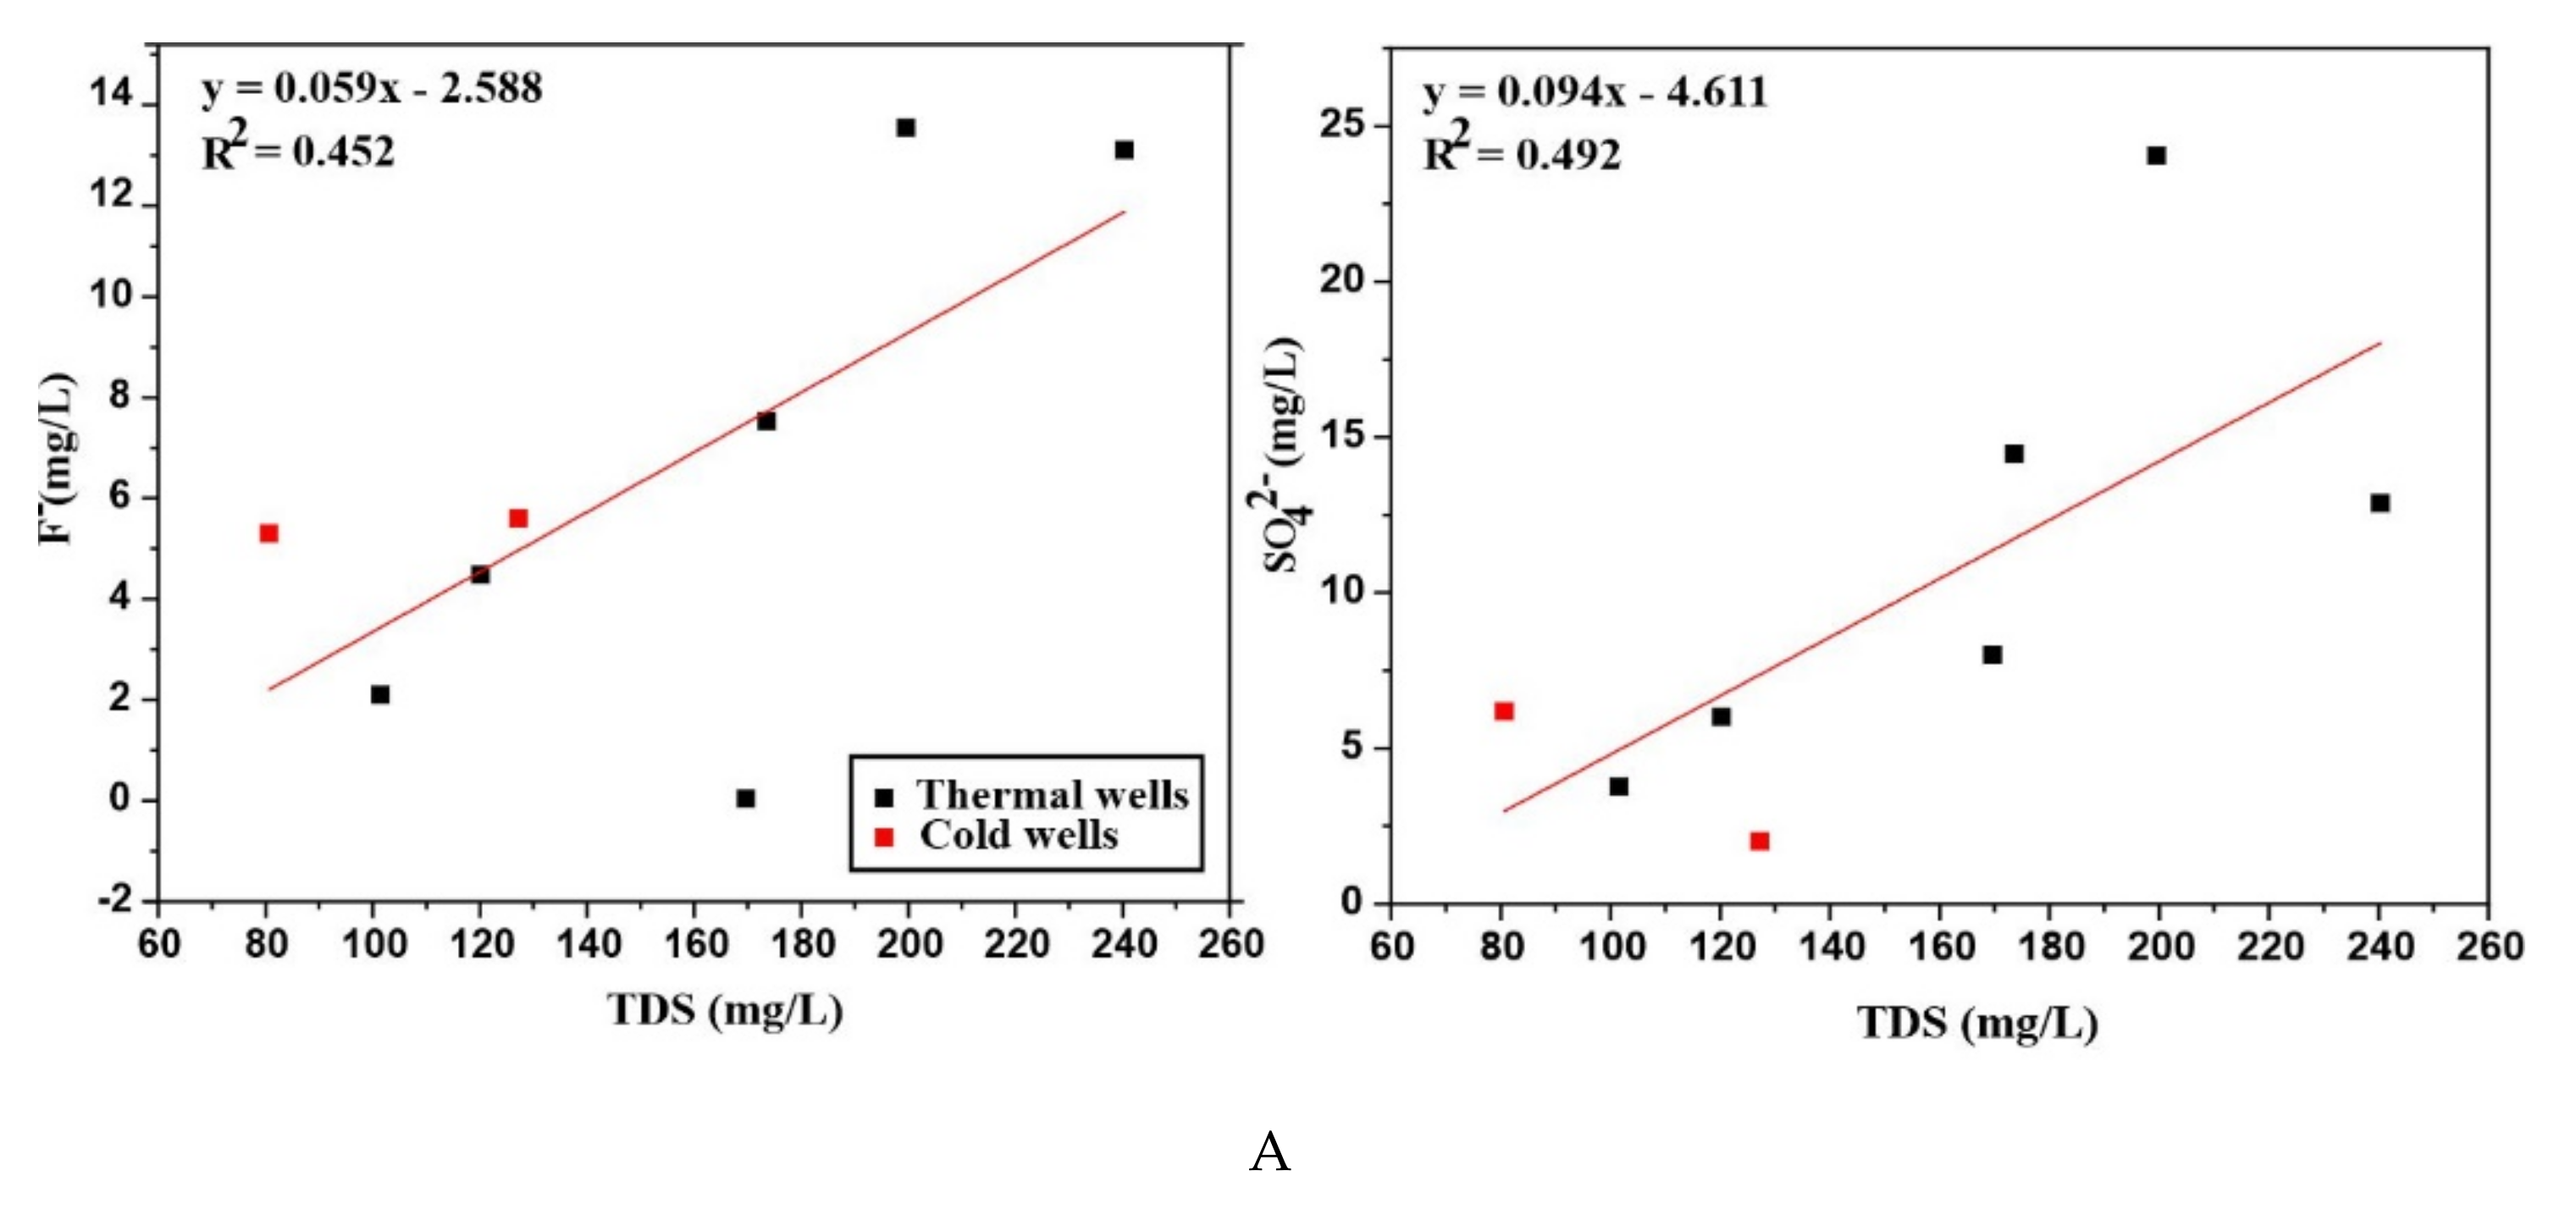
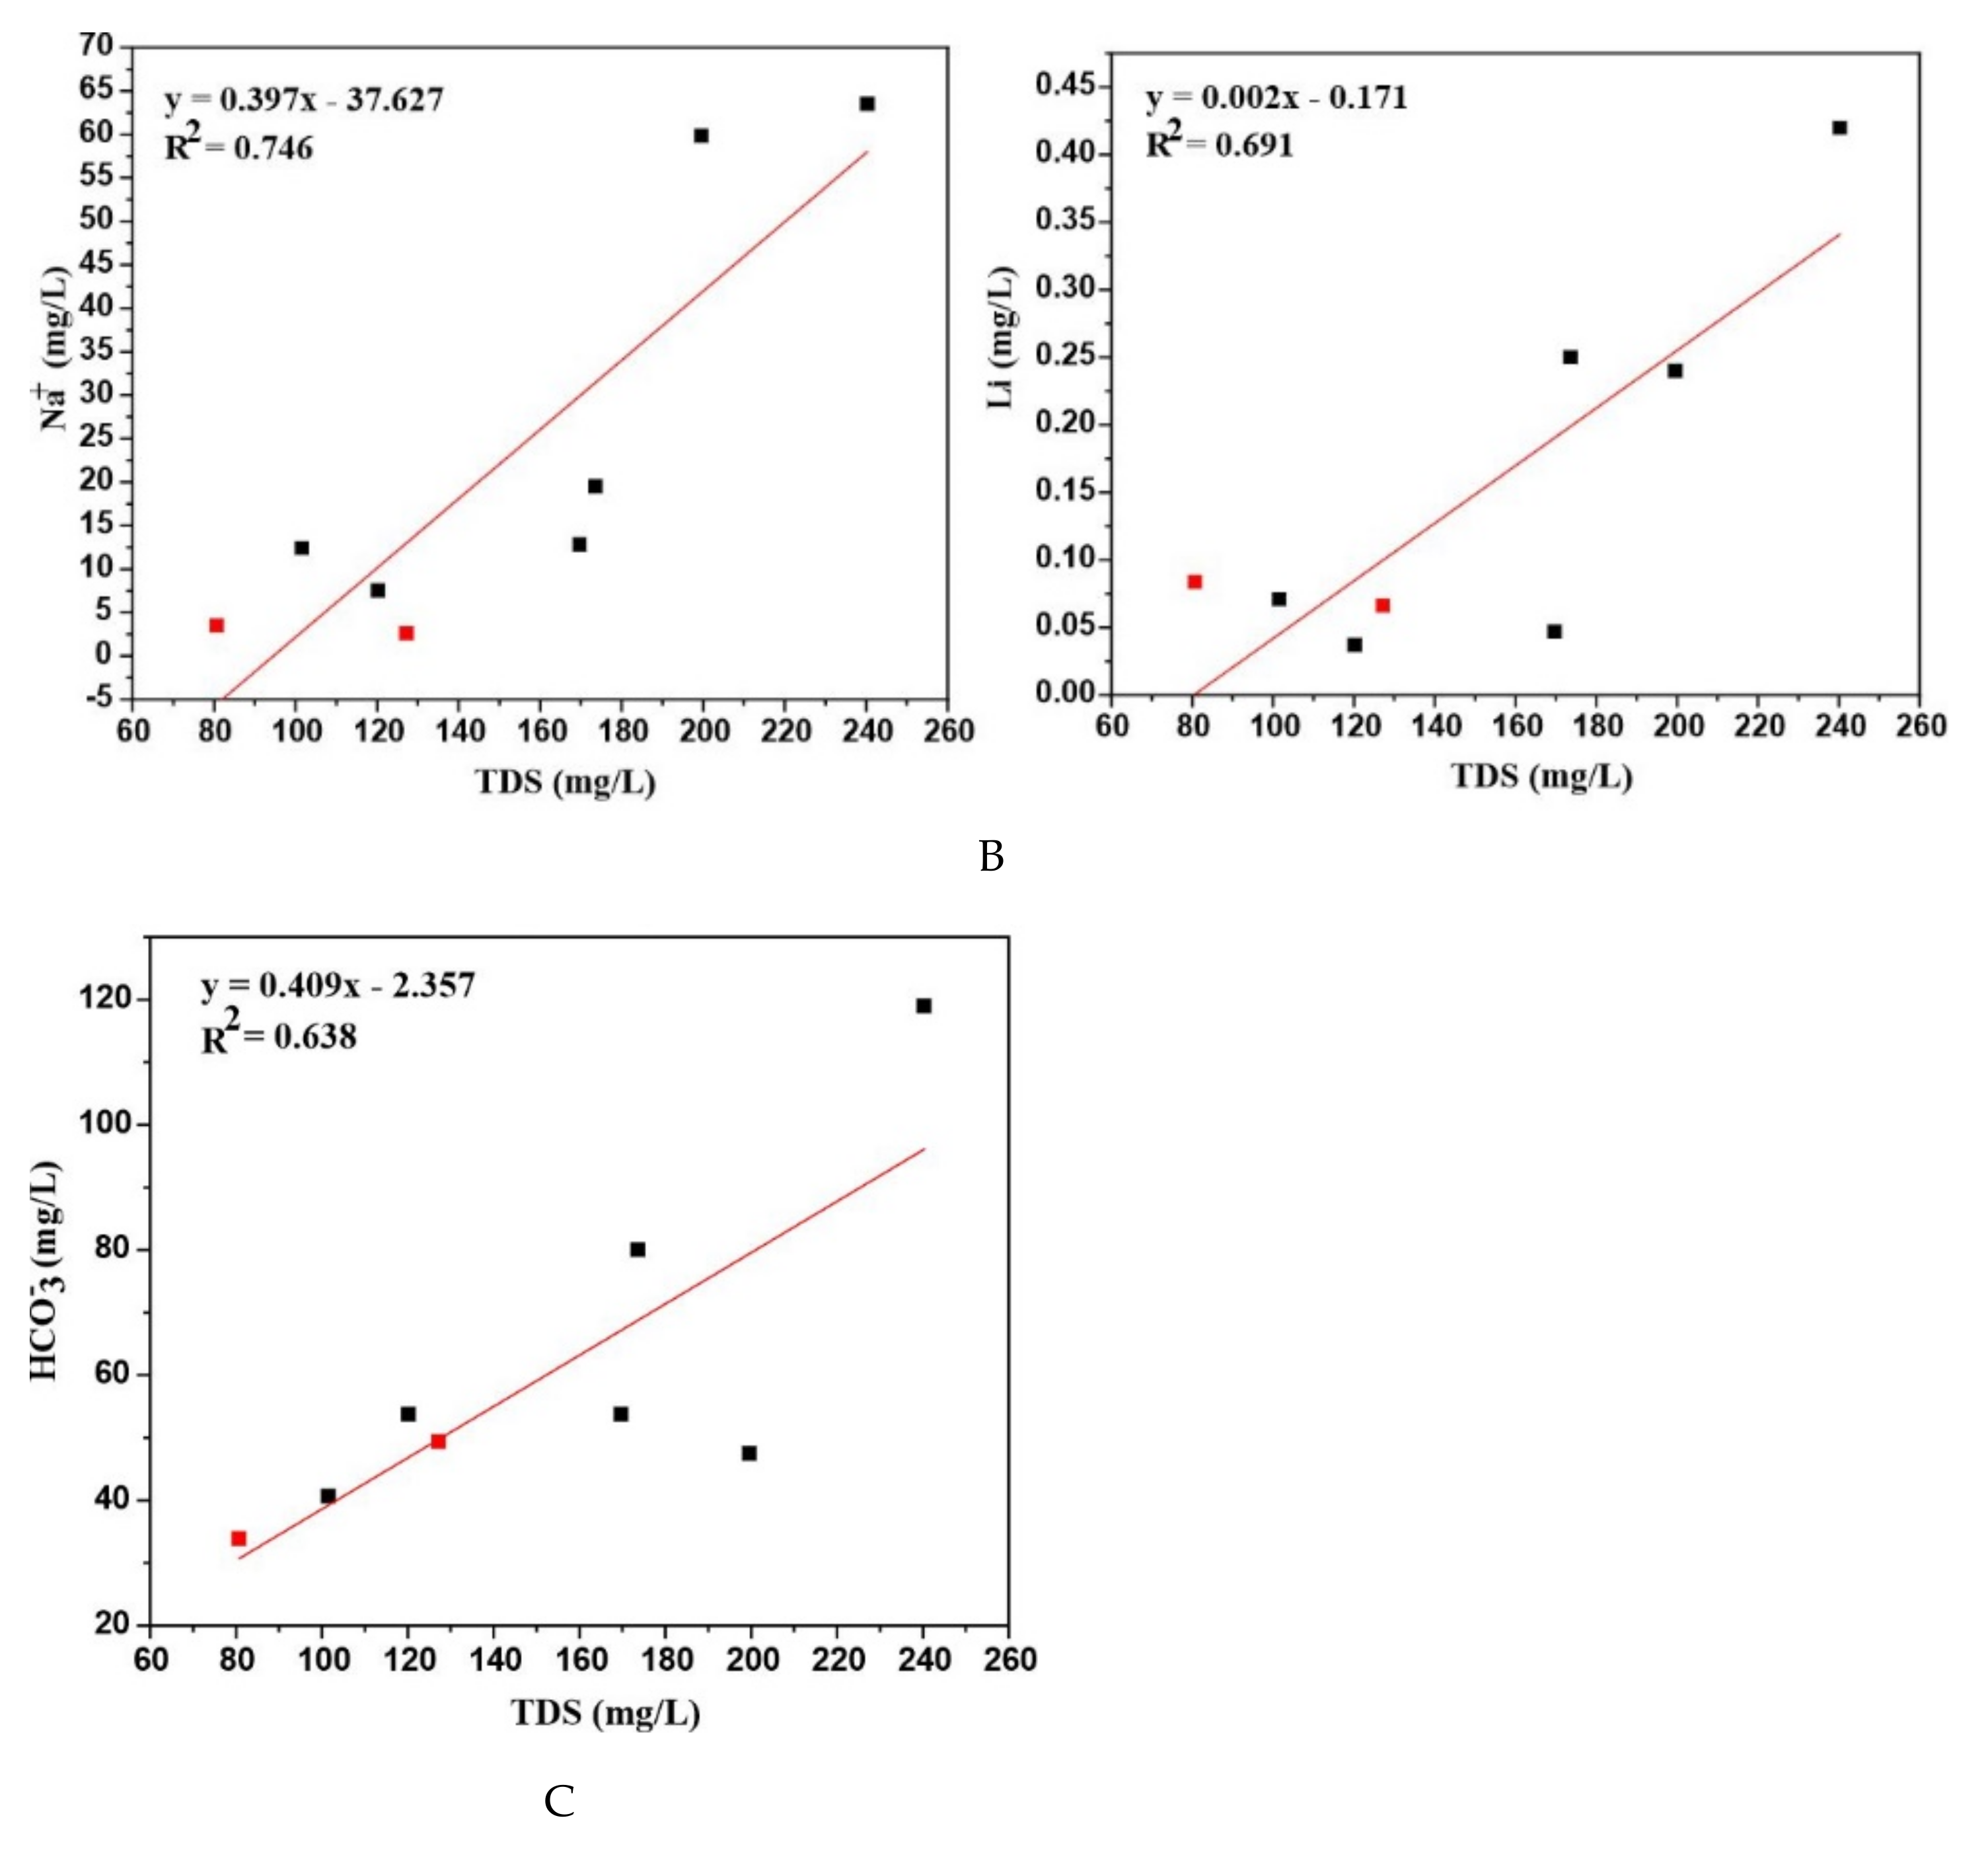
The correlation of various parameters is shown in (Figure 7A–C). Na+ exhibits a good linear correlation with R2 = 0.746 when plotted against TDS. The little elevation in SO42− might reflect the oxidation of hydrogen sulfide (H2S) or other sulfide minerals involved in the formation of ore deposits and shows an agreeable correlation with TDS. Even though the continuing dissolution of gypsum and anhydrite as well as the interaction with evaporite deposits also leads to a possibility of elevated sulfate content [38], simultaneously oxygen concentration should be increased by the shallow water table to promote the sulfide oxidation and hence the SO42− concentration would be increased [39]. All the water samples are dominated by HCO3 ions and show higher pH > 6 rather than CO3 ions that affect the pH of water. Because at low pH< 6 the carbonates occur mainly in the form of weak H2CO3 caused by the degassing of CO2 [34] and it can also reduce the pH of natural waters [40]. The HCO3 content of the cold water (RSZ02-1) and few thermal waters indicate the dilution by the HCO3 content of shallow groundwater during upward flow. Nevertheless, the HCO3 ion shows a good linear correlation with TDS.
The concentration of dissolved silica (SiO2) measured for RSZ04-1 is the highest among all other thermal and non-thermal groundwater. But overall SiO2 content is low, which is a sign of its dependence on host rock types because most probably its high content in the case of thermal groundwater could be reported in granitic rock types [41]. The lowest concentrations of Li and Sr reported in the present study show the existence of different processes. Li shows a noticeable correlation. (Figure 7B). One of the possibilities of low Sr concentration is that it might be controlled by the precipitation of calcite minerals [42]. Volcanic rocks are possibly the main source of alkali metal (Li) in thermal groundwater, as it can be accumulated in different acidic rocks, particularly at the end of magma crystallization. The higher concentrations of Li and Sr are generally associated with deep circulating magmatic waters [43,44]. On the whole, fluoride concentration is very high and overreached the standards of World Health Organization (WHO) [45]. In most of the groundwaters, the high fluoride content generally shows a function of pH > 6 and temperature > 50 °C [5]. The granitic rock type in the study area satisfied the high content of fluoride due to the water-rock interaction between granite-bearing fluoride minerals and thermal waters. This is because fluoride is mainly derived from the weathering of silicate minerals and the existence of granitic rocks amalgamating with fluorite minerals defines its high concentration [46]. Although there is another process by which atmospheric deposition results in dust particles in the form of soil but the significant source is the weathering of soil minerals [47,48].
Based on TDS values, it can be concluded that all the groundwater (thermal and non-thermal) belong to freshwater as (TDS < 1000 ppm) [49,50]. Normally, the higher values of TDS and EC for groundwater are probably the index of elevated ionic concentrations; this is because of intense weathering conditions resulting in the maximum contents of dissolved minerals. The mutual dependence of both the quantities is described by [40]. TDS is a function of 0.6 times EC, as expressed below.
TDS = 0.6 EC

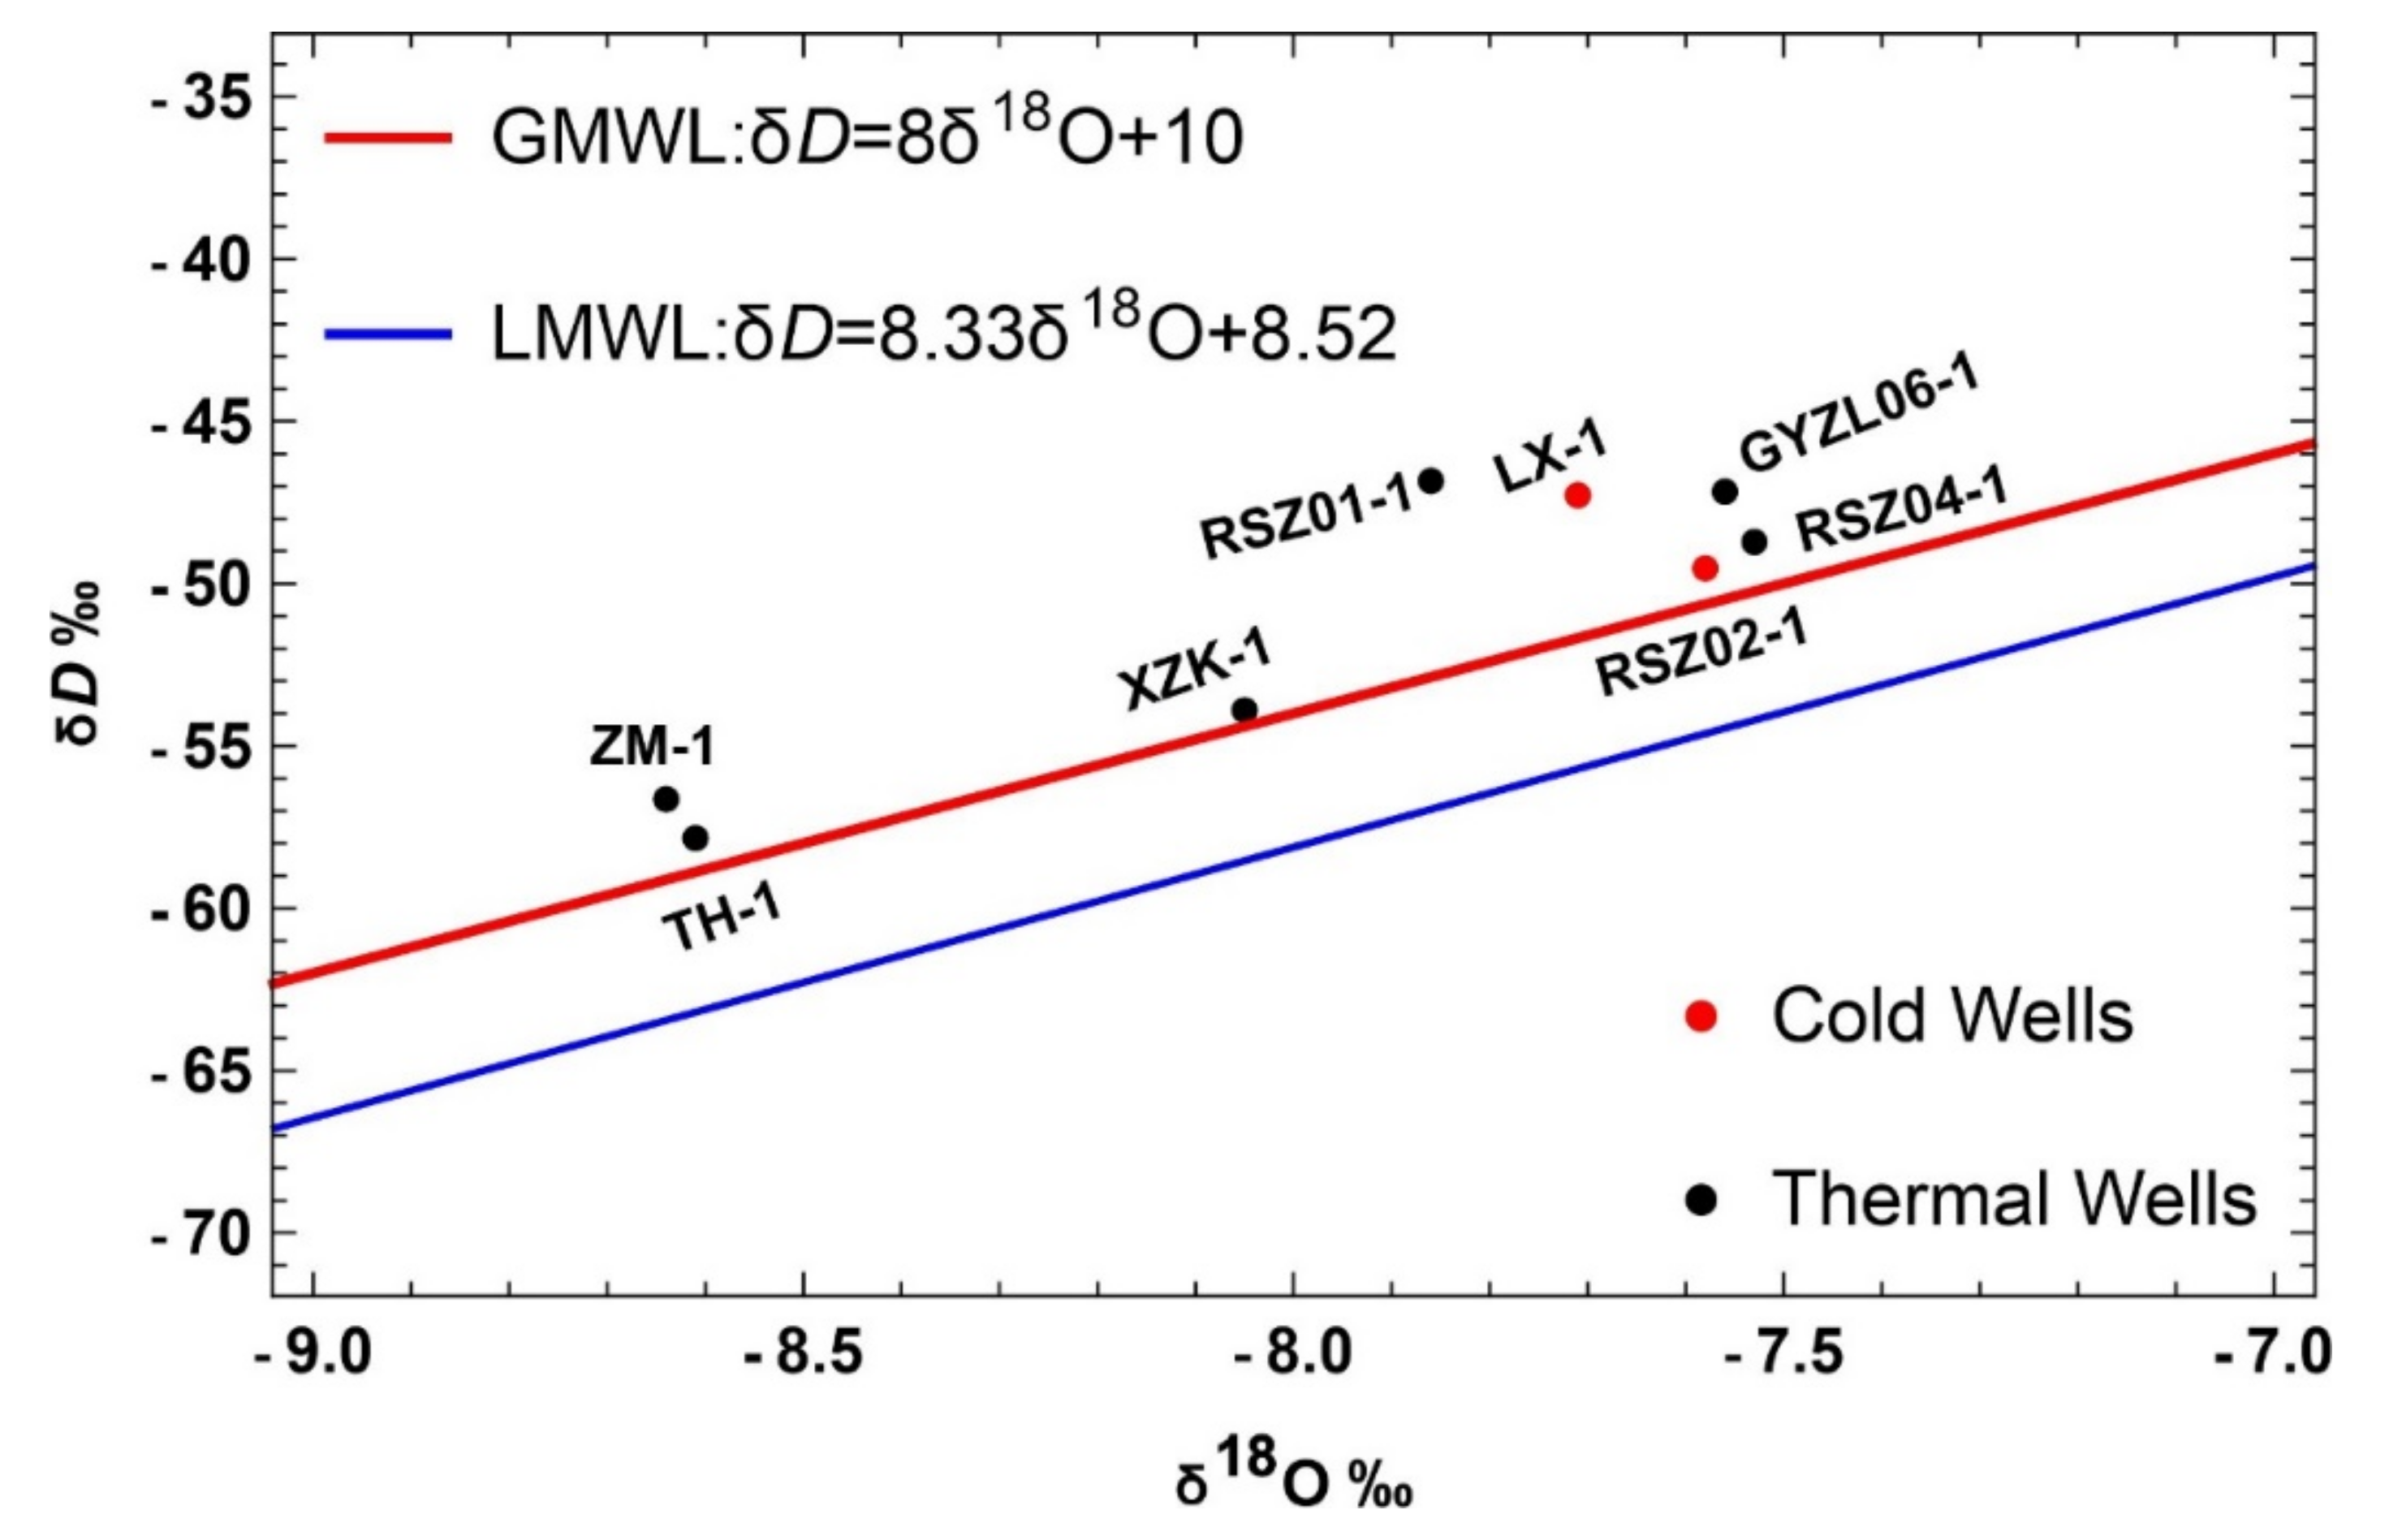
4.2. Isotopes of H and O and Origin of Thermal Groundwaters

H and O isotopes for geothermal and cold water samples are plotted in Figure 4. It is quite clear from the graph that no such deviation was observed from the two standard representative lines. The position of all the water samples close to the global meteoric water line (GMWL) [51] and local meteoric water line (LMWL) of Jiangxi province [52], with no deviation observed [53], undoubtedly confirmed their meteoric type of origin. Another piece of evidence in support of the meteoric origin is that the concentration of environmental isotopes in the case of oceanic origin is around 0% (VSMOW), salinity ranges from 33,500 ppm to 37,600 ppm, and chloride is about 19,300 ppm [
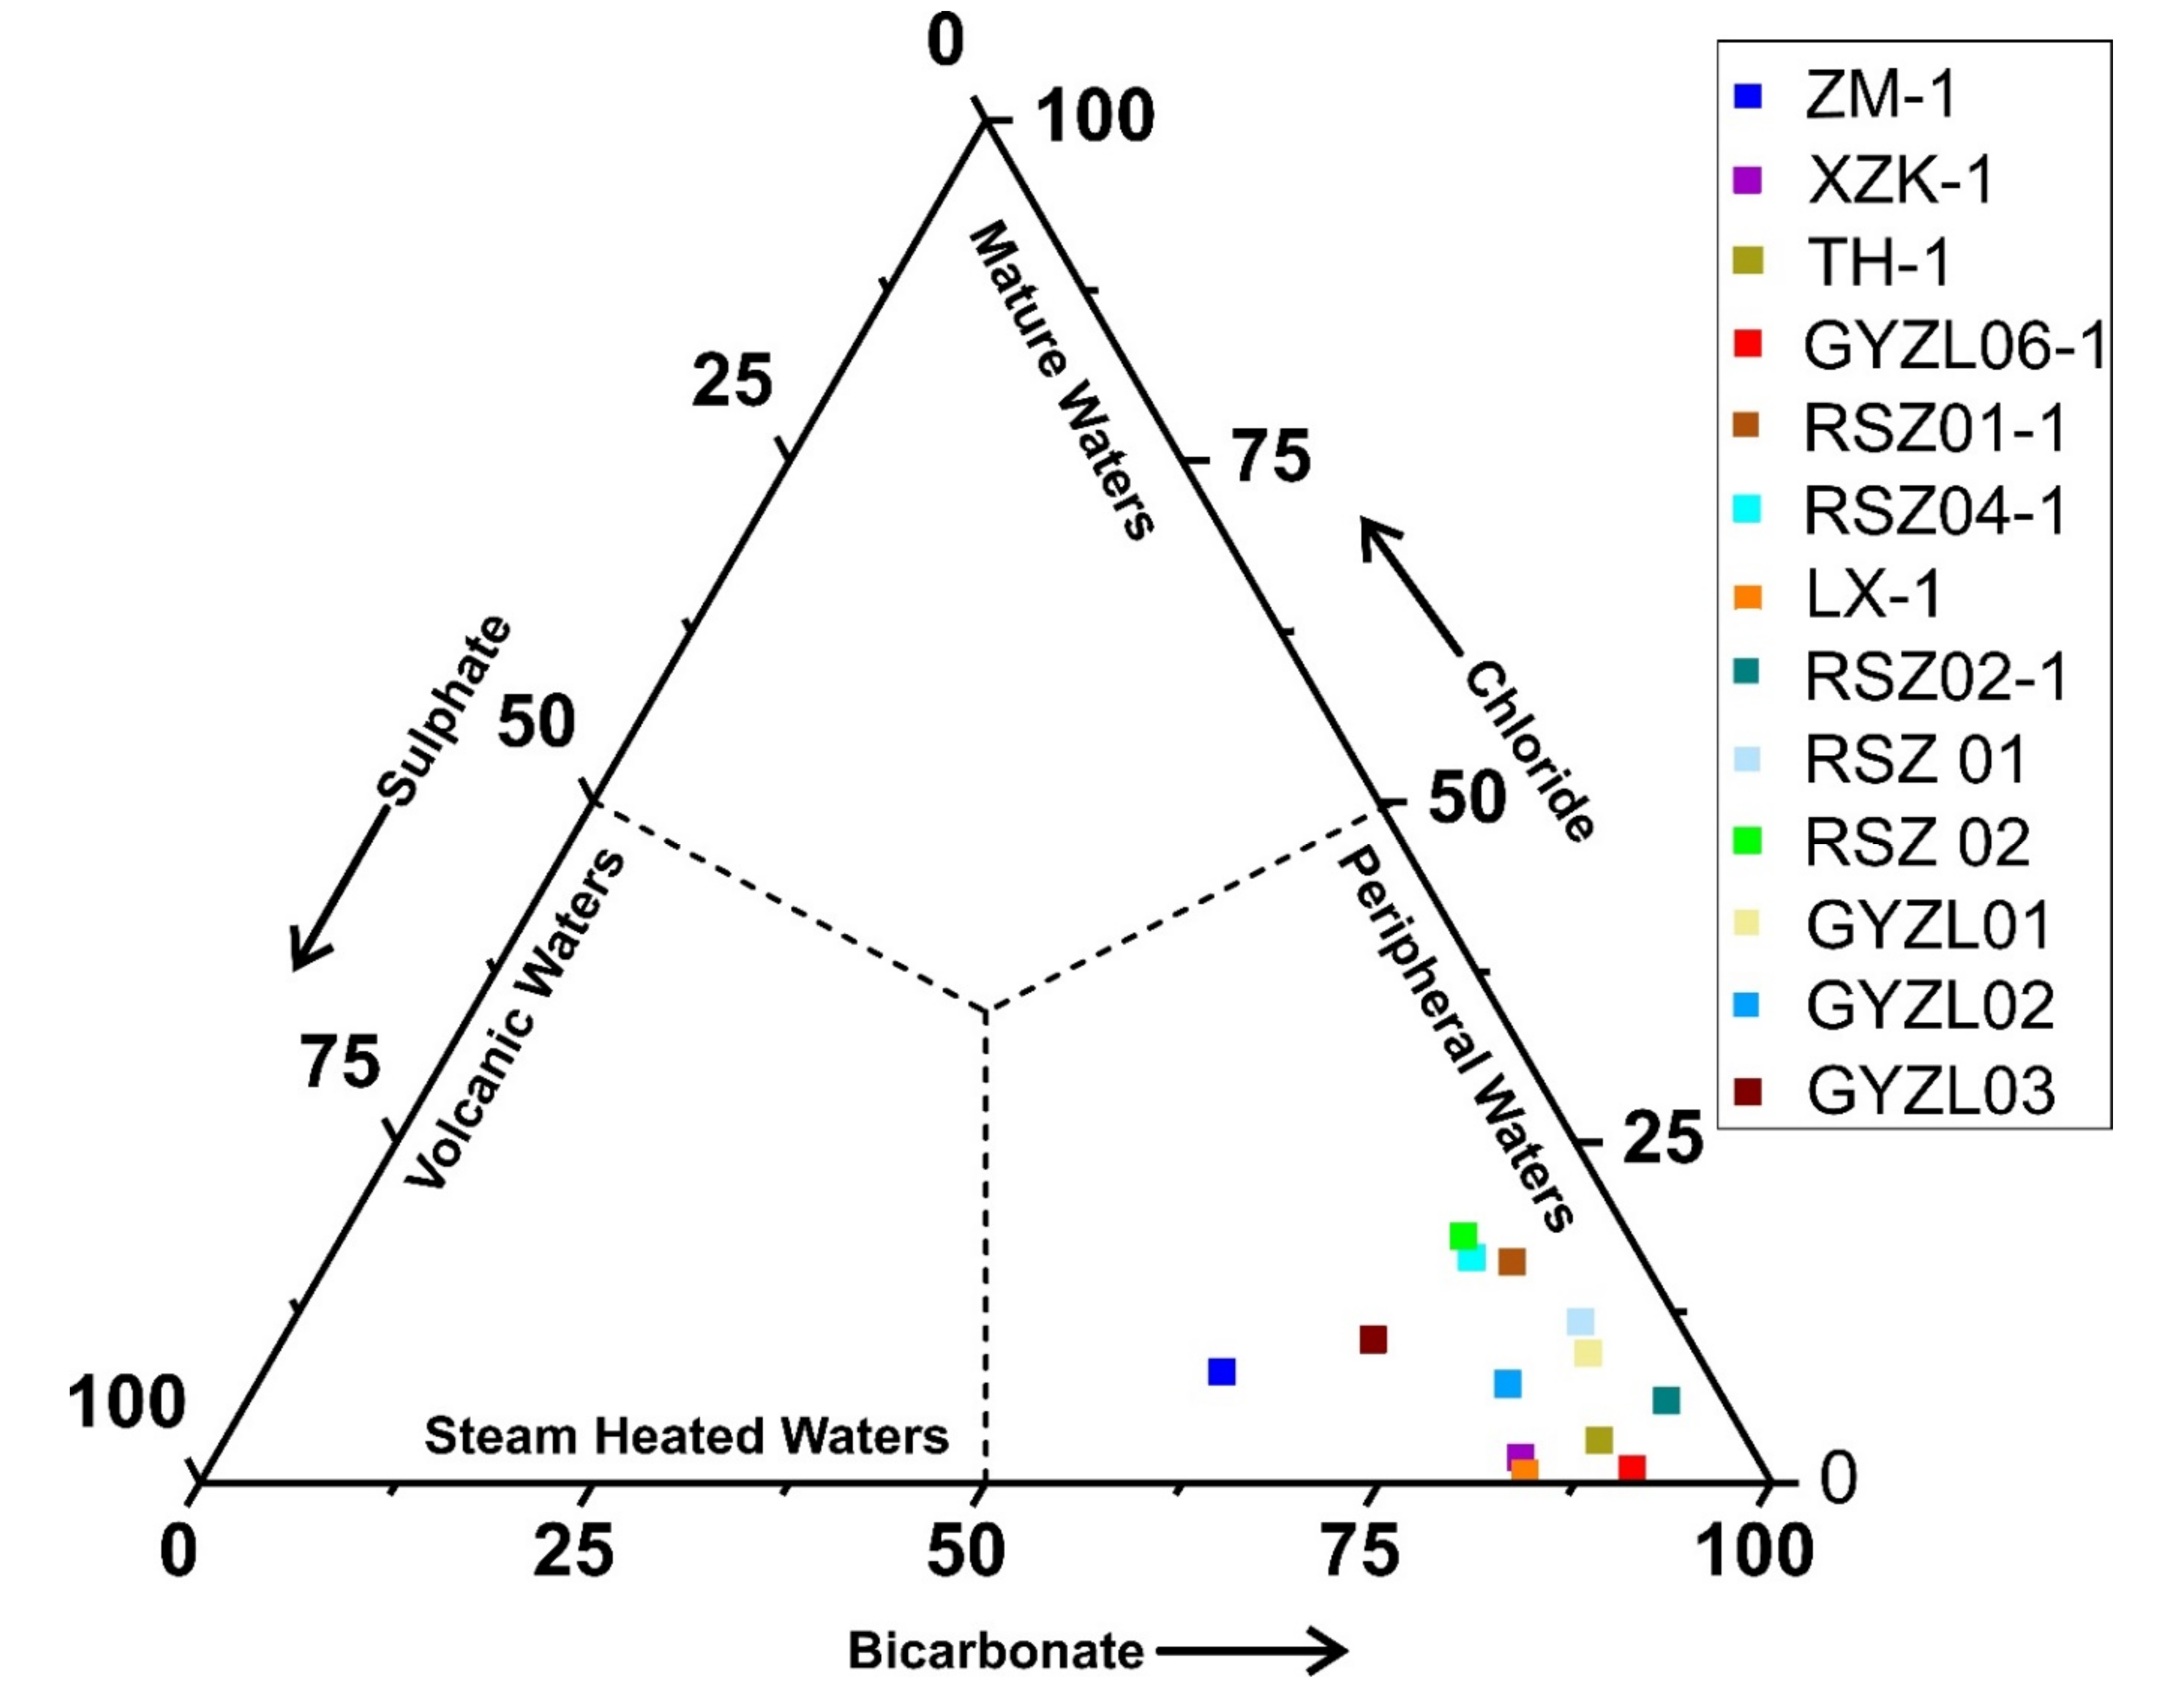
54]. The placement of all the water samples in a triangular plot shows only one dominant water type and that is HCO3 with a low concentration of chlorine (Figure 8). The analysis of the point position comparison among water samples confirms the interference of peripheral water characteristics and it increased up to a considerable level during the process of heat storage to the seepage of the upsurge of underground hot water and it is thus speculated that the mixing effect is enhanced.
There are no signs of volcanic or magmatic water origin or mixing due to the lack of notable δ18O, δD content, which is +6 to +9‰ and −40 to −80‰ in the case of magmatic water, respectively [12]. These facts confirm the meteoric origin of the Suichuan geothermal waters. Oxygen shift regarding geothermal waters is promoted by the duration of contact [55]. In the present study, there was no significant phenomena observed, and the degree of closeness with no sample falling below the meteoric water lines excluded the probability of “oxygen-18 shift”.

4.3. Reservior Temperature

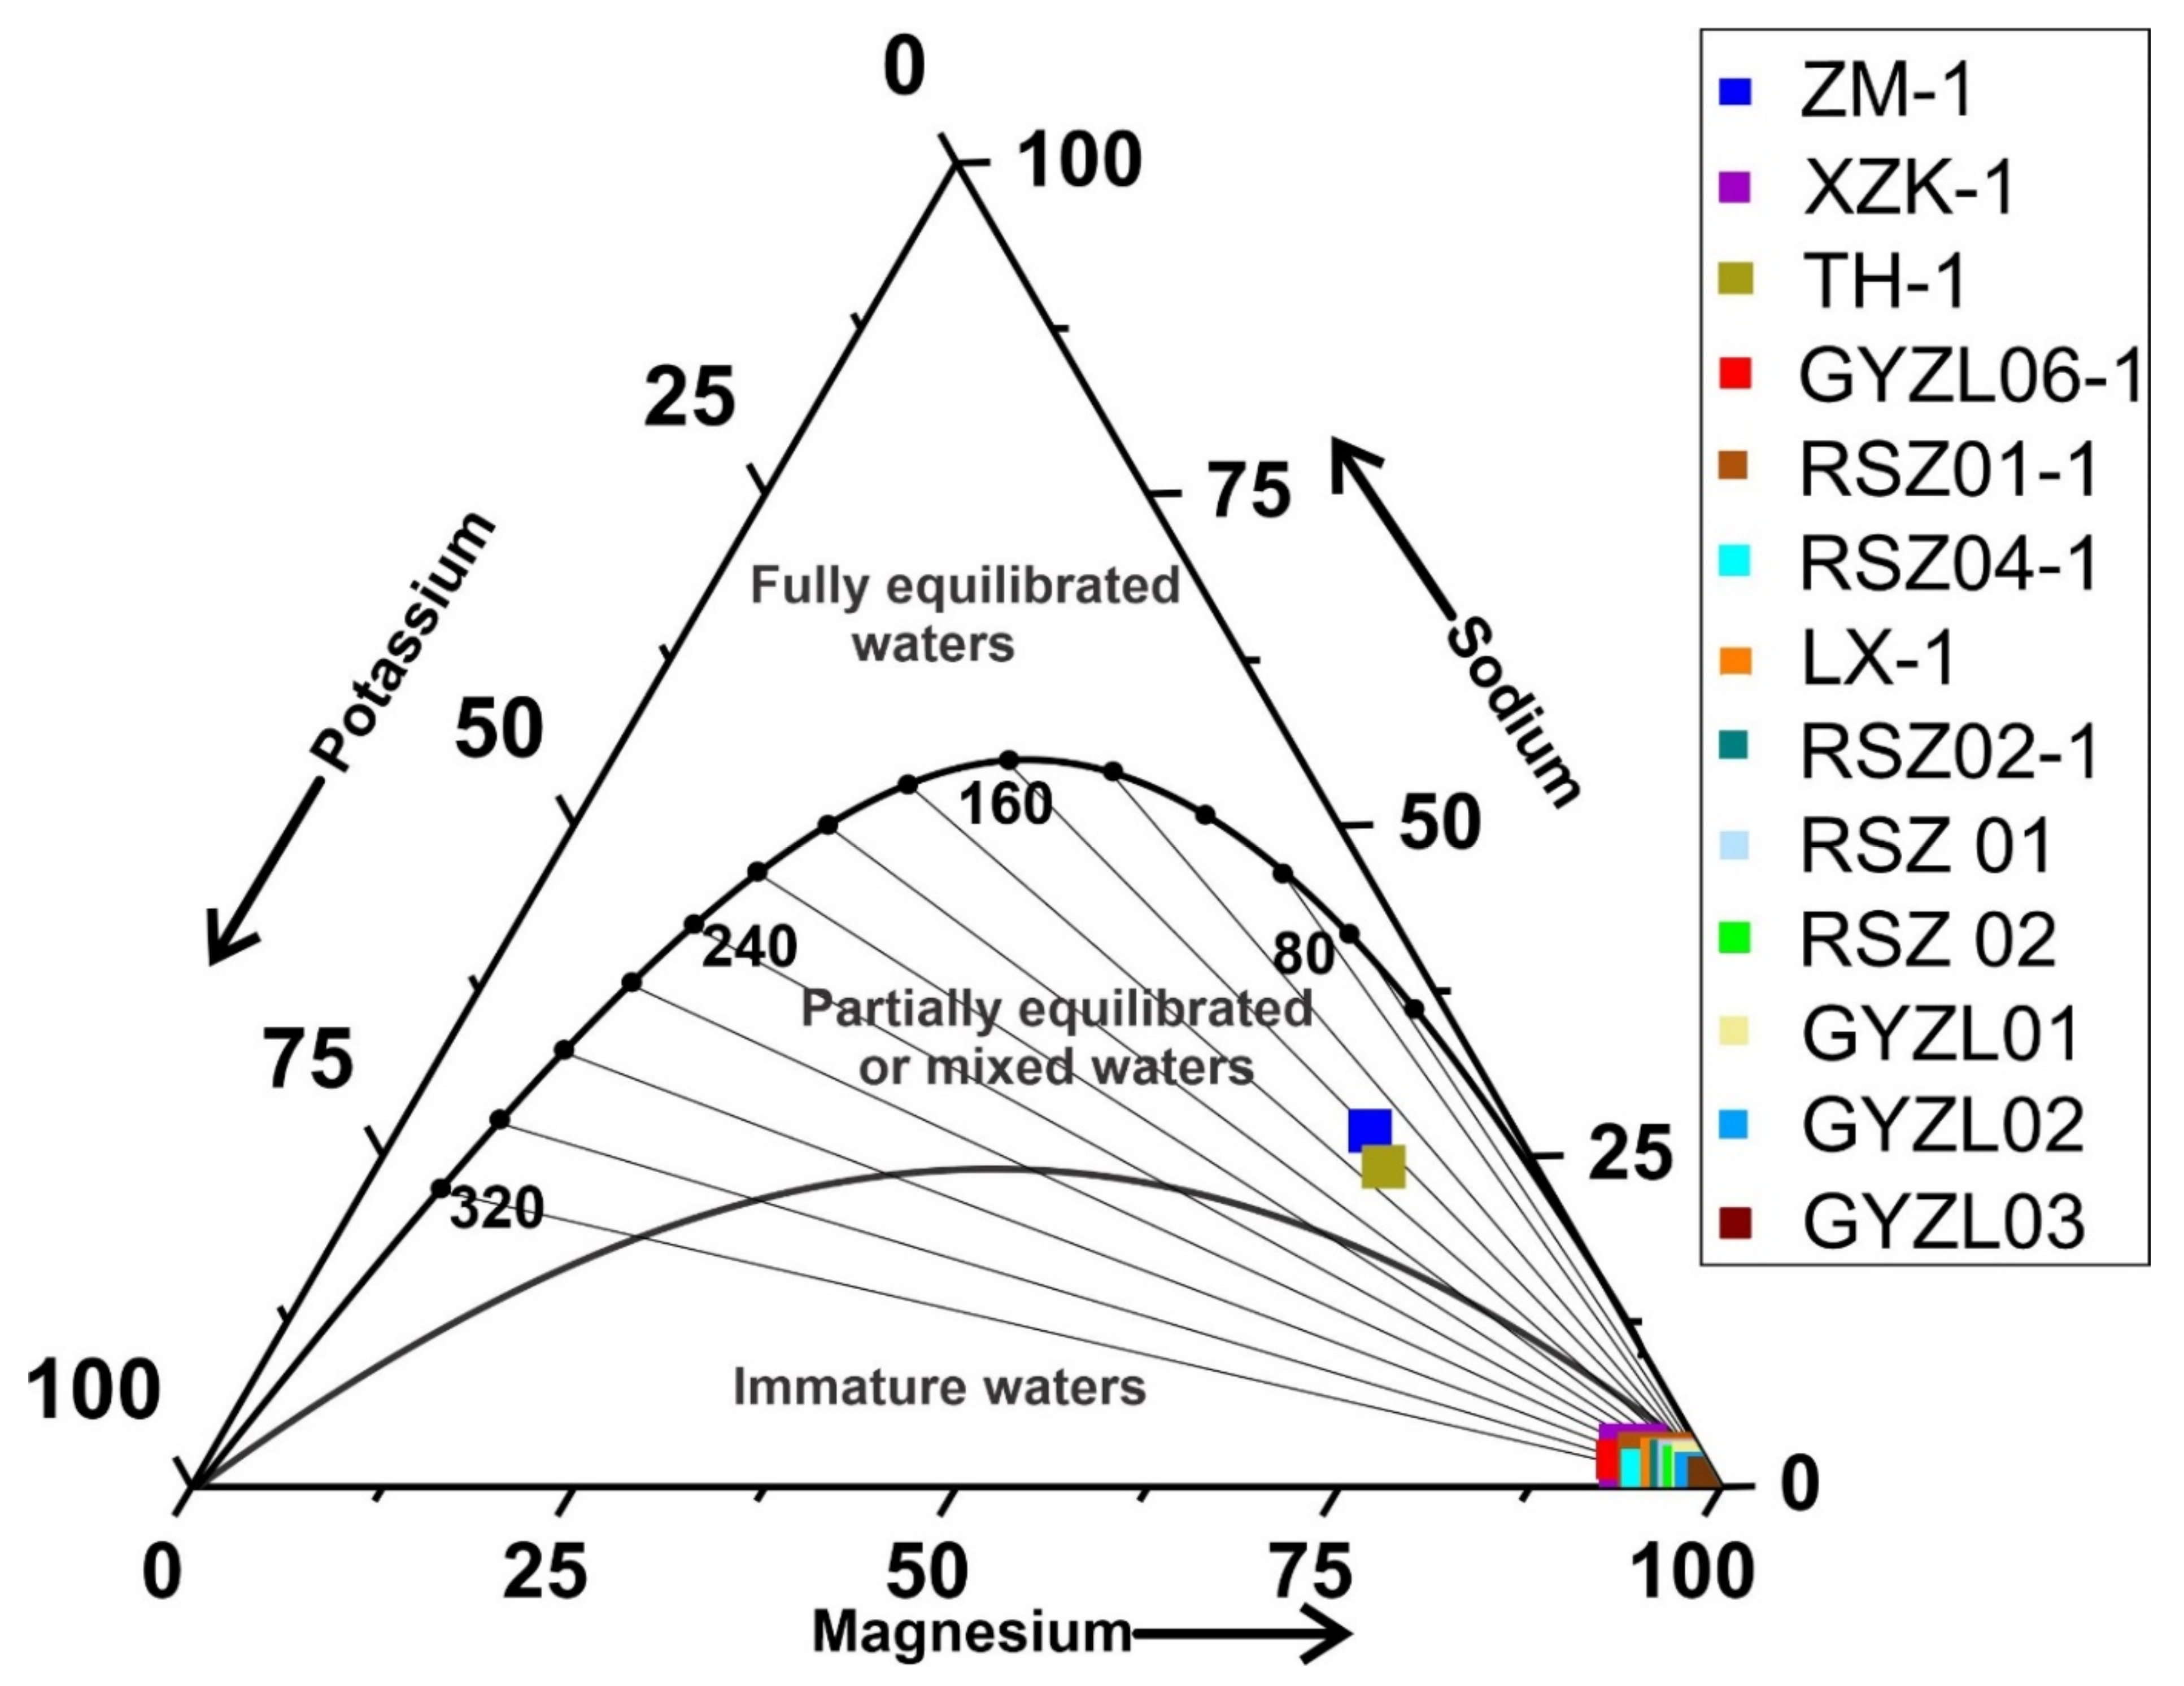
The Na-K-Mg diagram was used to assess the equilibrium condition between water and fluid-rock interaction, the degree of mixing, and the suitability of hydrothermal groundwater for geothermometry to measure reservoir temperature (Figure 9) [25]. Except two of the geothermal waters, the rest of all the water samples fall at the extreme right corner of the triangular plot showing that they are “immature waters”. The immaturity or disequilibrium of water samples showed the possible mixing with shallow cold water, rapid flow speed, and shallow depth of circulation [56]. The mixing might have been triggered by the processes of hydrogen metasomatism, minor peripheral neutralization of CO2, and also the involvement of potassium metasomatism as thermal water rises to the ground surface [2]. ZM-1 and TH-1 are located in the partially equilibrated zone, showing that they did not achieve complete equilibrium due to the dilution process or perhaps because of the weak degree of water-rock interactions [57]. These thermal water samples indicate “mature waters”, showing that they have not experienced significant mixing processes that could have resulted in notable alterations in chemical contents. The presence of carbonate rock types indicate the use of a Ca/Mg geothermometer because carbonate-evaporite rocks are the host of a distinct environment [58]. The comparison of the results of the Ca/Mg geothermometer with the other geothermometers would provide a different approach to study the aqueous environments. However, in the present study, cations and silica geothermometers are applied to estimate the reservoir temperatures at which thermal groundwater last equilibrated with the surrounding environment. The application of chemical geothermometers accounted for a distinct range of temperatures. Different geothermometers calculated various temperature values (Table 5), which are the signatures of different mineral phases. The range of reservoir temperature estimated by using the Na-K geothermometer was 700 °C to 8867 °C, which is extremely high. This thermometer is not suitable for the present study, as it depends on the Na/K ratios that rely on the dissolution balance of albite and k-feldspar minerals, usually in the case of high temperature geothermal systems while for low temperature reservoirs this ratio is dependent on the dissolution of host rock types [59]. Few of the temperature calculations using chalcedony are lower than that of the measured temperatures. Therefore a chalcedony thermometer was not considered. Quartz and improved silica geothermometers show quite reasonable estimations, except that one of the samples yielded a lower temperature than the measured value. Because a quartz geothermometer using between the temperature range 150–225 °C might provide reliable results [23] and improved SiO2 show an error of about 2–3% when the temperature range is 20–210 °C [24]. The silica content is low because of the mixing effect between thermal and cold waters, therefore its estimations are the minimum reservoir temperatures.
In the hydrothermal environment, the lithium content is likely scarce because it acts as a “soluble element”, and therefore the Na/Li ratio is barely altered during the upward flow of thermal fluids showing reasonable estimations [26]. An Na-Li thermometer may provide a good range of deep temperatures, but in comparison with other thermometers, it can be concluded that this geothermometer yielded slightly higher reservoir temperatures. The temperature evaluation by Na-K-Ca-Mg falls between 94.80 °C and 120.35 °C, which are reasonable measurements probably showing no signatures of mixing activities. The temperature calculations carried out by the K-Mg geothermometer are within the scope of the present study because this geothermometer applies to medium-low geothermal fields, but the minimum involvement of clinochlore in chlorites might cause oddness in reservoir temperatures [60]. K/Mg temperature estimations show that Na and Ca did not achieve water-rock equilibrium as well as revealing the fact that thermal water during the upward flow to the surface has not experienced any fluid-rock equilibrium reactions [61].
The circulation depth influences the different salient features of hydrothermal systems. It can bring significant abnormalities in deep reservoir temperatures and the concentration of different solutes. It is one of the most reliable and important criteria that estimates the hydrothermal reservoir potential, the origin of thermal groundwater, and also the mechanism of the formation of hydrothermal water resources. The maximum circulation depth was estimated for RSZ04-1 locality (Table 6).

4.4. Mineral Saturation Dynamics

Usually the decrease in the temperature of hydrothermal waters due to mixing with shallow waters or the decline in pressure possibly creates an appropriate environment for the precipitation of different minerals like carbonates, sulfate silicates, and others [10]. The thermodynamic equilibrium saturation index is a standard that shows the possible saturation or precipitation attributes of an aqueous and terrestrial environment based on hydrochemical parameters [62]. Furthermore, it defines whether the water is corrosive or can cause scaling. The range that explains this phenomenon is −0.3 to +0.3. Water, having a saturation index of less than −0.3, will be corrosive and above +0.3 it will cause scaling that in turn creates a huge problem in the exploitation and utilization of thermal waters. The graphical representation in (Figure 10) and (Table 4) for thermal water saturation indices (Anhydrite, Aragonite, Calcite, Dolomite, Fluorite, Gypsum, and Halite) showed the unsaturation state of the respective water samples, as most of the minerals are distributed below the equilibrium line. The water sample XZK-1 might have corrosive characteristics concerning fluorite minerals, as it falls very close to the equilibrium standard line. This reveals the maximum chances of F to release from fluorite into the deep circulation of underground hydrothermal fluids [7]. Similarly, notable variations have been observed in RSZ04-1, as it yields the characteristics of the supersaturation of aragonite, calcite, and dolomite minerals and an estimated SI of >+0.3, which can cause scaling problems. The present situation explains the dominance of certain environments that confirm the abundance of these carbonate minerals, as its concentration in natural waters is a function of dissolved carbon dioxide, temperature, pH, cations, and other dissolved salts.
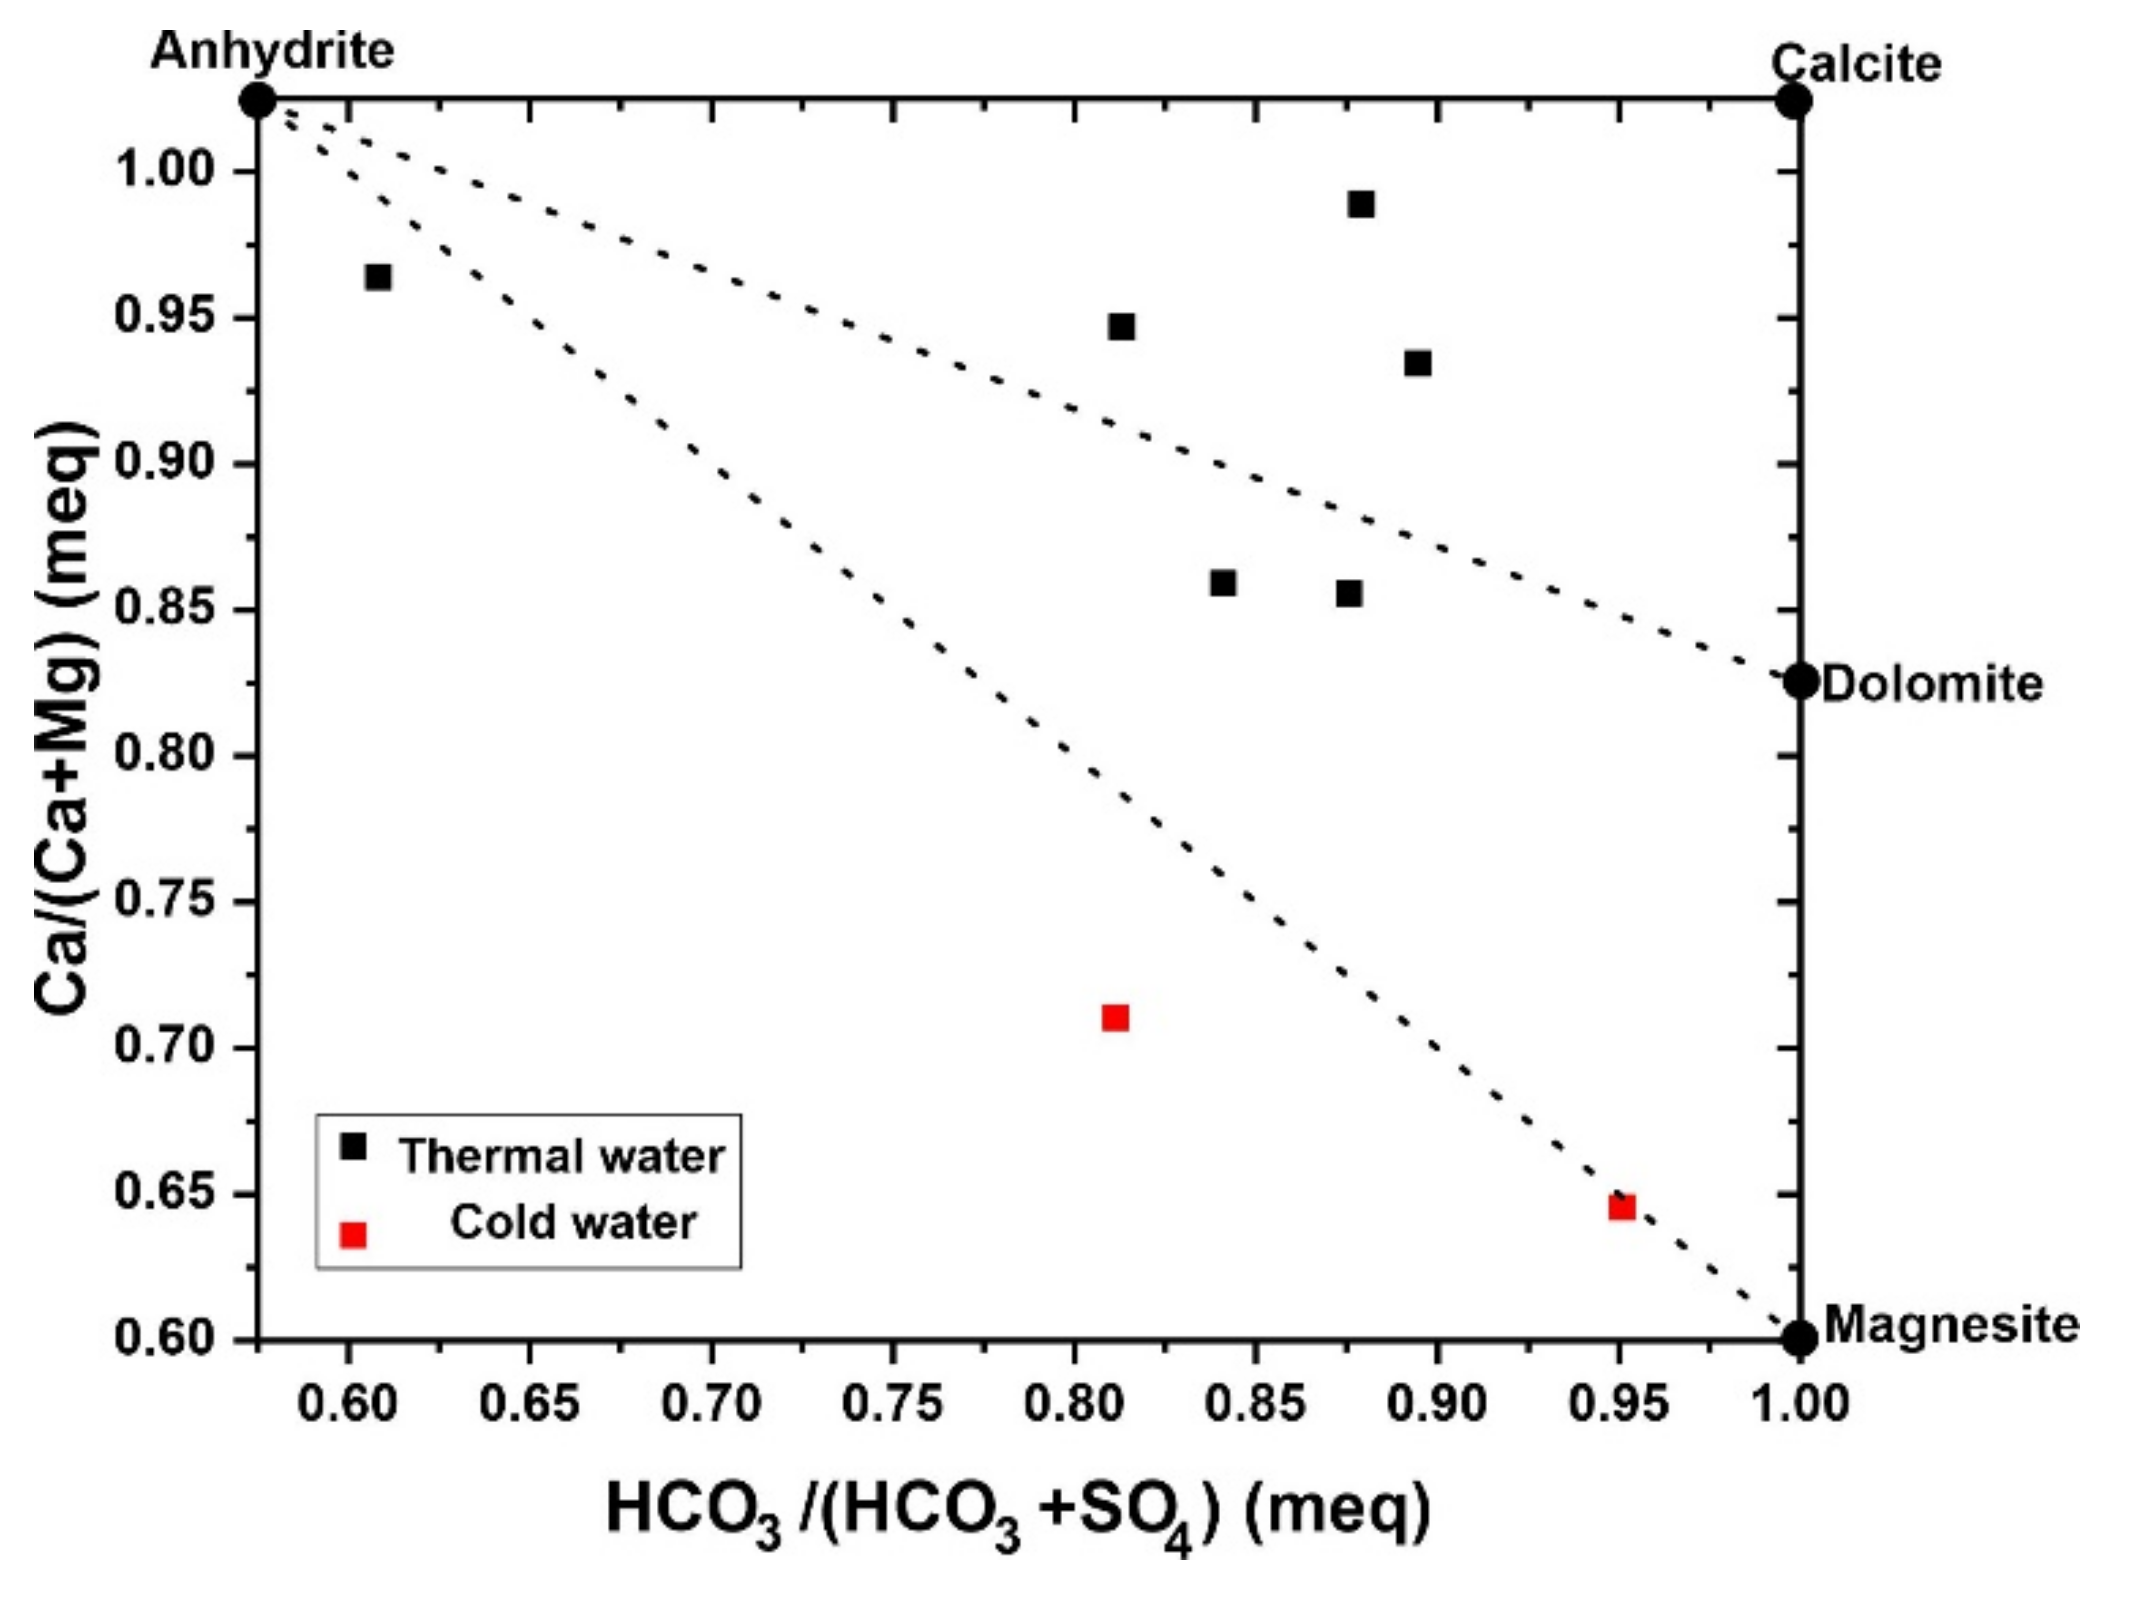
In (Figure 11), most of the thermal waters are dispersed near dolomite and calcite tie lines, showing the dissolution process of carbonate rocks [63], whereas thermal water located near the anhydrite corner indicates the dominance of evaporite minerals [64].
Because the environment in which sediments rich in anhydrite and gypsum deposits exist, it is quite possible that aragonite and calcite would be precipitated [66]. As these saturation indices, dominant carbonate (CaCO3) forms, and the studies proved that they can reveal crucial and significant information concerning their environment including pH, dissolved Ca2+, and other inorganic carbon (IC) as well [67]. The infiltration and groundwater flow dissolve CaCO3, and Ca-Mg(CO3)2 minerals and increase the Ca2+ and Mg2+ concentration in the ground water. (
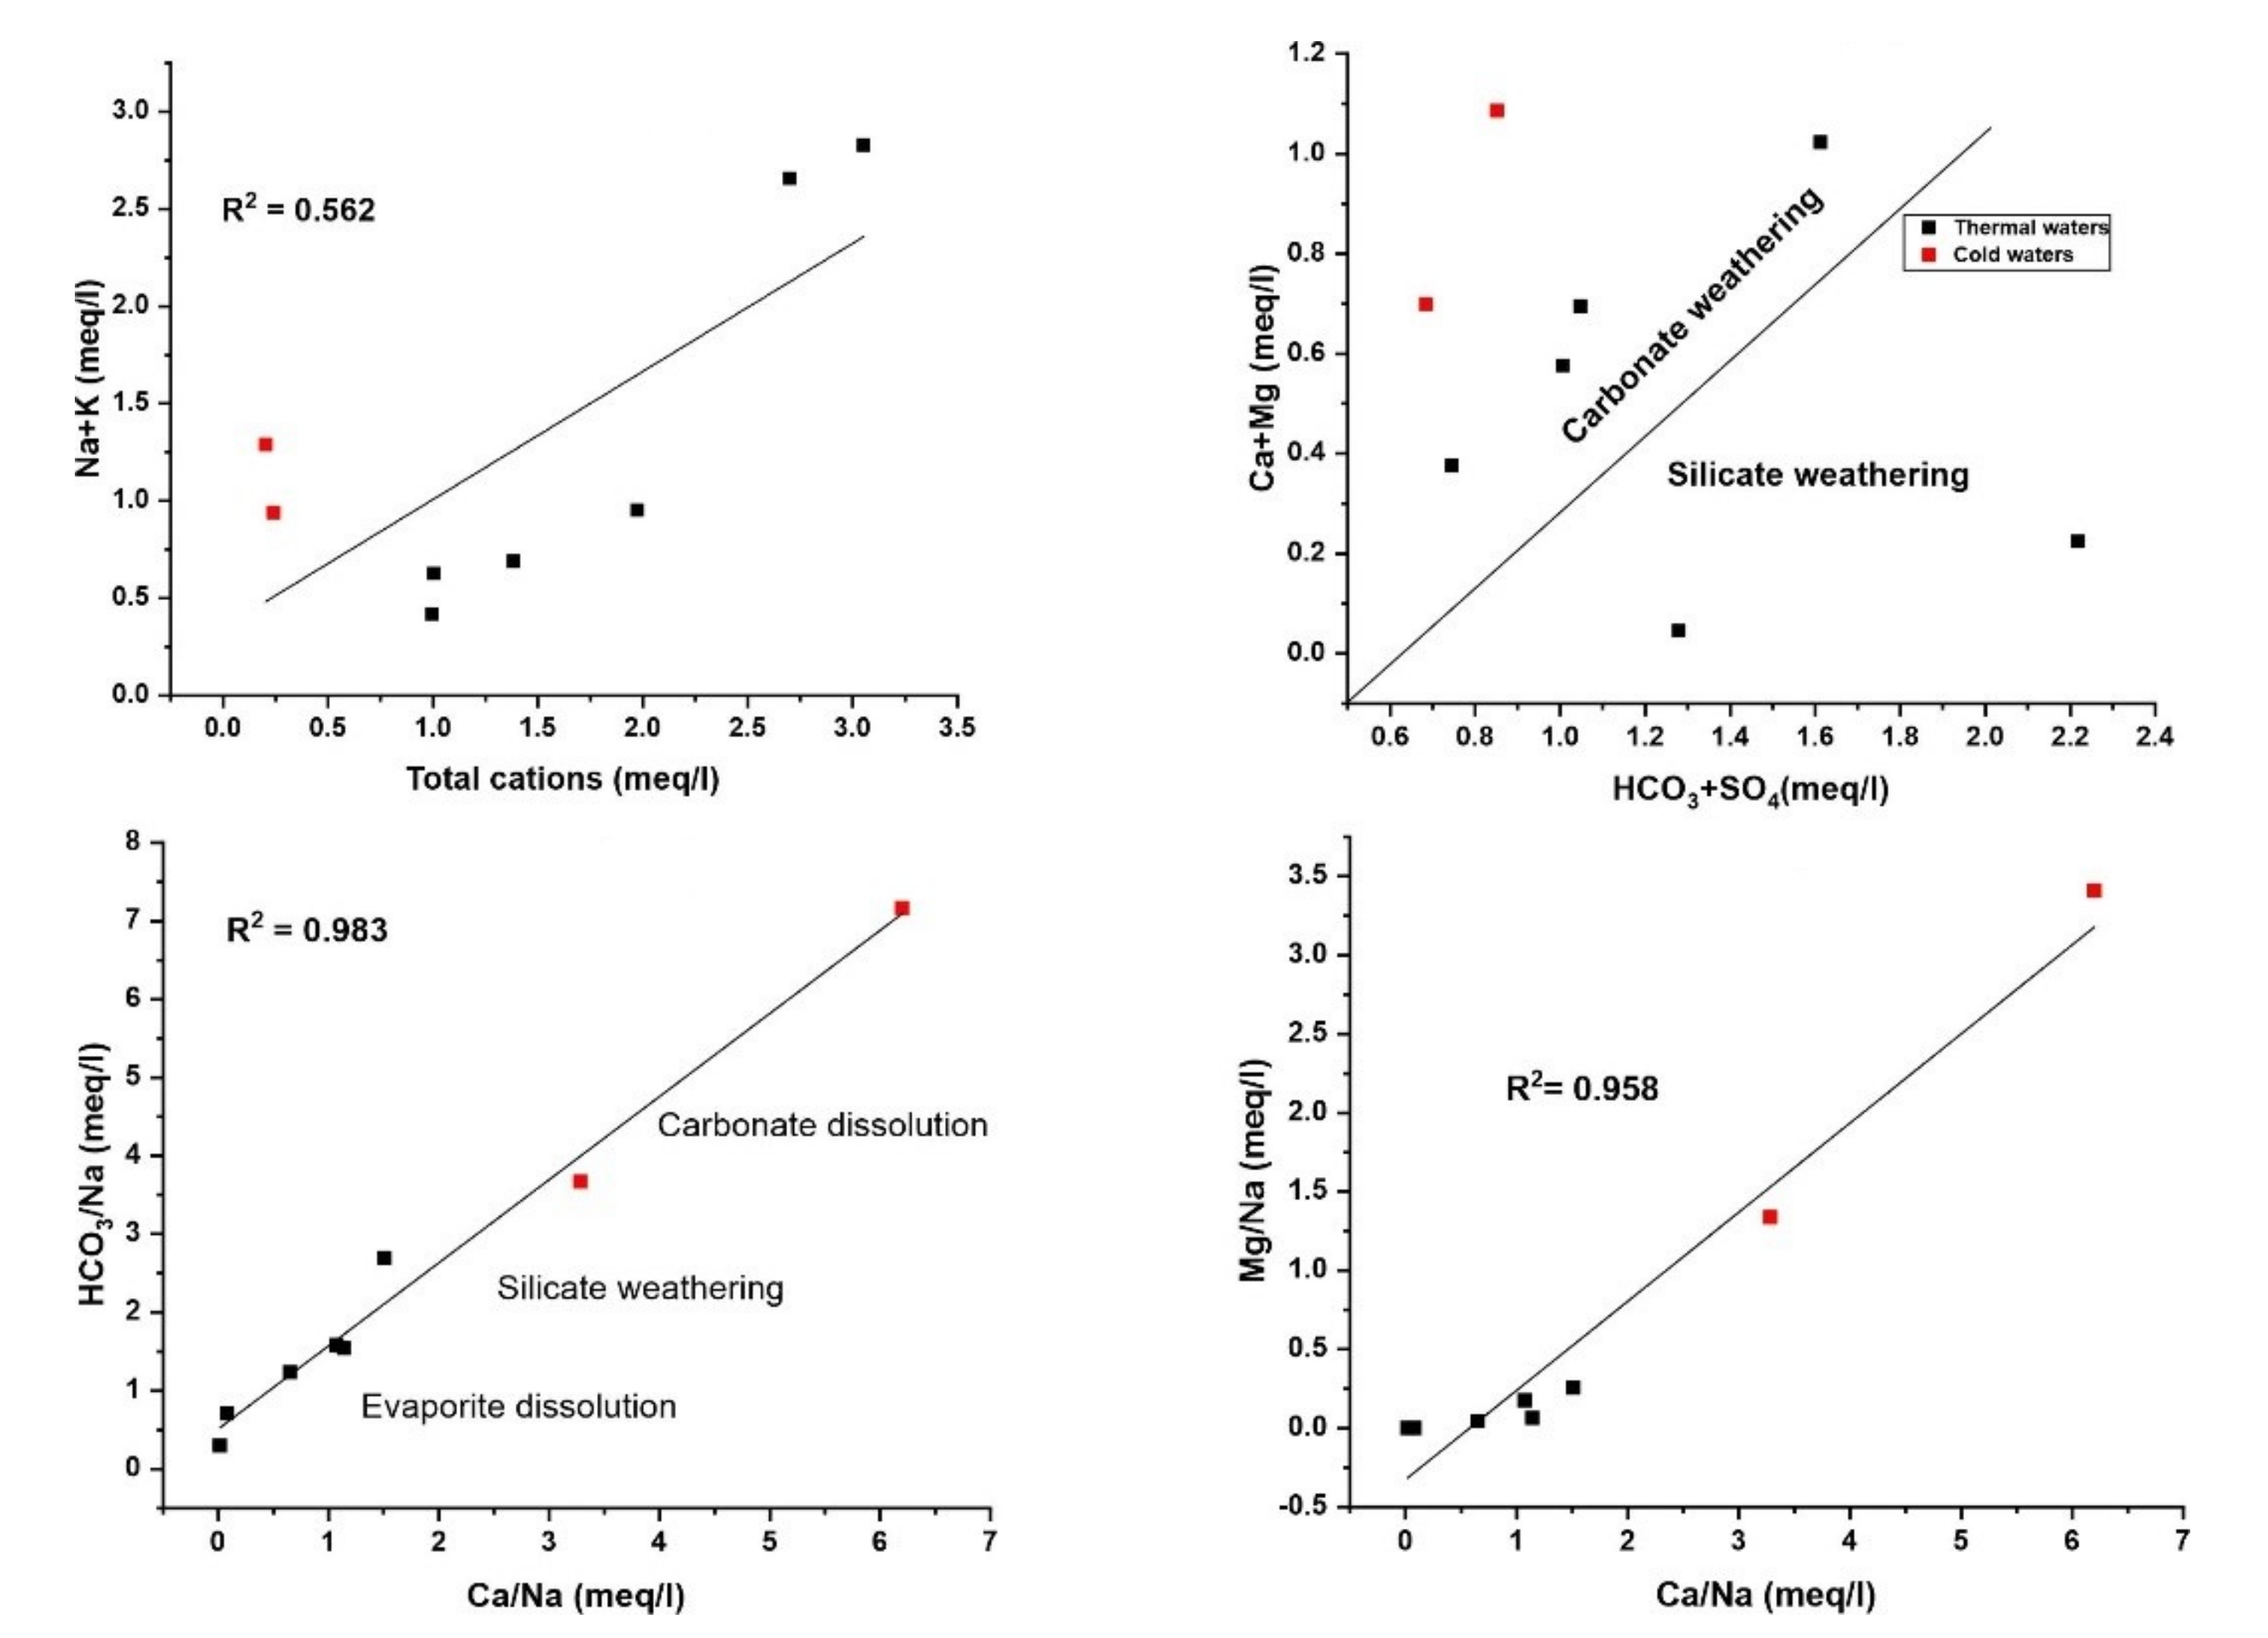
Figure 12) [68] described that the water samples located above the equiline reveal the carbonate weathering, while those along the line show both carbonate and silicate weathering. The following equations illustrate the mechanism of Ca2+ and Mg2+ release in the water system:
Ca2+ + HCO3 → CaCO3 + H+
CO2 + H2O → H2CO3 (Weak carbonic acid)
CaCO3 + H2CO3 → Ca++ + 2H2CO3 (Calcite dissolution)
CaMg(CO3)2 + 2 H2CO3 → Ca++ + Mg++ + 4HCO3
The water samples fall below the equiline determined silicate weathering and evaporite dissolution. Thus, carbonate silicate weathering, and evaporite dissolution represent the prime source of Ca2+ and Mg2+ in the ground waters. The carbonate weathering resulting from the interaction of water and CO2 is an intensive process. Moreover, it can trigger Ca2+, Mg2+ and HCO3 in the surrounding water.
The correlation between the estimated water temperature and calculated saturation indices is insignificant. Due to weak fluid-rock activity, most of the thermal and cold ground waters are unsaturated. The estimation of SIs reveal the existence of fairly different hydrological conditions at quite considerable depth.

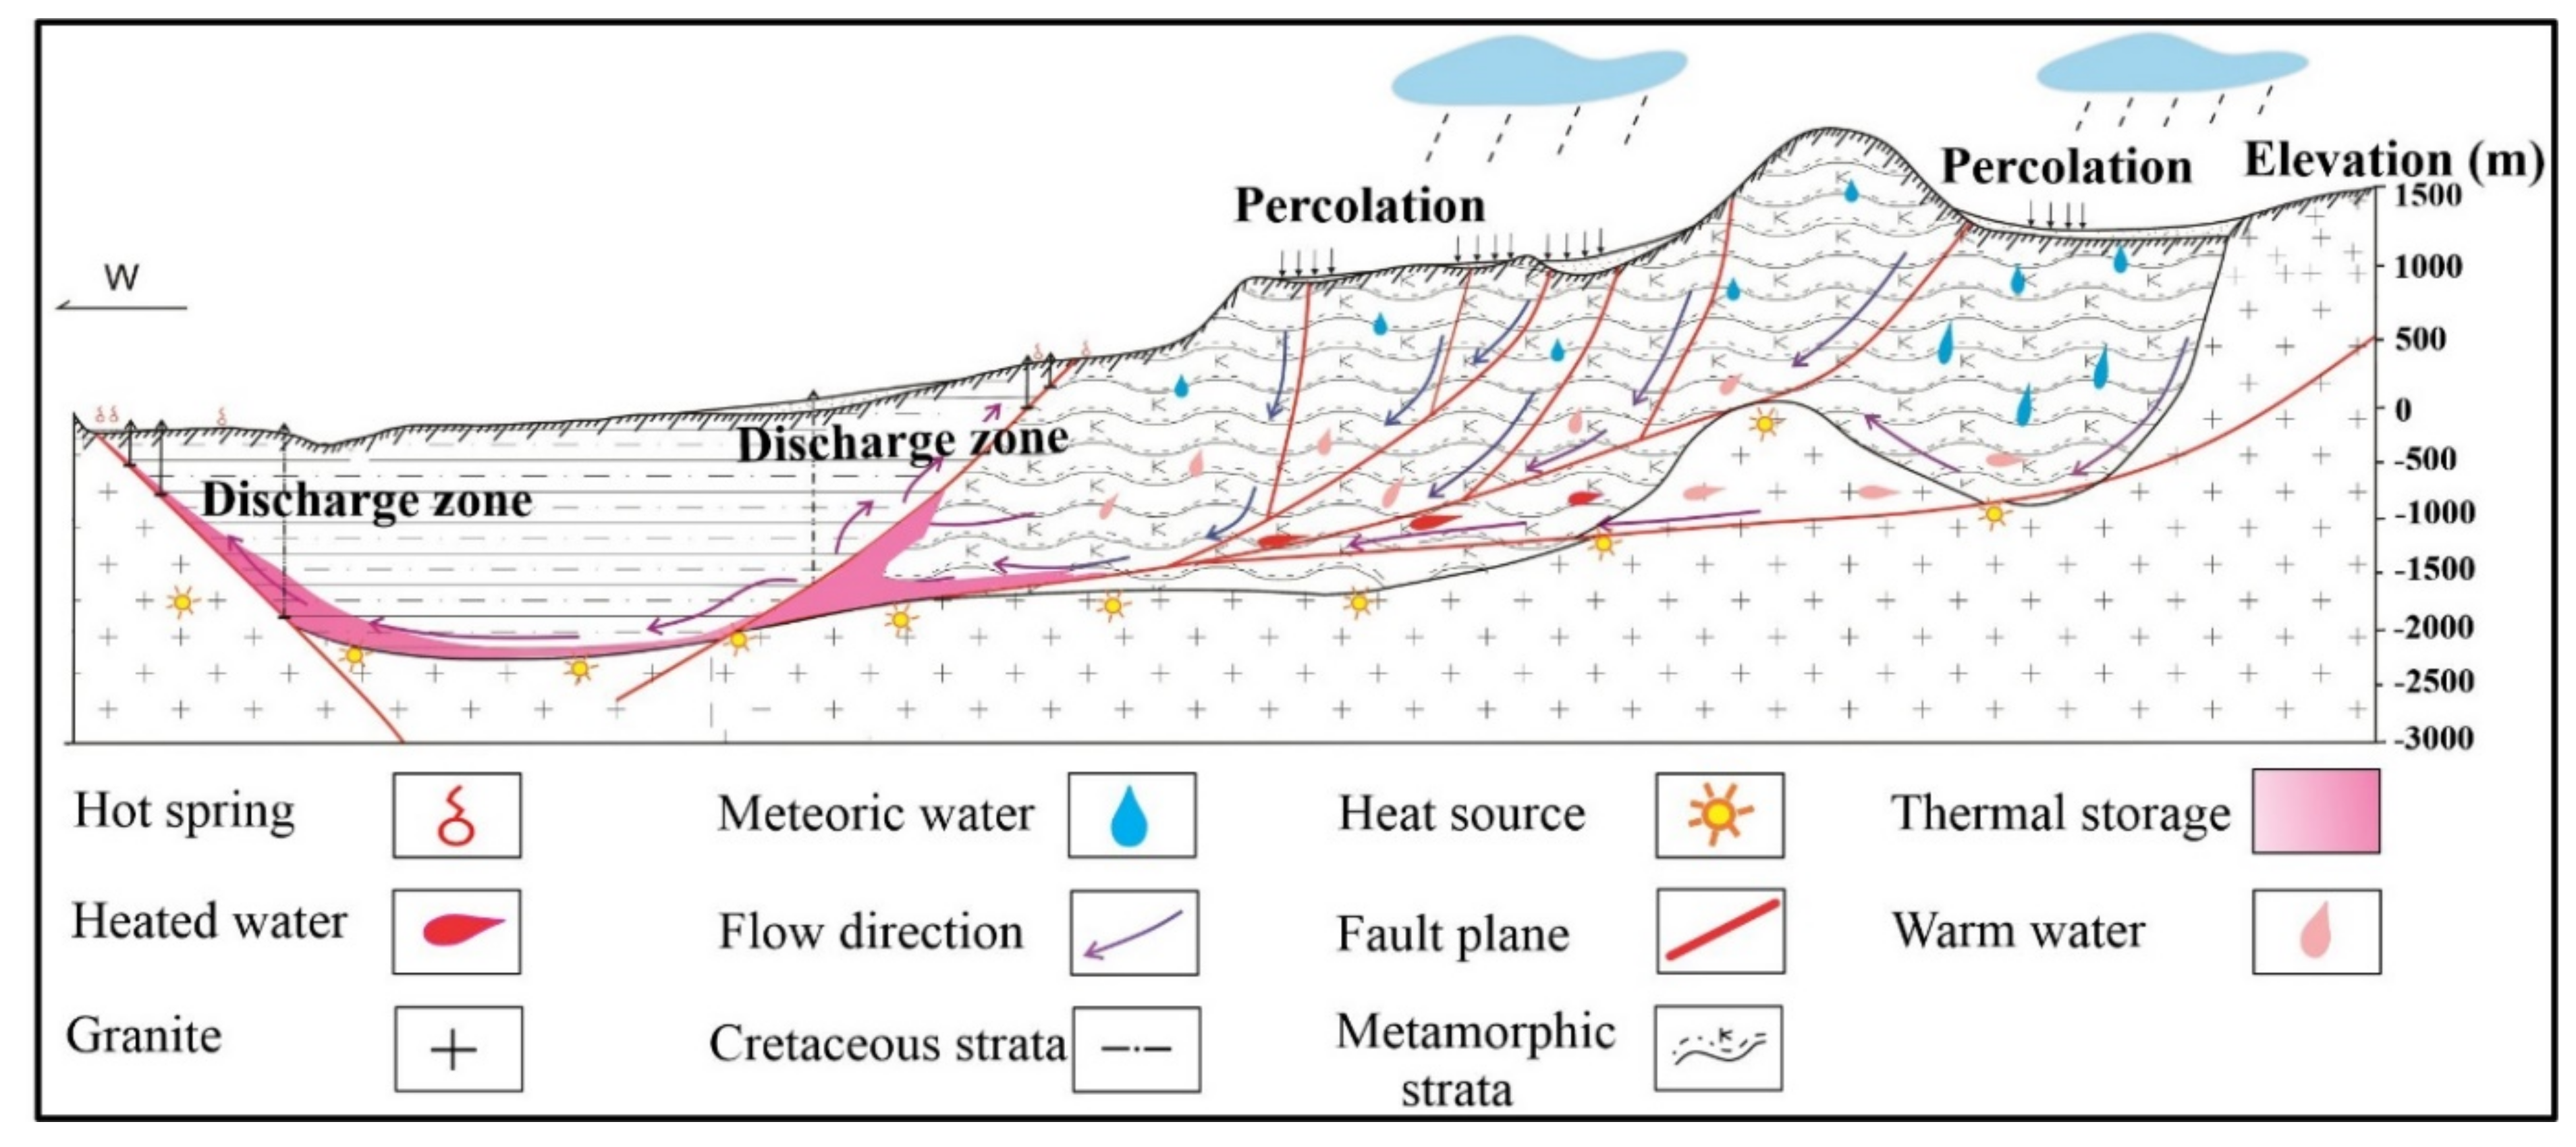
4.5. Circulation Mechanism and Genetic Model

The underground thermal fluid circulation of the Suichuan geothermal field (Figure 13) is explained by combining the tidal response with hydrochemistry and isotopic characteristics. The tidal oscillations could be detectable in aquifers because of the existence of the solid earth tide [69]. The tidal forces generate pressure affecting the orientation of fractures that develop as a result of fault slip [70].
The most likely source of geothermal fluids is meteoric water that adopted a considerable deep circulation cycle as per the hydrochemical and stable isotopic data. The near dispersion of isotopic data along meteoric water lines confirms that no significant evaporation was observed before percolation [71]. During infiltration, meteoric water came into contact with the surrounding rocks and dissolved various chemical elements, and gained its heat from surrounding rock heating and also from a deep heat source. The rise in temperature and pressure takes place with the continuous deep downward flow of meteoric water. The residence time of thermal fluids is minimal, satisfying the low chemical and isotopic concentrations with no “oxygen drift” because the fluid-rock interaction did not give rise to a notable change of δ18O values. The deformed zones developed due to the tectonic stresses caused the change in fault aperture from upper widening to lower narrowing and lower widening to upper narrowing. This process created pressure differences in the surrounding rocks. When contraction takes place, the fractures showed low hydraulic conductance, while the extension causes the cracks to open and to provide a passage conducive to the infiltration of meteoric water [72,73].
The process continues until the groundwater encounters a barrier that hinders its downward migration and it starts flowing along the stratum interface or cross fissures. This cycle continues and, hence, groundwater attains the heat from surrounding rock heating, and the friction among faults and fractures is also a source of heat. However, the major heat source in the region is radioactive granite [74,75]. This is accelerated due to the increasing pressure and resulted in the fluid being discharged from the permeable fractures into the surrounding rocks [76]. Therefore, thermal groundwater dissolving various chemical elements migrated upward from the areas such as tensional structures and zones of high permeability [77,78,79,80], oozing out as hot springs. Based on this mechanism and the hydrochemical results of thermal groundwater, the genetic model in Suichuan has been put forward.

5. Conclusions

From this study, the results have shown that the hydrochemical characteristics of geothermal water were the result of the interaction between the water and the surrounding rock types. Based on the findings, their properties are determined by the composition of surrounding rocks that are in contact with the geothermal water flow. However, the chemical composition has shown an abundance of HCO3 as the main anion. The mixing process is definite and is confirmed by plotting δD and δ18O with Cl-exhibited insignificant correlation. Furthermore, the salinity plots showed that the major ions revealed quite low salinity levels. Furthermore, the short residence time suggested that the chemical concentration was low. The Na/1000-K/100-Mg1/2 diagram has illustrated the overall immaturity of thermal waters while two of the samples showed partial equilibrium behavior. In addition, the cation geothermometers are not appropriate due to the immaturity of most of the water samples. In the present situation, improved SiO2 geothermometers might present the reservoir temperature if the silica content falls within a considerable range. The maximum circulation depth is 2.5 km. Additionally, the use of a Ca/Mg geothermometer can further disclose the fluid-rock processes in the presence of carbonate rocks. Stable isotopic data has shown the meteoric origin of thermal waters, as the δ18O and δD isotopic data lie near the global meteoric water line. On the other hand, the content of salinity and chlorine as well as the distribution of water samples in the peripheral zone excluded the probability of magmatic and oceanic water intrusions. Saturation indices indicated the intense degassing phenomena as well as both scaling and corrosive characteristics. The scatter plots of major cations and anions explained the phenomena of carbonate dissolution and silicate weathering. The minimum trend of dolomite showed no calcite re-precipitation with magnesium and moreover, the lack of saline environment also discards the aragonite re-precipitation. Furthermore, the composition of main and trace components shows that geothermal water is suitable for therapeutic purposes but not suitable for drinking. The circulation of geofluids of meteoric origin exhibiting significant environmental isotopic concentrations, continues under the influence of solid earth tide through fractured and faulted strata. This study showed that the ascending flow of geothermal waters is propelled by pressure and thermodynamic buoyancy, hence the synthesis of our findings in the form of a model demonstrates that the direction of water flow was from east to west.
The findings of present study recommend the importance of prospecting the treatment of high fluoride thermal waters to particularize the exploitation of hydrothermal resources for various domestic and industrial purposes. Moreover, the investigation regarding mineral prospects and ore depositions can play a vital role in terms of the economic development of Suichuan County.

Author Contributions

Writing—original draft, W.A. and C.H.; conceptualization, W.A. and C.H.; methodology, W.A. and C.H.; software, W.A., B.H., A. and H.H.; formal analysis, W.A., J.H. and W.H.; investigation, W.A., W.C. and S.F.; resources, C.H., X.W. and X.B.; data curation, W.A.; review and editing: C.H., W.C. and A.; visualization, C.H., W.H. and S.H.; supervision, C.H. and W.C. All authors have read and agreed to the published version of the manuscript.

Funding

This research was funded by the Project of China Geological Survey (No. DD20211391), Jiangxi Geological Exploration Fund Project (No. 20160007) and Wuhan Multi factor Urban Geological Survey demonstration Project (No. WHDYS-2021-005).

Institutional Review Board Statement

Not applicable.

Informed Consent Statement

Not applicable.

Data Availability Statement

The data presented in this study are available on request from the first or corresponding authors.

Conflicts of Interest

The authors declare that they have no conflicts of interest.

References

  1. Ellabban, O.; Abu-Rub, H.; Blaabjerg, F. Renewable energy resources: Current status, future prospects and their enabling technology. Renew. Sustain. Energy Rev. 2014, 39, 748–764. [Google Scholar] [CrossRef]
  2. Giggenbach, W.F.; Glover, R.B. Tectonic regime and major processes governing the chemistry of water and gas discharges from the rotorua geothermal field, New Zealand. Geothermics 1992, 21, 121–140. [Google Scholar] [CrossRef]
  3. Craw, D.; Chamberlain, C.P.; Zeitler, P.K.; Koons, P.O. Geochemistry of a dry steam geothermal zone formed during rapid uplift of Nanga Parbat, northern Pakistan. Chem. Geol. 1997, 142, 11–22. [Google Scholar] [CrossRef]
  4. Xilai, Z.; Armannsson, H.; Yongle, L.; Hanxue, Q. Chemical equilibria of thermal waters for the application of geothermometers from the Guanzhong basin, China. J. Volcanol. Geotherm. Res. 2002, 113, 119–127. [Google Scholar] [CrossRef]
  5. Deng, Y.; Nordstrom, D.K.; McCleskey, R.B. Fluoride geochemistry of thermal waters in Yellowstone National Park: I. Aqueous fluoride speciation. Geochim. Cosmochim. Acta 2011, 75, 4476–4489. [Google Scholar] [CrossRef]
  6. Bouchaou, L.; Warner, N.R.; Tagma, T.; Hssaisoune, M.; Vengosh, A. The origin of geothermal waters in Morocco: Multiple isotope tracers for delineating sources of water-rock interactions. Appl. Geochem. 2017, 84, 244–253. [Google Scholar] [CrossRef]
  7. Pasvanoğlu, S. Genesis of thermal waters from the Taşkesti-Sarıot geothermal prospect in Mudurnu (Bolu, NW Turkey). Geothermics 2021, 96, 102199. [Google Scholar] [CrossRef]
  8. Oyuntsetseg, D.; Ganchimeg, D.; Minjigmaa, A.; Ueda, A.; Kusakabe, M. Isotopic and chemical studies of hot and cold springs in western part of Khangai Mountain region, Mongolia, for geothermal exploration. Geothermics 2015, 53, 488–497. [Google Scholar] [CrossRef]
  9. Xun, Z.; Bin, F.; Haiyan, Z.; Juan, L.; Ying, W. Isotopes of deuterium and oxygen-18, in thermal groundwater in China. Environ. Geol. 2009, 57, 1807–1814. [Google Scholar] [CrossRef]
  10. Aydin, H.; Karaku, H.; Mutlu, H.; Karakuş, H.; Mutlu, H. Hydrogeochemistry of geothermal waters in eastern Turkey: Geochemical and isotopic constraints on water-rock interaction. J. Volcanol. Geotherm. Res. 2020, 390, 106708. [Google Scholar] [CrossRef]
  11. Huang, C.S.; Hou, B.Q.; Yi, C.Y.; Li, L.; Zhang, S.N.; Zhou, Y.; Waseem, A.; Wang, F.T. Discussion on the formation conditions of geothermal water in southern Jiangxi province and the target area of geothermal water exploration in Ganxian district. South China Geol. 2021, 37, 64–74. (in Chinese). [Google Scholar] [CrossRef]
  12. Ahmad, M.; Rafiq, M.; Iqbal, N.; Akram, W.; Tasneem, M.A.; Ali, M. Investigation of major geothermal fields of Pakistan using isotope and chemical techniques. In Proceedings of the World Geothermal Congress, Antalya, Turkey, 24–29 April 2005. [Google Scholar]
  13. Zhang, Y.; Zhou, X.; Liu, H.; Yu, M.; Hai, K.; Tan, M.; Huo, D. Hydrogeochemistry, geothermometry, and genesis of the hot springs in the Simao Basin in southwestern China. Geofluids 2019, 2019, 7046320. [Google Scholar] [CrossRef] [Green Version]
  14. Yang, P.; Cheng, Q.; Xie, S.; Wang, J.; Chang, L.; Yu, Q.; Zhan, Z.; Chen, F. Hydrogeochemistry and geothermometry of deep thermal water in the carbonate formation in the main urban area of Chongqing, China. J. Hydrol. 2017, 549, 50–61. [Google Scholar] [CrossRef]
  15. Qiu, X.; Wang, Y.; Wang, Z.; Regenauer-Lieb, K.; Zhang, K.; Liu, J. Determining the origin, circulation path and residence time of geothermal groundwater using multiple isotopic techniques in the Heyuan Fault Zone of Southern China. J. Hydrol. 2018, 567, 339–350. [Google Scholar] [CrossRef]
  16. Wang, G.; Li, K.; Wen, D.; Lin, W.; Lin, L.; Liu, Z.; Zhang, W.; Ma, F.; Wang, W. Assessment of geothermal resources in China. In Proceedings of the Thirty-Eighth Workshop on Geothermal Reservoir Engineering Stanford University, Stanford, CA, USA, 11–13 February 2013. [Google Scholar]
  17. Zhang, X.; Hu, Q. Development of geothermal resources in China: A review. J. Earth Sci. 2018, 29, 452–467. [Google Scholar] [CrossRef]
  18. Hu, Y.; Liu, Z.; Ford, D.; Zhao, M.; Bao, Q.; Zeng, C.; Gong, X.; Wei, Y.; Cai, X.; Chen, J. Conservation of oxygen and hydrogen seasonal isotopic signals in meteoric precipitation in groundwater: An experimental tank study of the effects of land cover in a summer monsoon climate. Geochim. Cosmochim. Acta 2020, 284, 254–272. [Google Scholar] [CrossRef]
  19. Zhao, X.; Wan, G. Current situation and prospect of China’s geothermal resources. Renew. Sustain. Energy Rev. 2014, 32, 651–661. [Google Scholar] [CrossRef]
  20. Borzenko, S.V.; Zippa, E.V. Isotopic composition and origin of sulfide and sulfate species of sulfur in thermal waters of Jiangxi Province (China). Aquat. Geochem. 2019, 25, 49–62. [Google Scholar] [CrossRef]
  21. Parkhurst, D.L.; Appelo, C.A.J. Description of Input and Examples for PHREEQC Version 3—A Computer Program for Speciation, Batch-Reaction, One-Dimensional Transport, and Inverse Geochemical Calculations; U.S. Geological Survey: Denver, CO, USA, 2013; p. 497. [Google Scholar]
  22. Appelo, C.A.J.; Postma, D. Geochemistry, groundwater and pollution. Geochem. Groundw. Pollut. 1993, 58, 1212. [Google Scholar] [CrossRef]
  23. Fournier, R.O. Chemical geothermometers and mixing models for geothermal systems. Geothermics 1977, 5, 41–50. [Google Scholar] [CrossRef]
  24. Verma, S.P.; Santoyo, E. New improved equations for Na/K, Na/Li and SiO2, geothermometers by outlier detection and rejection. J. Volcanol. Geotherm. Res. 1997, 79, 9–23. [Google Scholar] [CrossRef]
  25. Giggenbach, W.F. Geothermal solute equilibria. Derivation of Na-K-Mg-Ca geoindicators. Geochim. Cosmochim. Acta 1988, 52, 2749–2765. [Google Scholar] [CrossRef]
  26. Fouillac, C.; Michard, G. Sodium/lithium ratio in water applied to geothermometry of geothermal reservoirs. Geothermics 1981, 10, 55–70. [Google Scholar] [CrossRef]
  27. Nieva, D.; Nieva, R. Developments in geothermal energy in Mexico-part twelve. A cationic geothermometer for prospecting of geothermal resources. Heat Recovery Syst. CHP 1987, 7, 243–258. [Google Scholar] [CrossRef]
  28. Yang, P.; Dan, L.; Groves, C.; Xie, S. Geochemistry and genesis of geothermal well water from a carbonate—Evaporite aquifer in Chongqing, SW China. Environ. Earth Sci. 2019, 78, 1–14. [Google Scholar] [CrossRef]
  29. Moxiang, C.; Yiyang, W. Formation characteristics and potential assessment. In Geothermal Resources in China; Science Press: Beijing, China, 1994. [Google Scholar]
  30. Shvartsev, S.L.; Sun, Z.; Borzenko, S.V.; Gao, B.; Tokarenko, O.G.; Zippa, E.V. Geochemistry of the thermal waters in Jiangxi Province, China. Appl. Geochem. 2018, 96, 113–130. [Google Scholar] [CrossRef]
  31. Mohammadi, Z.; Vaselli, O.; Muchez, P.; Claes, H.; Capezzuoli, E.; Swennen, R. Hydrogeochemistry, stable isotope composition and geothermometry of CO2-bearing hydrothermal springs from Western Iran: Evidence for their origin, evolution and spatio-temporal variations. Sediment. Geol. 2020, 404, 105676. [Google Scholar] [CrossRef]
  32. Nagarajan, R.; Rajmohan, N.; Mahendran, U.; Senthamilkumar, S. Evaluation of groundwater quality and its suitability for drinking and agricultural use in Thanjavur city, Tamil Nadu, India. Environ. Monit. Assess. 2010, 171, 289–308. [Google Scholar] [CrossRef] [Green Version]
  33. Ahmad, M.; Akram, W.; Hussain, S.D.; Sajjad, M.I.; Zafar, M.S. Origin and subsurface history of geothermal water of Murtazabad area, Pakistan—An isotopic evidence. Appl. Radiat. Isot. 2001, 55, 731–736. [Google Scholar] [CrossRef]
  34. Alam, B.Y.C.S.S.S.; Itoi, R.; Taguchi, S.; Saibi, H.; Yamashiro, R. Hydrogeochemical and isotope characterization of geothermal waters from the Cidanau geothermal field, West Java, Indonesia. Geothermics 2019, 78, 62–69. [Google Scholar] [CrossRef]
  35. Hussain, S.D.; Ahmad, M.; Sajjad, M.I.; Akram, W.; Ahmad, N.; Tasneem, M.A.; Rafiq, M. Isotopic and Chemical Studies of Geothermal Waters of Northern Areas of Pakistan; Pakistan Institute of Nuclear Science and Technology: Nilore, Pakistan, 1994; Volume 52, pp. 127–147. [Google Scholar]
  36. Giggenbach, W.F.; Gonfiantini, R.; Jangi, B.L.; Truesdell, A.H. Isotopic and chemical composition of Parbati valley geothermal discharges, north-west Himalaya, India. Geothermics 1983, 12, 199–222. [Google Scholar] [CrossRef]
  37. Apollaro, C.; Vespasiano, G.; de Rosa, R.; Marini, L. Use of mean residence time and flowrate of thermal waters to evaluate the volume of reservoir water contributing to the natural discharge and the related geothermal reservoir volume. Application to Northern Thailand hot springs. Geothermics 2015, 58, 62–74. [Google Scholar] [CrossRef]
  38. Vespasiano, G.; Marini, L.; Muto, F.; Auqué, L.F.; Cipriani, M.; de Rosa, R.; Critelli, S.; Gimeno, M.J.; Blasco, M.; Dotsika, E.; et al. Chemical, isotopic and geotectonic relations of the warm and cold waters of the Cotronei (Ponte Coniglio), Bruciarello and Repole thermal areas, (Calabria—Southern Italy). Geothermics 2021, 96, 102228. [Google Scholar] [CrossRef]
  39. Huang, H.; Chen, Z.; Wang, T.; Zhou, G.; Martin, J.B.; Zhang, L. Origins and mixing contributions of deep warm groundwater in a carbonate- hosted ore deposit, Sichuan-Yunnan-Guizhou Pb-Zn triangle, southwestern China. J. Hydrol. 2020, 590, 125400. [Google Scholar] [CrossRef]
  40. Hem, J.D. Study and interpretation of the chemical characteristics of natural water. In US Geological Survey Water-Supply Paper 2254; US Geological Survey: Washington, DC, USA, 1985. [Google Scholar]
  41. Mao, X.; Zhu, D.; Ndikubwimana, I.; He, Y.; Shi, Z. The mechanism of high-salinity thermal groundwater in Xinzhou geothermal field, South China: Insight from water chemistry and stable isotopes. J. Hydrol. 2021, 593, 125889. [Google Scholar] [CrossRef]
  42. Millot, R.; Hegan, A.; Négrel, P. Geothermal waters from the Taupo Volcanic Zone, New Zealand: Li, B and Sr isotopes characterization. Appl. Geochem. 2012, 27, 677–688. [Google Scholar] [CrossRef] [Green Version]
  43. Stelling, P.; Shevenell, L.; Hinz, N.; Coolbaugh, M.; Melosh, G.; Cumming, W. Geothermal systems in volcanic arcs: Volcanic characteristics and surface manifestations as indicators of geothermal potential and favorability worldwide. J. Volcanol. Geotherm. Res. 2016, 324, 57–72. [Google Scholar] [CrossRef] [Green Version]
  44. Wang, X.; Wang, G.; Lu, C.; Gan, H.; Liu, Z. Evolution of deep parent fluids of geothermal fields in the Nimu–Nagchu geothermal belt, Tibet, China. Geothermics 2018, 71, 118–131. [Google Scholar] [CrossRef]
  45. Mwiathi, N.F.; Gao, X.; Li, C.; Rashid, A. The occurrence of geogenic fluoride in shallow aquifers of Kenya Rift Valley and its implications in groundwater management. Ecotoxicol. Environ. Saf. 2022, 229, 113046. [Google Scholar] [CrossRef]
  46. Rashid, A.; Guan, D.; Farooqi, A.; Khan, S.; Zahir, S.; Jehan, S. Science of the total environment fluoride prevalence in groundwater around a fl uorite mining area in the fl ood plain of the River Swat, Pakistan. Sci. Total Environ. 2018, 635, 203–215. [Google Scholar] [CrossRef] [Green Version]
  47. Jacks, G. Controls on the genesis of some high-fluoride groundwaters in India. Appl. Geochem. 2005, 20, 221–228. [Google Scholar] [CrossRef]
  48. Noor, S.; Rashid, A.; Javed, A.; Khattak, J.A.; Farooqi, A. Hydrogeological properties, sources provenance, and health risk exposure of fluoride in the groundwater of Batkhela, Pakistan. Environ. Technol. Innov. 2022, 25, 102239. [Google Scholar] [CrossRef]
  49. Carroll, D. Rainwater as a Chemical Agent of Geologic Processes—A Review. U.S. Geol. Surv. Water-Supply Pap. 1962, 1535, 1–18. [Google Scholar]
  50. Pradhan, B. Hydro-chemical analysis of the ground water of the basaltic catchments: Upper Bhatsai region, Maharastra. Open Hydrol. J. 2011, 4, 51–57. [Google Scholar] [CrossRef] [Green Version]
  51. Craig, H. Isotopic variations in meteoric waters. Science 1961, 133, 1702–1703. [Google Scholar] [CrossRef]
  52. Sun, Z.; Gao, B.; Shvartsev, S.; Tokarenko, O.; Zippa, E. The thermal water geochemistry in Jiangxi Province (SE-China). Procedia Earth Planet. Sci. 2017, 17, 940–943. [Google Scholar] [CrossRef]
  53. Wei, Z.A.; Shao, H.; Tang, L.; Deng, B.; Li, H.; Wang, C. Hydrogeochemistry and geothermometry of geothermal waters from the Pearl River Delta region, South China. Geothermics 2021, 96, 102164. [Google Scholar] [CrossRef]
  54. Thomas, J.M.; Rose, T.P. Environmental isotopes in hydrogeology. Environ. Earth Sci. 2003, 43, 532. [Google Scholar] [CrossRef]
  55. Ahmad, M.; Tasneem, M.A.; Akram, W.; Hussain, S.D.; Zafar, M.S.; Sajjad, M.I. Isotopic investigations of Tatta Pani and Tato thermal springs: Insights to their origin, age and subsurface history. JSNM (Nucl. Sci. J. Malays.) 2000, 18, 1–16. [Google Scholar]
  56. Li, X.; Qi, J.; Yi, L.; Xu, M.; Zhang, X.; Zhang, Q.; Tang, Y. Hydrochemical characteristics and evolution of geothermal waters in the eastern Himalayan syntaxis geothermal field, southern Tibet. Geothermics 2021, 97, 102233. [Google Scholar] [CrossRef]
  57. Ndikubwimana, I.; Mao, X.; Zhu, D.; He, Y.; Shi, Z. Geothermal evolution of deep parent fluid in Western Guangdong, China: Evidence from water chemistry, stable isotopes and geothermometry. Hydrogeol. J. 2020, 28, 2947–2961. [Google Scholar] [CrossRef]
  58. Chiodini, G.; Frondini, F.; Marini, L. Theoretical geothermometers and PCO2, indicators for aqueous solutions coming from hydrothermal systems of medium-low temperature hosted in carbonate-evaporite rocks. Application to the thermal springs of the Etruscan Swell, Italy. Appl. Geochem. 1995, 10, 337–346. [Google Scholar] [CrossRef]
  59. Abdelali, A.; Nezli, I.E.; Kechiched, R.; Attalah, S.; Benhamida, S.A.; Pang, Z. Geothermometry and geochemistry of groundwater in the Continental Intercalaire aquifer, southeastern Algeria: Insights from cations, silica and SO4–H2O isotope geothermometers. Appl. Geochem. 2020, 113, 104492. [Google Scholar] [CrossRef]
  60. Li, J.; Sagoe, G.; Li, Y. Geothermics applicability and limitations of potassium-related classical geothermometers for crystalline basement reservoirs. Geothermics 2019, 84, 101728. [Google Scholar] [CrossRef]
  61. Ndikubwimana, I.; Mao, X.; Niyonsenga, J.D.; Zhu, D.; Mwizerwa, S. Water-rock interaction, formation and circulation mechanism of highly bicarbonate groundwater in the northwestern geothermal prospects of Rwanda. Episodes 2022, 45, 73–86. [Google Scholar] [CrossRef]
  62. Peikam, E.N.; Jalali, M. Application of inverse geochemical modelling for predicting surface water chemistry in Ekbatan watershed, Hamedan, western Iran. Hydrol. Sci. J. 2016, 61, 1124–1134. [Google Scholar] [CrossRef] [Green Version]
  63. Apollaro, C.; Caracausi, A.; Paternoster, M.; Randazzo, P.; Aiuppa, A.; de Rosa, R.; Fuoco, I.; Mongelli, G.; Muto, F.; Vanni, E.; et al. Fluid geochemistry in a low-enthalpy geothermal field along a sector of southern Apennines chain (Italy). J. Geochem. Explor. 2020, 219, 106618. [Google Scholar] [CrossRef]
  64. Shahid, S.A.; Taha, F.K.; Abdelfattah, M.A. Developments in soil classification, land use planning and policy implications. In Innovative Thinking of Soil Inventory for Land Use Planning and Management of Land Resources; Springer: Dordrecht, The Netherlands, 2013. [Google Scholar] [CrossRef]
  65. Pastorelli, S.; Marini, L.; Hunziker, J.C. Water chemistry and isotope composition of the Acquarossa thermal system, Ticino, Switzerland. Geothermics 1999, 28, 75–93. [Google Scholar] [CrossRef]
  66. Peckmann, J.; Thiel, V.; Michaelis, W.; Clari, P.; Gaillard, C.; Martire, L.; Reitner, J. Cold seep deposits of Beauvoisin (Oxfordian; southeastern France) and Marmorito (Miocene; northern Italy): Microbially induced authigenic carbonates. Int. J. Earth Sci. 1999, 88, 60–75. [Google Scholar] [CrossRef] [Green Version]
  67. Santhanam, H.; Karthikeyan, A.; Raja, M. Saturation indices of aqueous mineral phases as proxies of seasonal dynamics of a transitional water ecosystem using a geochemical modeling approach. Modeling Earth Syst. Environ. 2021, 7, 1813–1829. [Google Scholar] [CrossRef]
  68. Datta, P.S.; Tyagi, S.K. Major ion chemistry of groundwater in Delhi area: Chemical weathering processes and groundwater flow regime. J. Geol. Soc. India 1996, 47, 179–188. [Google Scholar]
  69. Brodsky, E.E.; Xue, L.; Nale, S.M.; Parker, B.L.; Cherry, J.A. Situ permeability: A comparison with long-term pumping tests. Water Resour. Res. 2016, 3113–3126. [Google Scholar] [CrossRef]
  70. Anderson, T.R.; Fairley, J.P. Relating permeability to the structural setting of a fault-controlled hydrothermal system in southeast Oregon, USA. J. Geophys. Res. Solid Earth 2008, 113, 1–13. [Google Scholar] [CrossRef] [Green Version]
  71. Mao, X.; Wang, Y.; Zhan, H.; Feng, L. Geochemical and isotopic characteristics of geothermal springs hosted by deep-seated faults in Dongguan Basin, Southern China. J. Geochem. Explor. 2015, 158, 112–121. [Google Scholar] [CrossRef]
  72. Kim, Y.S.; Sanderson, D.J. Inferred fluid flow through fault damage zones based on the observation of stalactites in carbonate caves. J. Struct. Geol. 2010, 32, 1305–1316. [Google Scholar] [CrossRef]
  73. Wang, M.; Zhou, X.; Wang, J.; Li, X.; Liu, H. Occurrence, genesis and travertine deposition of the Adong hot springs in northwestern Yunnan of China. Geothermics 2020, 87, 101851. [Google Scholar] [CrossRef]
  74. Zhu, Z.-X. Hot spring in the Reshuizhou region of Jiangxi Province. Geol. Miner. Resour. South China 2007, 3, 63–69. (In Chinese) [Google Scholar]
  75. Xiao, Z.-Y.; Wang, J.; Hou, H.-M. Analysis of characteristics and causes of geothermal water in the east of Southern Jiangxi Province. J. East China Univ. Technol. 2018, 41, 251–261. (In Chinese) [Google Scholar] [CrossRef]
  76. Agosta, F.; Kirschner, D.L. Fluid conduits in carbonate-hosted seismogenic normal faults of central Italy. J. Geophys. Res. Solid Earth 2003, 108, 1–13. [Google Scholar] [CrossRef]
  77. Curewitz, D.; Karson, J.A. Structural settings of hydrothermal outflow: Fracture permeability maintained by fault propagation and interaction. J. Volcanol. Geotherm. Res. 1997, 79, 149–168. [Google Scholar] [CrossRef]
  78. Bense, V.F.; Gleeson, T.; Loveless, S.E.; Bour, O.; Scibek, J. Fault zone hydrogeology. Earth-Sci. Rev. 2013, 127, 171–192. [Google Scholar] [CrossRef]
  79. Farhat, N.; Hussain, S.; Faisal, F.; Batool, I.; Noreen, M. Physico-chemical characteristics and therapeutic potential of Chutrun thermal springs in Shigar Valley, Gilgit-Baltistan (Pakistan). Appl. Water Sci. 2021, 11, 1–8. [Google Scholar] [CrossRef]
  80. Pérez-Moreno, R.; Reich, M.; Daniele, L.; Morata, D.; Held, S.; Kleinsasser, J. Stable isotope and anthropogenic tracer signature of waters in an Andean geothermal system. Appl. Geochem. 2021, 128, 104953. [Google Scholar] [CrossRef]
Figure 1. Geographical map of Suichuan County in southwest Jiangxi province. Red markings are the thermal and cold water sampling sites.
Water 14 01591 g001
Figure 2. Simplified structural map (A) and geological map (B) of the study area showing thermal and cold well sites, major and minor faults indicating deformation.
Water 14 01591 g002
Figure 3. Piper plot for Suichuan geothermal field (Thermal and non-thermal groundwater and river water samples). H, C and R are relative terms for hot, cold and river water samples. All the water samples are showing HCO3 dominance.
Water 14 01591 g003
Figure 4. Plot of H and O isotopes of thermal and cold well samples. No water samples fall below the meteoric water lines, indicating no evaporation and oxygen-18 shift.
Water 14 01591 g004
Figure 5. Chlorine vs. δ18O and δD graph of geothermal waters.
Water 14 01591 g005
Figure 6. TIS salinity diagrams (A) Ca + Mg vs. Na + K, (B) SO4 vs. Cl + HCO3.
Water 14 01591 g006
Figure 7. Extent of correlation between TDS and other hydrochemical parameters (A) F, SO42−; (B) Na+, Li; (C) HCO3) of thermal and cold ground waters of Suichuan County. Red and black points show the cold and thermal well samples.
Water 14 01591 g007aWater 14 01591 g007b
Figure 8. Relative Cl-SO4-HCO3 ternary plot showing all the water samples located at bicarbonate corner exhibit “peripheral water” type consisting mainly of HCO3.
Water 14 01591 g008
Figure 9. Na/1000-K/100/Mg1/2 of thermal and non-thermal waters. All the water samples except (ZM-1 an-TH-1) are “immature waters”, evaluating the mixing with cold ground waters.
Water 14 01591 g009
Figure 10. Graph showing the saturation state of different minerals of the Suichuan thermal waters.
Water 14 01591 g010
Figure 11. Ca/(Ca + Mg) vs. HCO3/(HCO3 + SO4) [65].
Water 14 01591 g011
Figure 12. Scatter plots of the study area explaining silicate weathering and carbonate dissolution.
Water 14 01591 g012
Figure 13. Conceptual genetic model of geothermal water circulation in Suichuan County.
Water 14 01591 g013
Table 1. Hydrochemical parameters of sampled waters from Suichuan County, SE China. TDS and other chemical concentrations are in mg/L.
Sample IDDepth (m)EC µS/cmT (°C)pHTDSK+Na+Ca2+Mg2+HCO3SO42−ClNO3FCBE%
ZM-1 Thermal well285333419.6199.552.1159.830.880.0247.4624.056.30.113.411
XZK-1 Thermal well240289397.24173.594.0519.5119.370.668014.461.770.127.52−2
TH-1Thermal well297400807.52240.272.6363.494.440.0311912.874.190.1612.90
GYZL06-1 Thermal well519169426.65101.523.4812.397.020.340.683.770.440.822.16
RSZ01-1 Thermal well321200627.72120.243.587.529.861.0153.76611.50.54.48−22
RSZ04-1 Thermal well321283729.02169.665.1512.8111.931.1953.76812.20.50.040
LX-1 Cold well340134236.9580.693.473.489.932.4633.96.20.270.365.3−1
RSZ02-1 Cold well321212206.92127.23.532.614.024.6849.3923.283.255.60
RSZ 01 River waterND92206.8855.30.813.293.550.4126.1523.753.50.26−26
RSZ 02 River waterND90206.9653.820.963.793.550.5120.3435.1540.3−20
GYZL01 River waterND93208.8755.510.211.846.950.3136.2734.111.50.46−28
GYZL02 River waterND94209.1556.670.512.487.440.2630.2352.740.50.31−15
GYZL03 River waterND89208.9853.560.212.636.950.3624.1873.651.50.28−15
Table 2. Trace element concentrations for thermal and non-thermal wells and river water samples for Suichuan County. Units used as mg/L.
Sample IDSiO2LiSr
ZM-121.440.240.01
XZK-126.130.250.09
TH-120.560.420.02
GYZL06-130.520.070.04
RSZ01-153.280.040.02
RSZ01-483.040.050.02
LX-116.140.080.03
RSZ02-138.850.060.02
RSZ 0111.580.010.01
RSZ 0212.220.010.01
GYZL0112.840.010.01
GYZL0216.150.010.00
GYZL0312.840.010.01
Table 3. Stable environmental isotopes (H and O) for thermal and cold wells expressed in ‰.
Sampleδ18OδD
ZM-1−8.6−57
XZK-1−8.0−53
TH-1−8.6−56
GYZL06-1−7.5−47
RSZ01-1−7.8−46
RSZ04-1−7.5−48
LX-1−7.7−47
RSZ02-1−7.5−49
Table 4. Saturation indices for the minerals in Suichuan County. Very few minerals exhibited positive values > 0 showing saturation to oversaturation, while most of the minerals under saturation yielded negative values < 0.
SampleAnhydriteAragoniteCalciteCelestiteCO2DolomiteFluoriteGypsumH2OHalite
ZM-1−4.11−0.36−0.22−4.22−5−1.6−0.79−3.98−1.12−8.01
XZK-1−3−0.85−0.72−3.44−2.16−2.440.11−2.86−1.16−7.05
TH-1−3.16−0.51−0.4−3.63−1.95−2.59−0.31−3.39−0.31−8.24
GYZL06-1−3.85−2.04−1.91−4.18−1.82−4.7−1.36−3.73−1.09−9.83
RSZ01-1−3.33−0.47−0.35−4.16−2.63−1.19−0.73−3.37−0.66−8.67
RSZ04-1−3.080.730.84−4.14−4.071.16−4.88−3.21−0.46−8.44
LX-1−3.62−1.95−1.8−4.15−2.33−3.89−0.21−3.39−1.56−10.55
RSZ02-1−4−1.73−1.58−4.86−2.16−3.350−3.76−1.64−9.59
Table 5. Estimated reservoir temperature of thermal ground waters by applying different thermometers.
SampleQuartzChalcedony Improved SiO2K-MgNa-KNa-LiNa-K-Ca-Mg
ZM-1663466105440196120
XZK-173427476102917694
TH-16432651053512127104
GYZL06-180488182886711898
RSZ01-1104751056870010895
RSZ04-1127991287575391102
Table 6. Estimated recharge altitude and circulation depth is shown in (m), annual average air temperature in (°C), Deuterium isotope (δD) in ‰ of thermal water samples in Suichuan County.
SampleδDRecharge Altitude(m)Annual Average Air TemperatureCirculation Depth
ZM-1−571000111296
XZK-1−53870121488
TH-1−56970112448
GYZL06-1−47670141712
RSZ01-1−46630152578
RSZ04-1−48700142578
Mean Value−51810132017
Publisher’s Note: MDPI stays neutral with regard to jurisdictional claims in published maps and institutional affiliations.

