Article

Development and Demonstration of an Endocrine-Disrupting Compound Footprint Calculator

1
Department of Agricultural and Biological Engineering, The Pennsylvania State University, University Park, State College, PA 16802, USA
2
Department of Agricultural and Biological Engineering, The University of Florida, Gainesville, FL 32611, USA
3
Department of Ecosystem Science and Management, The Pennsylvania State University, University Park, State College, PA 16802, USA
4
Institute for Sustainable Agricultural, Food and Environmental Science, The Pennsylvania State University, University Park, State College, PA 16802, USA
*
Author to whom correspondence should be addressed.
Water 2022, 14(10), 1587; https://doi.org/10.3390/w14101587
Submission received: 26 February 2022 / Revised: 11 May 2022 / Accepted: 12 May 2022 / Published: 16 May 2022
(This article belongs to the Special Issue Decision Support Tools for Water Quality Management)

Abstract

:
Chemicals in personal care products used in everyday lives become part of the wastewater stream. Wastewater treatment plants were not designed to remove these chemicals; therefore, these products and their metabolites persist in the effluent. Many of these chemicals are known, or suspected to be, endocrine-disrupting compounds (EDCs) and can cause adverse impacts to aquatic organisms at trace concentrations. Here, we developed a publicly available EDC footprint calculator to estimate a household’s EDC footprint. The calculator prompts users to input the number of products they own in each of three categories: health and beauty, laundry, and cleaning. The calculator, which is programmed with average values of EDCs in each product, outputs an estimate of the user’s EDC footprint (mass) and ranks the contribution of each product to the footprint. When used by a group of 39 citizen scientists across the Susquehanna River Basin in the northeastern United States, the average household EDC footprint was ~150 g. Results of this tool aid in decision making by providing users with the information necessary to reduce the household’s footprint through product selection that avoids specific ingredients or by replacing the top-ranking products with greener alternatives.

1. Introduction

The personal care product (PCP) industry is a significant contributor to the global economy, accounting for 3.9 million direct and indirect jobs in 2018, representing 1.9% of total US employment and USD 267.3 billion in the United States’ gross domestic product [1]. Many of the compounds used in PCPs are referred to as “endocrine-disrupting compounds” (EDCs) because they can mimic or alter hormones, leading to complications in growth, development, and reproduction [2]. Given that many PCPs are applied topically, compounds classified as EDCs have been found in human tissues [3]. Triclosan, an antibacterial agent used in PCPs, has been monitored and detected in blood, breast milk, urine, adipose tissue, and liver [4]. Other EDCs used in cosmetics, including bisphenol A (BPA), phthalates, and parabens, have been studied in human urine samples to better understand potential toxicological effects [2,4]. As more EDCs are identified in consumer products, there is concern over the ability of some EDCs to lower spermatozoid production and potentially increase the risk of breast cancer and other anomalies in human bodies [5].
Globally, EDCs are increasingly considered major contributors to a wide array of ecotoxicological impacts on non-target aquatic organisms. In the United States, EDCs have been found in surface water, particularly downstream of wastewater treatment plants [6], and have the potential to impact the endocrine systems of aquatic species at environmentally relevant concentrations [2]. In Pennsylvania, the smallmouth bass (Micropterus dolomieu) decline in the Susquehanna and Juniata Rivers triggered a significant amount of research and heightened awareness around the issues of EDCs in these river networks [7]. For example, the United States Geological Survey (USGS) reported that 60–100% of large- and smallmouth bass populations sampled near wildlife refuges in the Northeast exhibit intersex characteristics [8]. A causal analysis conducted by the Pennsylvania Department of Environmental Protection (PA DEP) indicated the presence of EDCs, such as pesticides, pharmaceuticals, and ingredients in PCPs as likely contributors to the decline [7]. Although a virus was ultimately determined to be the greatest contributor to the decline, the presence of intersex characteristics in the fish populations could not be explained by the virus, and therefore, a better understanding of the presence and impacts of EDCs is still needed [9]. In the Susquehanna River Basin, an increased presence of steroidal hormones was observed with the increased feminization of the local smallmouth bass population, where male fish were developing female sexual characteristics [7].
Beyond the well-documented impacts on fish populations from EDCs in surface water bodies, EDCs in wetlands and vernal pools pose potential threats to amphibians, which are also known to be declining globally at alarming rates [10,11,12]. The amphibian decline, which has been referred to as the sixth mass extinction [13], is attributed to a wide range of factors, including diseases, invasive species, climate change, and habitat loss. Water quality contaminants, including EDCs, are also suspected to be contributing to the amphibian decline [14,15]. In studies monitoring human wastewater contaminants from septic tanks and wastewater irrigation activities in critical amphibian habitats (vernal pools), EDCs were present at levels high enough to elicit intersex characteristics in native frog species [16,17,18]. Aside from causing intersex characteristics, EDCs such as triclosan have been shown to affect tadpole hindlimb development at concentrations as low as 0.15 µg/L [19]. Understanding the effects of EDCs on amphibians and other sensitive aquatic organisms is critically important for prioritizing conservation efforts.
The mechanisms through which domestic wastewater introduces EDCs into the environment are generally well-understood, with human sources of EDCs most commonly associated with the usage of PCPs and pharmaceuticals. Despite nearly two decades of research since the seminal Kolpin et al. [6] study promoted an exponential growth of research on the impacts of EDCs on drinking water quality and aquatic ecosystem health, little clear evidence remains of the reduced presence or quantity of these contaminants in the environment. These chemicals are introduced into the environment during various stages of the life cycle of PCPs, including manufacturing, use, and disposal. In each of these stages, EDCs may be present in the influent water to wastewater treatment plants (WWTPs) [20,21,22,23,24]. WWTPs were not designed to remove these chemicals, and therefore, the chemicals and their metabolites, which can retain potency, often persist in the wastewater effluent. This wastewater effluent is typically discharged to surface water bodies but may also be land-applied or used to recharge groundwater aquifers. Although wastewater must be treated to meet permit requirements, EDCs are currently not regulated, and therefore, the extent to which treatment plants remove EDCs prior to discharging their effluent varies widely across treatment technologies and types of EDCs [23].
Given that these chemicals do not currently have water quality regulations, one way to reduce their presence in the environment is by reducing their sources. However, it is difficult for consumers to make informed decisions about the PCPs they purchase because labels are often insufficient for determining whether or not a product may contain EDCs, or which type of EDCs may be present. In the United States, the Food and Drug Administration (FDA) regulates some PCPs such as toothpaste, deodorant, sunscreen, and antibacterial hand soap. However, the FDA only requires that active ingredients be listed on the product’s label, and not all of the EDCs found in these products are considered to be “active ingredients”. The FDA requires that cosmetic labels list all ingredients from highest to lowest concentration in the product [25,26], but given that some ingredients may be more potent or exhibit higher endocrine-disrupting potential than others, this method of labeling may not provide information in an easily accessible manner for making informed decisions about product choices.
A large study was conducted by the Silent Spring Institute to quantify the presence of EDCs in commonly used PCPs [27]. The authors selected 66 target compounds that included EDCs and compounds suspected to trigger asthma that were expected to be present in PCPs, and they analyzed 85 samples for these compounds. The samples were composites of up to seven products in each product category and represented more than 200 products. They classified the results of their EDC analysis into four main categories: not detected, 1–100 μg/g, 100–1000 μg/g, and >1000 μg/g. The highest levels of EDCs detected varied by product type, with the highest UV filters in sunscreen; highest cyclosiloxanes in sunscreen and car interior cleaners; highest glycol ethers in floor and carpet cleaners, polish/wax, and sunscreen; highest fragrances in surface cleaners, car fresheners, dryer sheets, air fresheners, and perfume/cologne; highest alkylphenols in shower curtains and car interior cleaners; highest ethanolamines in glass cleaners and laundry detergent; highest antimicrobials in hand and bar soaps; highest BPA in detergent, soap, shampoo, conditioner, detergent, shaving cream, face lotion, toilet bowl cleaners, body wash, and nail polish; highest phthalates in foundation, car fresheners, and perfume/cologne; and highest parabens in face lotion, mascara, hair spray, and sunscreen. In addition to conventional products, composites of alternative products that were advertised as “greener” were also analyzed in the study. The results of the analysis demonstrated the widespread presence of EDCs in commonly used household products and the co-occurrence of multiple compounds in the same products, raising concerns regarding their biological activity and potential toxicological and ecotoxicological implications of the use of these products. Further, the study revealed multiple compounds in the products that were not listed on the product labels, highlighting concerns regarding the ability of consumers to make informed choices should they wish to select products without specific EDCs.
The goal of this research was to develop a tool that the general public could use to estimate their “footprint” (i.e., the mass) of EDCs in products that they currently or typically own and use in their personal hygiene, household cleaning, and laundry routines. Although the footprint does not provide temporal context, it serves as a “snapshot” of the EDC footprint for the products used by members of a household at the time the calculator is taken. The footprint tool was inspired by online water and carbon footprint calculators, which prompt users to answer questions about their daily activities. These types of tools are useful in increasing awareness of complex environmental issues, such as water pollution and climate change. Here, we present an example output of the EDC calculator to demonstrate the utility of its graphical outputs in helping individual users make decisions about ways they could lower their household EDC footprint through their consumer choices. Further, we analyzed EDC footprint results for 39 citizen scientists in the northeastern United States to better understand the dominant product categories and individual products each contributing to total EDC footprints. Overall, we hope that users of the EDC footprint calculator become more aware of the issue of emerging contaminants in the water cycle and feel empowered to reduce their contribution to this global environmental concern.

2. Materials and Methods

2.1. EDC Footprint Tool Development

The EDC footprint calculator was developed by conducting a review of existing databases and papers to identify the masses of EDCs in various commonly used PCPs. The three product categories that were selected are health and beauty products, household cleaning products, and laundry products. The individual products included in the health and beauty products category are hand soap, hand sanitizer, bar soap, body wash, shampoo, conditioner, shaving cream, body lotion, face lotion, facial cleanser, toothpaste, deodorant, hair products, lipstick, mascara, foundation, nail polish, sunscreen, and perfume/cologne. The products included in the household cleaning products category are surface cleaner, floor cleaner, glass cleaner, bathtub and tile cleaner, toilet bowl cleaner, air freshener, carpet cleaner, floor polish/wax, dishwasher detergent, and dish liquid. The individual products in the laundry category are laundry bleach, laundry detergent, and dryer sheets. The EDCs that can be found in these products and are included in the calculator are outlined in Table 1. Although pharmaceuticals are often grouped with personal care products as sources of EDCs, we decided not to include them and instead focused only on products used for personal hygiene and other household cleaning activities, as these are likely to be the dominant contributors to a user’s total EDC footprint and are less intrusive than prompting a user to input potentially sensitive or confidential medical information.
Numbers used in the calculator were taken as an average of the results in the Dodson et al. [27] study when the concentrations were <1000 μg/g. For the products containing EDCs above 1000 μg/g, concentrations were obtained from the Consumer Product Information Database (CPID) [28]. The concentrations of EDCs in perfume and cologne were further improved using concentrations reported by Peters [29]. This report analyzed phthalates and fragrances in 36 perfume products.
The EDC footprint calculator was initially developed in Microsoft® ExcelTM as a downloadable spreadsheet-based tool (the blank version is shown in Figure 1). The calculator was divided into sections for each of the three major product categories: cleaners, laundry, and health and beauty. The user interface column accepts input in milliliters (mL) for liquid products and grams (g) for solid products (shown in green on the calculator; Figure 1). If a user has multiple containers of a product (e.g., two tubes of toothpaste), the user can add the quantities together and enter a total amount in the appropriate column. The calculator uses the information (i.e., masses and volumes) inserted by the user and multiplies the concentration of EDCs (and the density of the product if the input is in mL) to estimate the mass (in mg) of EDCs in each product:
x μ g EDC g product × y g product c m product 3 × z   m L product × 1 c m product 3 m L product × 1 m g EDC 1000 μ g EDC = m g EDC
where x is the concentration of EDC in a product from the existing literature [27,28,29], y is the density of that product from CPID [28], and z is the volume of product the user entered. The calculator then sums the mass of EDCs calculated for each product and determines the total mass (in g) of EDCs estimated to be in all of the products the user entered. This total mas is the EDC footprint and is shown in red in the bottom right corner of the calculator (Figure 1). The footprint tool was made publicly available through Penn State Extension [30].
To facilitate a more user-friendly version of the calculator that did not require a Microsoft® ExcelTM license, we developed a web-based version of the tool using QualtricsTM (Qualtrics, Provo, UT, USA). This version made the calculator more widely accessible to a broader audience since it does not require users to have the software or the technical skills to use it. Further, the online Qualtrics version allows data to be collected anonymously, enabling research to be conducted to better understand what typical ranges of EDC footprints are for households at various scales from local to regional to national and potentially even global. Between 2018 and 2022, the EDC footprint tool has been used more than 1400 times, with users in the United States, Mexico, Canada, India, Taiwan, and Europe.
The tool provides several graphical outputs to assist the user in interpreting the results. The first visual output is a pie chart that provides the percent contribution of each of the three product categories to the total EDC footprint, enabling the user to easily assess how much of the total footprint is from products in the health and beauty, cleaners, and laundry categories. The second visual output is a pie chart that provides the percent contribution of each EDC category to the overall EDC footprint. This allows the user to easily assess the percent contribution of the following categories to the overall EDC footprint: UV filters, cyclosiloxanes, glycol ethers, fragrances, alkylphenols, ethanolamines, antimicrobials, BPA, phthalates, and parabens (see Table 1 for the specific chemicals included in each of these categories). Finally, the calculator ranks the percent contribution of each product to the overall EDC footprint and visualizes the contribution (mass) of the top 10 products in a bar chart. This chart is intended to help the user determine which specific products are contributing the most to the total EDC footprint, thereby providing the user with easily accessible information regarding which products have the highest potential to reduce the user’s EDC footprint if they were to be exchanged for a “greener” product.
A “green” version of the EDC footprint calculator was developed in the same manner described for the original version of the calculator; however, it has not yet been made publicly available. This “green” version is based on EDC concentrations for products marketed as “eco-friendly” or “green” in the study by Dodson et al. [27]. Specifically, we replaced the original concentrations of each EDC in each product reported by Dodson et al. [27] with the concentrations of the products that Dodson et al. [27] reported for the “green” products.
It should be noted that the EDC footprints generated from this tool are based on the products in a household at the time the footprint tool was used and is not meant to provide an estimate of usage of these products over a specific amount of time. For example, some products, such as hand soap, are likely used more frequently than other products. We did not attempt to capture the time frame over which the products contributing to the footprint would be consumed. Rather, at the scale of an individual household, the results are meant to serve the following purposes: (1) informing the user of the total EDC footprint of the products in the household at the time the calculator was used; (2) visualization of the results to enable the user to understand the contribution of products used in each of the three product categories to the total footprint; (3) determination of the individual products contributing the most to the total footprint; and (4) understanding the individual ingredients categorized as EDCs that are present in the products used in the household. The user is then empowered with the information necessary to make changes in product selection to reduce the household’s footprint through product selection that avoids specific ingredients or by replacing the top-ranking products with greener alternatives. We recognize that a footprint could be reduced by having less of a product in the household at the time the footprint calculator is used, such that someone who buys products in bulk may have a higher “snapshot” footprint than someone who buys products as needed; however, the user knows what the shopping habits of the household are and can interpret the results in the context of that knowledge (e.g., a higher snapshot footprint does not necessarily mean a higher annual footprint).

2.2. Citizen Science Demonstration of EDC Footprint Calculator

In June 2021, we recruited 58 citizen scientists to take part in a project that sought to establish links between EDCs in household products they use and the presence of these EDCs in surface water samples from various locations across the Pennsylvania portion of the Susquehanna River Basin, which is the largest tributary to the Chesapeake Bay watershed in the northeastern United States. The citizen scientists were volunteers and filled out the EDC footprint calculator as part of their participation in the project. Results of the footprint tool were distributed to participants in a final report that included their household’s footprint, as well as a summary of the results for the other 57 participants to provide context regarding their own household’s footprint. After final reports were distributed, 39 citizen scientists responded to a post-study survey, which included some general demographic questions. In this research, we used the results of the demographic questions (Table 2) to interpret the results of the EDC footprint tool based on household size.

3. Results

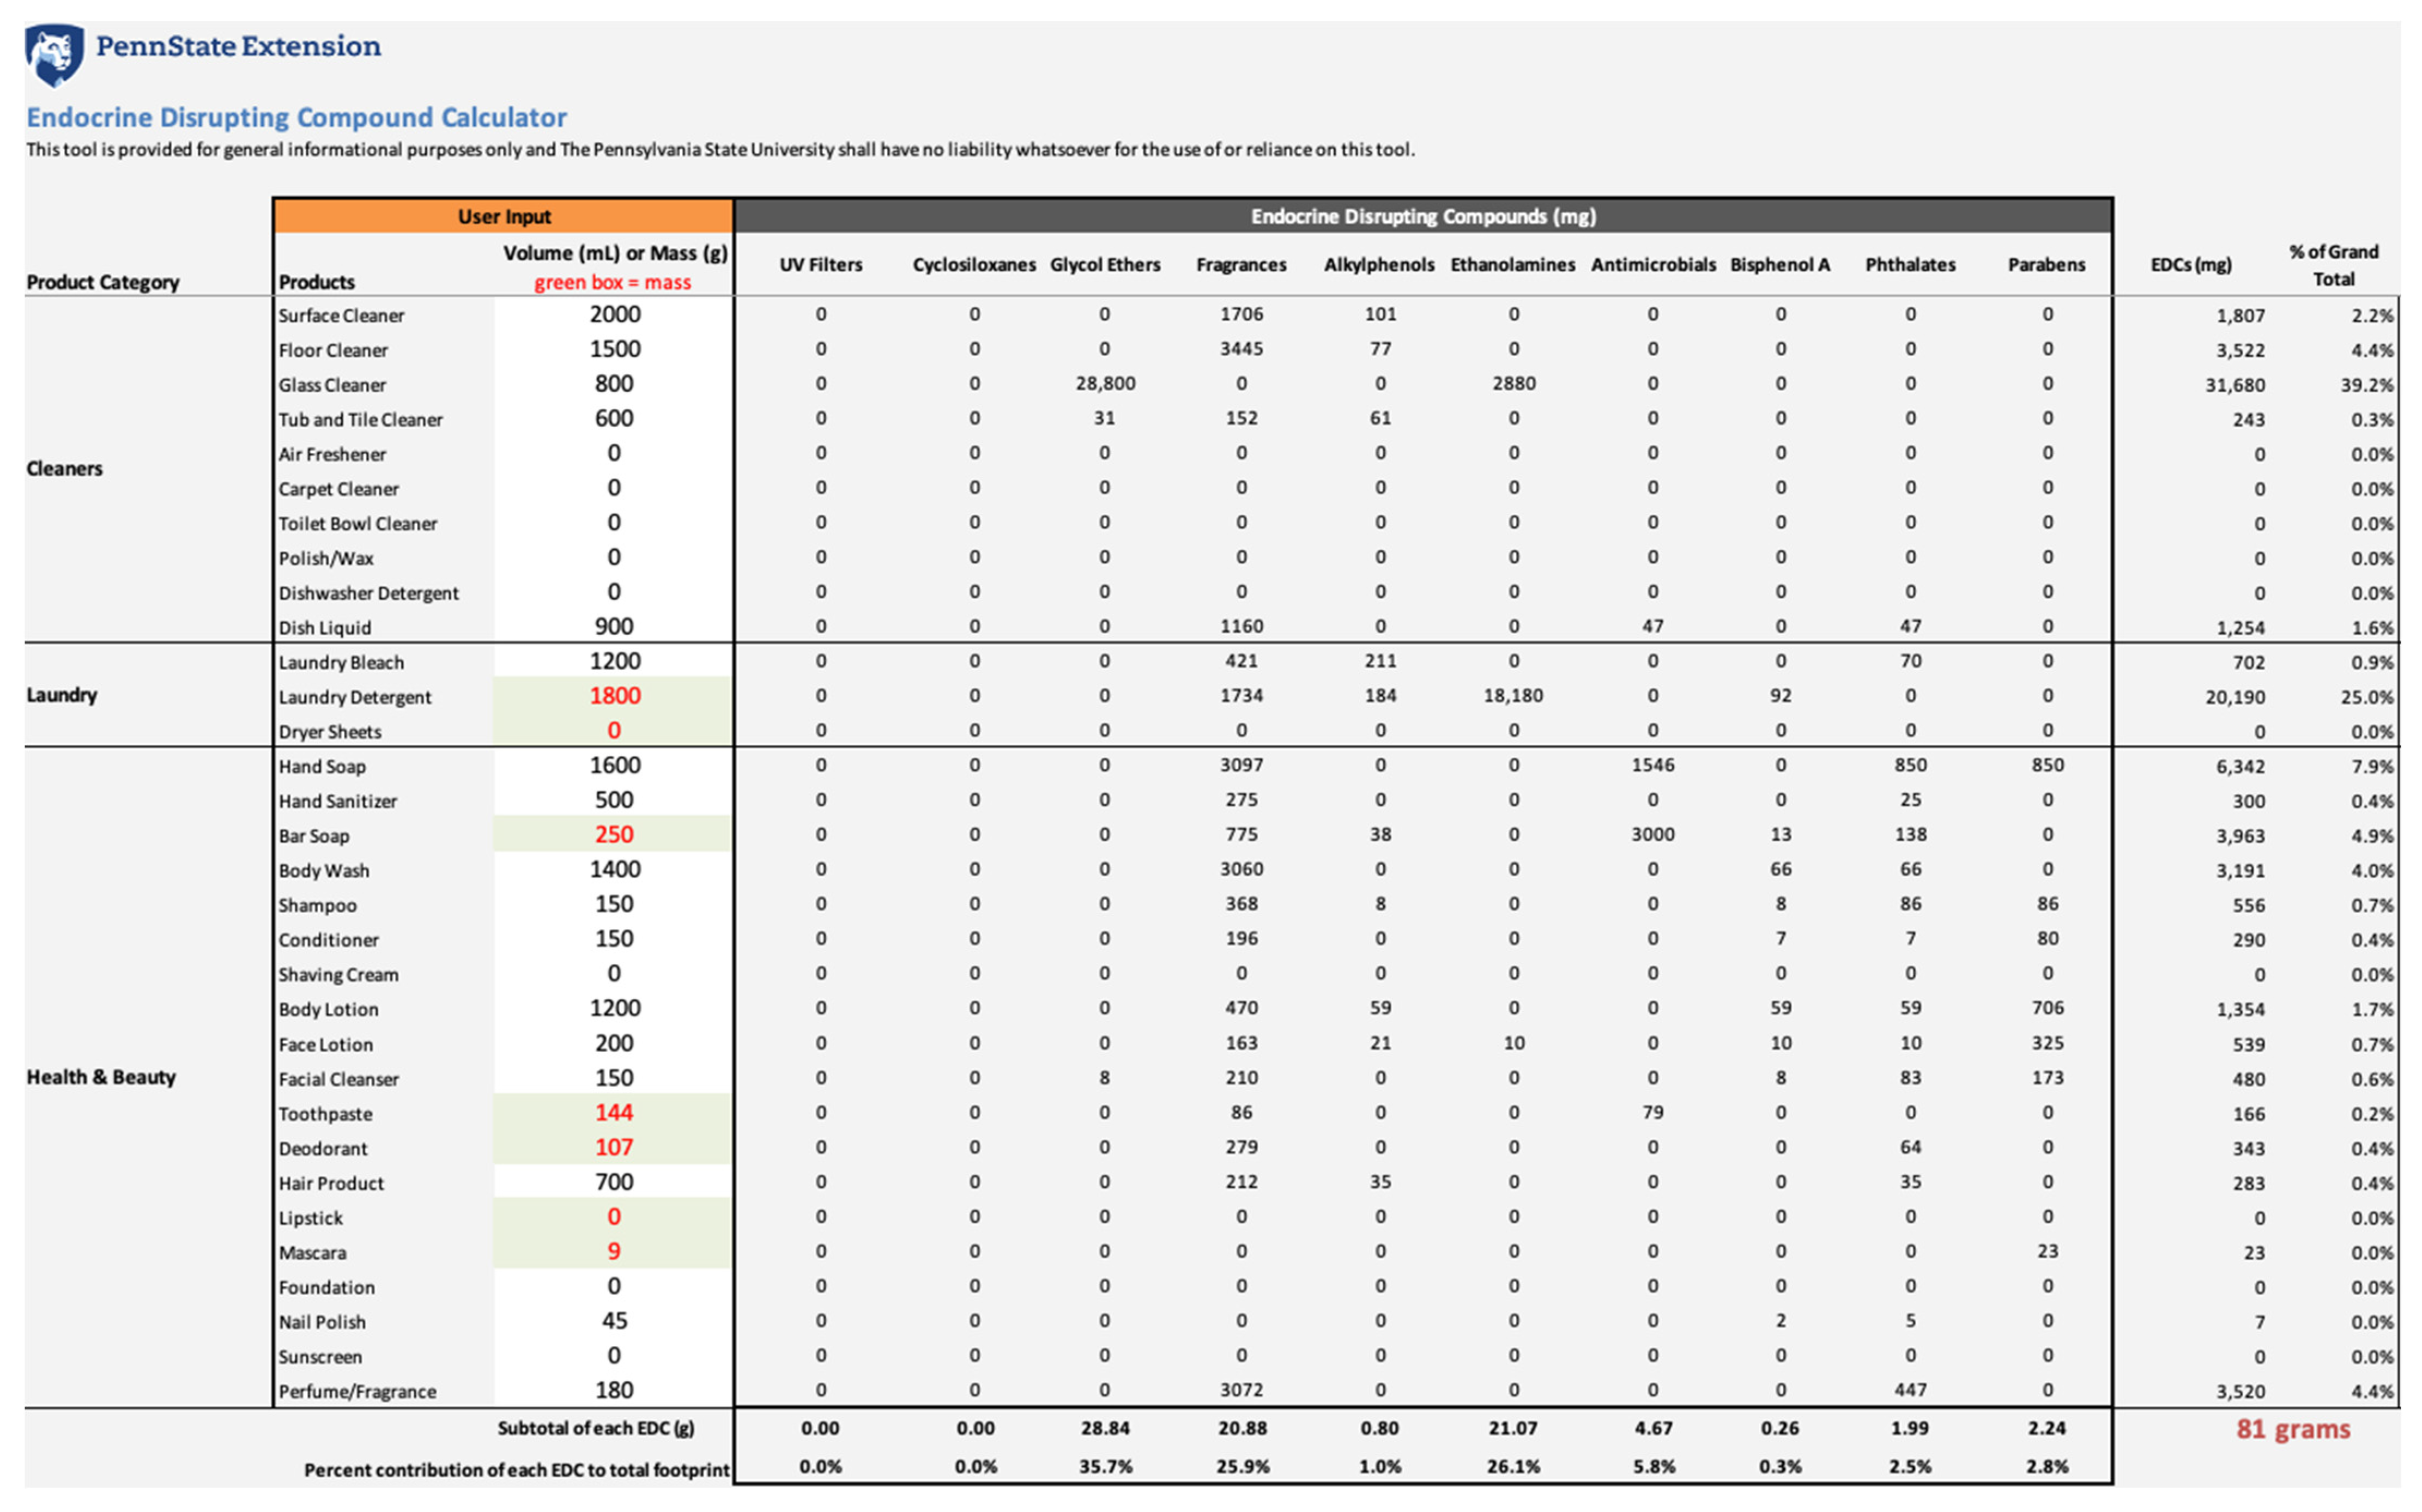
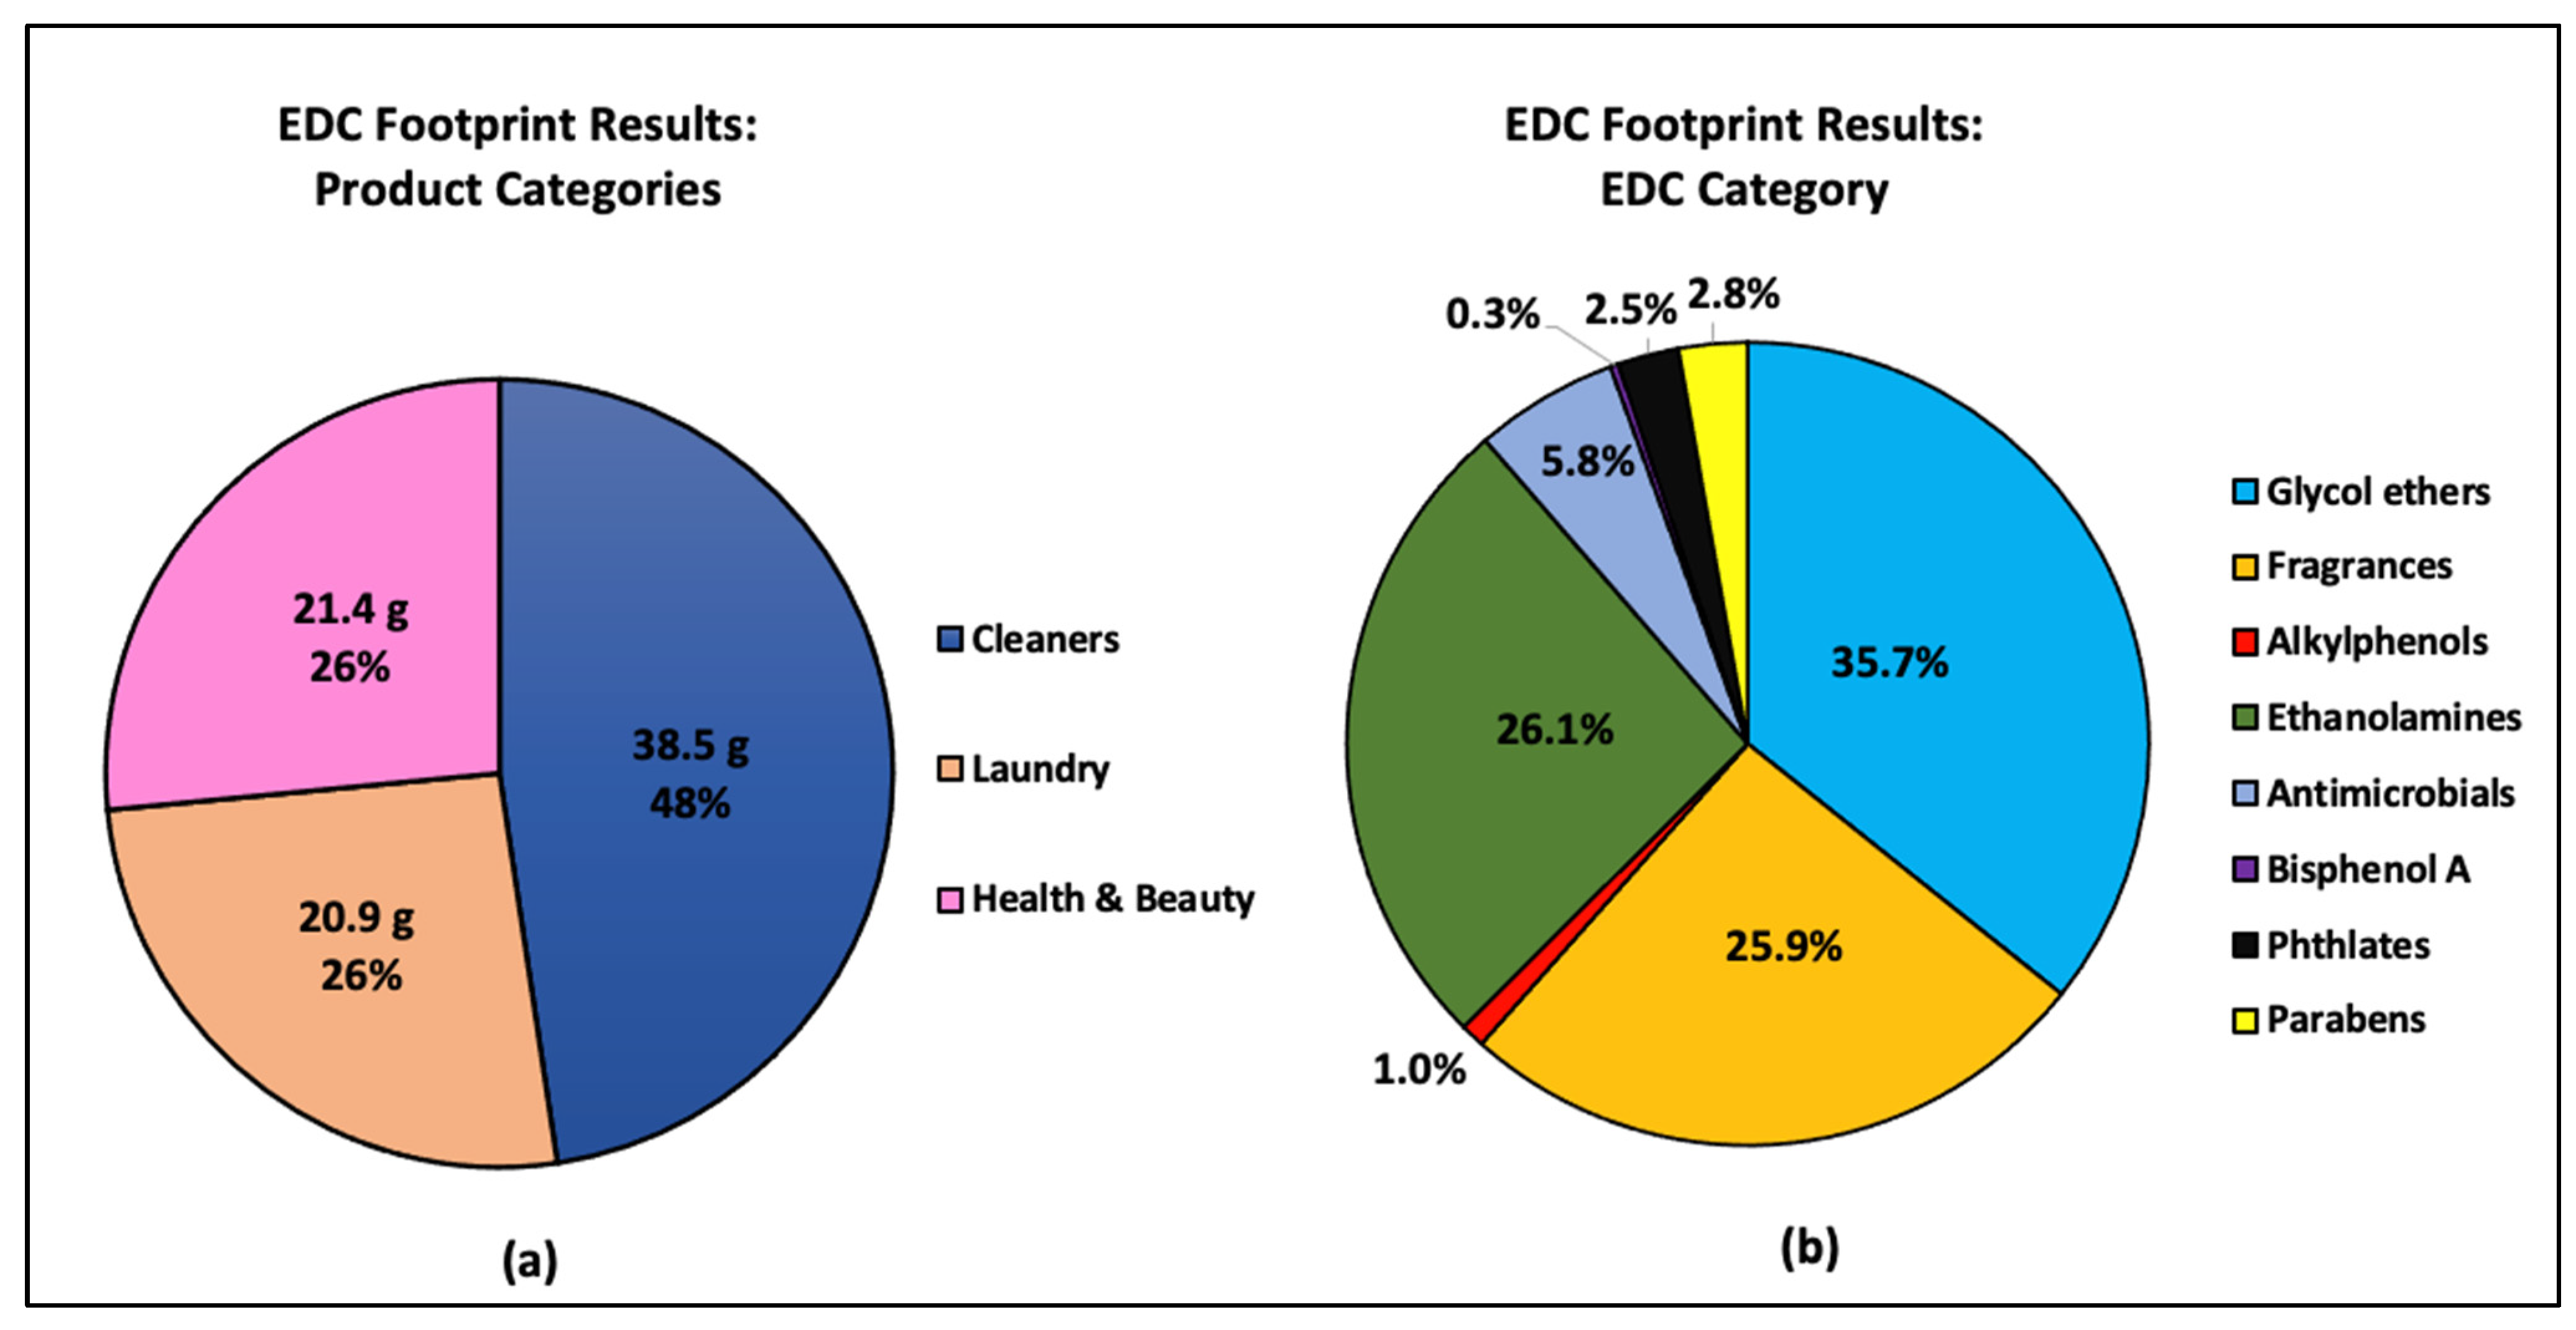
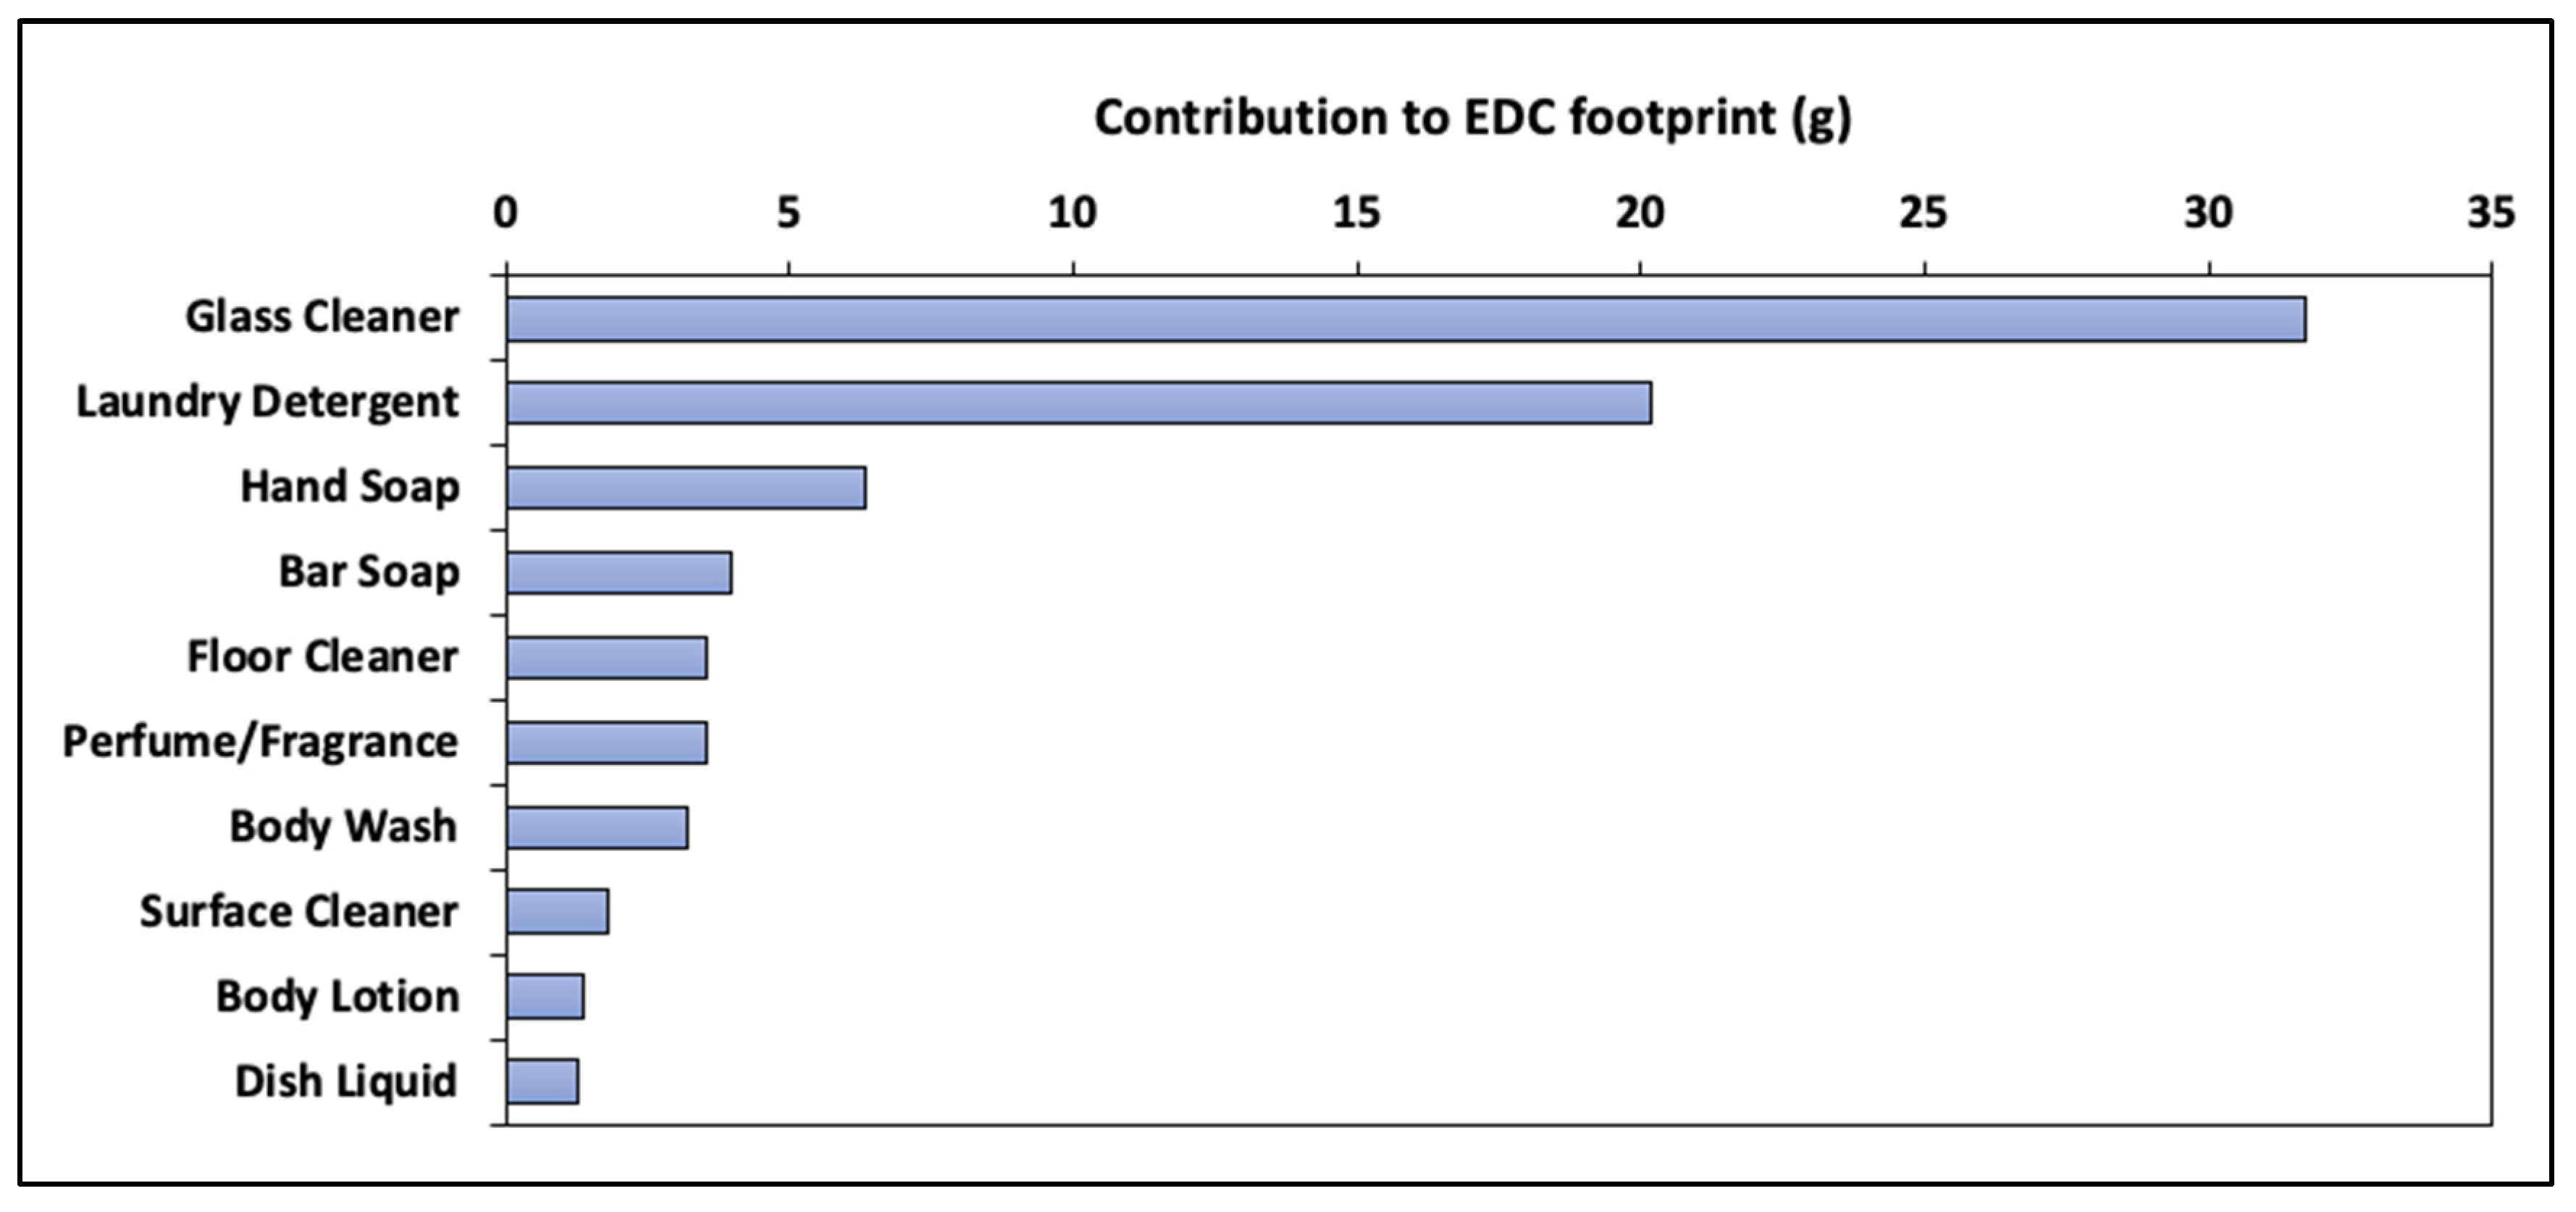
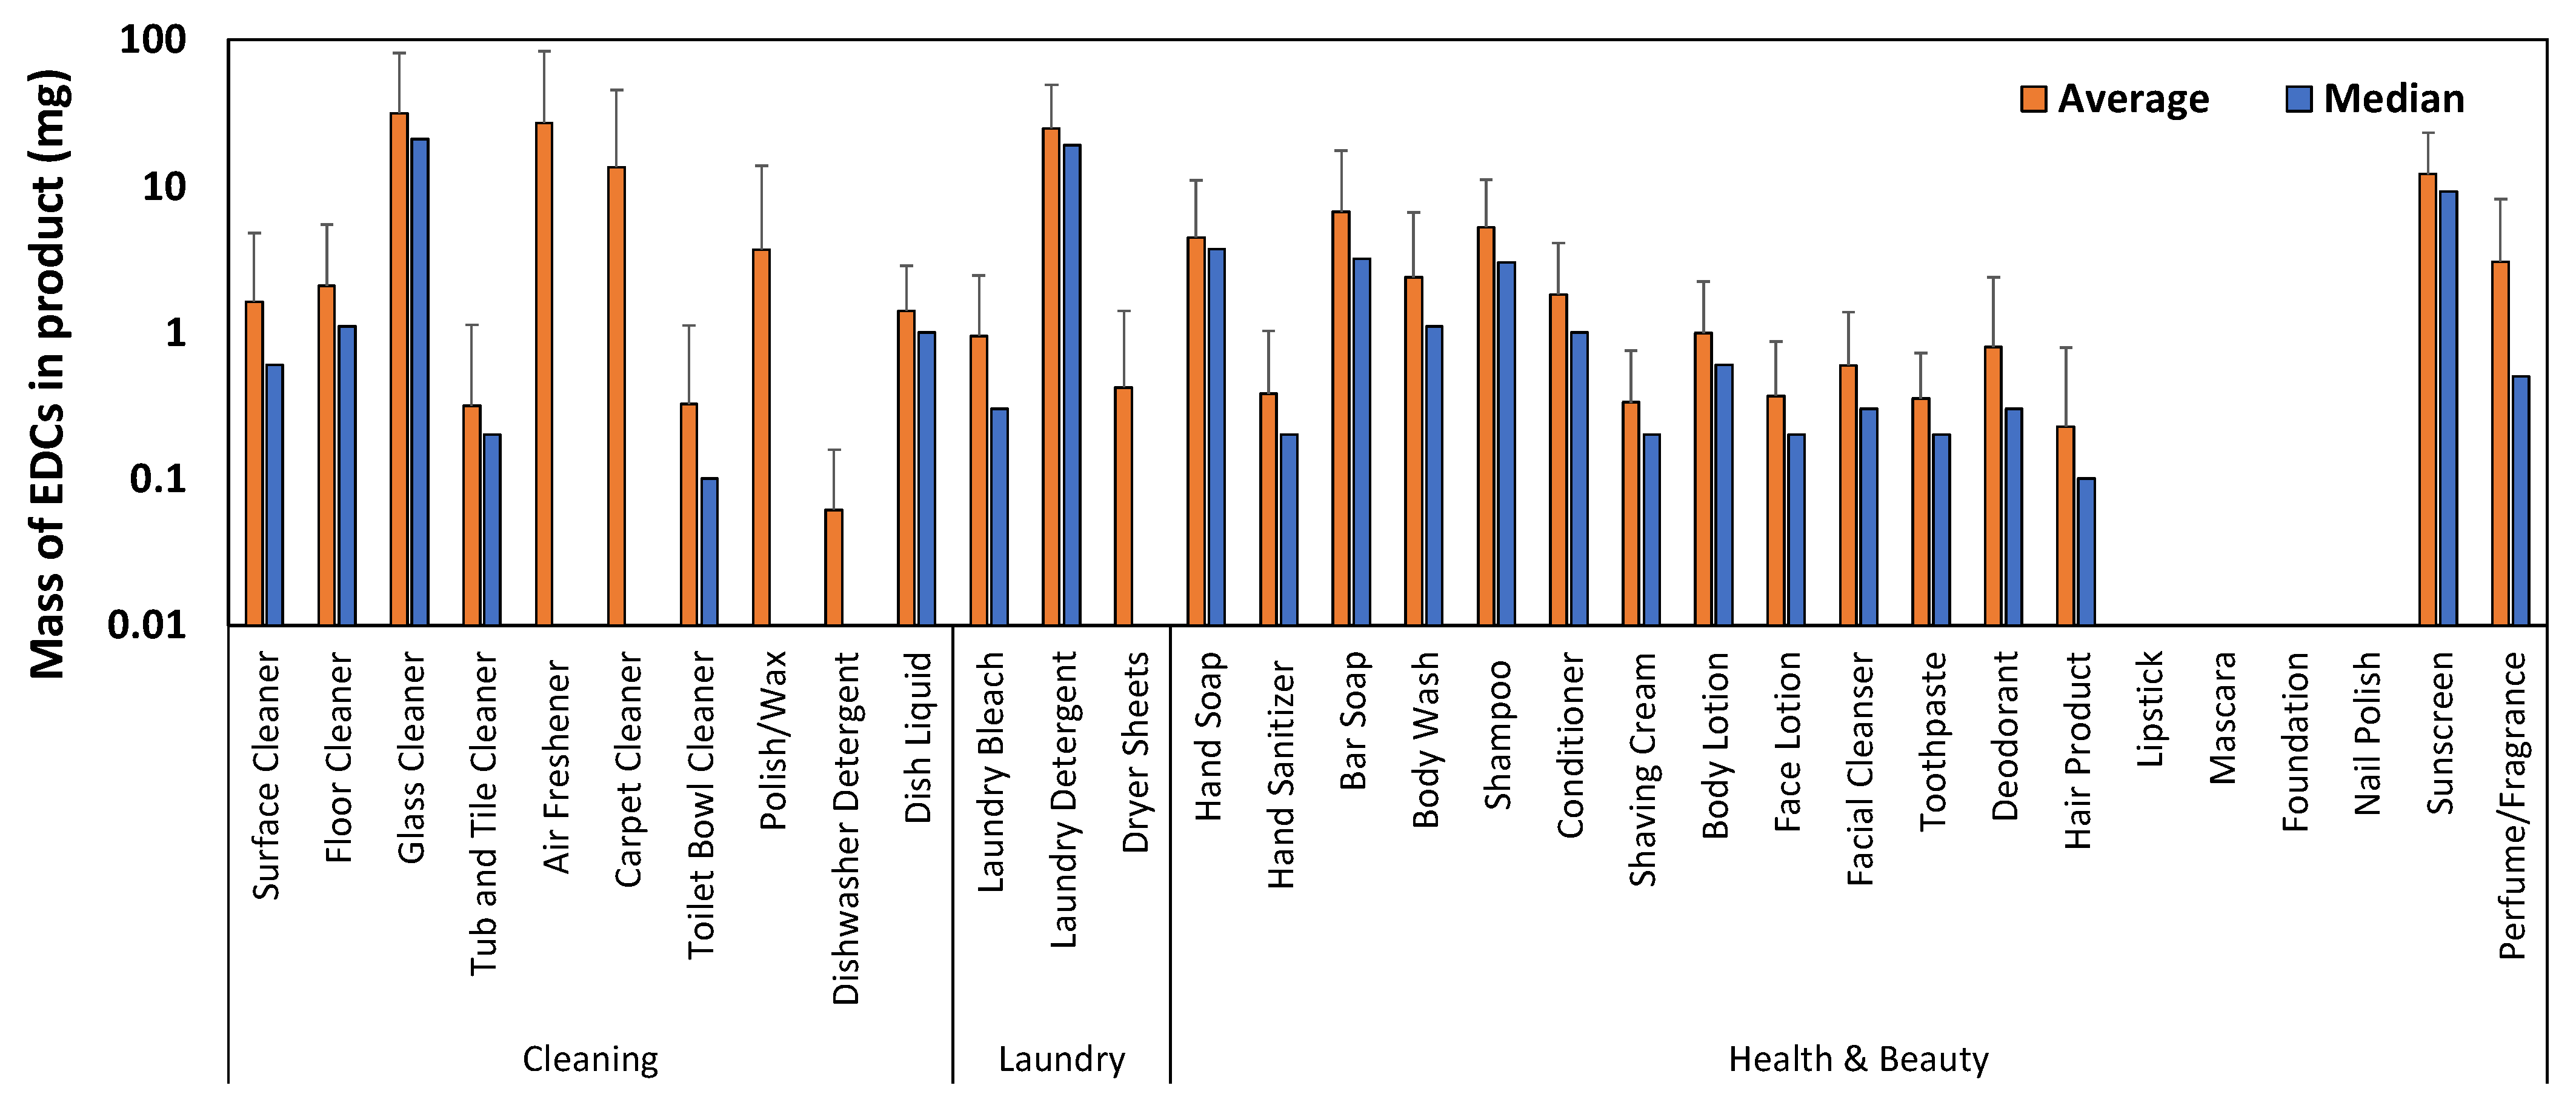
3.1. Example Results

To demonstrate the results that an individual user receives by using the EDC footprint tool, example product inputs are provided in Figure 2, and the output is shown in Figure 3 and Figure 4. Based on the user’s input (Figure 2), the first pie chart shows that EDCs in the household cleaners category contributed to nearly half (48%) of the total EDC footprint, while products in the laundry and health and beauty categories each contributed to 26% of the total EDC footprint (Figure 3a). Glycol ethers, fragrances, and ethanolamines together contributed to more than 85% of the total EDC footprint (Figure 3b). The top individual product that contributed the most to the user’s EDC footprint was glass cleaner (Figure 4). The other products contributing the most to the example user’s footprint were three household cleaners (floor cleaner, surface cleaner, and dish liquid); five health and beauty products (hand soap, bar soap, perfume/fragrance, body wash, and body lotion); and one laundry product (laundry detergent) (Figure 4).
To facilitate decision making regarding the potential for the example user’s EDC footprint to be lowered if individual products were switched to “greener” alternative products (i.e., plant-based laundry detergent, natural air fresheners, etc.), product inputs were recalculated using the “green” version of the calculator. Results show that, by switching to an alternative version of the top five products alone, this example user could reduce the household EDC footprint by more than 75% (Table 3).

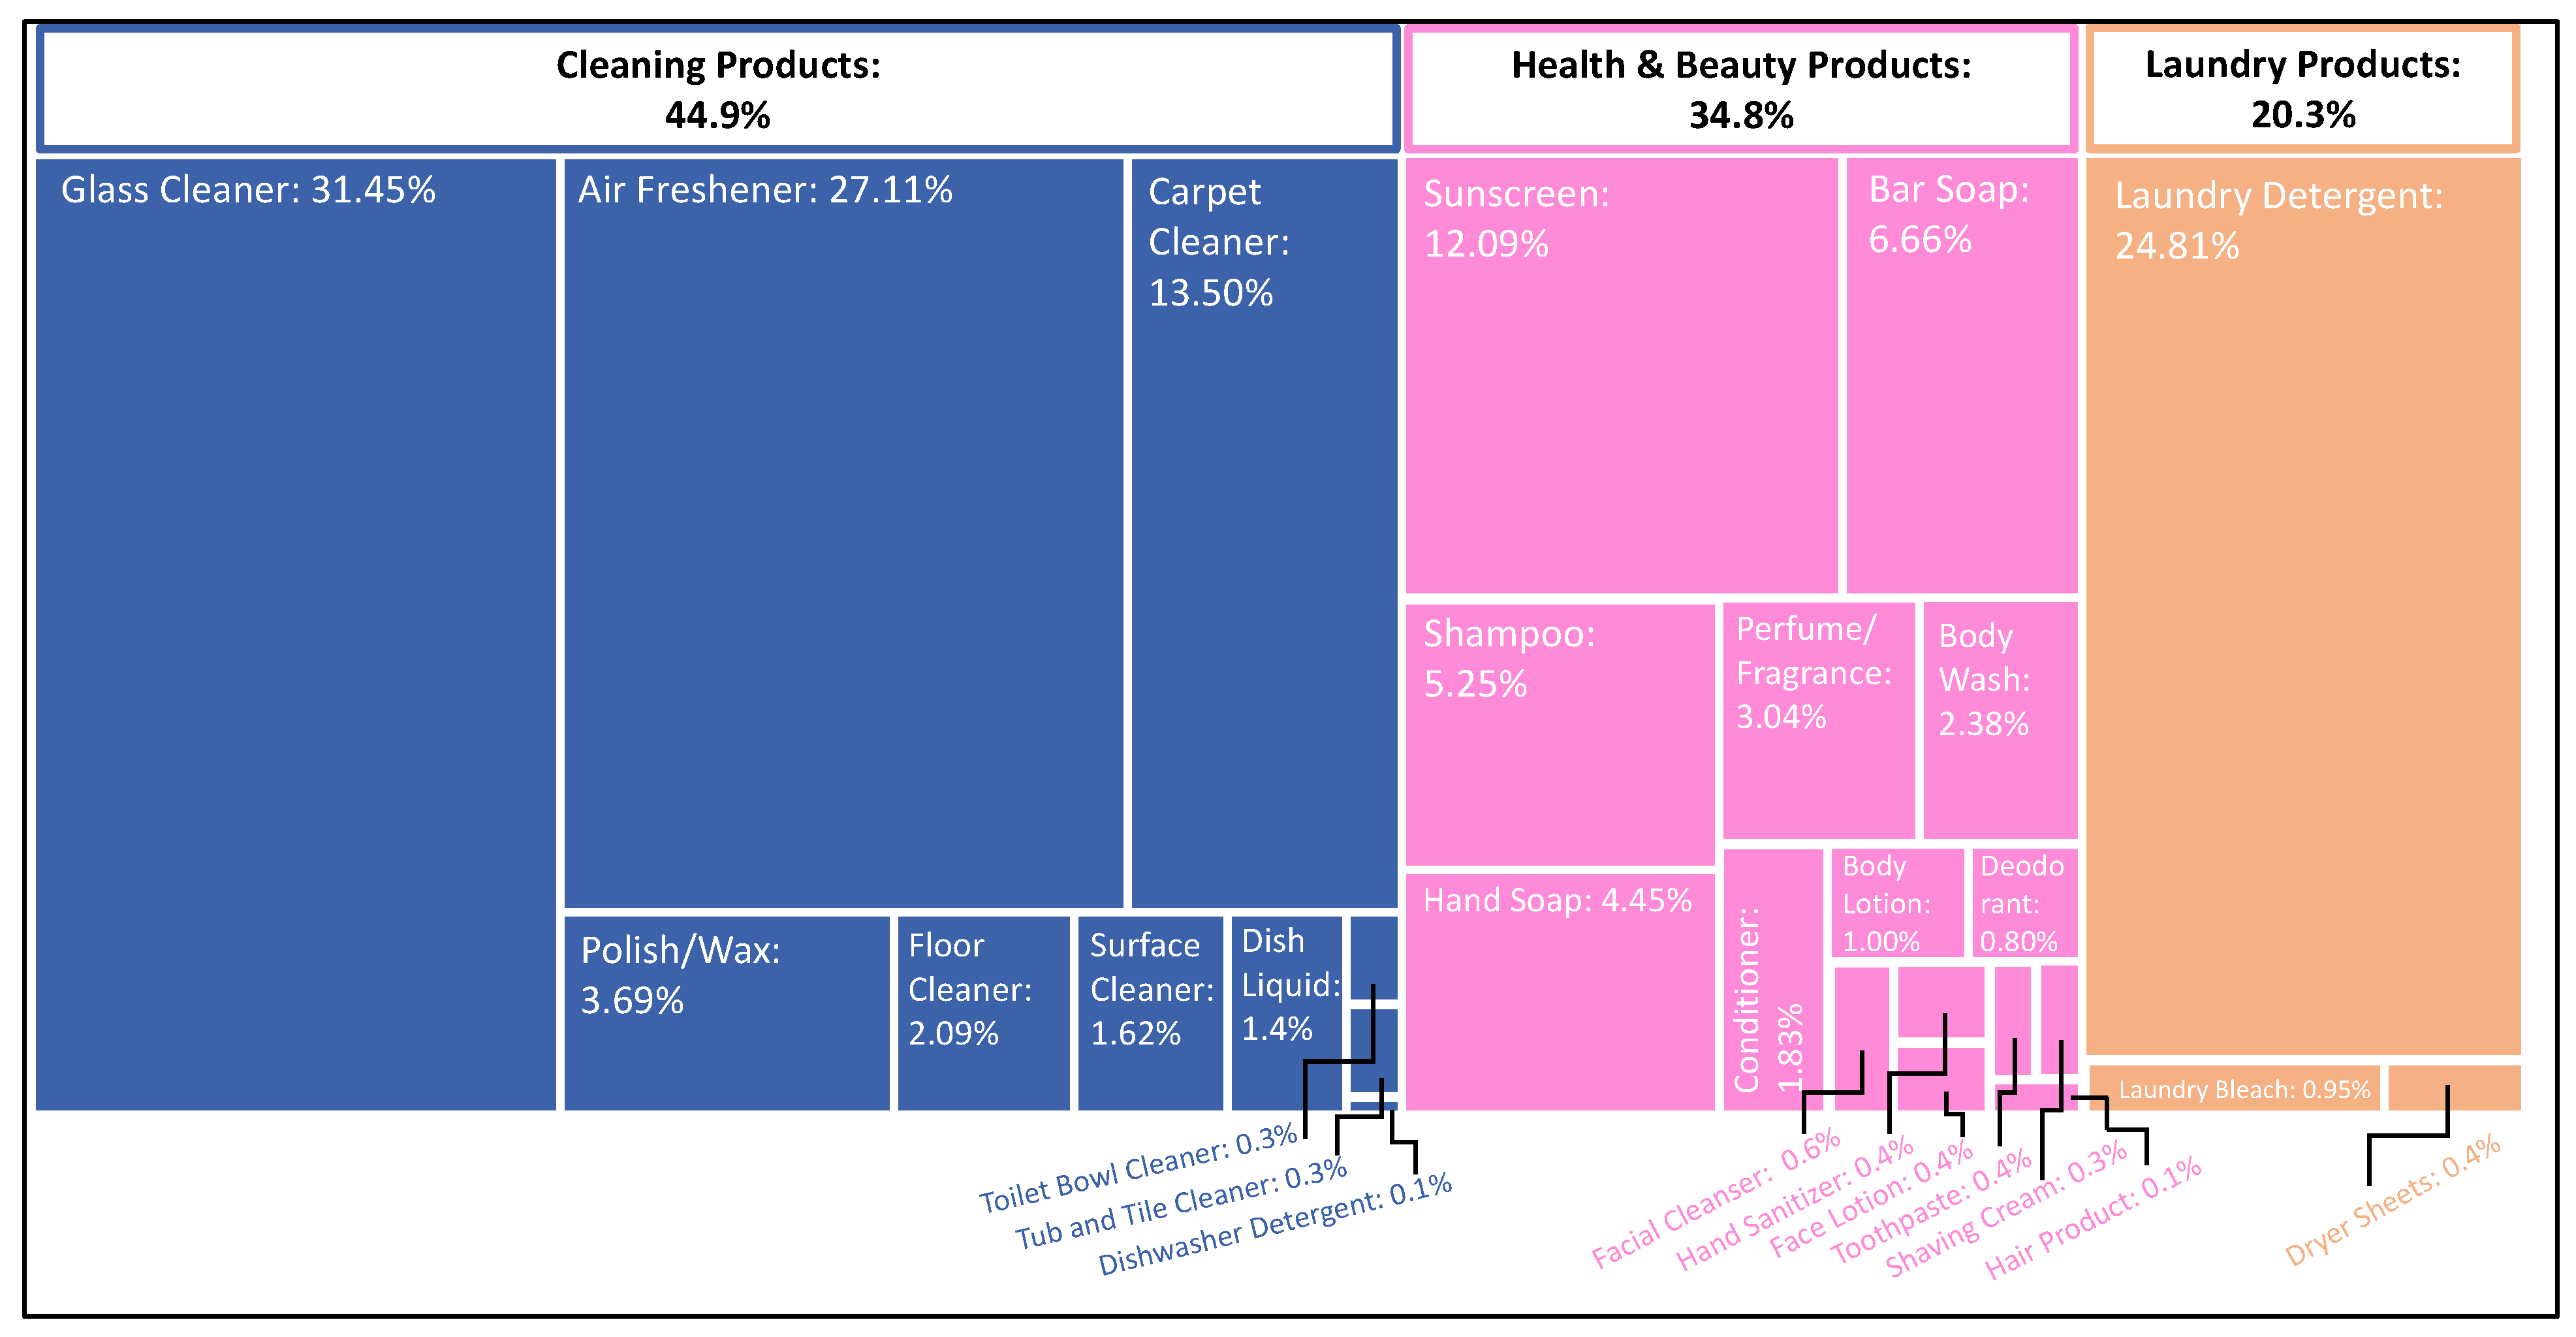
3.2. Citizen Science Footprint Results

The EDC footprints for the 39 citizen scientists who participated in this study ranged from as low as 2.5 g to as high as 720.2 g, with high coefficients of variation (CV > 0.6) for the footprints across all household sizes (Table 4). Household cleaning products contributed nearly half of the total EDCs in the household-based citizen science study. Glass cleaners contain high concentrations of ethanolamines and glycol ether, while air fresheners contain high concentrations of fragrances [27]. Other products that often appeared on the top 10 lists for all 39 footprints were laundry detergent, carpet cleaner, sunscreen, bar soap, and shampoo (Figure 5). Laundry detergents, which generally contain high concentrations of ethanolamines and fragrances [27], are sold and used in larger quantities than are most of the other products.
Evaluation of average masses provides an indication, for this study, of products that are used in most households. In contrast, products with very disparate median and mean values are used relatively in some houses and not at all in others. For example, relatively high values for both mean and median EDC masses from the citizen science portion of this study showed that laundry detergent, glass cleaner, and sunscreen contributed to many of the 39 EDC footprints obtained (Figure 6). In contrast, air freshener and carpet cleaner contributed substantially to the EDC footprints of some households but were not present at all in more than one-half of the households studied, as evidenced by much higher mean than median values for these compounds. Comparison of mean and median values can help future scientists identify potentially different sample populations with targeted outreach techniques. For example, it is likely that nearly all households will have some form of glass cleaner for windows and some laundry detergent. However, efforts to reduce contributions from air fresheners, carpet cleaners, furniture polish, dishwater detergent, and dryer sheets need to target communities where households are likely to have carpets, dishwashers, and dryers.

4. Discussion

The average total footprint for each of the households that participated in the citizen science study was 113–184 g (Table 4). This is such a small mass that it can be challenging to interpret the potential for this footprint to inadvertently impact aquatic ecosystems. Therefore, the footprint calculator was programmed to provide the user with perspective for the interpretation of their results by scaling up the per capita footprint (i.e., total household EDC footprint divided by the number of people in the household) and multiplying by the total population of the United States. For example, the average two-person household‘s footprint of 151 g would estimate that the total EDC footprint for the United States (330 M people) if everyone had the same per capita footprint as the user would be approximately 24,915 metric tonnes, which is the equivalent of approximately 82 commercial airplanes (each plane is approximately 300 tonnes).
In the context of the specific citizen science study conducted here, a more regional context would be the potential impacts of these EDC footprints on the presence of emerging contaminants in the Chesapeake Bay watershed. Given the population in the watershed (18 M people) and an average per capita EDC footprint, the total EDC footprint across the Bay watershed would be 1287 metric tonnes. If this entire footprint reached the Chesapeake Bay, which has a volume of approximately 81.8 km3, the EDC concentration in the Bay would be 15.7 g/L. Although some of these EDCs can be treated by wastewater treatment plants or septic tanks before ultimately reaching the Bay, mitigation in the treatment facilities may not be effective enough to remove potential ecological risks.
These estimated footprints are significant given the potential impact of the presence of these contaminants in the environment even at trace concentrations (μg–ng/L). For example, triclosan has been shown to affect hindlimb development in amphibians at concentrations as low as 0.15 μg/L [19]. Musks, which are significant contributors to the fragrances commonly found in perfume and cologne [29], have been shown to exhibit estrogenic effects [31,32]. BPA is also known to exhibit estrogenic potential and has been documented to cause gender skewing in flathead minnows at exposure concentrations as low as 0.32 ng/L [33]. Additionally, EDCs have been shown to exhibit synergistic behavior when multiple compounds are present together, such that the total endocrine-disrupting potential of the “cocktail” is greater than simply adding the potential of each individual compound [34]. Although the potential harm to human health is unclear, there is a significant need to understand synergistic interactions and the risks to humans and the environment.
While these results clearly have implications for both human and environmental health, Dodson et al. [27] found that various compounds detected in tested personal care products were not present on the products’ labels. This makes decision making more challenging for consumers, as even someone who wants to be an informed consumer may be unable to make satisfying decisions about product selection, especially in real time while shopping. Additionally, the study found that some product labels can be misleading due to labeling standards, with some products advertising to be “fragrance-free” when they indeed contained synthetic fragrances to mask an undesirable chemical odor. Rather than the product being “free” of fragrances, the product has a neutral smell due to a combination of various fragrances ultimately canceling each other out. Therefore, this EDC calculator tool can serve as a mechanism to increase awareness of EDCs and their potential effects on environmental quality, as well as engage the public about the role everyone plays in contributing to the presence of EDCs in the environment.
The rhetoric surrounding the presence of EDCs in the aquatic environment is often filled with fear and uncertainty, particularly because of the near-ubiquitous presence of synthetic chemicals in the environment and because of the lack of water quality standards for EDCs. Here, we sought to provide a tool that could shift the public perception from one of fear to one of empowerment by providing consumers with the knowledge they need to make more informed choices. The results of the tool may help to reduce the consumption of EDC-containing products and ultimately reduce EDC presence in the environment.

Author Contributions

Conceptualization, H.P. and R.T.; methodology, H.P., R.T., K.H., M.G. and L.G.; software, H.P., R.T., M.G., L.G. and S.G.; validation, H.P., R.T. and K.H.; formal analysis, R.T. and K.H.; investigation, H.P., R.T., K.H. and B.S.; resources, H.P. and B.S.; data curation, R.T. and K.H.; writing—original draft preparation, H.P. and R.T.; writing—review and editing, K.H.; visualization, R.T., K.H., M.G. and L.G.; supervision, H.P. and B.S.; project administration, H.P. and B.S.; funding acquisition, H.P. and B.S. All authors have read and agreed to the published version of the manuscript.

Funding

This research was funded by the National Science Foundation (Grant Number 1743981). Rachel Taylor was supported by Penn State’s College of Engineering Summer Research Experience for Undergraduates (REU) program in 2014 and is currently supported by the Penn State Department of Agricultural and Biological Engineering. Kathryn Hayden is currently supported by a cooperative agreement from the United States Department of Agriculture’s Agricultural Research Service (USDA-ARS). Marc Gluberman was funded by Penn State’s College of Agricultural Sciences Summer Undergraduate Research Program in 2015. Laura Garcia was selected to participate in the Summer Research Opportunities Program in 2015 and was supported at Penn State through support from the College of Agricultural Sciences diversity program and from the Department of Agricultural and Biological Engineering. Serap Gorucu was funded, in part, by a grant from the Penn State Office of Physical Plant. Heather Preisendanz is supported, in part, by the USDA National Institute of Food and Agriculture Federal Appropriations under Project PEN04574 and Accession Number 1004448.

Institutional Review Board Statement

The Pennsylvania State University Office of Research Protections determined that this research met the criteria for exempt research according to the policies of the institution and the provisions of applicable federal regulations.

Informed Consent Statement

Informed consent was obtained from all citizen scientists who volunteered to participate in this study.

Data Availability Statement

The calculator tools can be accessed at: https://sites.psu.edu/edccalculator/ (Created on 10 February 2017; accessed on 25 February 2022).

Acknowledgments

The authors wish to thank Jamie Shallenberger from the Susquehanna River Basin Commission for his help in recruiting citizen scientists to participate in this project.

Conflicts of Interest

The authors declare no conflict of interest. The funders had no role in the design of the study; in the collection, analyses, or interpretation of data; in the writing of the manuscript; or in the decision to publish the results.

References

  1. Personal Care Products Council. Driving the Economy, Shaping the Future: Economic & Social Contributions Report. 2020. Available online: https://www.personalcarecouncil.org/wp-content/uploads/2020/09/PCPC_EcoReport_2020.pdf (accessed on 23 February 2022).
  2. Wee, S.Y.; Aris, A.Z. Endocrine disrupting compounds in drinking water supply system and human health risk implication. Environ. Int. 2017, 106, 207–233. [Google Scholar] [CrossRef] [PubMed]
  3. Centers for Disease Control and Prevention (CDC). Fourth National Report on Human Exposure to Environmental Chemicals; Department of Health and Human Services: Atlanta, GA, USA, 2009. Available online: https://www.cdc.gov/exposurereport/index.html (accessed on 23 February 2022).
  4. Karwacka, A.; Zamkowska, D.; Radwan, M.; Jurewicz, J. Exposure to modern, widespread environmental endocrine disrupting chemicals and their effect on the reproductive potential of women: An overview of current epidemiological evidence. Hum. Fertil. 2019, 22, 2–25. [Google Scholar] [CrossRef] [PubMed]
  5. Gregoraszcuk, E.L.; Rak, A.; Ludewig, G.; Gasinska, A. Effects of estradiol, PCB3 and their hydroxylated metabolites on proliferation, cellcycle, and apoptosis of human breast cancer cells. Environ. Toxicol. Pharmacol. 2008, 25, 227–233. [Google Scholar] [CrossRef] [PubMed]
  6. Kolpin, D.W.; Furlong, E.T.; Meyer, M.T.; Thurman, E.M.; Zaugg, S.D.; Barber, L.B.; Buxton, H.T. Pharmaceuticals, hormones, and other organic wastewater contaminants in U.S. streams, 1999–2000: A national reconnaissance. Environ. Sci. Technol. 2002, 36, 1201–1211. [Google Scholar] [CrossRef] [Green Version]
  7. Shull, D.; Pulket, M. Causal Analysis of the Smallmouth Bass Decline in the Susquehanna and Juniata Rivers; Pennsylvania Department of Environmental Protection: Philadelphia, PA, USA, 2015. Available online: https://files.dep.state.pa.us/water/Drinking%20Water%20and%20Facility%20Regulation/WaterQualityPortalFiles/SusquehannaRiverStudyUpdates/SMB_CADDIS_Report.pdf (accessed on 23 February 2022).
  8. Iwanowicz, L.R.; Blazer, V.S.; Pinkney, A.E.; Guy, C.P.; Major, A.M.; Munney, K.; Mierzykowski, S.; Lingenfelser, S.; Secord, A.; Patnode, K.; et al. Evidence of estrogenic endocrine disruption in smallmouth and largemouth bass inhabiting Northeast U.S. national wildlife refuge waters: A reconnaissance study. Ecotoxicol. Environ. Saf. 2016, 124, 50–59. [Google Scholar] [CrossRef]
  9. Blazer, V.S.; Gordon, S.; Jones, D.K.; Iwanowicz, L.R.; Walsh, H.L.; Sperry, A.J.; Smalling, K.L. Retrospective analysis of estrogenic endocrine disruption and land-use influences in the Chesapeake Bay watershed. Chemosphere 2021, 266, 129009. [Google Scholar] [CrossRef]
  10. Baillie, J.E.M.; Hilton-Taylor, C.; Stuart, S.N. IUCN Red List of Threatened Species: A Global Species Assessment; International Union for Conservation of Nature: Gland, Switzerland; Cambridge, UK, 2004; Available online: https://www.iucnredlist.org/resources/baillie2004 (accessed on 25 February 2022).
  11. Stuart, S.N.; Chanson, J.S.; Cox, N.A.; Young, B.E.; Rodrigues, A.S.L.; Fischman, D.L.; Waller, R.W. Status and trends of amphibian declines and extinctions worldwide. Science 2004, 306, 1783–1786. [Google Scholar] [CrossRef] [Green Version]
  12. Pyron, R.A. Global amphibian declines have winners and losers. Proc. Natl. Acad. Sci. USA 2018, 115, 3739–3741. [Google Scholar] [CrossRef] [Green Version]
  13. Wake, D.B.; Vredenburg, V.T. Are we in the midst of the sixth mass extinction? A view from the world of amphibians. Proc. Natl. Acad. Sci. USA 2008, 105, 11466–11473. [Google Scholar] [CrossRef] [Green Version]
  14. Collins, J.P.; Storfer, A. Global amphibian declines: Sorting the hypotheses. Divers. Distrib. 2003, 9, 89–98. [Google Scholar] [CrossRef]
  15. Collins, J.P. History, novelty, and emergence of an infectious amphibian disease. Proc. Natl. Acad. Sci. USA 2013, 110, 9193–9194. [Google Scholar] [CrossRef] [PubMed] [Green Version]
  16. Mina, O.; Gall, H.E.; Carlson, B.; Langkilde, T.L. A Preliminary Assessment of Endocrine Disrupting Compounds in Vernal Ponds in Central Pennsylvania; American Society of Agricultural and Biological Engineers: St. Joseph, MI, USA, 2014; Paper No. 1910944. [Google Scholar] [CrossRef]
  17. Mina, O.; Gall, H.E.; Elliott, H.A.; Watson, J.E.; Mashtare, M.L.; Langkilde, T.; Harper, J.P.; Boyer, E.W. Estrogen occurrence and persistence in vernal pools impacted by wastewater irrigation practices. Agric. Ecosyst. Environ. 2018, 257, 103–112. [Google Scholar] [CrossRef]
  18. Smits, A.P.; Skelly, D.K.; Bolden, S.R. Amphibian intersex in suburban landscapes. Ecosphere 2014, 5, 1–9. [Google Scholar] [CrossRef]
  19. Veldhoen, N.; Skirrow, R.C.; Osachoff, H.; Wigmore, H.; Clapson, D.J.; Gunderson, M.P.; Van Aggelen, G.; Helbing, C.C. The bactericidal agent triclosan modulates thyroid hormone-associated gene expression and disrupts postembryonic anuran development. Aquat. Toxicol. 2006, 80, 217–227. [Google Scholar] [CrossRef] [PubMed]
  20. Andrews, W.J.; Masoner, J.R.; Cozzarelli, I.M. Emerging contaminants at a closed and an operating landfill in Oklahoma. Groundw. Monit. Remediat. 2012, 32, 120–130. [Google Scholar] [CrossRef]
  21. Phillips, P.; Chalmers, A. Wastewater effluent, combined sewer overflows, and other sources of organic compounds to Lake Champlain. J. Am. Water Resour. Assoc. 2009, 45, 45–57. [Google Scholar] [CrossRef]
  22. Snyder, S.A.; Westerhoff, P.; Yoon, T.; Sedlak, D.L. Pharmaceuticals, personal care products, and endocrine disruptors in water: Implications for the water industry. Environ. Eng. Sci. 2004, 20, 449–469. [Google Scholar] [CrossRef]
  23. United States Department of Environmental Protection (USEPA). Treating Contaminants of Emerging Concern: A Literature Review Databas; Office of Water Engineering and Analysis Division: Washington, DC, USA, 2010; EPA-820-R-10-002. Available online: https://nepis.epa.gov/Exe/ZyPDF.cgi/P1008IK3.PDF?Dockey=P1008IK3.PDF (accessed on 25 February 2022).
  24. Verlicchi, P.; Galletti, A.; Petrovic, M.; Barceló, D. Hospital effluents as a source of emerging pollutants: An overview of micropollutants and sustainable treatment options. J. Hydrol. 2010, 389, 416–428. [Google Scholar] [CrossRef]
  25. Food, Drug, and Cosmetic Act, 21 United States Code §§ 301–392. 1958. Available online: https://www.loc.gov/item/uscode1958-004021009/ (accessed on 23 February 2022).
  26. National Archives and Records Administration. Code of Federal Regulations: Regulations Under Section 4 of the Fair Packaging and Labeling Act, 16 CFR. 1995. Available online: https://www.loc.gov/item/cfr1995051-T16CIP500/ (accessed on 23 February 2022).
  27. Dodson, R.E.; Nishioka, M.; Standley, L.J.; Perovich, L.J.; Brody, J.G.; Rudel, R.A. Endocrine disruptors and asthma-associated chemicals in consumer products. Environ. Health Persp. 2012, 120, 935–943. [Google Scholar] [CrossRef] [Green Version]
  28. Consumer Product Information Database (CPID). Available online: https://www.whatsinproducts.com (accessed on 23 February 2022).
  29. Peters, R.J.B. Phthalates and Artificial Musks in Perfumes; TNO Environment and Geosciences: Apeldoorn, The Netherlands, 2005; R2005/011. [Google Scholar]
  30. Penn State Extension. Endocrine Disrupting Compounds (EDC) Footprint Calculator. Available online: https://extension.psu.edu/endocrine-disrupting-compounds-edc-footprint-calculator (accessed on 23 February 2022).
  31. Bitsch, N.; Dudas, C.; Körner, W.; Failing, K.; Biselli, S.; Rimkus, G.; Brunn, H. Estrogenic activity of musk fragrances detected by the E-Screen assay using human MCF-7 cells. Arch. Environ. Contam. Toxicol. 2002, 43, 0257–0264. [Google Scholar] [CrossRef]
  32. Schreurs, R.H.M.M.; Sonneveld, E.; Jansen, J.H.J.; Seinen, W.; van der Burg, B. Interaction of polycyclic musks and UV filters with the estrogen receptor, androgen receptor, and progesterone receptor in reporter gene bioassays. Toxicol. Sci. 2005, 83, 264–272. [Google Scholar] [CrossRef] [PubMed] [Green Version]
  33. Parrott, J.L.; Blunt, B.R. Life-cycle exposure of fathead minnows (Pimephales promelas) to an ethinylestradiol concentration below 1 ng/L reduces egg fertilization success and demasculinizes males. Environ. Toxicol. 2005, 20, 131–141. [Google Scholar] [CrossRef] [PubMed]
  34. Wilkinson, J.L.; Hooda, P.S.; Barker, J.; Barton, S.; Swinden, J. Ecotoxic pharmaceuticals, personal care products, and other emerging contaminants: A review of environmental, receptor-mediated, developmental, and epigenetic toxicology with discussion of proposed toxicity to humans. Crit. Rev. Environ. Sci. Technol. 2016, 46, 336–381. [Google Scholar] [CrossRef] [Green Version]
Figure 1. Endocrine-disrupting compound (EDC) footprint calculator user interface. User input is accepted in either volume (mL) or mass (g). The calculator then calculates and displays the estimated mass of EDCs in each product. The total EDC footprint for all products entered by the user is displayed in red on the bottom right side of the tool’s interface.
Water 14 01587 g001
Figure 2. Example of one user’s input to the endocrine-disrupting compound (EDC) footprint calculator and corresponding footprint calculation results, where the amount of each product input in either volume (mL) or mass (g), depending on whether the product is a solid (green box with red text) or a liquid (white box with black text).
Water 14 01587 g002
Figure 3. Example of endocrine-disrupting compound (EDC) footprint calculator results for one user with (a) the mass and percent contributions of each product category to the total estimated EDC footprint; (b) the percent contribution of each EDC to the total estimated EDC footprint.
Water 14 01587 g003
Figure 4. Example of endocrine-disrupting compound (EDC) footprint calculator results for the top 10 products and their contribution to the overall EDC footprint for one example user.
Water 14 01587 g004
Figure 5. Average percentages of the contribution of each product to the overall footprint of cleaning products, health and beauty products, and laundry products, with products in the cleaning, health and beauty, and laundry categories, contributing an average of 44.9%, 34.8%, and 20.3%, respectively, to the total EDC footprints of the 39 participating citizen scientists. The size of each rectangle provides a visual representation of the extent to which that product contributes to the total footprint.
Water 14 01587 g005
Figure 6. Average and median masses (mg) of EDCs calculated to be in each product for the 39 participating citizen scientists. Error bars represent the standard deviations.
Water 14 01587 g006
Table 1. Categories of endocrine-disrupting compounds (EDCs) and specific compounds within each category that were included in the EDC footprint calculator.
EDC CategoryCompounds
UV FiltersOctinoxate, Benzophenone, Benzophenone-1, Benzophenone-3
CyclosiloxanesDodecamethylcyclohexylsiloxane, Decamethylcyclopentasiloxane, Octamethylcyclotetrasiloxane
Parabens2-Butyl paraben, Methyl paraben, Ethyl paraben,
Glycol Ethers2,2-Butoxyethoxyethanol, 2,2-Methoxyethoxyethanol, 2-Phenoxyethanol, 2-Butoxyethanol
AntimicrobialsTriclosan, Triclocarban
EthanolaminesMonoethanolamine, Diethanolamine
PhthalatesDiethyl phthalate, Di-n-propyl phthalate, Di-n-octyl phthalate, Di-n-hexyl phthalate, Di-n-butyl phthalate, Di-isononyl phthalate, Di-isobutyl phthalate, Di- cyclohexyl phthalate, Benzylbutyl phthalate, Bis(2-ethylhexyl) phthalate, Bis(2-ethylhexyl)adipate
FragrancesPhenethyl alcohol, Musk xylene, Musk ketone, Methyl ionone, Isobornyl acetate, Methyl salicylate, Hexyle cinnemal, 1,3,4,6,7,8-Hexahydro-4,6,6,7,8,8-hexamethylcyclopenta [g]-2-benzopyran (HHCB), 6,7-Dihydro-1,1,2,3,3-pentamethyl-4(5H)-indanone (DPMI), Bucinal, 6-acetyl-1,1,2,4,4,7 hexamethyltetraline (AHTN), Terpineol, Pinene, Eugenol, Methyl salicylate, Methyl eugenol, Benzylacetate, Diphenyl ether, Limonene, Linalool
AlkylphenolsNonylphenol diethoxylate, Nonylphenol monoethoxylate, 4-t-Nonylphenol, Octylphenol diethoxylate, Octylphenol monoethoxylate, 4-t-Octylphenol
Table 2. Demographic information for each of the 39 citizen scientists located across the Susquehanna River basin in the northeastern United States who volunteered to calculate and share their endocrine-disrupting compound (EDC) footprint.
Participant DemographicsNumber of ParticipantsPercentage of
Participants
1 Person household1026%
2 Person household1231%
3 Person household923%
4 Person household821%
Table 3. Potential endocrine-disrupting compound (EDC) footprint reduction that could be achieved by replacing the top five contributing products with a greener alternative for one example user.
ProductEDC Mass (g)
Conventional Products
EDC Mass (g)
Alternative Products
Percent Reduction
(%)
Glass cleaner31.680.4498.6
Laundry detergent20.190.0999.6
Hand soap6.343.3447.3
Bar soap3.960.0499.0
Floor cleaner3.520.3889.2
All other products15.93NA0.0
Total Footprint (all products)81.6220.2175.2
NA = not applicable, as only the top five products were switched in this example to alternative products. All other products in this example input (Figure 2) remained the same.
Table 4. Summary by household size of endocrine-disrupting compound (EDC) footprint calculator results from 39 citizen scientists. Summary results include the average footprint per household size, standard deviation, coefficient of variation, and footprint ranges.
Persons in
Household
Number of
Footprints
Average
Footprint (g)
Standard
Deviation (g)
Coefficient of
Variation
Footprint
Ranges
(g)
110112.8107.20.9515.0–336.7
212151.3170.31.132.5–622.1
39183.8208.81.1444.6–720.2
48144.694.60.6531.6–293.4
Publisher’s Note: MDPI stays neutral with regard to jurisdictional claims in published maps and institutional affiliations.

