Author Contributions
Conceptualization, M.X. and H.Z.; methodology, S.L.; software, H.Z.; validation, H.Z., M.X. and Y.L.; formal analysis, H.Z.; investigation, S.L.; resources, M.X.; data curation, H.Z.; writing—original draft preparation, H.Z. and S.L.; writing—review and editing, M.X.; visualization, Y.L.; supervision, H.Z.; project administration, M.X.; funding acquisition, M.X. All authors have read and agreed to the published version of the manuscript.
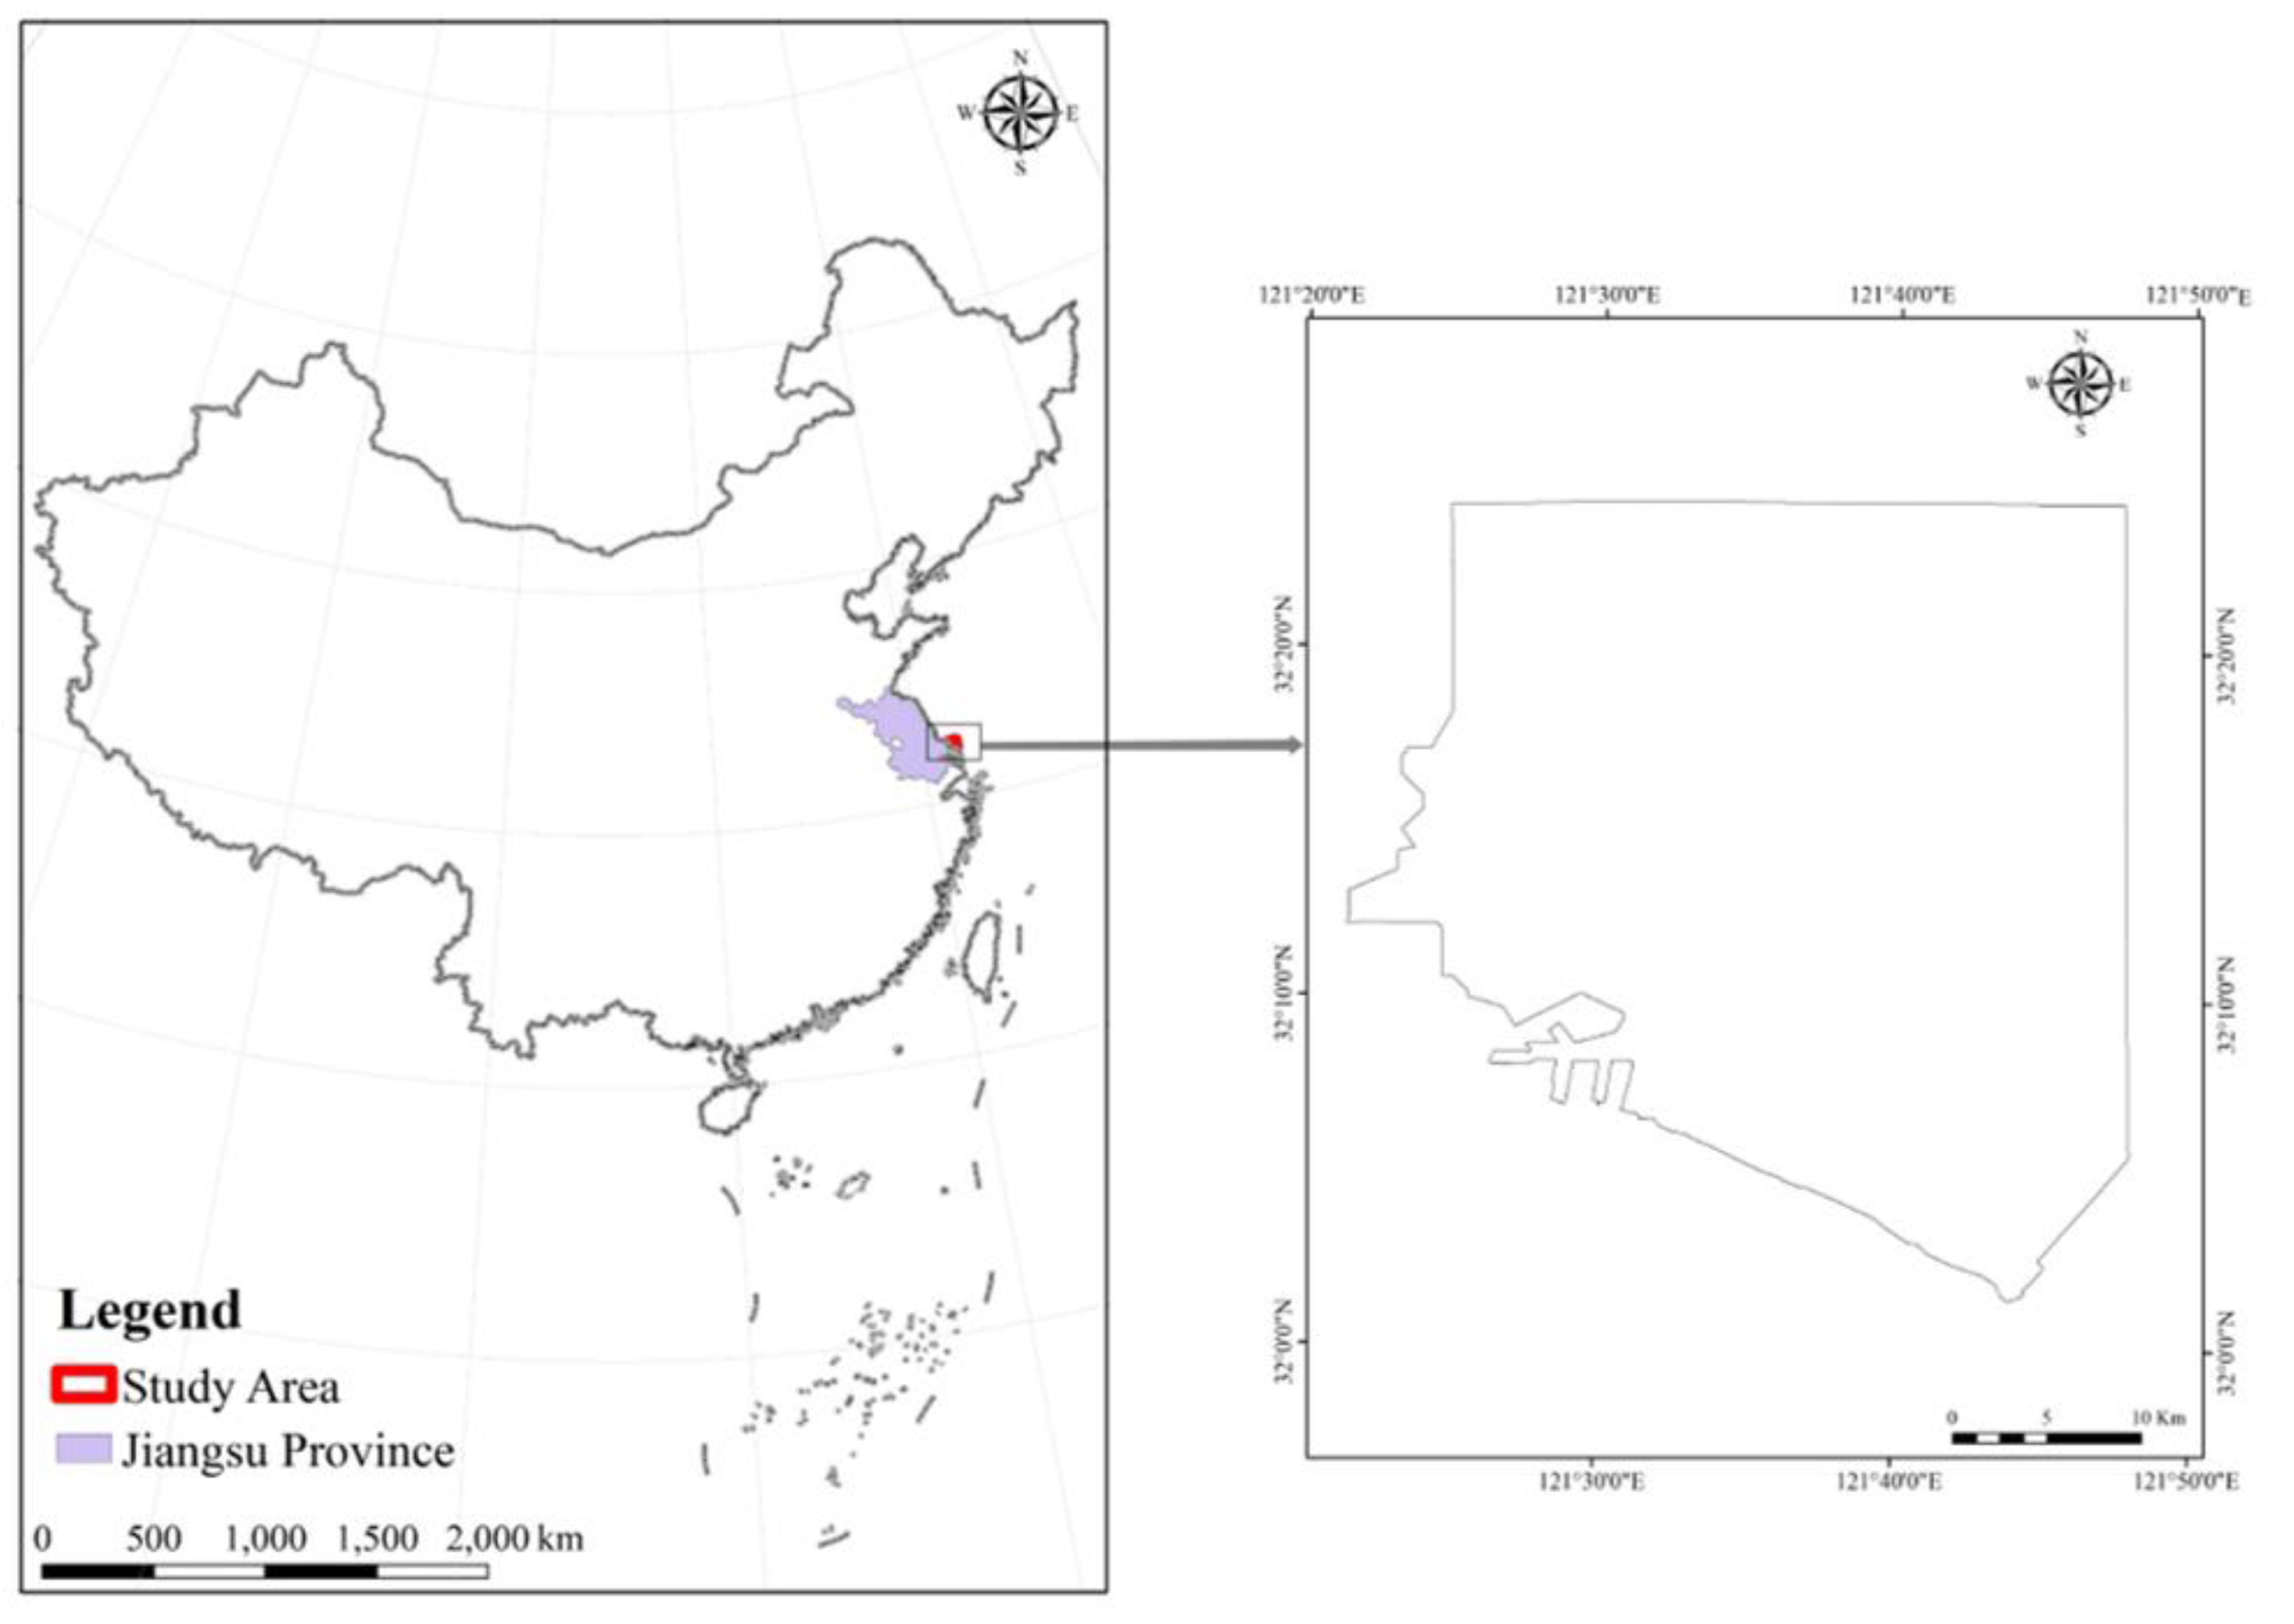
Figure 1.
Geographic location of Tongzhou Bay, Nantong City, Jiangsu Province, Eastern China.
Figure 1.
Geographic location of Tongzhou Bay, Nantong City, Jiangsu Province, Eastern China.
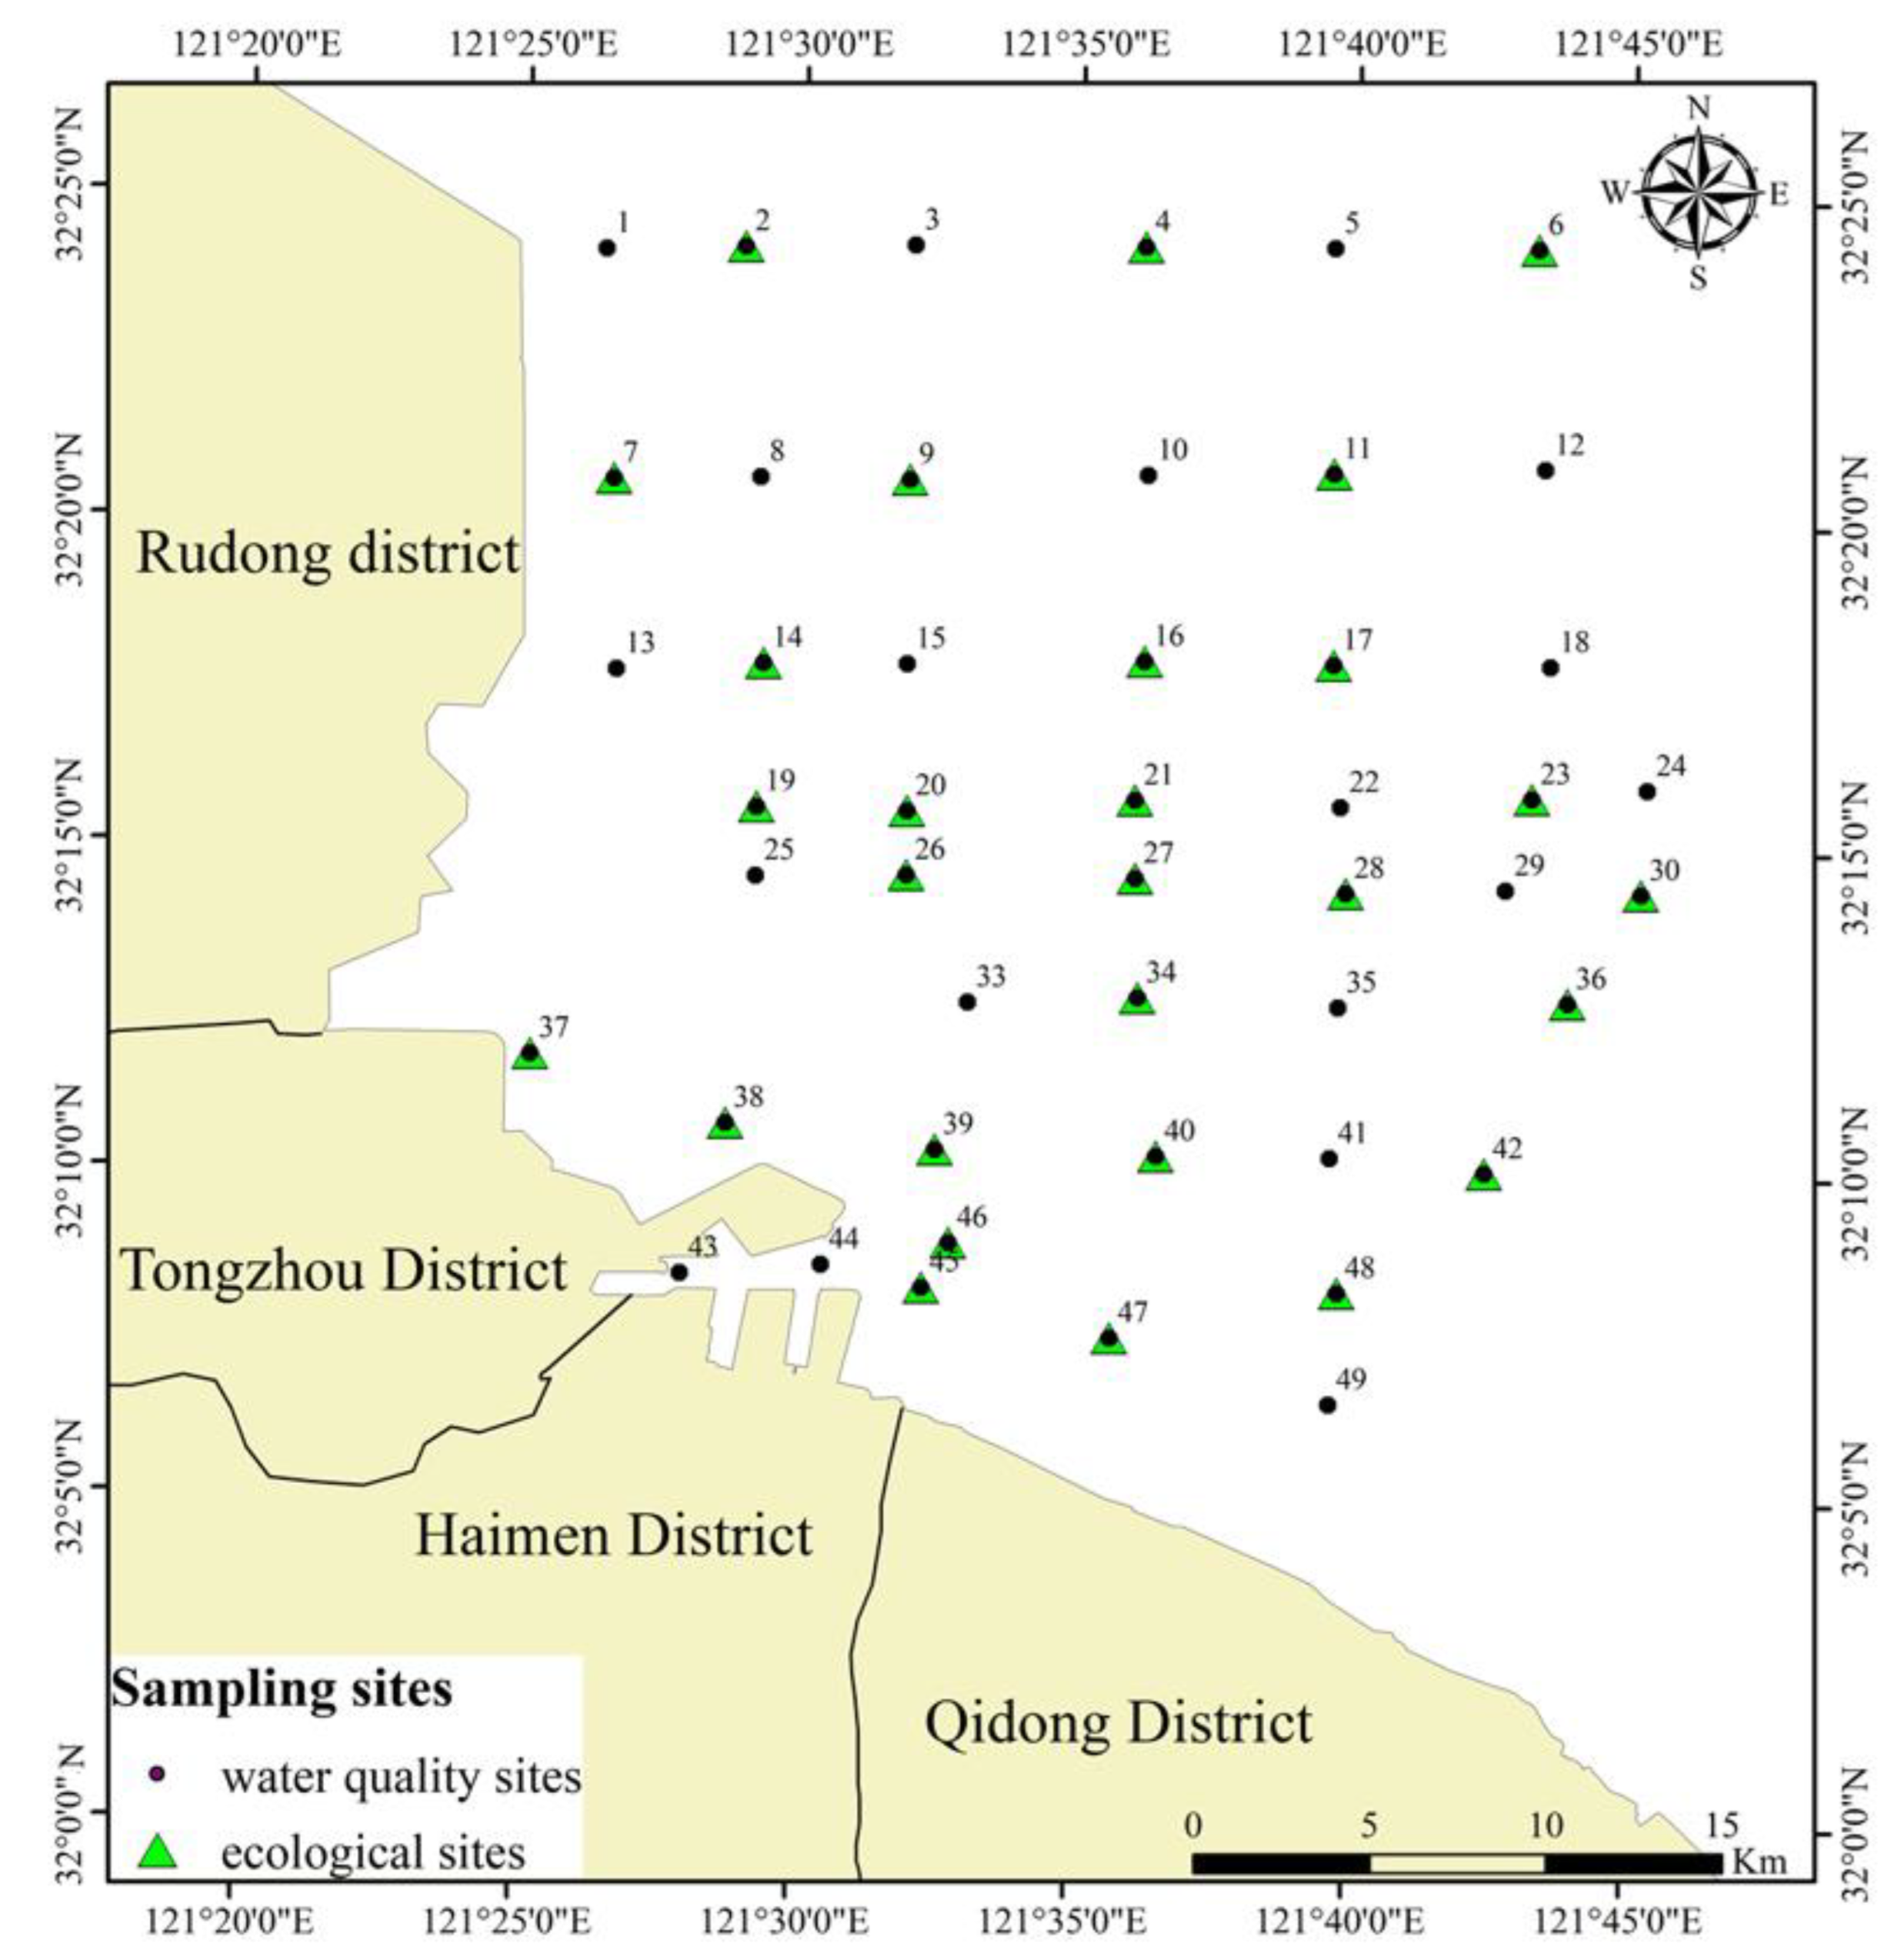
Figure 2.
Map showing water sample sites in Tongzhou Bay, Nantong City, Jiangsu Province, Eastern China.
Figure 2.
Map showing water sample sites in Tongzhou Bay, Nantong City, Jiangsu Province, Eastern China.
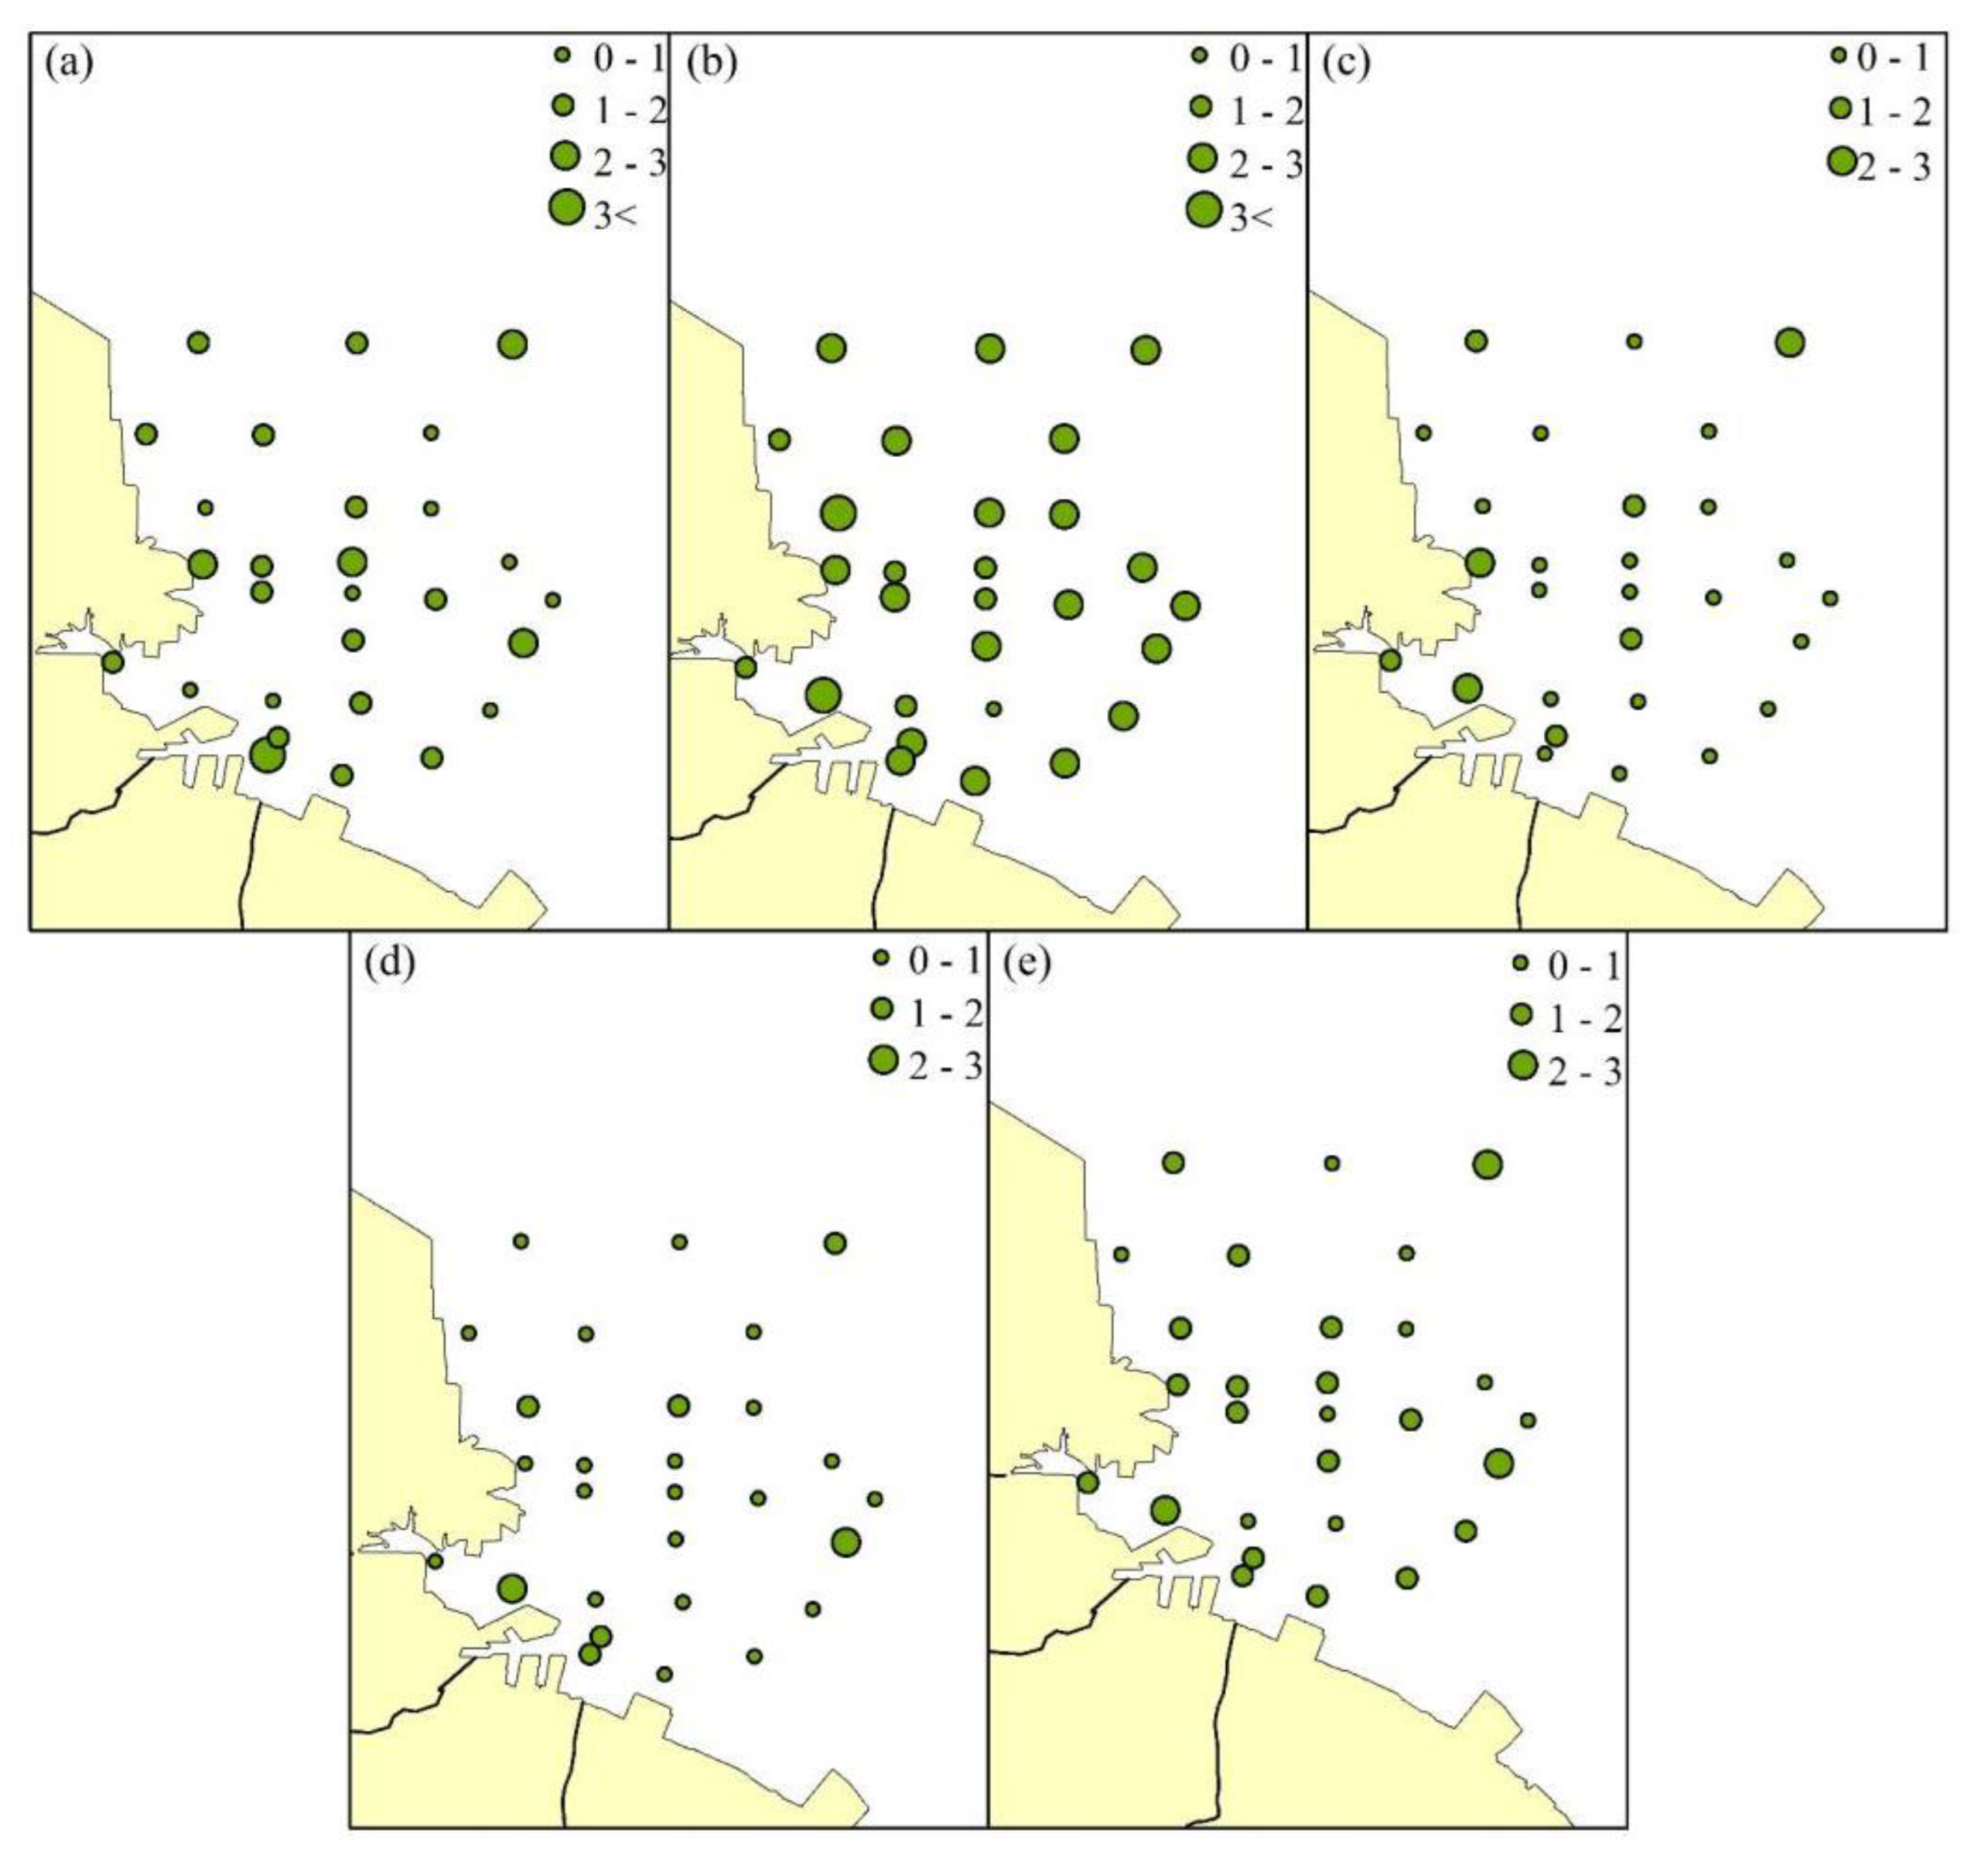
Figure 3.
Spatial distribution of the values of the Shannon–Wiener index in Tongzhou Bay, Nantong City, Jiangsu Province, Eastern China. (a) September 2018; (b) November 2018; (c) January 2019; (d) March 2019; (e) mean value.
Figure 3.
Spatial distribution of the values of the Shannon–Wiener index in Tongzhou Bay, Nantong City, Jiangsu Province, Eastern China. (a) September 2018; (b) November 2018; (c) January 2019; (d) March 2019; (e) mean value.
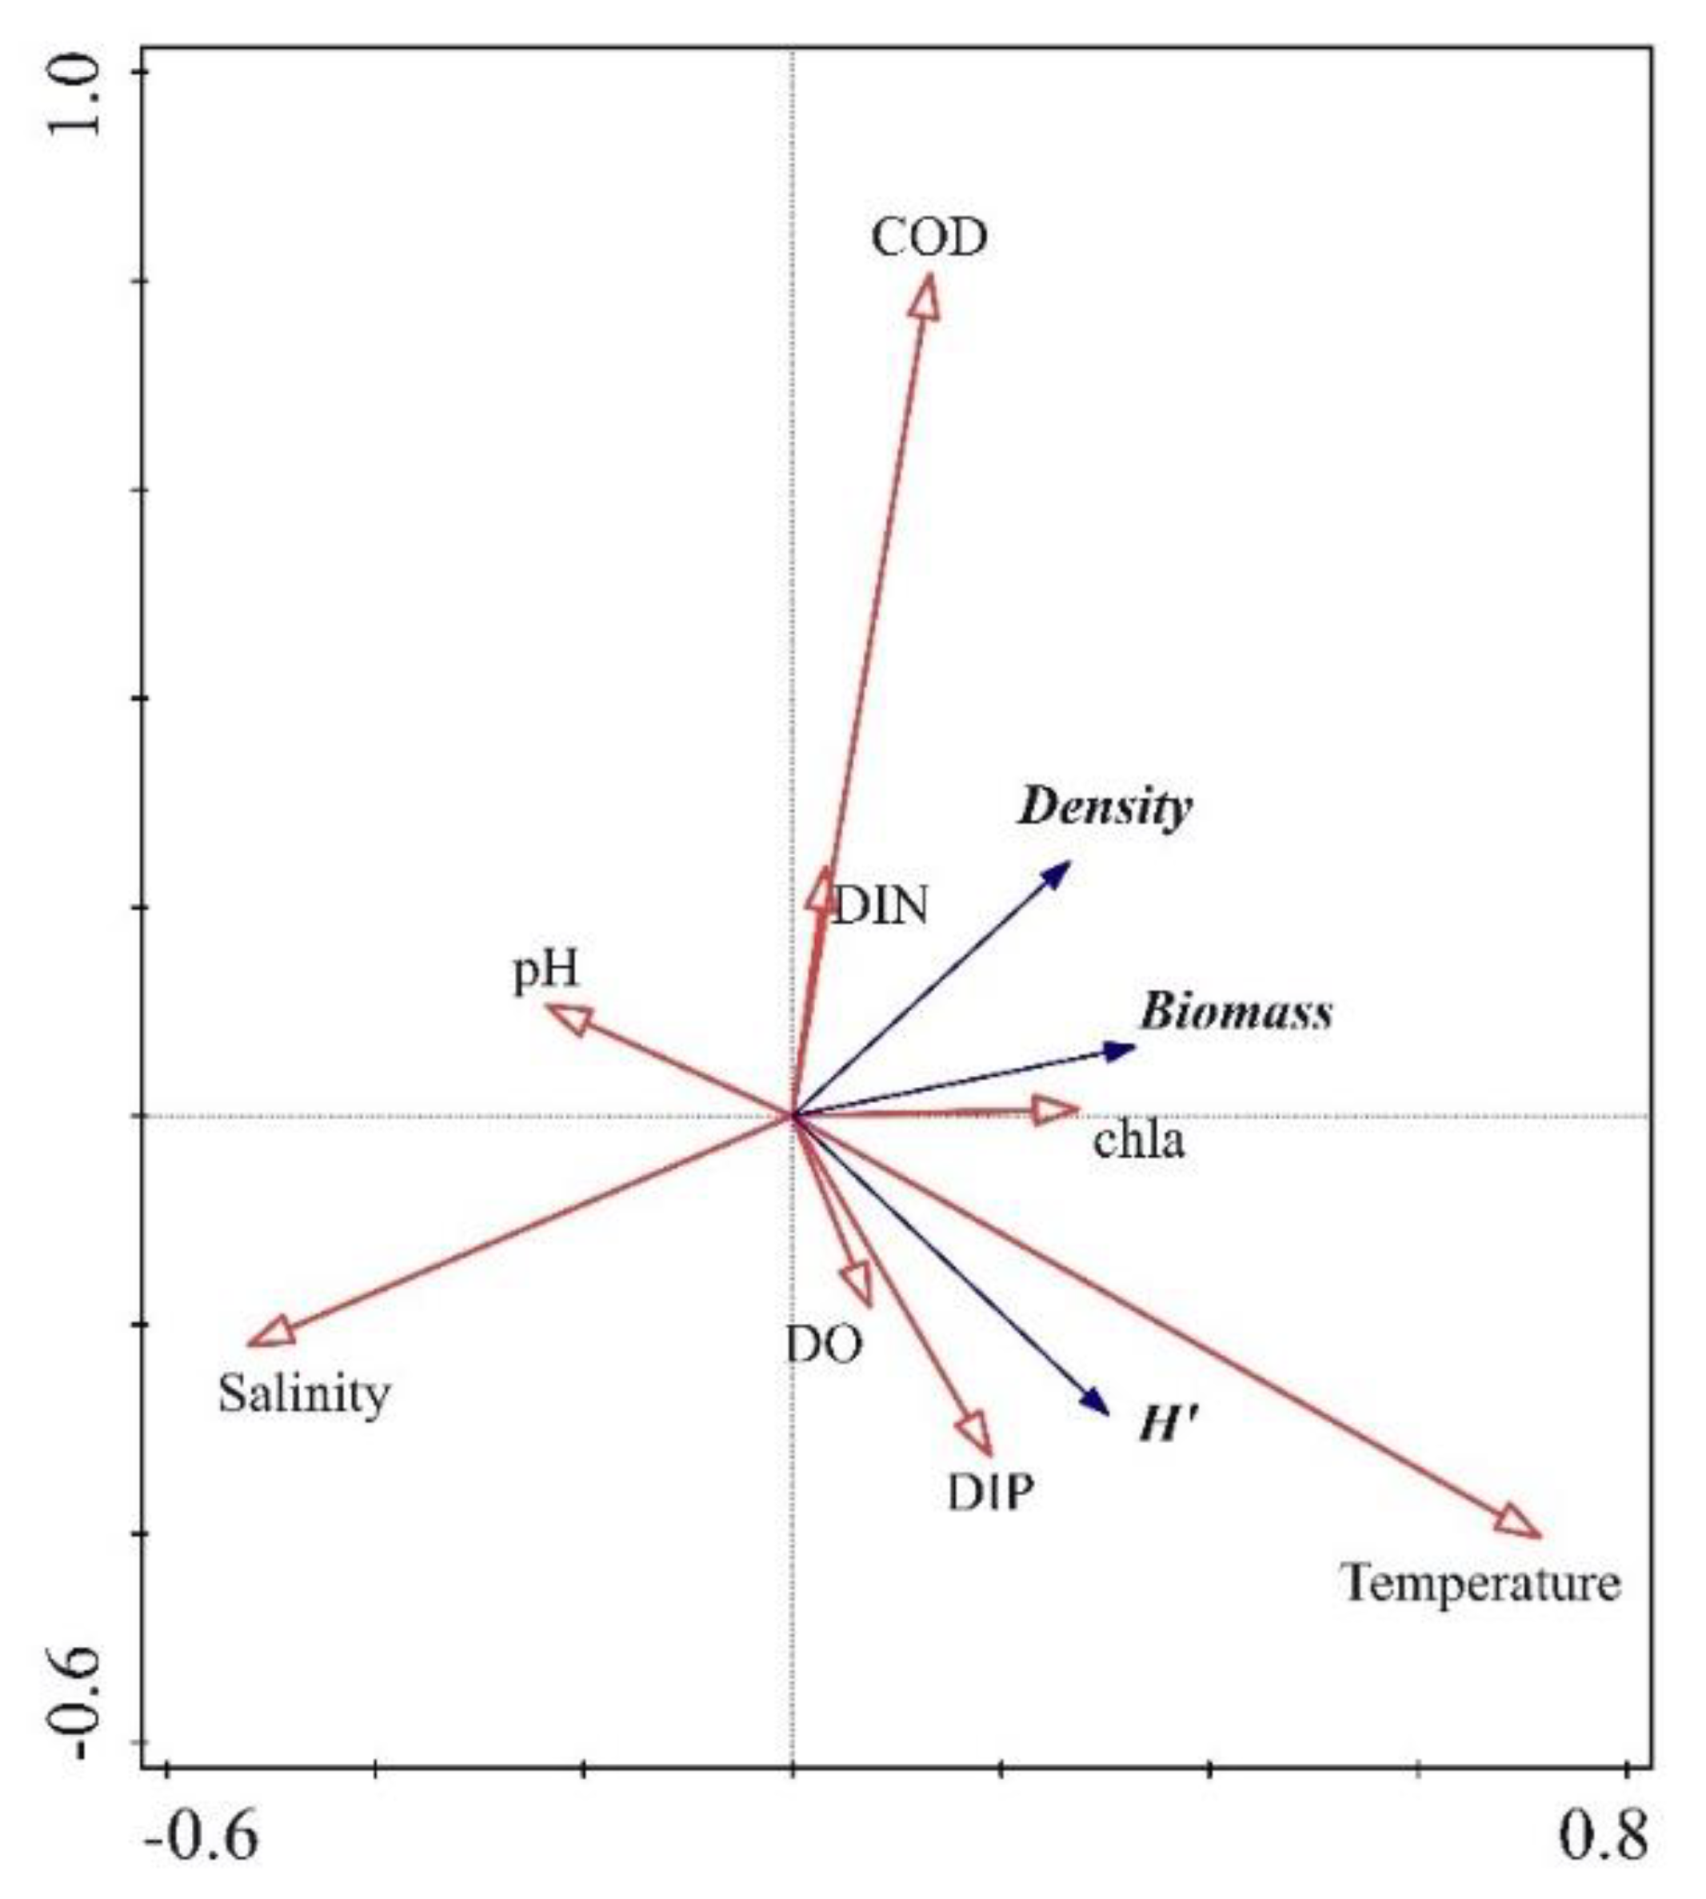
Figure 4.
Redundancy analysis (RDA) between environmental factors and benthic characteristics for water samples from Tongzhou Bay, Nantong City, Jiangsu Province, Eastern China.
Figure 4.
Redundancy analysis (RDA) between environmental factors and benthic characteristics for water samples from Tongzhou Bay, Nantong City, Jiangsu Province, Eastern China.
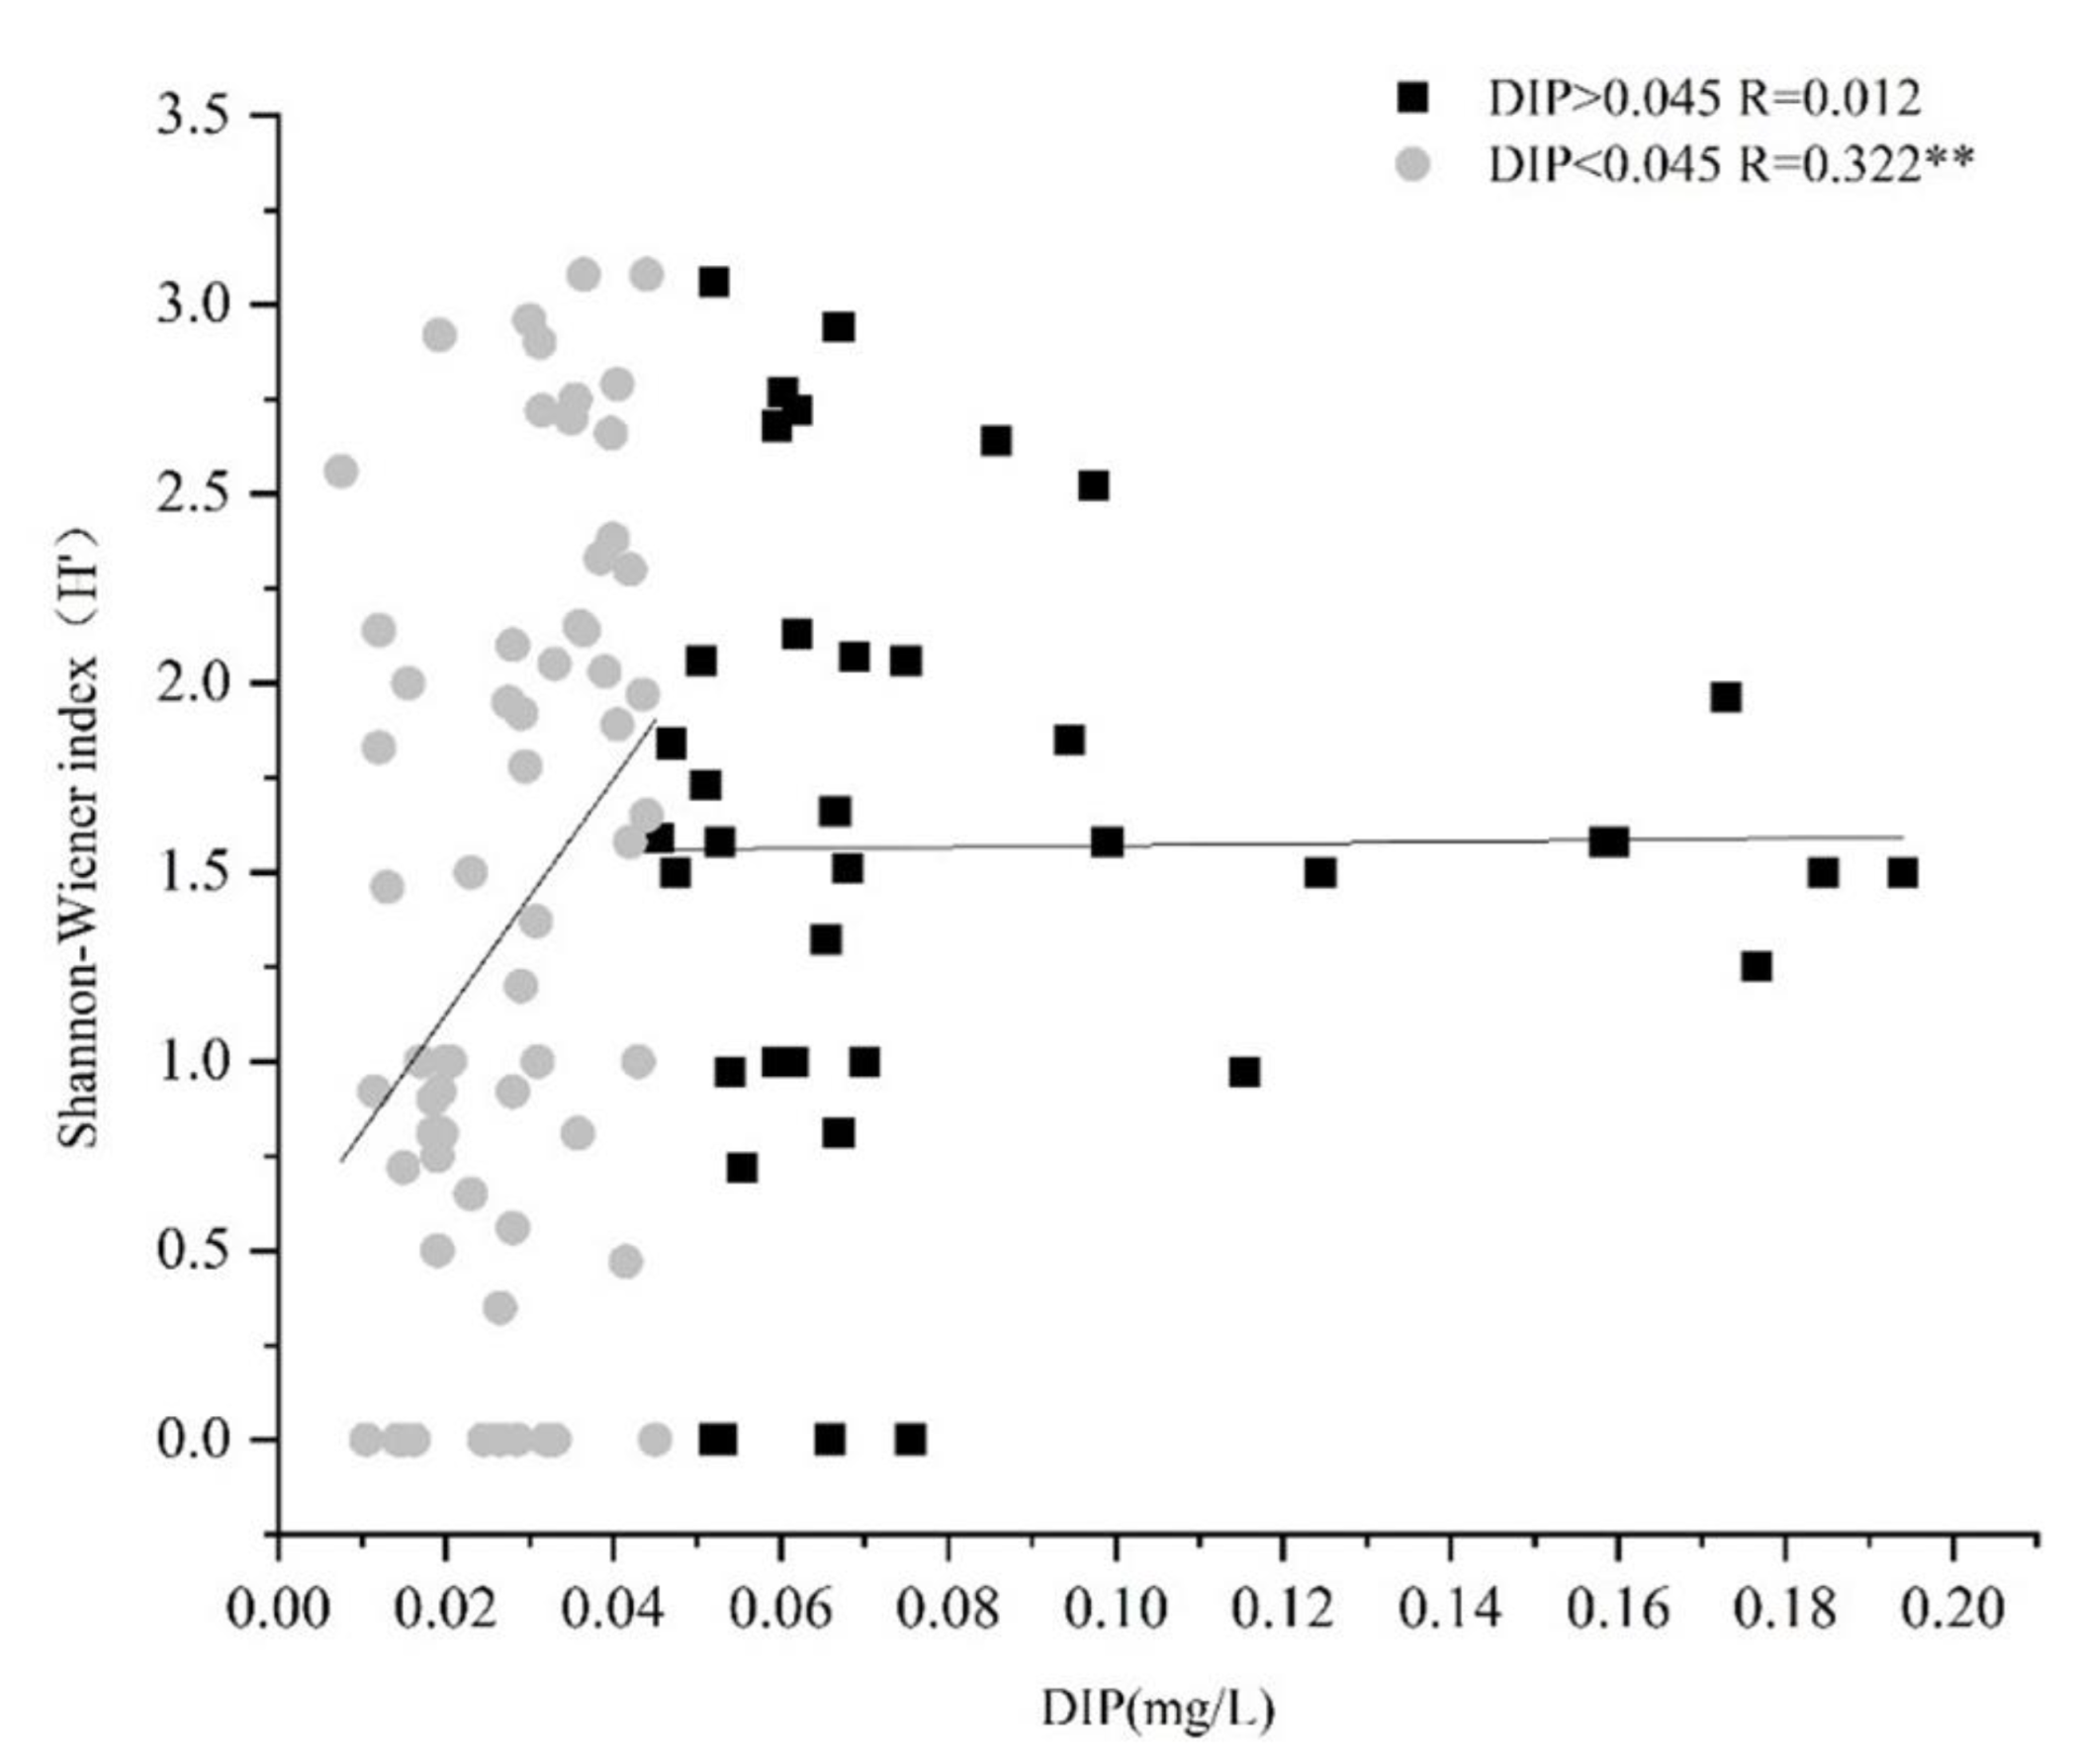
Figure 5.
Correlation between dissolved inorganic phosphorus (DIP) and the Shannon–Wiener index for water samples from Tongzhou Bay, Nantong City, Jiangsu Province, Eastern China. ( **: p < 0.01).
Figure 5.
Correlation between dissolved inorganic phosphorus (DIP) and the Shannon–Wiener index for water samples from Tongzhou Bay, Nantong City, Jiangsu Province, Eastern China. ( **: p < 0.01).
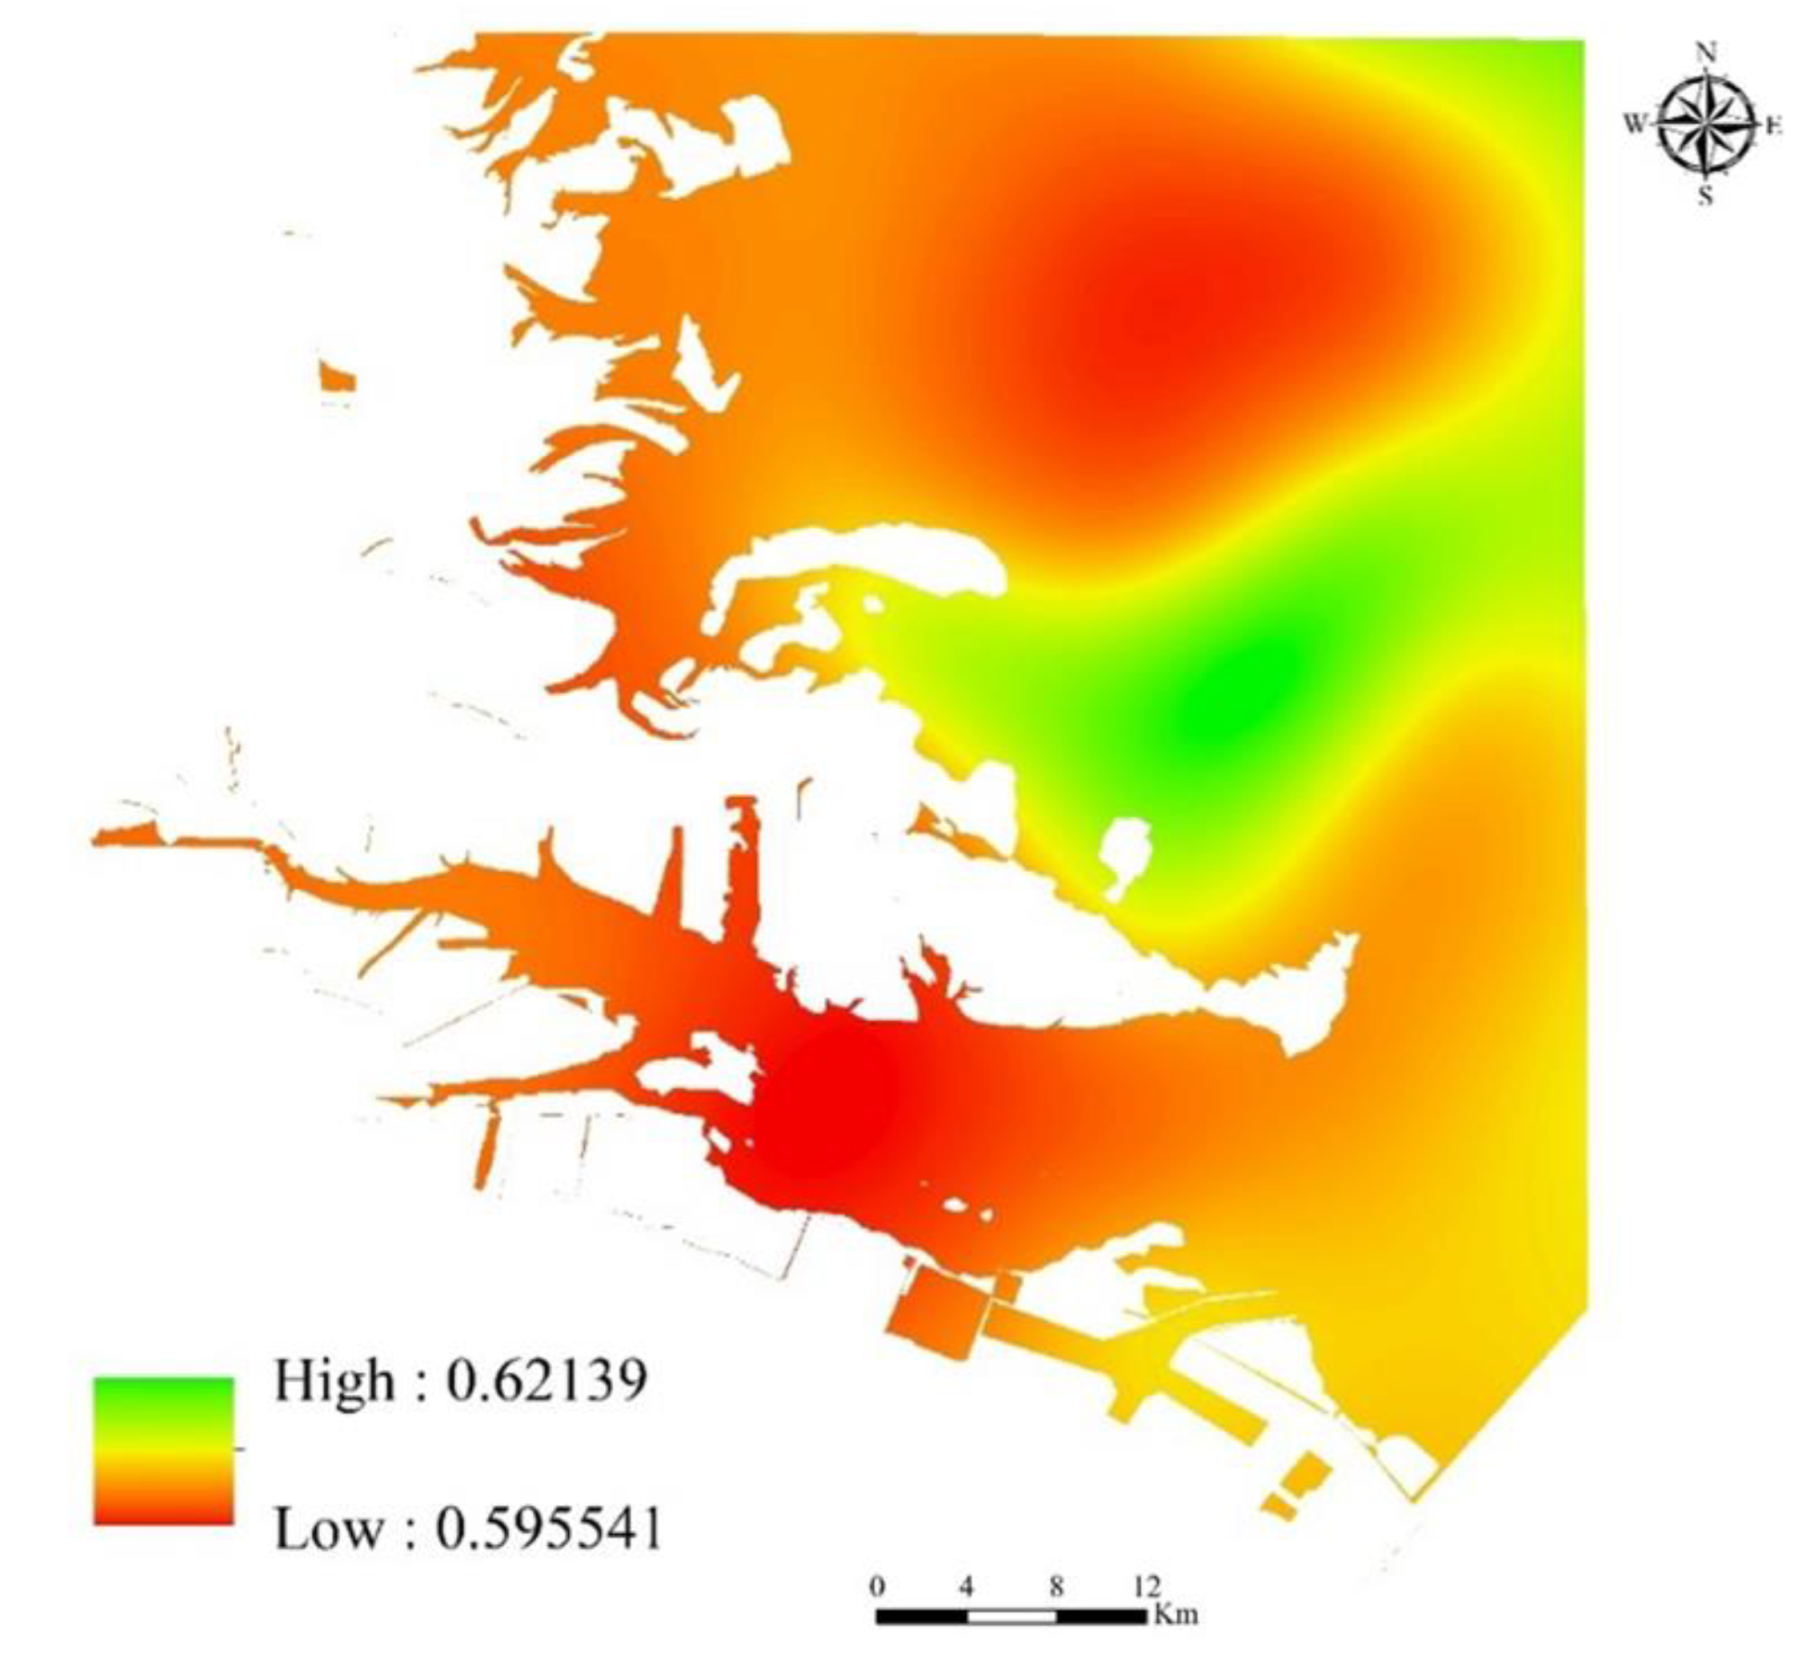
Figure 6.
Spatial distribution of habitat suitability index within water samples from Tongzhou Bay, Nantong City, Jiangsu Province, Eastern China.
Figure 6.
Spatial distribution of habitat suitability index within water samples from Tongzhou Bay, Nantong City, Jiangsu Province, Eastern China.
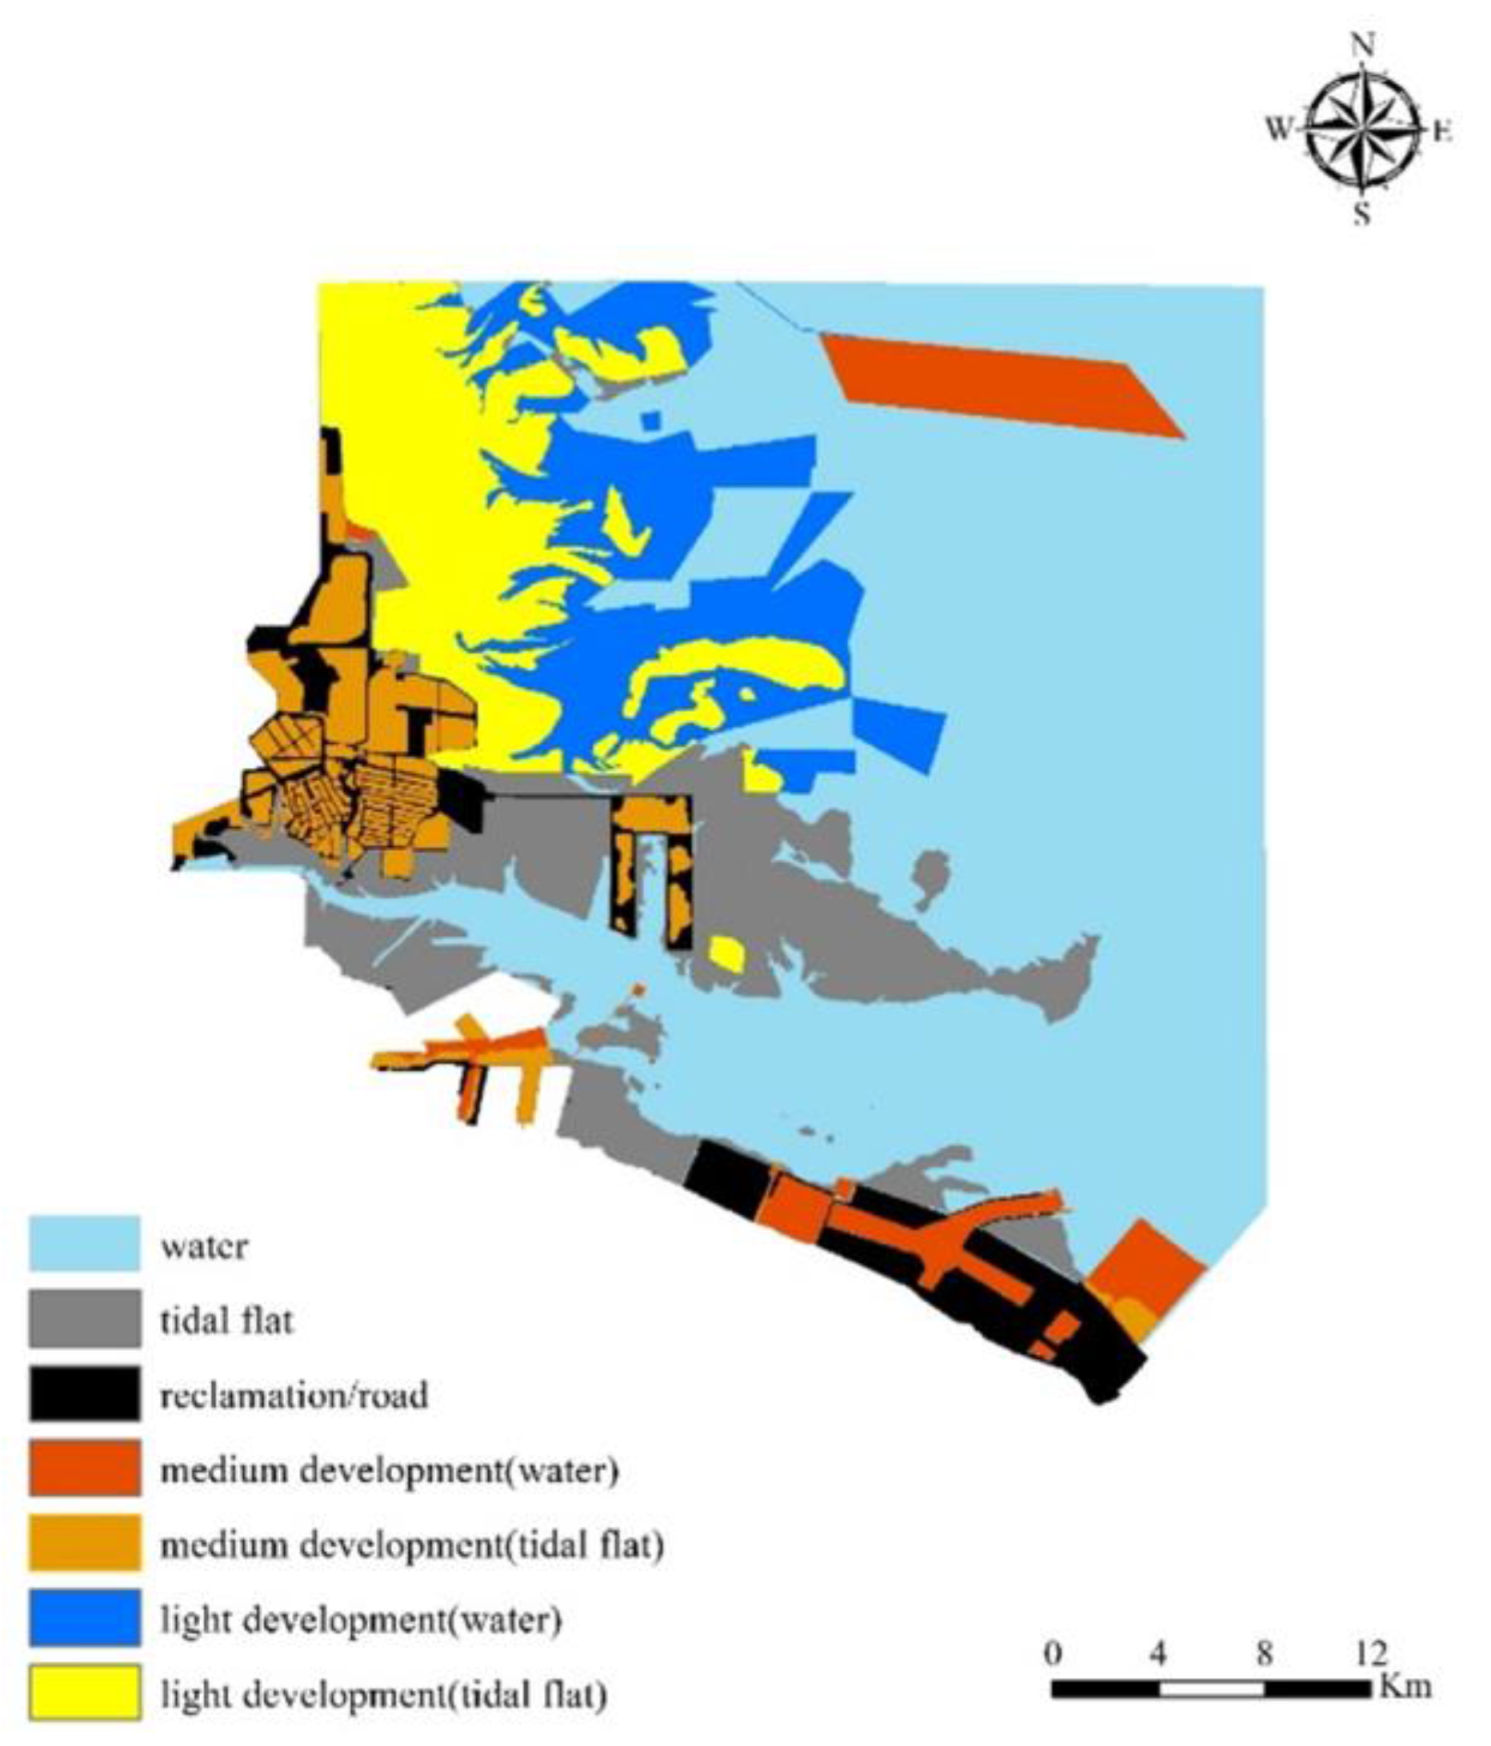
Figure 7.
Habitat types of Tongzhou Bay, Nantong City, Jiangsu Province, Eastern China.
Figure 7.
Habitat types of Tongzhou Bay, Nantong City, Jiangsu Province, Eastern China.
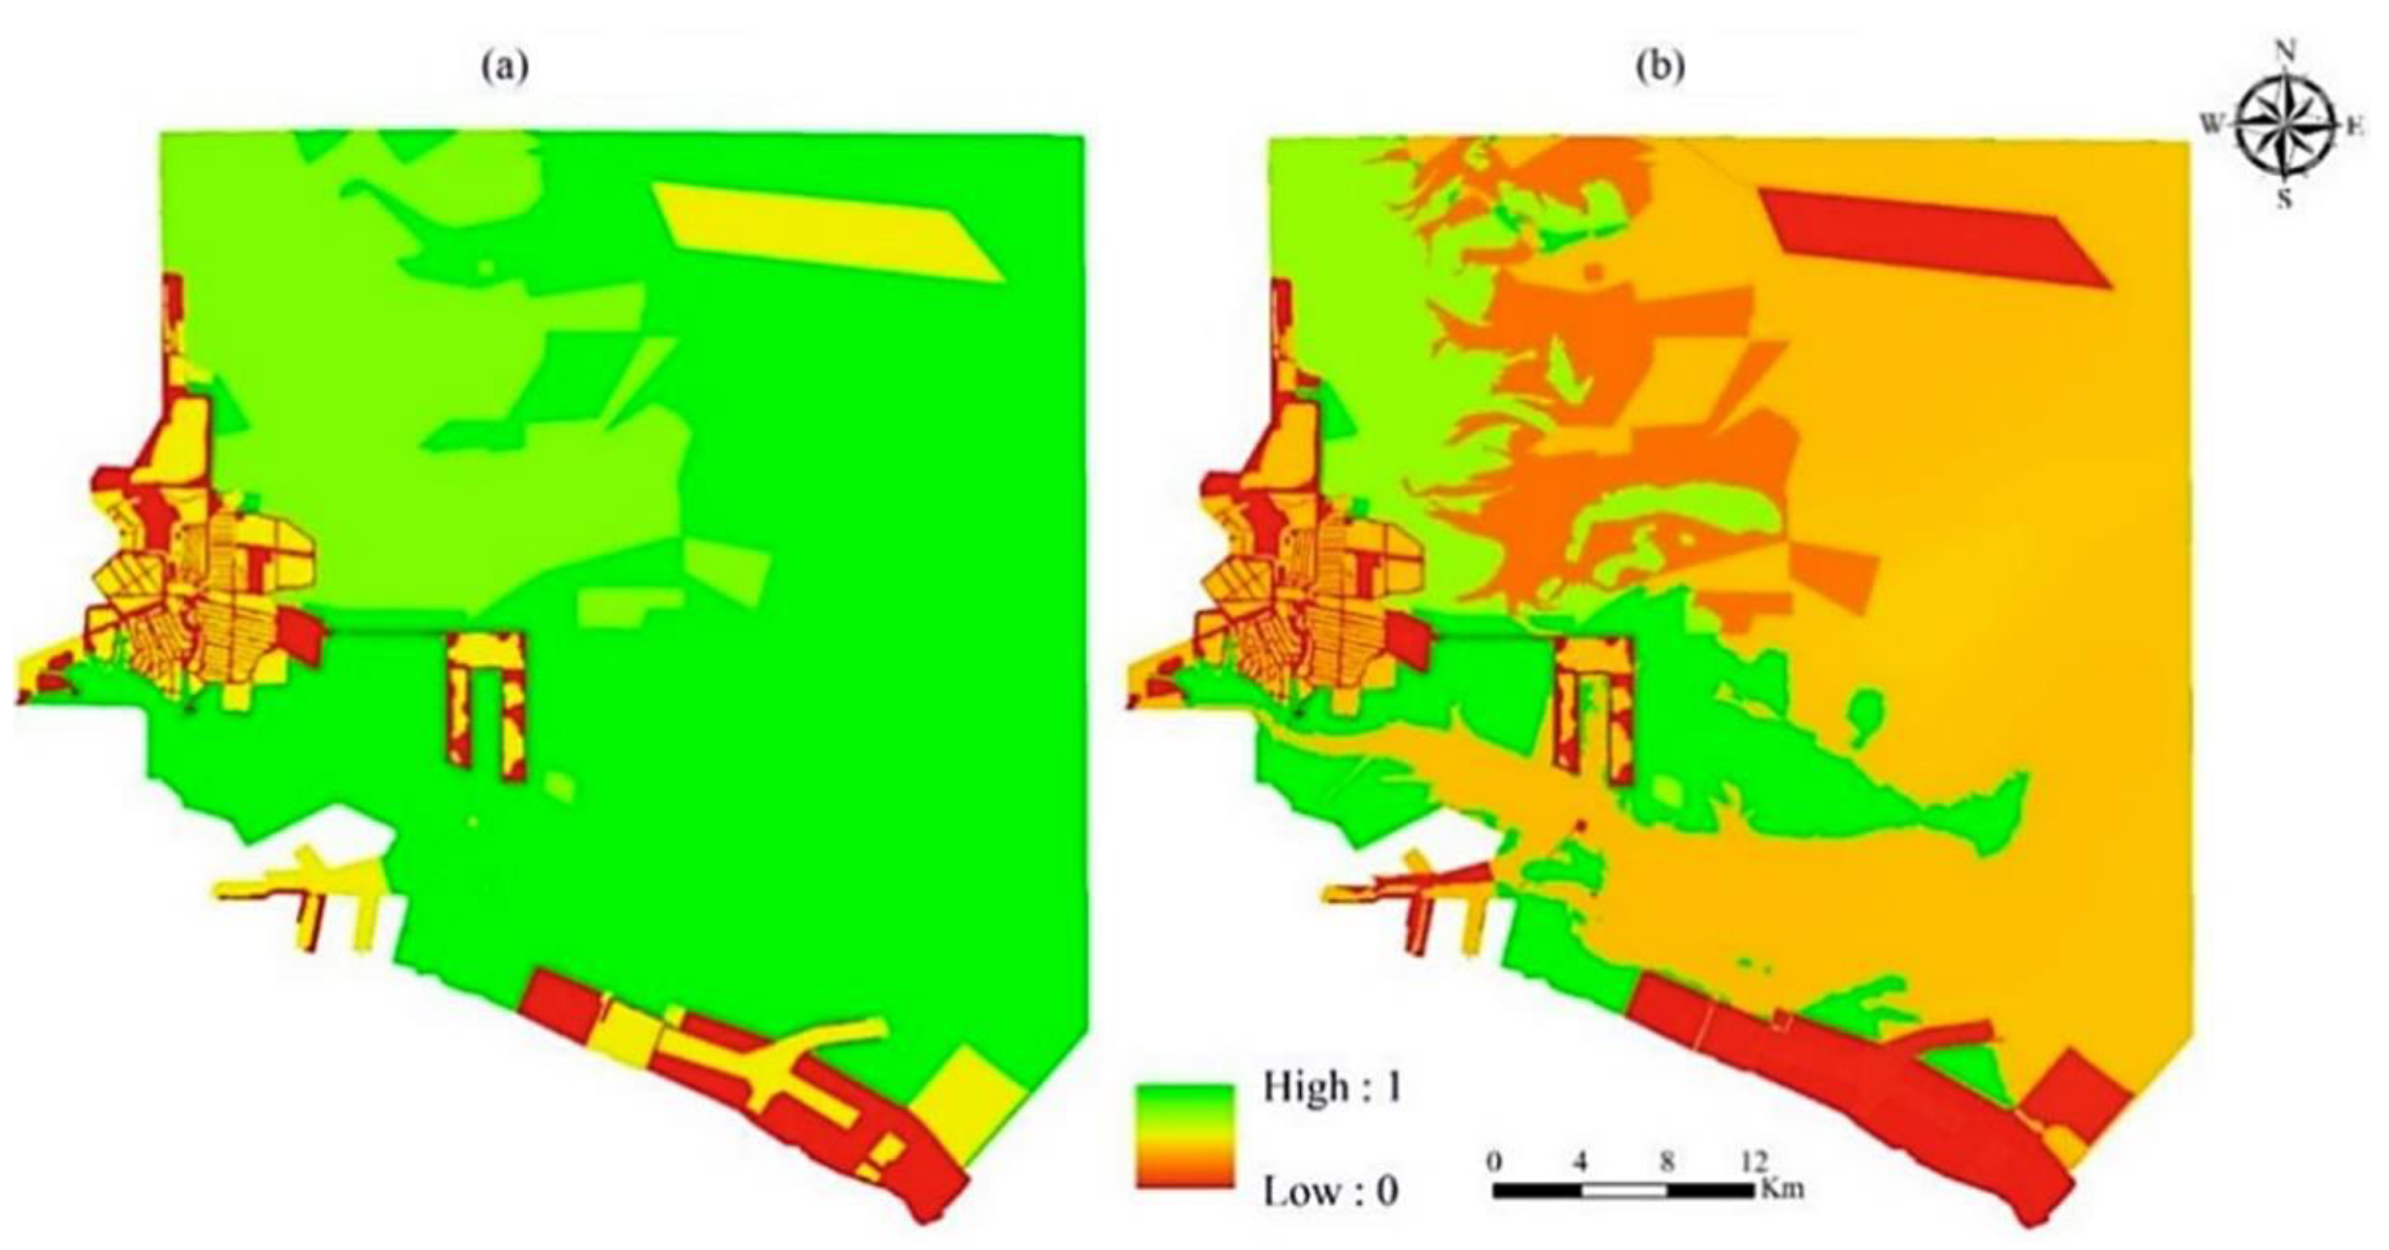
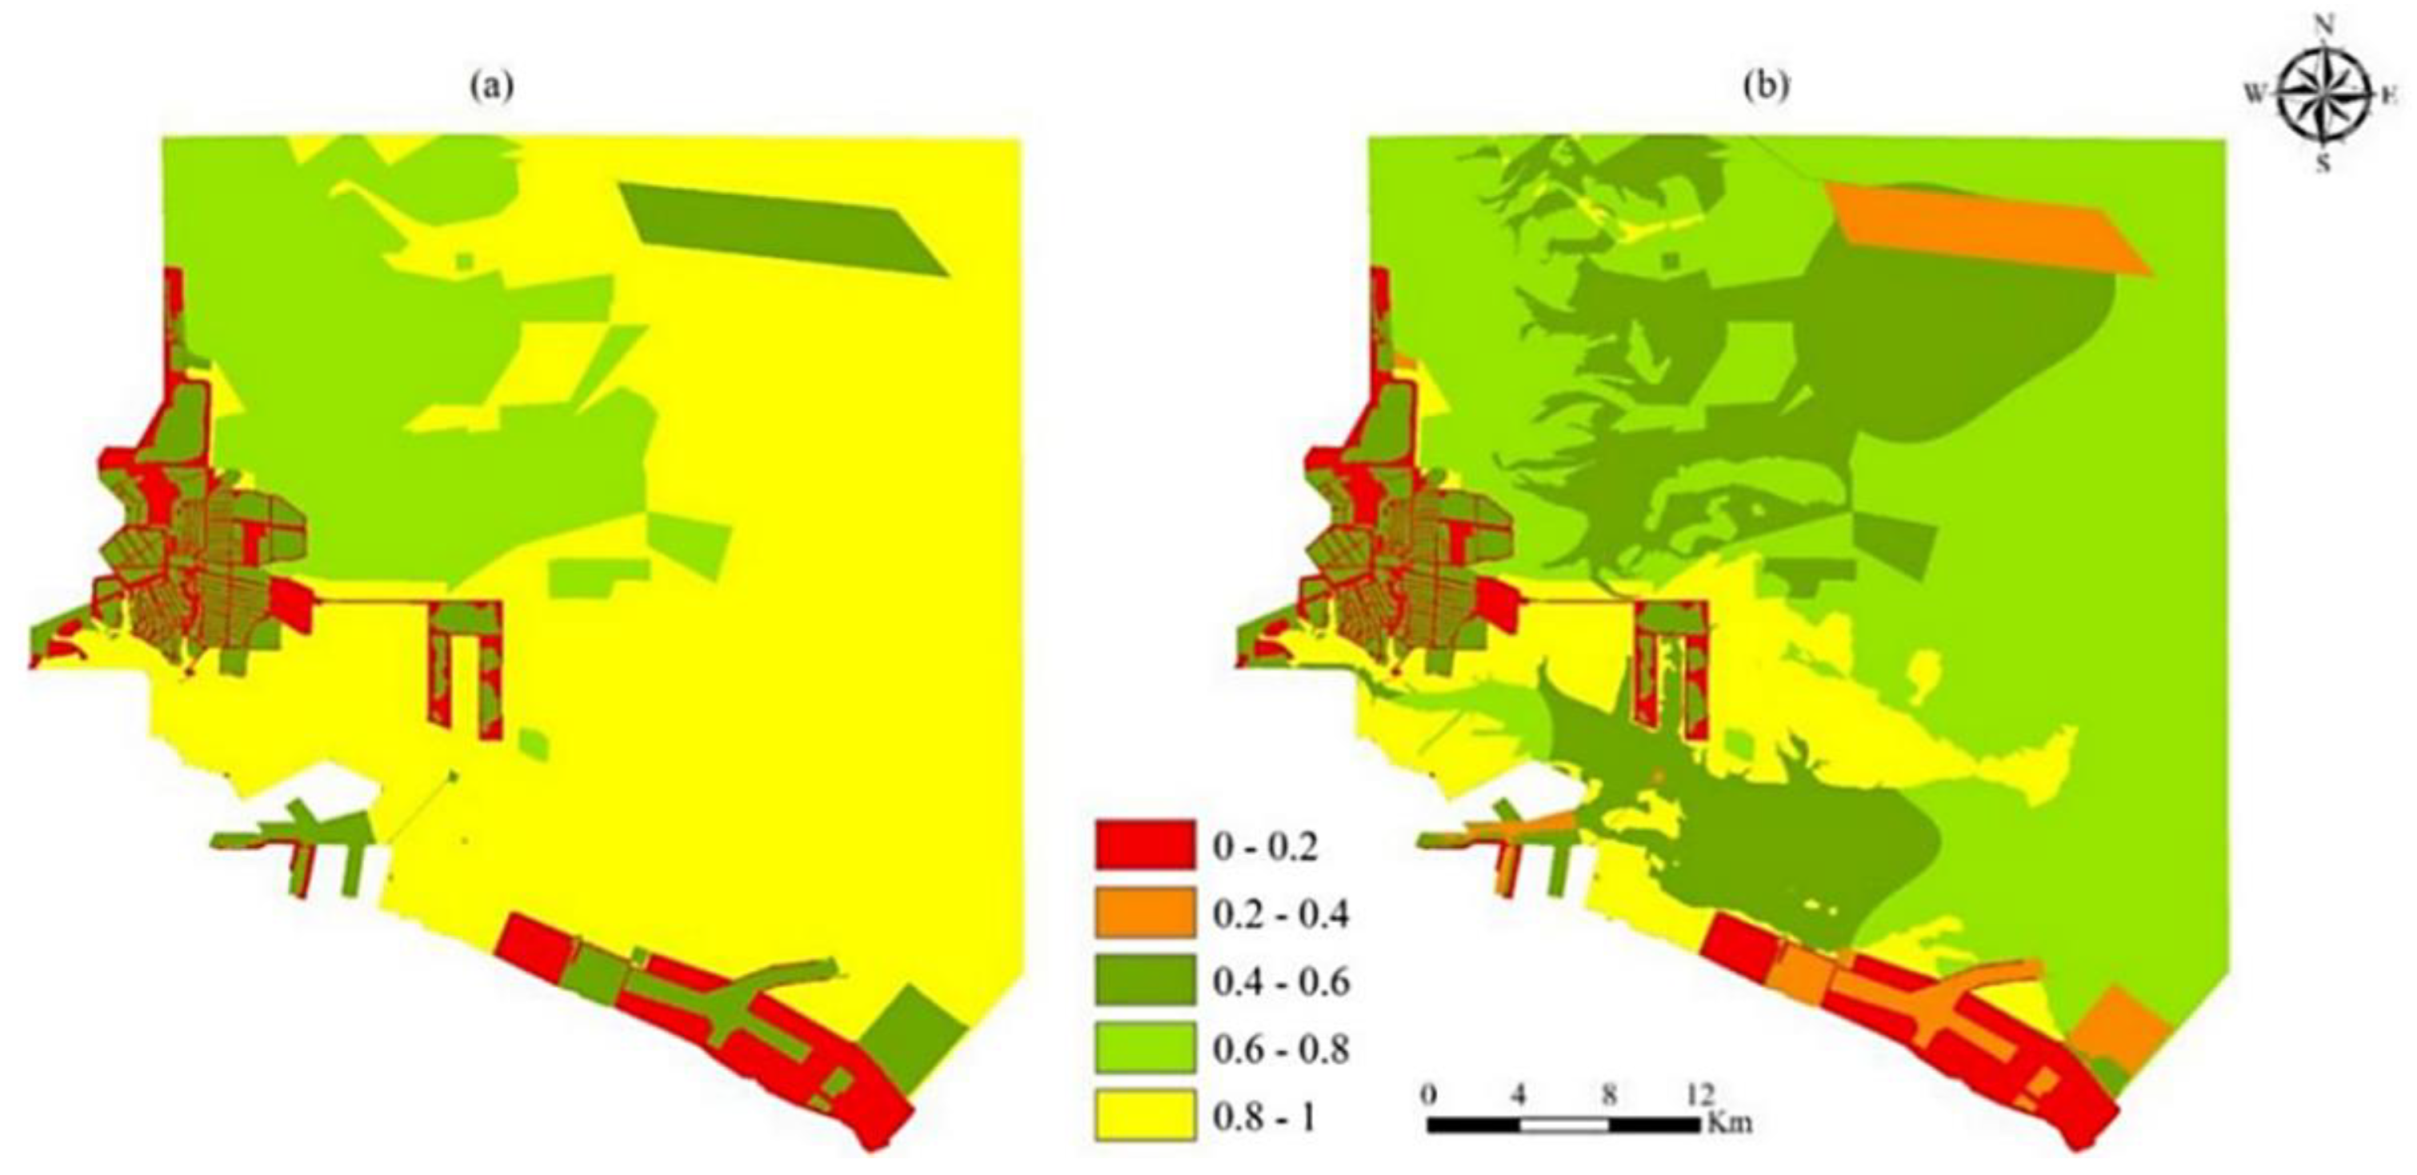
Figure 8.
Spatial distribution of habitat quality of Tongzhou Bay, Nantong City, Jiangsu Province, Eastern China. (a) without HSI; (b) with HSI.
Figure 8.
Spatial distribution of habitat quality of Tongzhou Bay, Nantong City, Jiangsu Province, Eastern China. (a) without HSI; (b) with HSI.
Figure 9.
Proportions of different levels of habitat quality in Tongzhou Bay, Nantong City, Jiangsu Province, Eastern China. (a) without HSI; (b)with HSI.
Figure 9.
Proportions of different levels of habitat quality in Tongzhou Bay, Nantong City, Jiangsu Province, Eastern China. (a) without HSI; (b)with HSI.
Table 1.
Habitat types and relevant parameters.
Table 1.
Habitat types and relevant parameters.
| Habitat Types | Habitat Score | Sensitivity to Threat Factors |
|---|
| Sewage Discharge | Reclamation | Pond Aquaculture | Open Aquaculture | Wind Turbines | Harbors | Trestles |
|---|
| Tidal flat | 1 | 1 | 1 | 0.8 | 0.2 | 0.6 | 0.5 | 0.7 |
| Water | 1 | 1 | 0.7 | 0.7 | 0.2 | 0.5 | 0.3 | 0.5 |
| Reclamation/road | 0 | 0 | 0 | 0 | 0 | 0 | 0 | 0 |
| Medium development (tidal flat) | 0.6 | 0.6 | 0.4 | 0.4 | 0.12 | 0.3 | 0.18 | 0.3 |
| Medium development (water) | 0.6 | 0.6 | 0.4 | 0.4 | 0.12 | 0.3 | 0.18 | 0.3 |
| Light development (tidal flat) | 0.8 | 0.8 | 0.5 | 0.5 | 0.16 | 0.4 | 0.24 | 0.4 |
| Light development (water) | 0.8 | 0.8 | 0.5 | 0.5 | 0.16 | 0.4 | 0.24 | 0.4 |
Table 2.
Threats and relevant parameters.
Table 2.
Threats and relevant parameters.
| Threat Factors | Maximum Distance (drmax; km) | Weight (wr) | Decay Type |
|---|
| Sewage discharge | 5 | 1 | Exponential decay |
| Reclamation | 2 | 1 | Exponential decay |
| Pond aquaculture | 2 | 0.7 | Exponential decay |
| Pond aquaculture | 0.5 | 0.3 | Linear decay |
| Harbors | 2 | 0.7 | Linear decay |
| Wind turbines | 0.5 | 0.3 | Exponential decay |
| Trestles | 0.5 | 0.5 | Linear decay |
Table 3.
Correlations between benthic Shannon–Wiener index values and environmental factors for water samples from Tongzhou Bay, Nantong City, Jiangsu Province, Eastern China.
Table 3.
Correlations between benthic Shannon–Wiener index values and environmental factors for water samples from Tongzhou Bay, Nantong City, Jiangsu Province, Eastern China.
| | Temperature | pH | Salinity | COD | DO | DIP | DIN | CHLA |
|---|
| All samples | 0.323 ** | −0.099 | −0.054 | −0.226 * | 0.049 | 0.133 | −0.096 | 0.076 |
| DIP < 45 (mg/L) | 0.650 ** | −0.156 | −0.105 | −0.268 * | 0.036 | 0.322 ** | −0.210 | −0.108 |
| DIP > 45 (mg/L) | −0.044 | −0.002 | 0.110 | −0.090 | 0.023 | 0.012 | −0.064 | 0.104 |
Table 4.
Criteria of environmental factors.
Table 4.
Criteria of environmental factors.
| Environmental Factors | Score of Single Factors |
|---|
| 1 | 2 | 3 | 4 | 5 |
|---|
| Temperature | 0–7 | 7–13.4 | 13.4–18 | 18–30 | <30 |
| COD | <1.12 | 0.85–1.12 | 0.7–0.85 | 0.61–0.7 | 0–0.61 |
| DIP | 0–0.015 | 0.015–0.03 | - | - | 0.03–0.045 |
Table 5.
Results of the ordinary least squares (OLS) regression model.
Table 5.
Results of the ordinary least squares (OLS) regression model.
| | Sum of Squares | df | Mean Square | F | Sig. | R2 |
|---|
| Regression | 1.965 | 3 | 0.655 | 26.562 | 0.000 | 0.57 |
| Residual | 1.479 | 60 | 0.025 | | | |
| Total | 3.444 | 63 | | | | |
Table 6.
Results of the ordinary least squares (OLS) regression model.
Table 6.
Results of the ordinary least squares (OLS) regression model.
| Tidal Flat | Water | Reclamation/Road | Medium Development (Tidal Flat) | Medium Development (Water) | Light Development (Tidal Flat) | Light Development (Water) |
|---|
| 12.18% | 51.44% | 5.5% | 4.92% | 5.12% | 10.75% | 10.09% |
Table 7.
Proportion of different levels of habitat quality in Tongzhou Bay, Nantong City, Jiangsu Province, Eastern China.
Table 7.
Proportion of different levels of habitat quality in Tongzhou Bay, Nantong City, Jiangsu Province, Eastern China.
| | Average | Ⅰ | Ⅱ | Ⅲ | Ⅳ | Ⅴ |
|---|
| Without HSI | 0.86 | 5.93% | - | 9.60% | 20.79% | 63.68% |
| With HSI | 0.61 | 5.93% | 4.91% | 27.89% | 49% | 12.27% |


