Article

Hydrogeochemical Investigation of Elevated Arsenic Based on Entropy Modeling, in the Aquifers of District Sanghar, Sindh, Pakistan

1
School of Environmental Studies, China University of Geosciences, Wuhan 430074, China
2
College of Environmental Science and Engineering, Guilin University of Technology, Guilin 541004, China
3
Department of Botany, Abdul Wali Khan University, Mardan P.O. Box 23200, Pakistan
4
Department of Botany, University of Swabi, Swabi 94640, Pakistan
5
Missouri Botanical Garden, 4344 Shaw Blvd., St. Louis, MO 63110, USA
6
Department of Chemistry, University of Swabi, Swabi 94640, Pakistan
7
Department of Pharmaceutical Chemistry, Faculty of Pharmacy, Umm Al-Qura University, Makkah P.O. Box 92155, Saudi Arabia
8
Department of Chemistry, College of Science, King Saud University, P.O. Box 2455, Riyadh 11451, Saudi Arabia
9
Department of Pharmaceutical Chemistry, College of Pharmacy, King Khalid University, Abha 61421, Saudi Arabia
*
Author to whom correspondence should be addressed.
Water 2021, 13(23), 3477; https://doi.org/10.3390/w13233477
Submission received: 8 November 2021 / Revised: 26 November 2021 / Accepted: 1 December 2021 / Published: 6 December 2021
(This article belongs to the Special Issue Sustainable Management of Water and Wastewater)

Abstract

:
Arsenic (As) contamination in drinking groundwater is a common environmental problem in Pakistan. Therefore, sixty-one groundwater samples were collected from various groundwater sources in District Sanghar, Sindh province, Pakistan, to understand the geochemical behavior of elevated As in groundwater. Statistical summary showed the cations and anions abundance in decreasing order of Na+ > Ca2+ > Mg2+ > K+, and HCO3 > Cl > SO42− > NO3. Arsenic was found with low to high concentration levels ranging from 5 µg to 25 µg/L with a mean value of 12.9 µg/L. A major water type of groundwater samples was mixed with NaCl and CaHCO3 type, interpreting the hydrochemical behavior of rock–water interaction. Principal component analysis (PCA) showed the mixed anthropogenic and natural sources of contamination in the study area. Moreover, rock weathering and exchange of ions controlled the hydrochemistry. Chloro-alkaline indices revealed the dominance of the reverse ion exchange mechanism in the region. The entropy water quality index (EWQI) exposed that 17 samples represent poor water, and 11 samples are not suitable for drinking.

1. Introduction

Arsenic (As) is a toxic metalloid existing in groundwater from commonly anthropogenic and geogenic sources [1,2]. All over the world, more than 150 million people are exposed to excessively high As contamination of drinking water sources [3,4]. The prevalent range of health hazards of As in groundwater is a serious threat to Pakistan [5]. In several regions of Pakistan, heavy metal concentrations are detected, including Peshawar, Karachi, Hyderabad, DG Khan, Lahore, Malakand, Lower Dir, Muzaffargarh, and the Chitral district [6,7,8,9,10,11,12,13,14]. Arsenic is commonly dispersed in Sindh province in different regions such as Manchar lake, Jamshoro, Hyderabad, Jaccobabad, and Nagar Parker [15,16,17,18]. The carcinogenic consequence of As may lead to kidney failure, lung infections, hair loss, skin disease, and cancer. The observation of arsenic in groundwater is used to indicate apparent health risks. As is contaminated in the food chain through drinking water, food, meat, milk, and eggs may cause several health disorders. The ingestion of bovine milk is one of the most important pathways of exposure to chemicals in the tissues in the agricultural food chain. [19,20].
In Pakistan, the public health concerns of arsenic contamination are pointed out in the latest reports. Conferring to groundwater detected by the Pakistan water research council (PCRWR), arsenic was detected 10–200 µg/L in different provinces, especially in Sindh province, where 16–36% of peoples were affected with high arsenic in groundwater [21]. Groundwater resources of Sindh province are highly vulnerable to As contamination [22]. In Hyderabad, more than 40 people died in 2004 due to contaminated groundwater polluted with As and other toxic elements [23]. Arsenic toxicity is directed by limited essential water quality, parameters with environmental aspects like pH, turbidity, temperature, oxygen content, and micro-organisms that govern As impurity [24,25]. The deficit of high pH, cations like magnesium and calcium in drinking water, leads to cardiac ailments [26]. Mineral deposits in groundwater credits mainly subsidize sodium (Na+) absorption. An unusual sodium concentration may result in different health disorders like hypertension, headache, and kidney failure, while less concentration may result in depression, low blood pressure, and mental problems [27,28]. There is another essential element like iron (Fe), which is necessary for hemoglobin and other enzymatic activities. High concentrations of (Fe) in groundwater incidentally mobilize As assisted by micro-organisms and other health-related problems, which assumed a strong relationship linking arsenic and geochemical cycle [29,30].
Geogenic and anthropogenic activities lead to arsenic mobilization, such as precipitation, weathering, volcanic actions, and anthropogenic activities like pesticides, coal mining, insecticides, and petroleum refining [7,31]. As contaminated groundwater, which is used for irrigation in semi-arid, and arid areas, promotes As impurity, specifically in alluvial aquifers [32].
In Pakistan, the second-most populated province in Sindh. It is bounded physio graphically with Kirthar and Laki range on the western side [19]. The exploitation and constant pumping out of water for local and domestic purposes in arid and semi-arid regions cause a decline in groundwater quantity and quality [33]. Moreover, mining activities, industrial development, and evolution are the main environmental concerns in the developing country of the world, including Pakistan, Bangladesh, China, and India. However, the local population uses contaminated groundwater for domestic use.
The published reports on groundwater arsenic contamination in Sindh province are in limited areas. In this study, we aim to determine the realistic situation of As contaminated groundwater. It seems necessary to complete a survey of As contaminated groundwater and determine the sources of mobilization using a multivariate statistical approach.
In the above situation, we studied groundwater contamination with As in Sanghar district, Sindh, Pakistan. The objective of this research is that the study area groundwater was analyzed with the purpose to (1) investigate the geochemical features responsible for elevated As in groundwater; (2) evaluate the fitness of groundwater for drinking purposes using entropy model; and (3) evaluate the anthropogenic and geogenic cause of pollution in the study area.

2. Materials and Methods

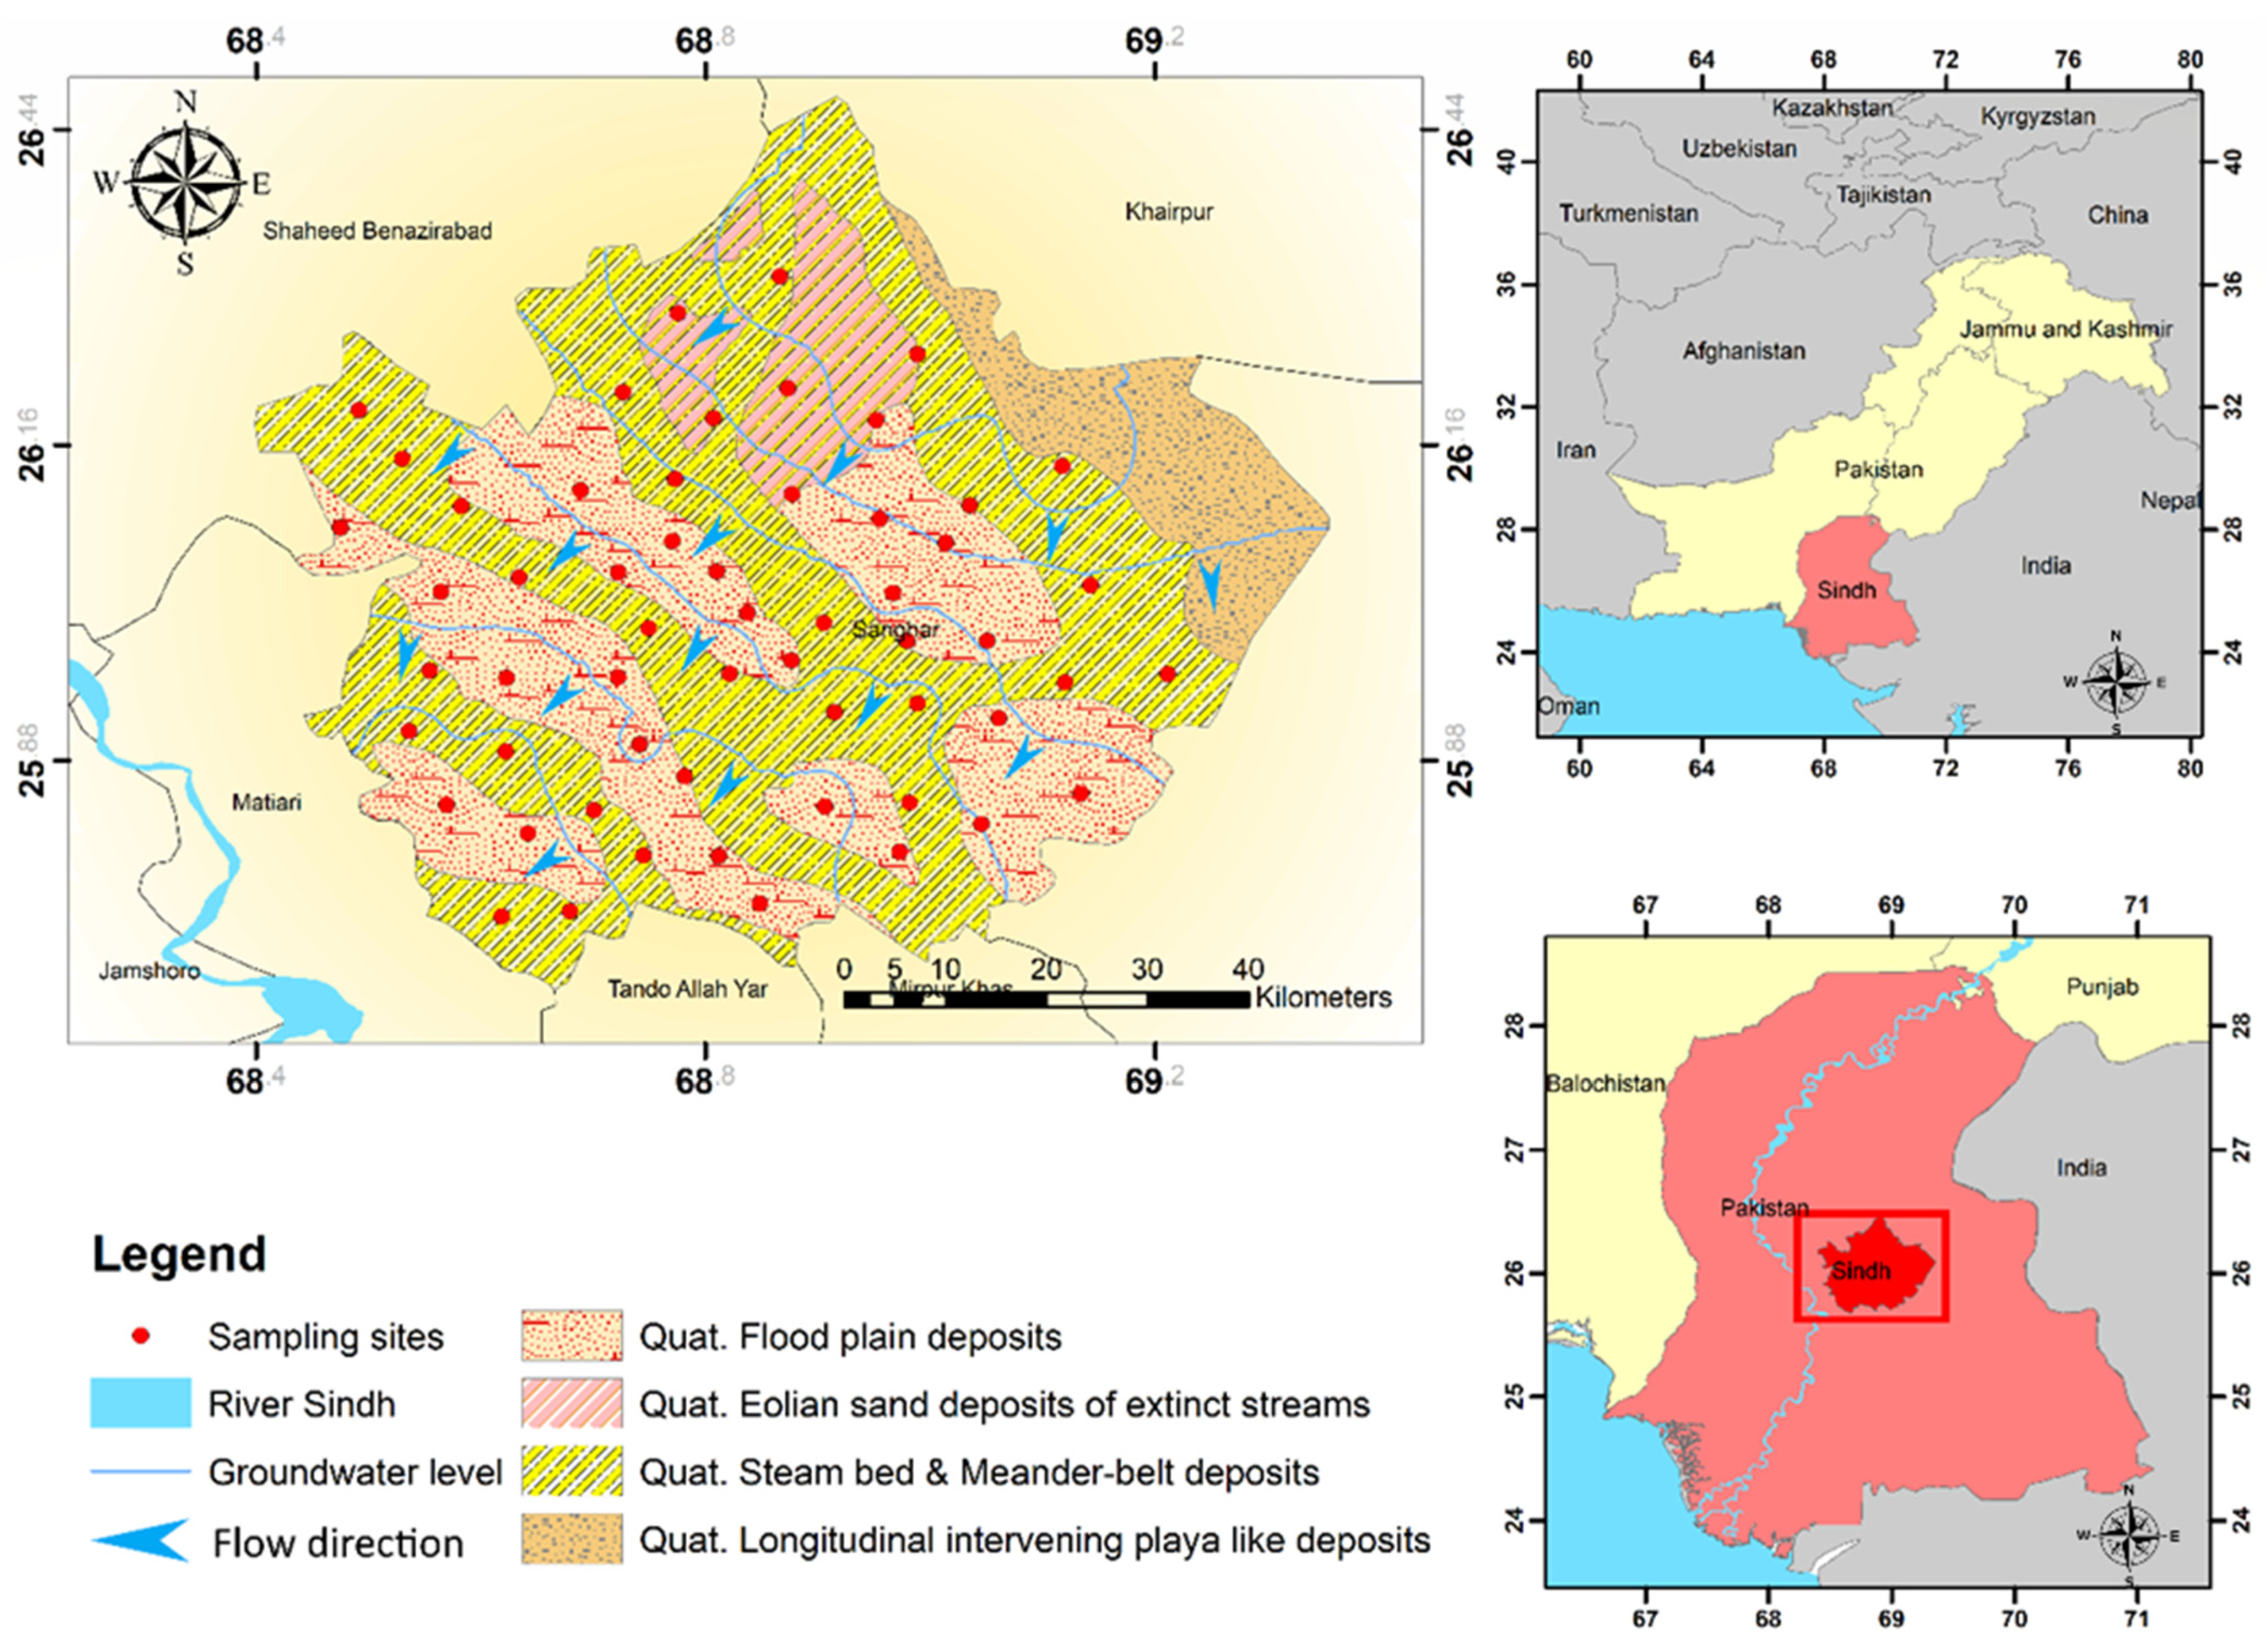
2.1. Study Area Location and Climate

The groundwater samples were collected from district Sanghar, Sindh, province of Pakistan. The study area lies between 25° and 30° North latitude and 70–130° East longitude (Figure 1).
Sanghar district covers a total area of 987,313 hectares. The growing crops of the study area are rice, sugarcane, cotton, wheat, groundnuts, barley, and vegetables. The climate of the research area is colder in winter, hot, and drier in the summer season. There is a 2.2 million population in the study area. The primary occupation of the people of the Sanghar district is agriculture practices. Agriculture action is the main occupation, and more than 30% of people are engaged in this occupation to fulfill their daily needs. The second dominant income source of the area is unskilled labor that employs 22% of the local people to earn their livelihood.

2.2. Geology and Hydrology

The study area has rough topography from north to south. The Nara Canal irrigates the western section of the site is the leading water source for irrigation and drinking purposes. The study zone is bounded by alluvial pledges, primarily composed of silts, sand, and clay of Tertiary rocks [34]. The nature of soil differs significantly from one place to another sand and clay extent all over the study area. The research area is protected mainly by floodplains which consist of bar deposits. According to lithological studies, there are 250 to 450 feet thick sandy layers beneath the shallow aquifer [35]. They are satisfactory to intermediate micaceous sands having well-sorted bands and lenses of silt and clay. The pledges are highly diverse, and the lithology varied so widely that the situation is challenging to match the strata discovered in two adjacent wells [36,37]. The proportion of sand and clay bands, on the other hand, is highly consistent over huge areas. In this aquifer, the depth of water tables ranges from 1.39 m to 12.76 m, having an average depth of 3.93 m [38]. The leading causes of salinity in the region include the under-watering of crops, low harvesting strength, and outflow from streams and adjacent canals. Chemical investigation shows that the studied area is modest to severe saltish, with saline-alkali soil accounting for 5.5% of the overall landmass.

2.3. Collection and Analysis of Samples

Groundwater samples (n = 61) were collected from various sources, including dug wells, boreholes, hand pumps, and tube wells, to evaluate the groundwater quality in Sanghar district, Sindh province (Figure 1). The wells were pumped for more than 5 min before sampling to escape the effect of stagnant water [39]. Groundwater samples were then kept in polyethylene 1.5 L contamination-free bottles and immediately shifted to the research laboratory. The samples were subsequently tested in the standard water quality research laboratory of the Pakistan Council for Water Resources Research (PCRWR). The basic water quality parameters like TDS, EC, and pH were measured using an electrochemical analyzer and pH meter (Hac 44600-00, Loveland, CO, USA) [40]. An ultraviolet-visible (UV-VIS) spectrophotometer (Germany) was used to examine the samples for significant anions such as No3 and SO42−. The titration method was used to analyze bicarbonate (HCO3) and chloride (Cl). A flame photometer (PFP7, Cambridge, UK.) was used to measure the main cations such as Na+, K+. To achieve the value for Ca2+ and Mg2+, a volumetric titration with ethylene diamine tetra acetic acid (EDTA, 0.05 N) with <2% analytical error was used [41]. An atomic absorption spectrophotometer (AAS Vario 6, Analytik Jena, Jena, Germany) was used to measure the quantity of arsenic in groundwater samples. The charge balance error (CBE) was applied to verify the structures of groundwater analysis. The CBE is negative in water samples with a high concentration of anions while showing positive CBE; when cations, concentration increases. It was calculated using the following (Equation (1)).
CBE = [ cations anions ] [ cations + anions ] × 100
Ionic absorptions are expressed in milliequivalent per liter (meq/L). Only those samples with less than ±5% CBE were accepted for further analysis following a standard protocol [7,42].

2.4. Assessment of Water Quality

Entropy Water Quality Index (EWQI)

The water quality index (WQI) is a simple operative measure for defining the suitable drinking water used worldwide [43]. The old-style approaches of WQI suffer from some attentive limitations and could not deliver important evidence on groundwater quality. This study uses an advanced tool to quantify groundwater quality using entropy weight (EWQI) [44].
EWQI was measured via the following equation:
EWQI = j = 0 n W J q j
where n denotes the sum of factors used to calculate the EWQI, and ( ω j ) indicates the jth A = P ( 1 + r n ) n t .
The parameter of entropy weight and qj shows the jth parameter quality rating scale. Equation (3) was used to estimate the entropy weight ( ω j ) for individual factors:
W j = 1 e j j = 1 n ( 1 e j )
The following connections express the information of entropy (ej):
e j = ( 1 1 n , m )
where (m) specifies the whole sum of samples, and pij is the indexed value ratio for the j index for sample I and is considered using Equation (5):
p i j = y i j i = 1 m y i j
yij is the consistent value of the jth parameter for the ith sample. The following equation is used to determine the normalizing construction function for the efficiency type:
Y i j = C i j C j min C j max C j min
where Cij signifies the perceived value of the ith sample of jth parameter, and Cjmin and Cjmax signify the lowest and high standards of the jth parameter individually.
Calculating a significant rating scale qj for each parameter is the second stage in EWQI estimation. The following equation is used to compute the qi value:
q i = C j S j × 100
while Cj denotes each measured parameter concentration in mg/L, and Sj represents the desired limit (mg/L) for every factor conferring to WHO standards.

2.5. Statistical Data Analysis

For understanding the data set, statistical analysis plays a vital role in representing various operations. Pearson correlation analysis was applied in SPSS (Armonk, NY, USA) to explain the relationship between water quality parameters. To interpret hydrochemical facies, a Piper diagram was organized over Aqua-Chem (version 2010.1). Saturation indices were measured over the geochemical simulation program PHREEQC (version 3.1), which determines the affinity of groundwater to dissolve a specific mineral. The geological map of the study area, and the water quality map for drinking purposes, were made using ARC GIS (version 9.3).

3. Results and Discussion

3.1. Groundwater Composition

The statistical summary of the physiochemical parameters of groundwater is shown in Table 1.
The electrical conductivity value ranged from 305–5570 µs/cm, with a mean value of 1200 µs/cm, in all groundwater sources of district Sanghar. The high (EC) water samples reflect leakage or suspension of the aquifer constituents or other bases such as saline water bodies [45]. The pH of samples was in the range of 6.8 to 8.7, having a mean value of 7.6, showing the alkaline nature of groundwater sources. As a key water quality parameter, pH determination is compulsory due to its special effects on water chemistry, alkalinity, speciation, and solubility [46]. Total dissolved solids (TDS) were recorded, varied from 195–3564 mg/L with an average value of 739 mg/L, and were found inside the acceptable limit recommended by WHO. High TDS in groundwater indicated ion dissolution, which might be credited to progressively depleting salts and minerals over time [47]. Groundwater total hardness (TH) ranged from 13 to 1350 mg/L, with a mean of 316 mg/L. The rock–water interaction was mainly responsible for the significant random changes of the parameters mentioned above under extreme anthropogenic activities, which cause the solubilization of the minerals and salts [48]. Among cations, Na+ exhibits a high mean concentration 125 mg/L, followed by Ca2+ 61 mg/L, Mg2+ 41.6 mg/L, and K+ 2.81 mg/L in all groundwater sources and was within the recommended acceptable range of WHO. Under the anthropogenic influence, comprehensive interface and interaction among groundwater and adjacent rocks may result in higher Na+ and K+ concentrations [49]. The anions showed high dominance in comparison with cations. HCO3 was detected with high concentration varied from 90 mg/L to 590 mg/L, with a mean value of 233 mg/L. The elevation in HCO3 concentration is caused by the dissolution of calcite, carbonate, marble, and dolomite-bearing minerals [7,50,51]. The value of Cl and SO42− ranges from 20–850 mg/L, 20–1024 mg/L, respectively, with a mean value of 158.34 mg/L and 137.81 mg/L. NO3 values range from 0.1–27 mg/L having a mean value 0.97 mg/L. The concentrations of cations and anions were found in decreasing order of Na+ > Ca2+ > Mg2+ > K+, and HCO3 > Cl > SO42− > NO3, respectively. Arsenic had low to high concentration levels varied from 5–25 µg/L, with mean values of 12.9 µg/L in the study area. For the value of As in all groundwater samples, 28 samples (45%) had beyond the permissible limit out of sixty-one groundwater samples. As a result of natural and anthropogenic sources, elevated As concentration in groundwater sources has become a main environmental problem [52]. Water-logging and excessive pesticide use are all anthropogenic causes of arsenic enrichment [29,53].

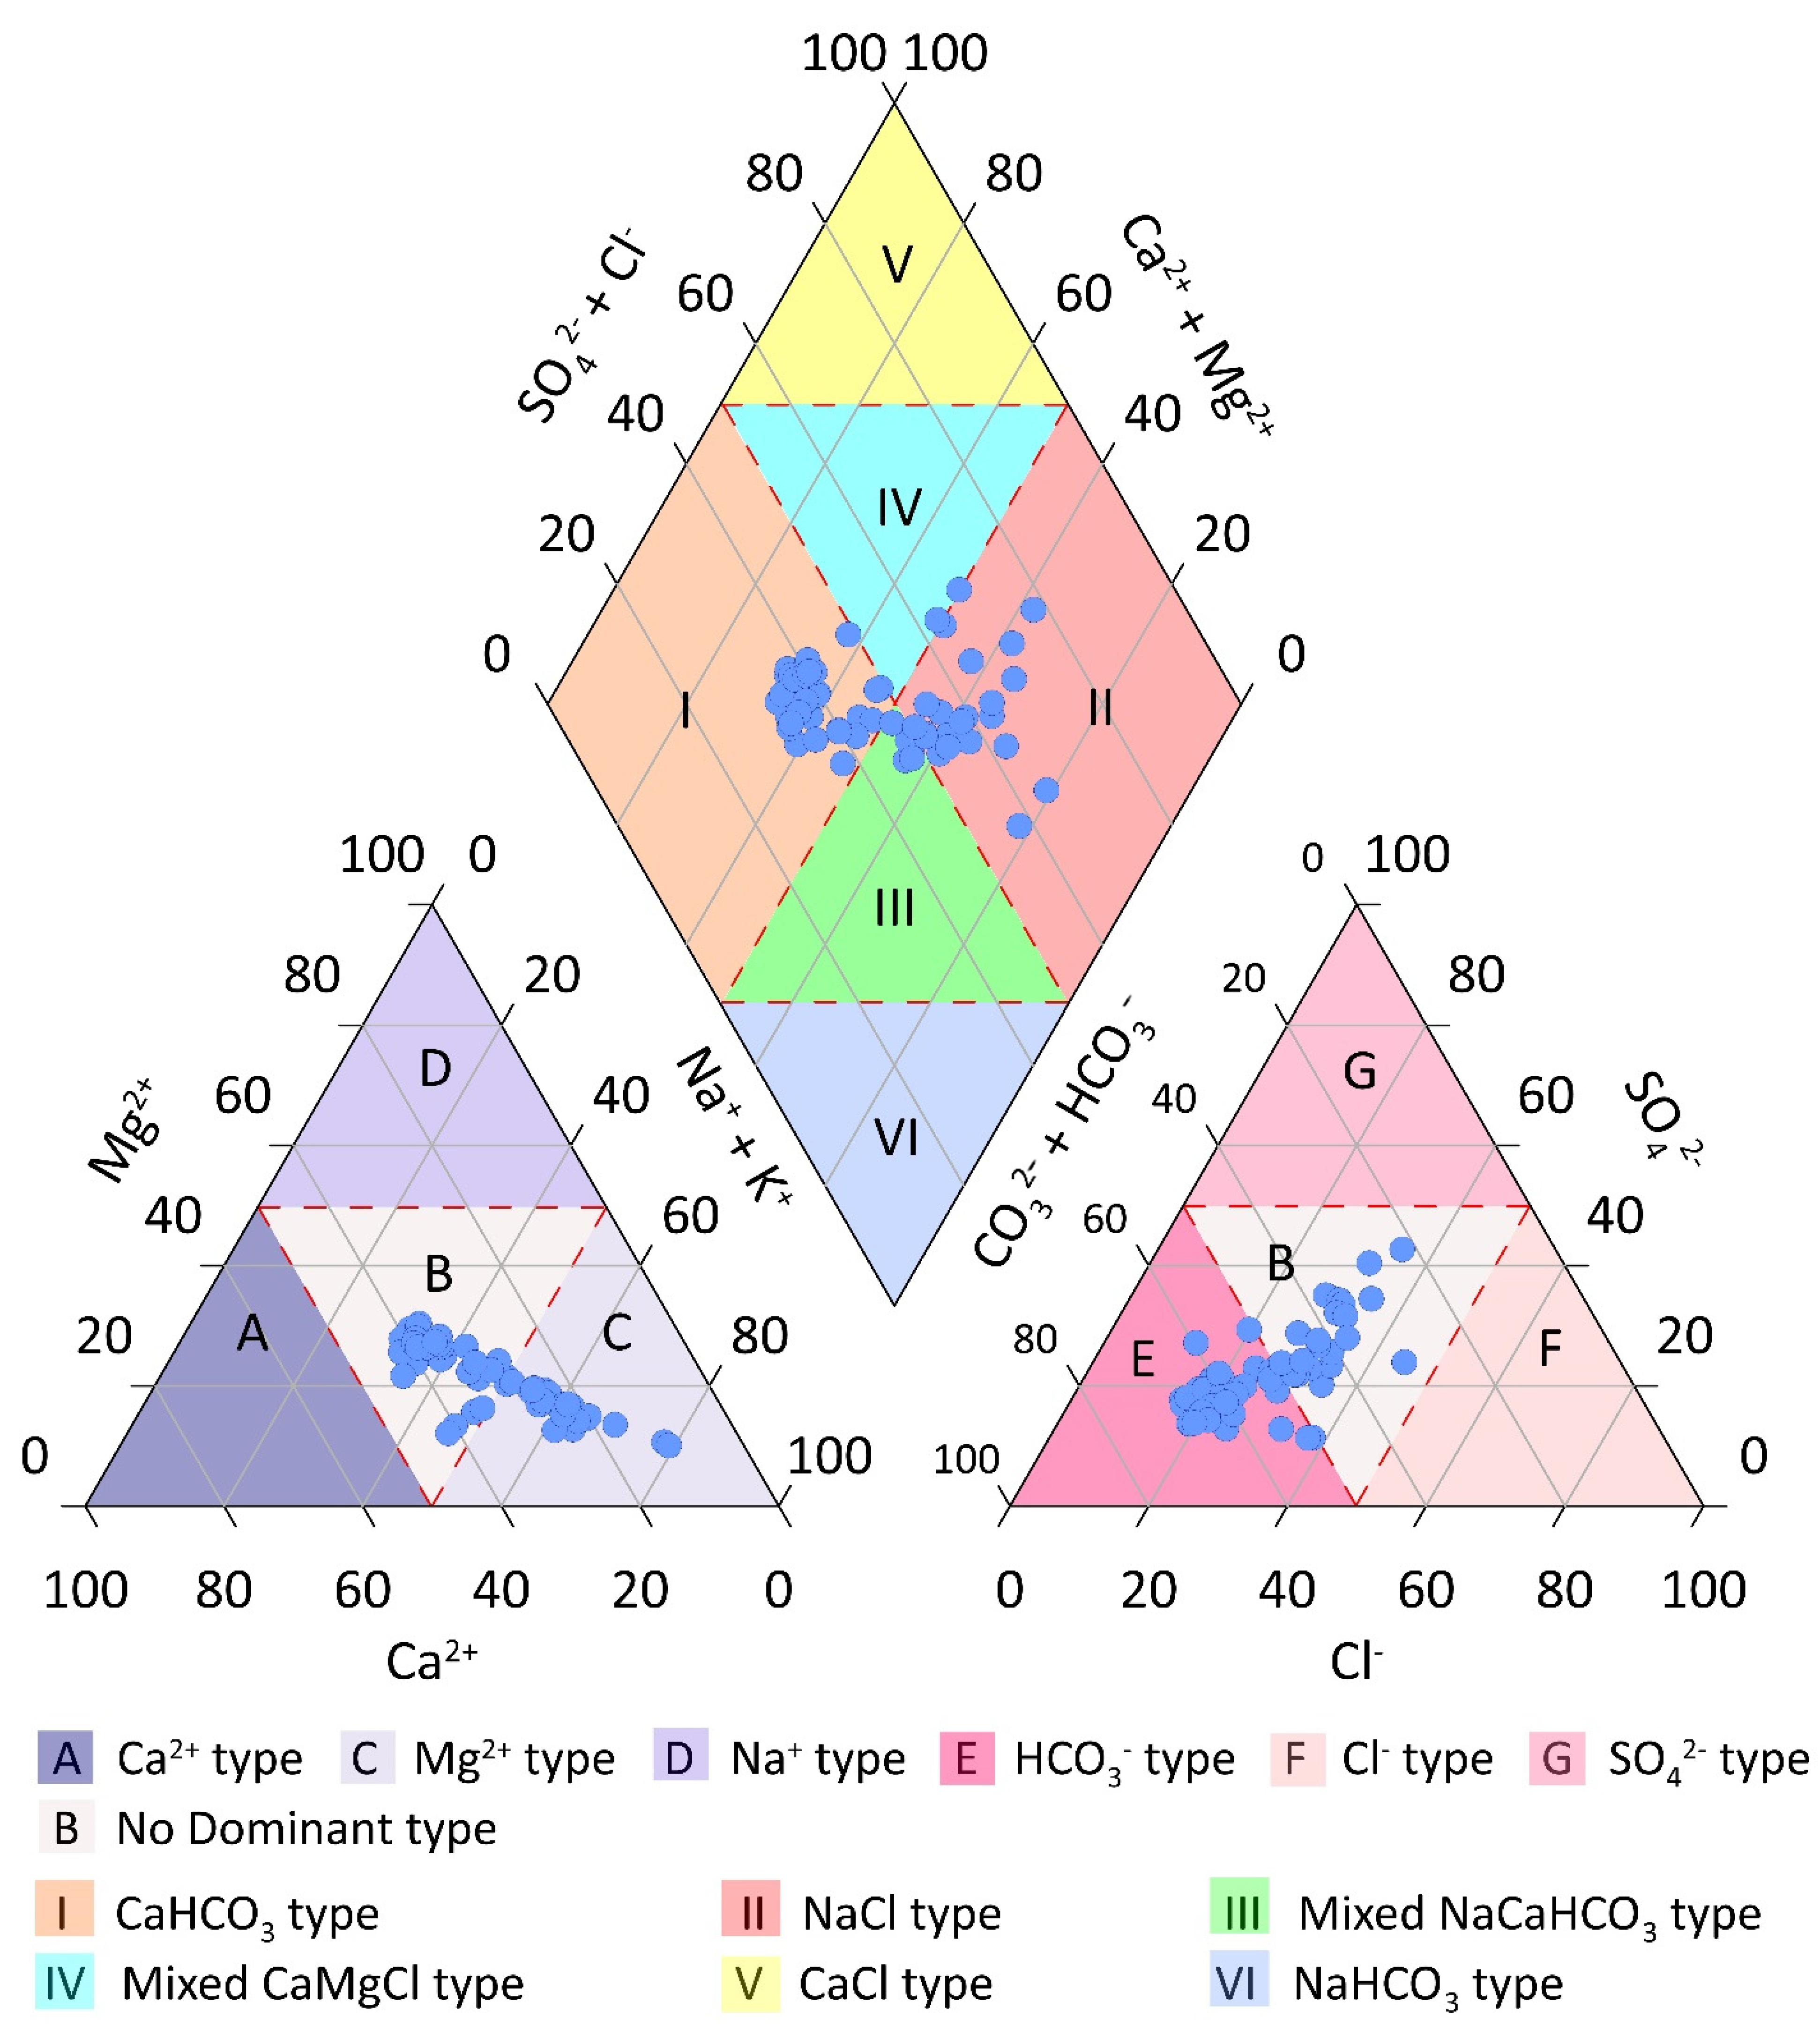
3.2. Hydrochemical Facies

The hydrochemical facies represent the whole situation of groundwater clarifications interacting within a lithological configuration [54]. The richness of each ion as a proportion of total cations and anions was used to define the geochemical evolution of groundwater samples [55]. The Piper diagram (1944) provides a detailed graphical design of sample hydrochemistry and hydrochemical regimes [56]. Groundwater samples were plotted in a Piper diagram as shown in (Figure 2).
Maximum samples fell in the NaCl and CaHCO3 type, which indicates that hydrochemical activities, anthropogenic actions, interface with the unsaturated region, improved resident time, and the rock–water interaction influences ion exchange in the study area. Few samples lie in the mixed type with CaMgCl, indicating that most depend on silicate weathering, dissolution of the carbonates, and ion-exchange processes in the aquifer. Similarly, regarding cations, the samples were lie in with Mg2+ type and non-dominant type, Mg2+ concentration persisted above the contents of other cations, indicating the supremacy of ion exchange and weathering of silicate. In contrast, in anions, most of the samples fall in with HCO3 type and No-dominant type in comparison with anions, depicting the eminence of carbonate weathering [57]. Most of the samples lie in both the cations and anions B zones mixed type, portraying the importance of silicate weathering and ion exchange [58]. The prevalence of Mg2+ and HCO3 in both zones suggests that they are derived mainly through carbonate and sulfate solubilization. The dissolution of calcite, dolomite, and gypsum as the significant bases of these ions is generally indicated by a close relationship with the equilibrium line [57].

3.3. Principal Component Analysis (PCA) and Correlation Analysis of Groundwater Variables

Table 2 shows the findings of principal component analysis (PCA) for groundwater parameters. Thus, following varimax rotation, PCA findings were attained to clarify the obtained sources that influenced the groundwater [7,59]. Four aspects, including PC1, PC2, PC3, and PC4 for groundwater parameters, were obtained with eigenvalues of 8.88, 1.68, 1.12, and 0.98 total variance of 68.33%, 12.99%, 7.08%, and 4.5%, respectively.
PC1 of groundwater variables showed a contribution of 68.88% variability, having an eigenvalue of 8.88. The loadings values of groundwater variables (EC., TDS, TH, Na+, K+, Ca2+, Mg2+, HCO3, Cl, SO42−, NO3) were calculated to be (0.99, 0.90, 0.93. 0.94, 0.96, 0.97, 0.91, 0.98, 0.94, and 0.54), respectively. PC-1 had a high contribution of loading factors for the above parameters in PCA results. PC-1 demonstrated the geogenic and anthropogenic sources in the study area by showing a high contribution of moderate and strong positive loadings for all groundwater samples. The PC1 indicates the ionic configuration of groundwater and resultant from minerals dissolution, ion exchange, and weathering of host granitic rocks. Due to the high relationship between Na+ and Cl, PC1 describes the great difference in the data set, may be hard and salinity. The occurrence of carbonated rocks in the study area and the higher concentration of Na+ and Cl contributed to the high TDS values [60].
Moreover, EC, TDS, and level specified were expected to influence by erosion of schistose rocks having sulfide minerals. The TDS, EC, Na+, and K+ could be derived through bedrock leaching, implying that PC-1 has geogenic sources [7,28]. In contrast, the Cl, NO3, and SO42− impurity is caused by anthropogenic sources such as animal manure, agriculture fertilizer, and atmospheric and soil sources [12,61,62]. The origins of SO42− and HCO3 resulted from the dissolution of gypsum and calcium-bearing minerals and rock–water interaction [7,51]. Thus, PC1 accounted for mixed sources of geogenic and anthropogenic sources in the study area.
PC2 shows variables of groundwater water accounted for 12.92% variability with an eigenvalue of 1.68 (Table 2). The high loadings values of groundwater were pH (r = 0.80), NO3 (r = −0.55), and As (r = 0.78). pH and NO3 levels are probably influenced by agriculture activities, while As can be credited to smelting activities of antimony ores in the study area [63]. Hence, PC2 exhibits anthropogenic sources in the study area. The groundwater variables PC3 and PC4 accounted for 7.08% and 4.5% variability, with eigenvalues of 1.12 and 0.98. PCA results support the hydrogeochemical processes. The significant correlation of PC3 and PC4 was K+ and NO3 with coefficient (r) values of (0.91, 0.60). In the study area, both natural and anthropogenic activities play a significant role in groundwater pollution.
Furthermore, the groundwater pollution in the study area is caused by agricultural operations and household garbage [60]. The nitrate contamination resulted from agricultural practices, fertilizers, sewage, and animal manure [64]. Thus, the factors PC3, PC4 showed the anthropogenic causes in the research region.
The Pearson correlation constant (r) mostly finds how properly the groundwater samples are assembled in a straight line [65]. Both variables are highly dependent on one another, as seen by the positive correlation values. On the other hand, significant inverse relationships show that agriculture soil factors do not affect each other [62,66,67]. As a result, the inverse relationship indicates that the data set has little variability. Significant positive correlation pairs have been observed between different variables in groundwater sources.
The significant correlation values were observed for TDS and EC (r = 0.894), TH and EC (r = 0.904), TH and TDS (0.820), Na+ and TH (r = 0.817), Ca2+ and EC (r = 0.948), Ca2+ and TDS (r = 0.878), Ca2+ and TH (r = 0.920), Ca2+ and Na+ (r = 0.862), Mg2+ and EC (r = 0.960), Mg2+ and TDS (r = 0.867), Mg2+ and TH (r = 0.950), Mg2+ and Na+ (r = 0.882), and Mg2+ and Ca2+ (0.953) (Table 3). While significant positive correlations were observed between cations and anions in groundwater sources, i.e., HCO3 and Na+ (r = 0.891), HCO3 and Ca2+ (r = 0.889), HCO3 and Mg2+ (r = 0.885), Cl and Na+ (r = 0.951), Cl and Ca2+ (r = 0.947), Cl and Mg2+ (r = 0.964), Cl and HCO3 (r = 0.894), SO42− and Na+ (r = 0.950), SO42− and Ca2+ (0.881), SO42− and Mg2+ (0.895), SO42− and HCO3 (r = 0.797), and SO42− and Cl (r = 0.921) in the study area.

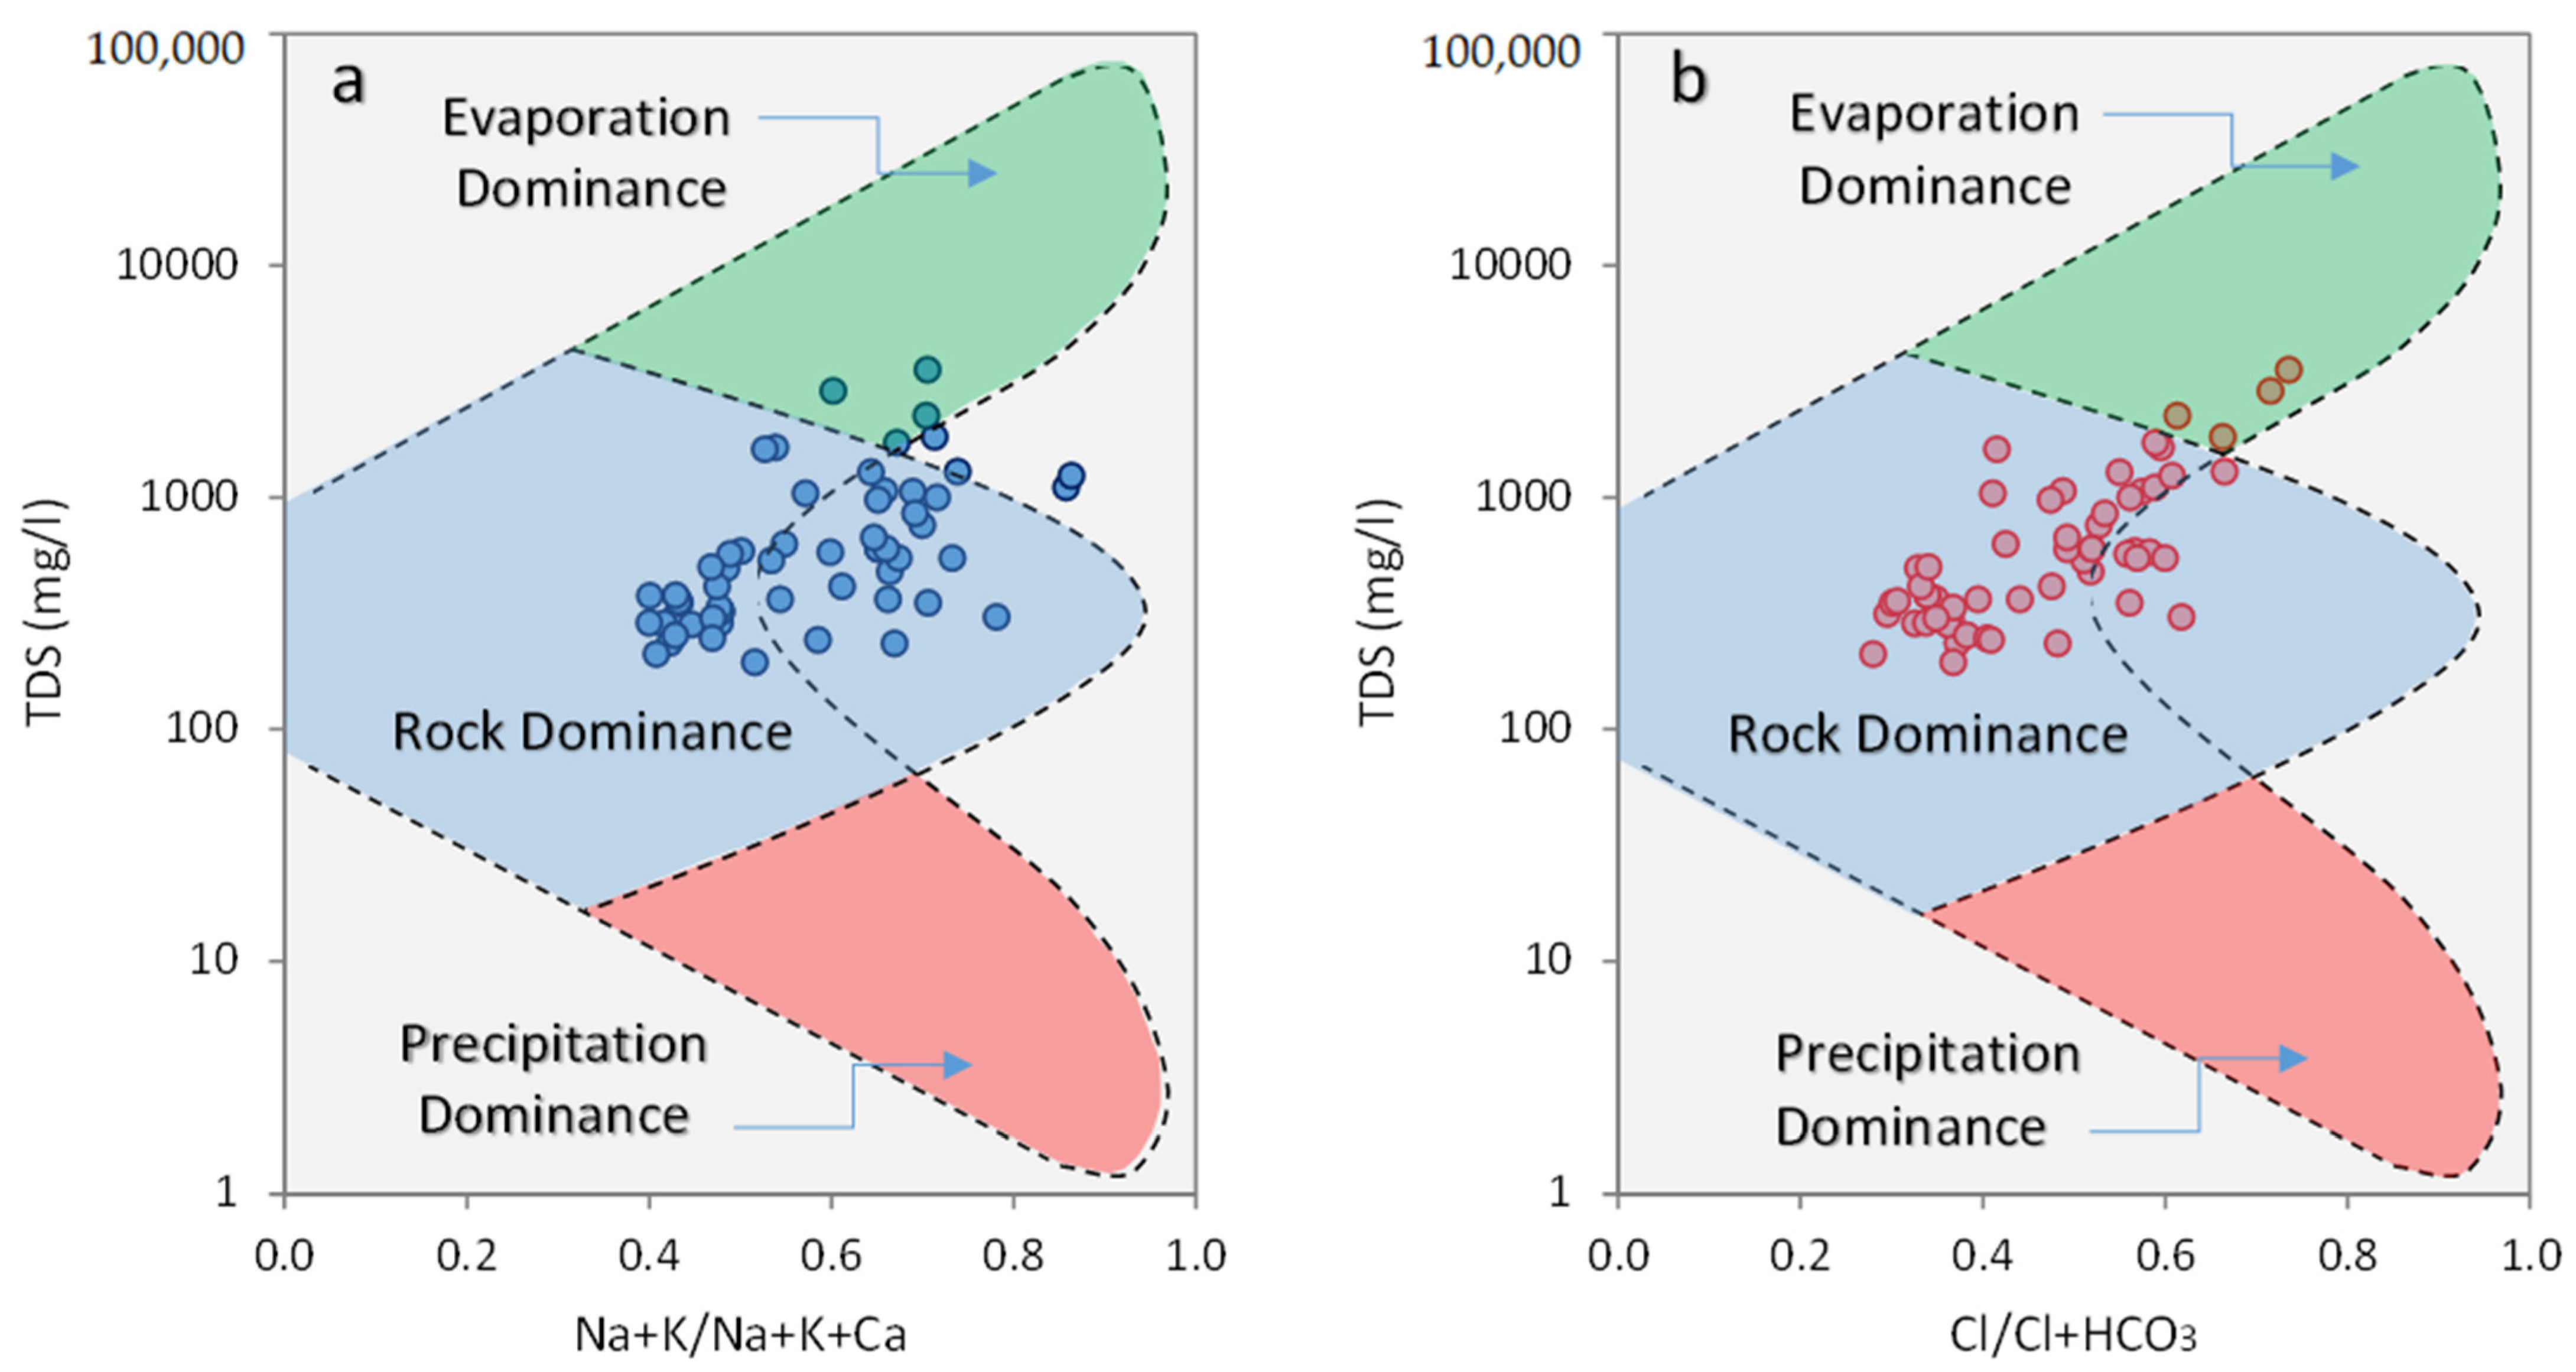
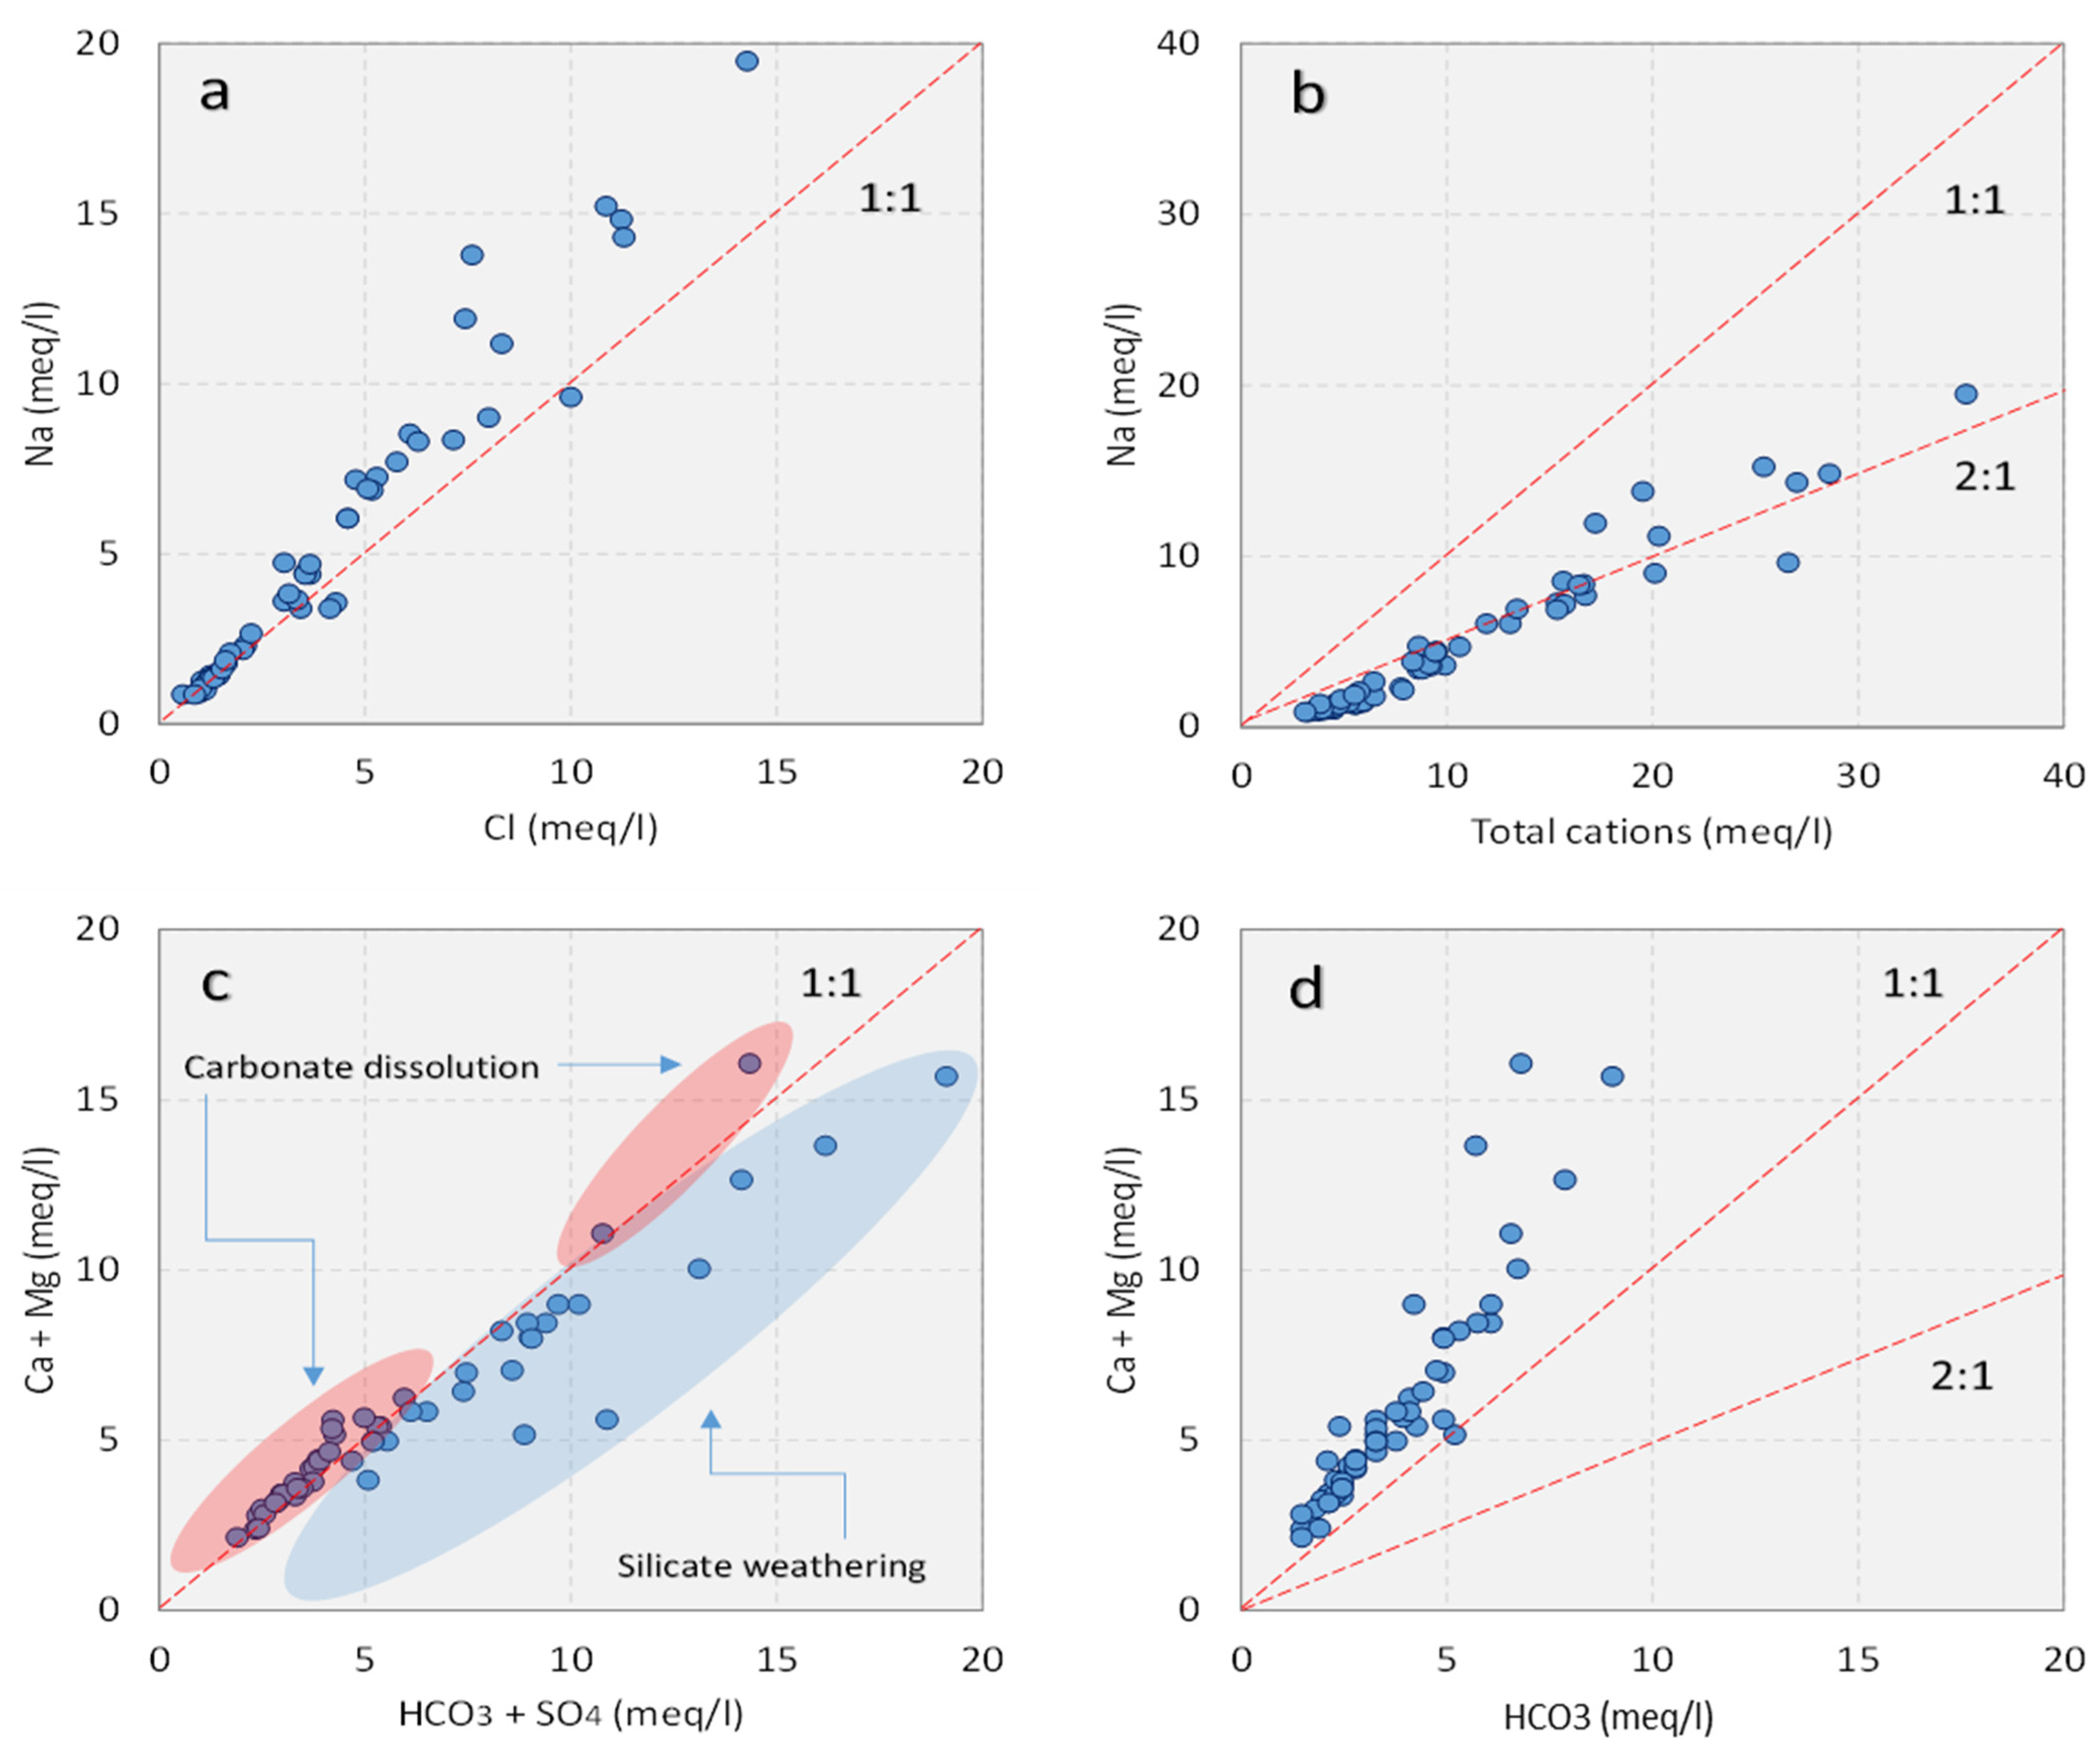
3.4. Mechanisms Controlling Groundwater Chemistry

The formation of groundwater chemistry, evaporation, rock-weathering, crystallization, and precipitation are significant contributors [68]. Gibbs (1970) [69] proposed a quite beneficial model for understanding the mechanisms that control groundwater chemistry. Hence, to monitor the influences of hydrogeological interfaces of the groundwater and groundwater data, Gibbs plots were considered. The subplots indicate the relationship of TDS with the weight ratio of Cl versus (Cl + HCO3) and a weight ratio of (Na+ + K+) versus (Na+ + K+ + Ca2+), respectively, as shown in (Figure 3).
A high percentage of samples are found in the rock dominance region, demonstrating that rock weathering is the primary factor influencing groundwater chemistry and evolution. The process of dissolvable salts and minerals becoming integrated with groundwater is assisted by parent rock weathering.
Furthermore, the mineral dissolution is assisted by the long resident time of rock–water interaction [70], further enhanced under the anthropogenic influence. Meanwhile, few samples lie in the evaporation dominance zone in the study area, identifying the concentrations of Na+ and Cl and the TDS levels in groundwater [7,71]. No sample occurs in the precipitation zone, which was sodomized to be negligible in the study area. The hydrogeological setting and weathering mechanisms play an essential role in the configuration of groundwater chemistry, as shown in the diagram. In addition to rock dominance, cation exchange is a credible mechanism for governing water chemistry composition in the study area [7]. The controlling mechanisms of rocks dominance contribution were consistent with the previous study [51,72].

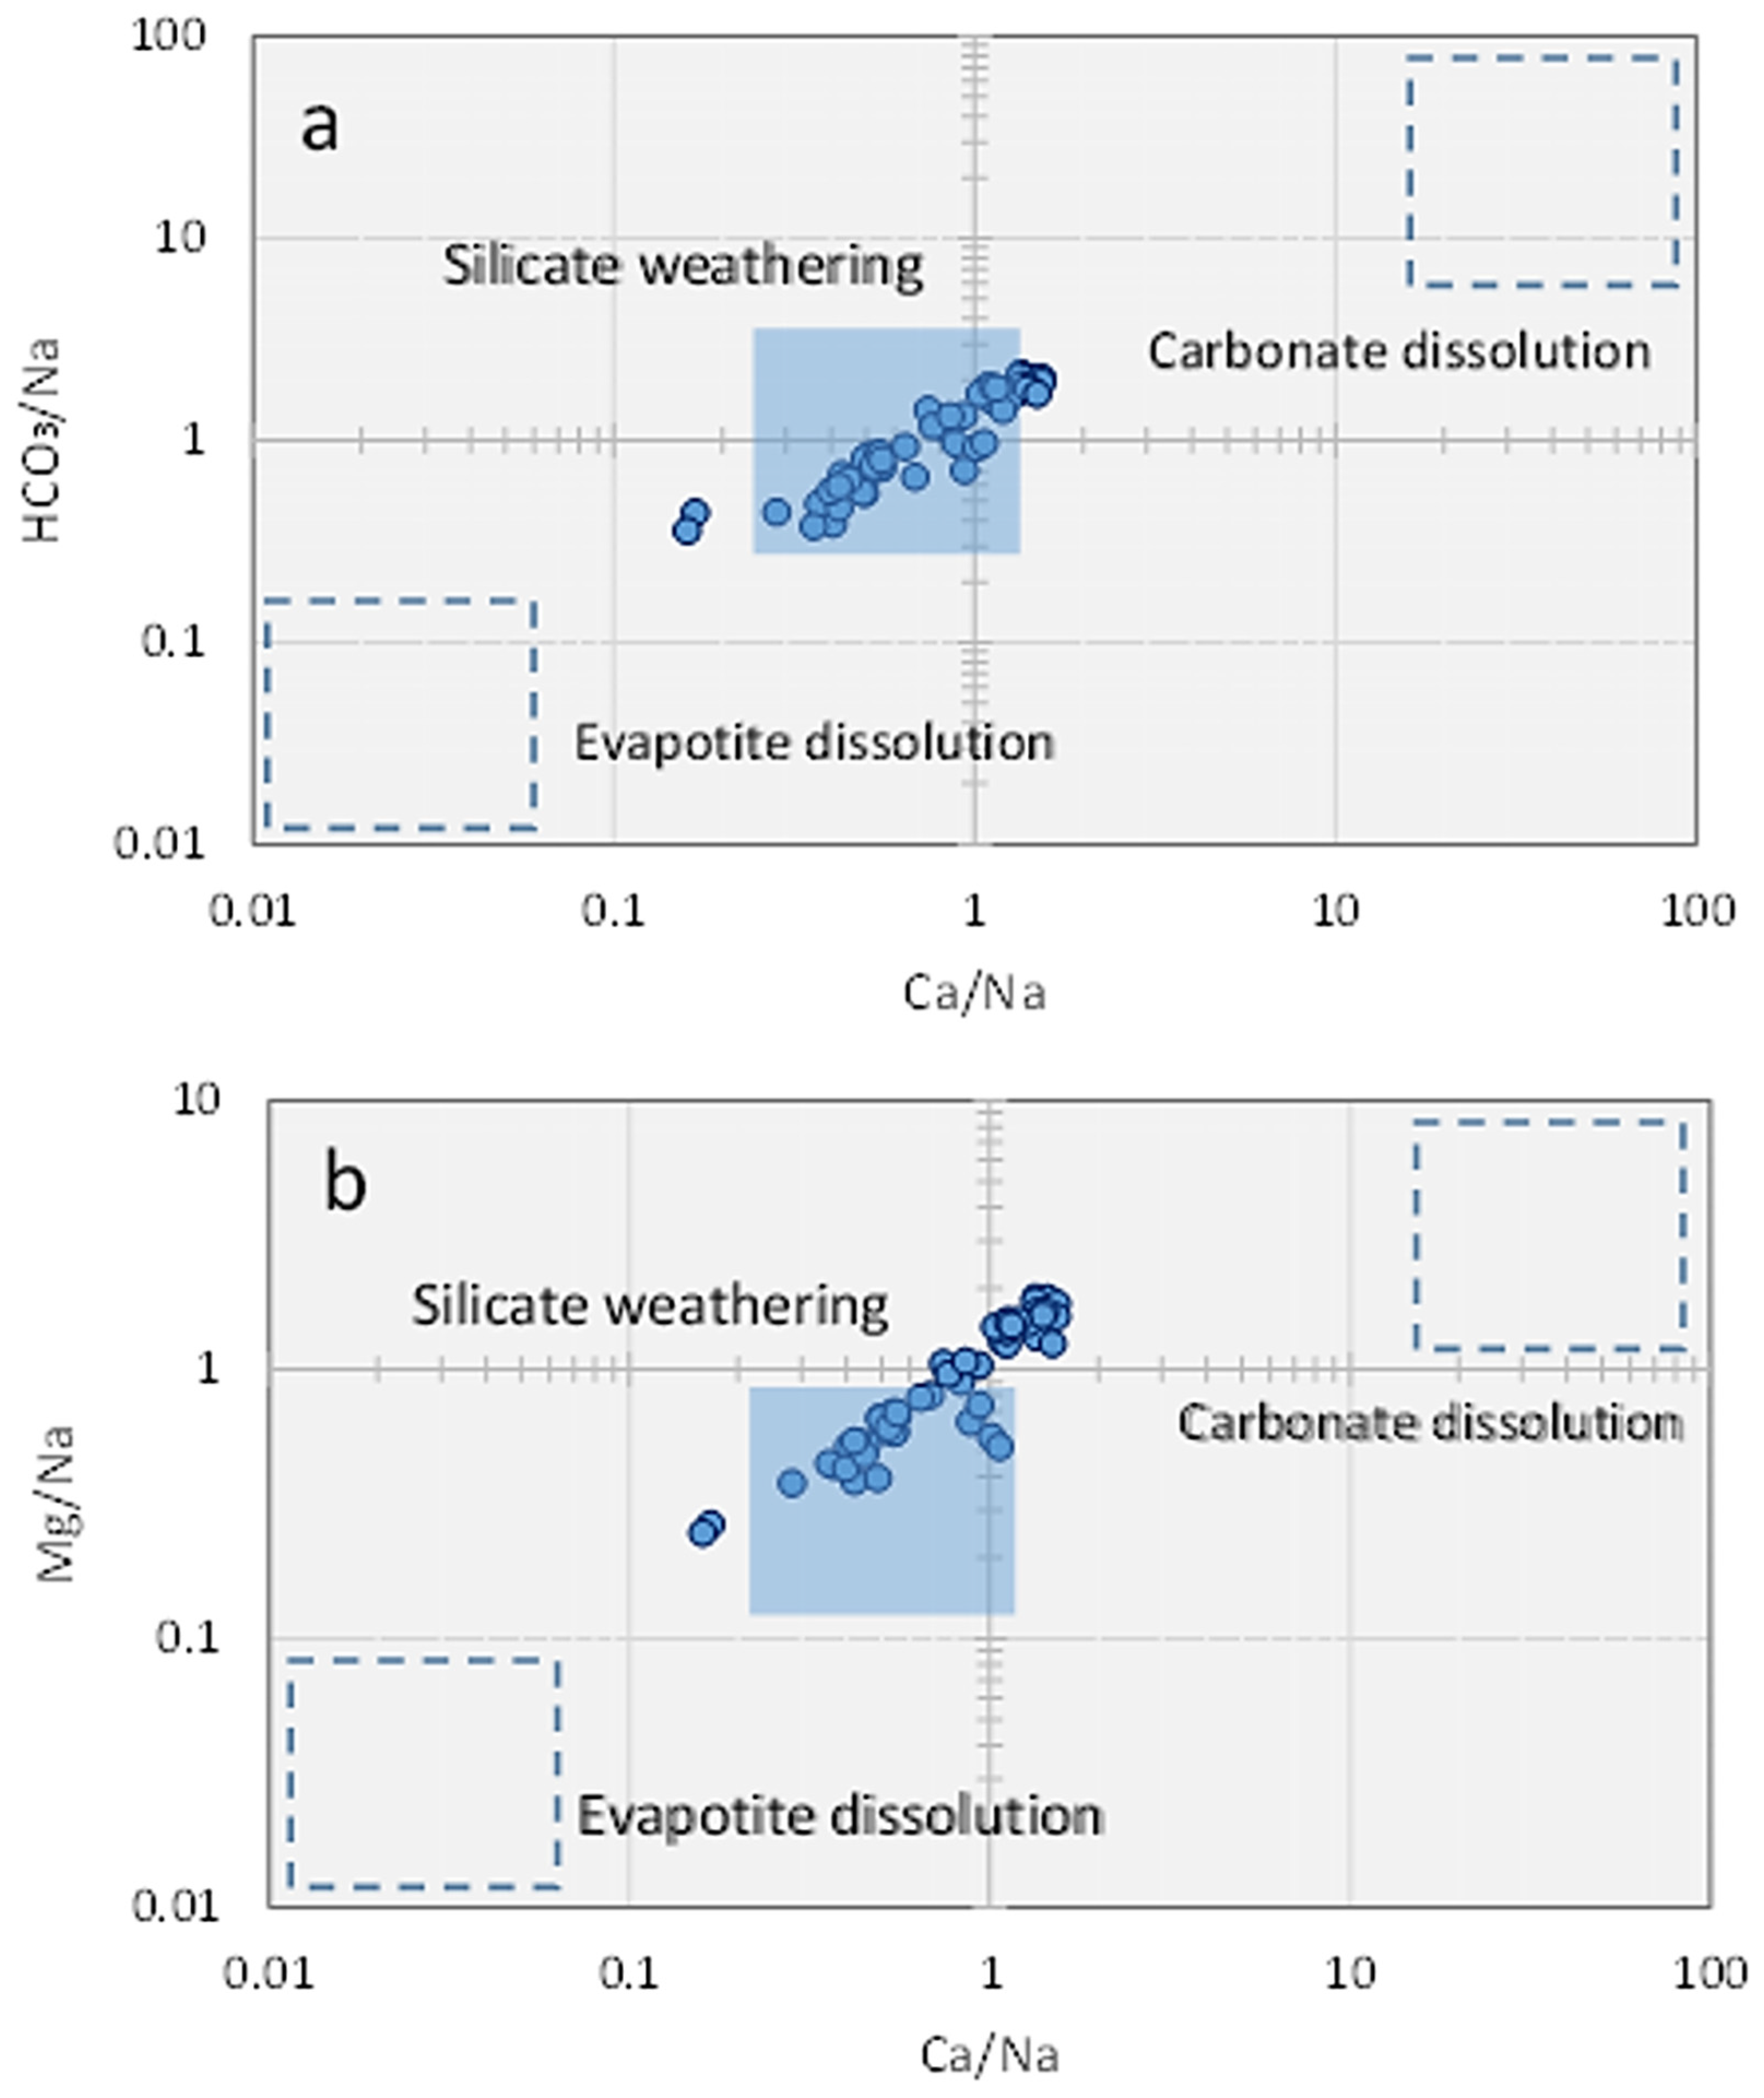
3.5. Silicate Weathering

The significance of silicate weathering in influencing the main ion chemistry of groundwater is essential [73]. The highest rich cation in the study area is sodium, produced via silicate weathering and the breakdown of halite. The Na+/Ca2+ values (>1) indicate the silicate weathering, and the distribution of samples away from the 1;1 in the Na+ versus Ca2+ plot suggested weathering of silicate minerals. The presence of additional Na+ from silicate weathering was indicated by samples away [7]. The deviation from the 1:1 line (Figure 4a) is accredited to the silicate weathering and ion exchange, such as the dissolution of albite might be responsible for increasing Na+ in groundwater if halite dissolution is the sole source of sodium. Hydro-geochemistry was governed by the association between aquifer lithology and penetrating water in the sub-surface [74]. The samples distribution along the equilibrium line of Ca2+ and Mg2+ against HCO3 + SO42− (Figure 4b) plot revealed the influence of carbonate dissolution for Ca2+ and Mg2+ distributions of the samples along the equilibrium line of Ca2+ + Mg2+ versus HCO3 + SO42− plot recommended that the effect of carbonate dissolution for Ca2 + Mg2+. In contrast, the HCO3 + SO42− values above five meq/L expected silicate weathering in groundwater sources (Figure 4c). Distributions of the samples along the 1:1 equiline of Ca2+ + Mg2+ versus HCO3 plot proposed the effect of calcite/dolomite dissolution (Figure 4d).
The hydrochemistry of gypsum, anhydrite, and halite was controlled by the dissolution of sulfate and chloride minerals suggesting the under-saturated conditions. However, the HCO3 formation was caused by the collaboration of penetrating groundwater with organic carbon in the topsoil and modest limestone dissolution in the aquifer [75]. The dominance of Ca2+ and Mg2+ in groundwater was caused by Na+ substituting Ca2+ in the aquifer matrix at promising exchange sites (i.e., Ca2+/Mg2+-bearing clay) reported by [76] in the reverse ion exchange field.
Silicate weathering is a comparatively slow process and contributes a minimal role in natural settings, and excessive silicate weathering indicates a significant anthropogenic effect in the study area. A rock–water interface controlled general hydrochemistry via gypsum, anhydrite, halite dissolutions, and silicate weathering; hence, ion exchange mechanisms played a minor role.
The Na+ normalized Ca2+ against a HCO3 plot shows (Figure 5a) and an Na-normalized Ca2+ against Mg2+ plot (Figure 5b) was used to investigate the impact of silicate weathering, carbonate solubilization, and evaporite dissolution.
The Na+ normalized Ca2+ versus Mg2+ plot shows that most of the Mg2+ are fall closed and derived from silicate weathering rather than carbonate and evaporite dissolution. The Na+-normalized Ca2+ versus HCO3 plot demonstrates that samples tend to fall into the carbonate and evaporite dissolution, except for silicate weathering. Overall, the results showed that most groundwater samples fall within the carbonate and evaporite dissolution, followed by the silicate carbonate weathering zone.

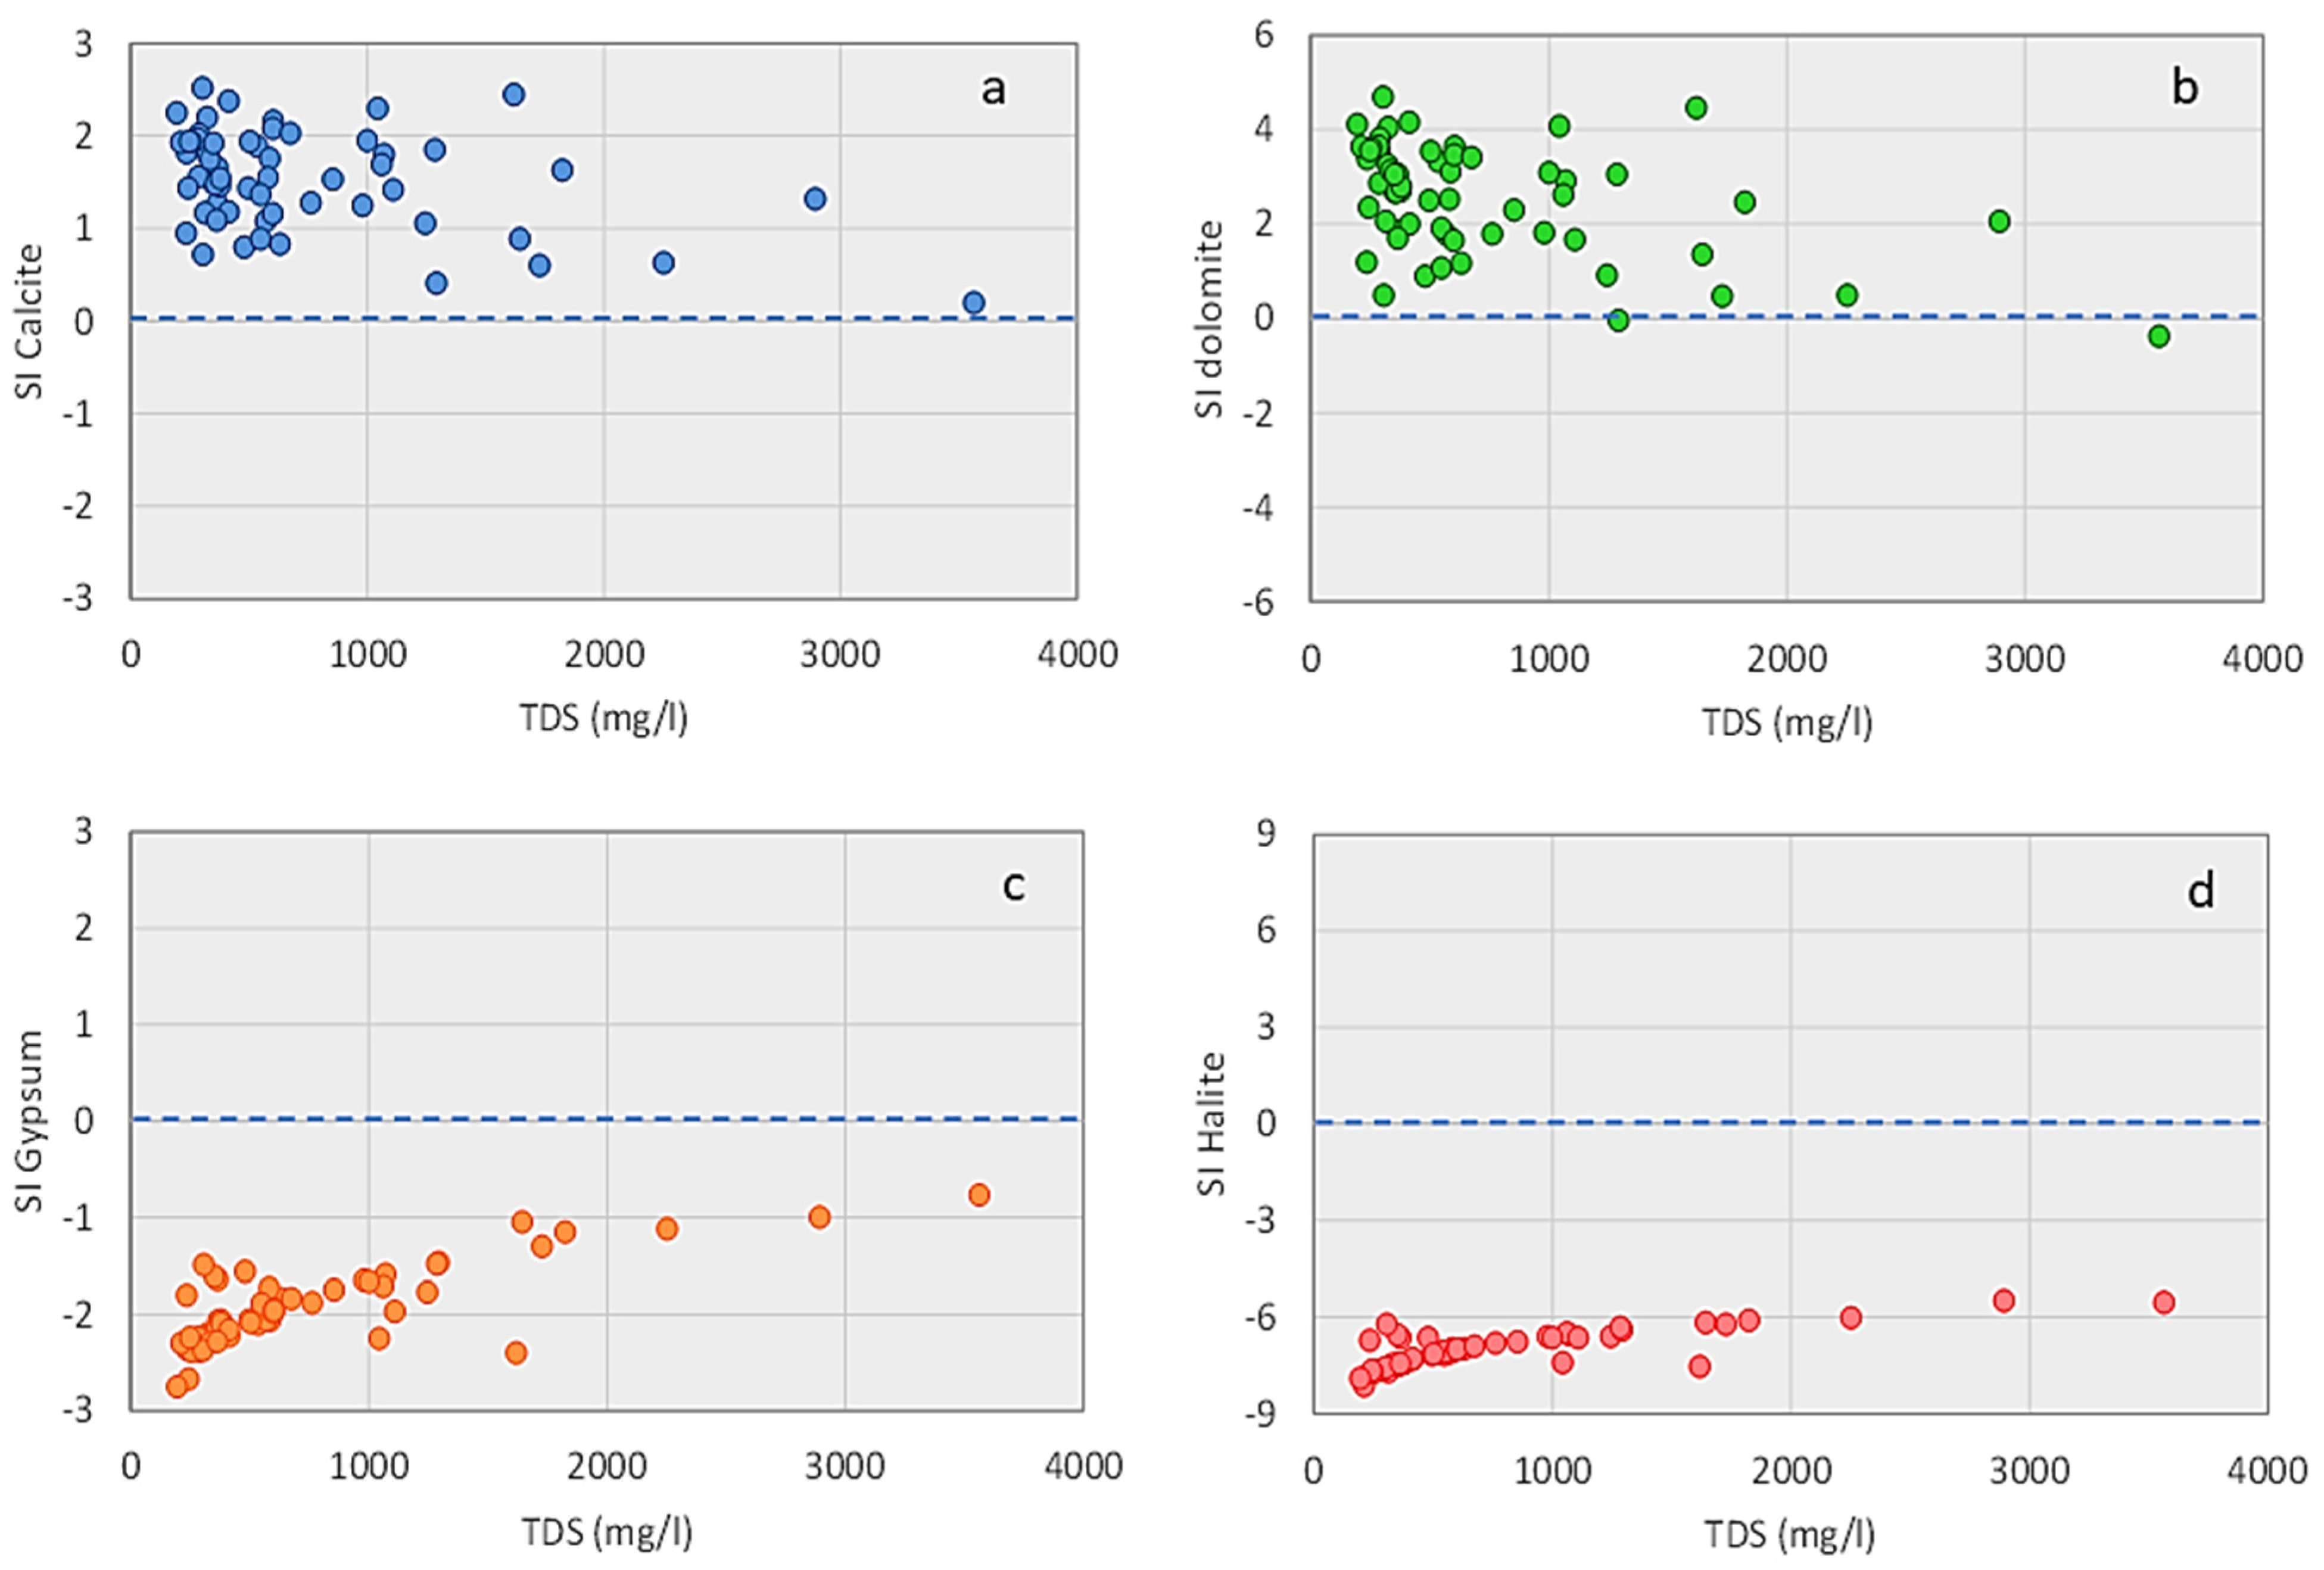
3.6. Saturation Indices for Minerals Phases
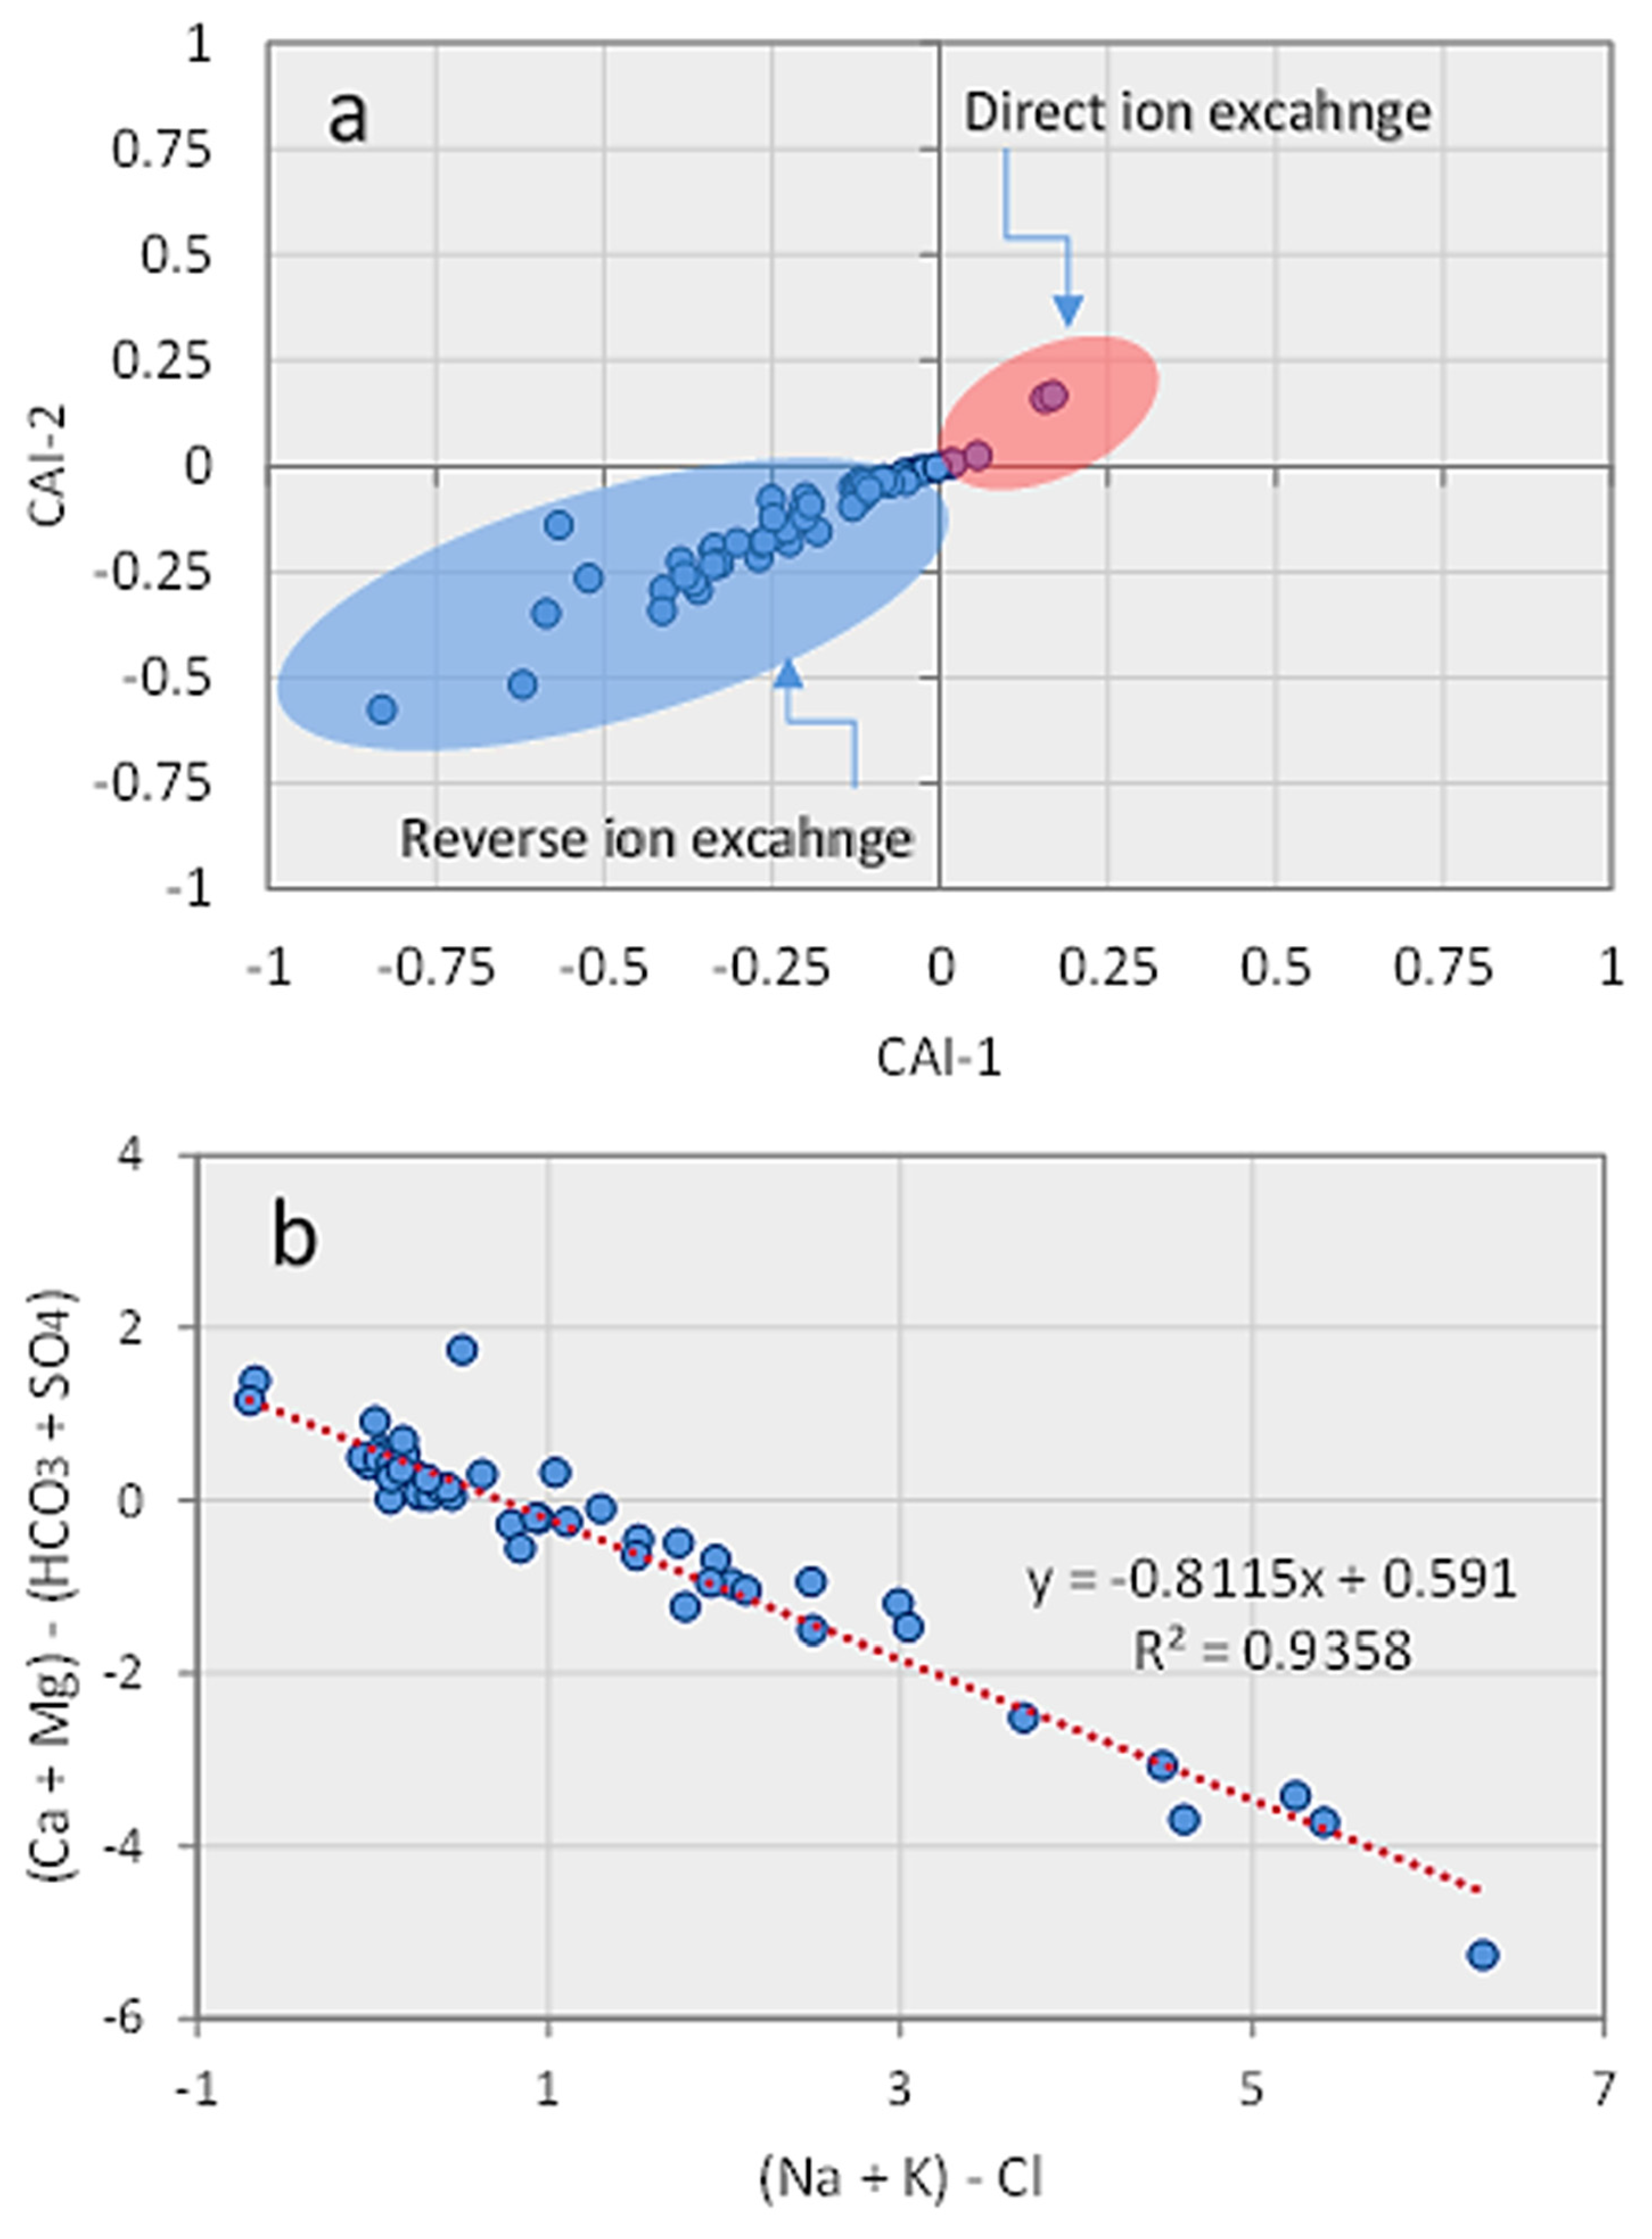
The speciation of geochemical modeling of saturation index (SI) values for groundwater samples, illustrated in Figure 6.
According to the geochemical modeling results, the aquifer conditions for SO42− and CO3 containing minerals, including gypsum having a value (−2.80) and halite (−8.82), were generally unsaturated. The negative SI values specify that there could be no prospective role in the sorption/desorption of As by these two mineral phases in groundwater [77]. On the other hand, the positive SI values for mineral phases of dolomite (2.6) and calcite (4.4) were observed. It demonstrates that these minerals could contribute to groundwater aquifers as the leading basis of As in the study area [78], releasing As due to the rock–water edge reactions. In the current study, the possible formation of SO42− and CO3 containing minerals and their role of As discharge under auspicious (alkaline) conditions could be found in dealing with groundwater’s pH data, which were observed to be in alkaline limit in the majority of water samples. Similarly, the aquifers of Tharparkar, Pakistan [79] observed a high saturation index value of calcite (SI < 0), implying its precipitation and dissolution in the As release process.

3.7. Ion-Exchange

The chloro-alkaline indices (CAI-1 and CAI-2) (Schoeller 1965) were used to explore the ion exchange reaction. These indices have a substantial impact on water chemistry and evolution [80]. The following formulas were used to determine the CAI1 and CAI2:
CAI 1 = ( Cl ( Na + K + ) / Cl
CAI 2 = Cl ( Na + + K + ) / SO 4 2 + HCO 3 + CO 3 2 + NO 3
All units are milliequivalent per liter (meq/L). The direct-ion exchange happens when both indices have positive values (Equation (10)). In contrast, the reverse ion exchange occurs when CAI-1 and CAI-2 have negative values (Equation (11)):
2 Na + + Ca X 2 Ca 2 + + 2 NaX
Ca 2 + + 2 NaX 2 Na + + CaX 2
Cation exchange mechanisms are frequently identified using the interaction between (Na+ + K+ − Cl) and (Ca2+ + Mg2+) − (HCO3 − SO42−) [81]. Moreover, the Chlor-alkali index (CAI) can be used to identify whether it is reverse or direct cation exchange [82]. If the CAI value is more significant than <0, it donates cation exchange in which Ca2+ in groundwater was exchanged for Na+ in the aquafer, whereas CAI value > 0 shows reverse cation exchange. Positive CAI-1 and CAI-2 readings show that Na+ and K+ ions in water are exchanged with Mg2+ and Ca2+ ions. Moreover, Mg2+ and Ca2+ ions are exchanged with Na+ and K+ from rocks when their indices are negative. That is a sign of a chloro-alkaline imbalance, as shown in Figure 7a.
The distribution of multiple water sample sites from the study area was near the y = x line, showing cation exchange impacts of groundwater chemical composition. Meanwhile, as shown in Figure 7b, the bulk of water sample locations in the study area lie inside the CAI < 0 zones, showing the dominance of reverse ionization.
The slope value of −0.812 (Equation (12)), which is very close to the theoretical value of −1, indicates linearity in the relationship between parameters, showing ion exchange between Na+, Ca2+, and Mg2+ (Figure 7b):
y= −0.8115x + 0.591 (R2 = 0.9358)
The majority of the samples are plotted in the lower-left corner of Figure 7a, showing reverse ion exchange (Equation (11)), an increase of Na+, and a decrease in Ca2+ in groundwater. On the other hand, few samples lie in the upper right corner, indicating direct-ion exchange (Equation (10)).

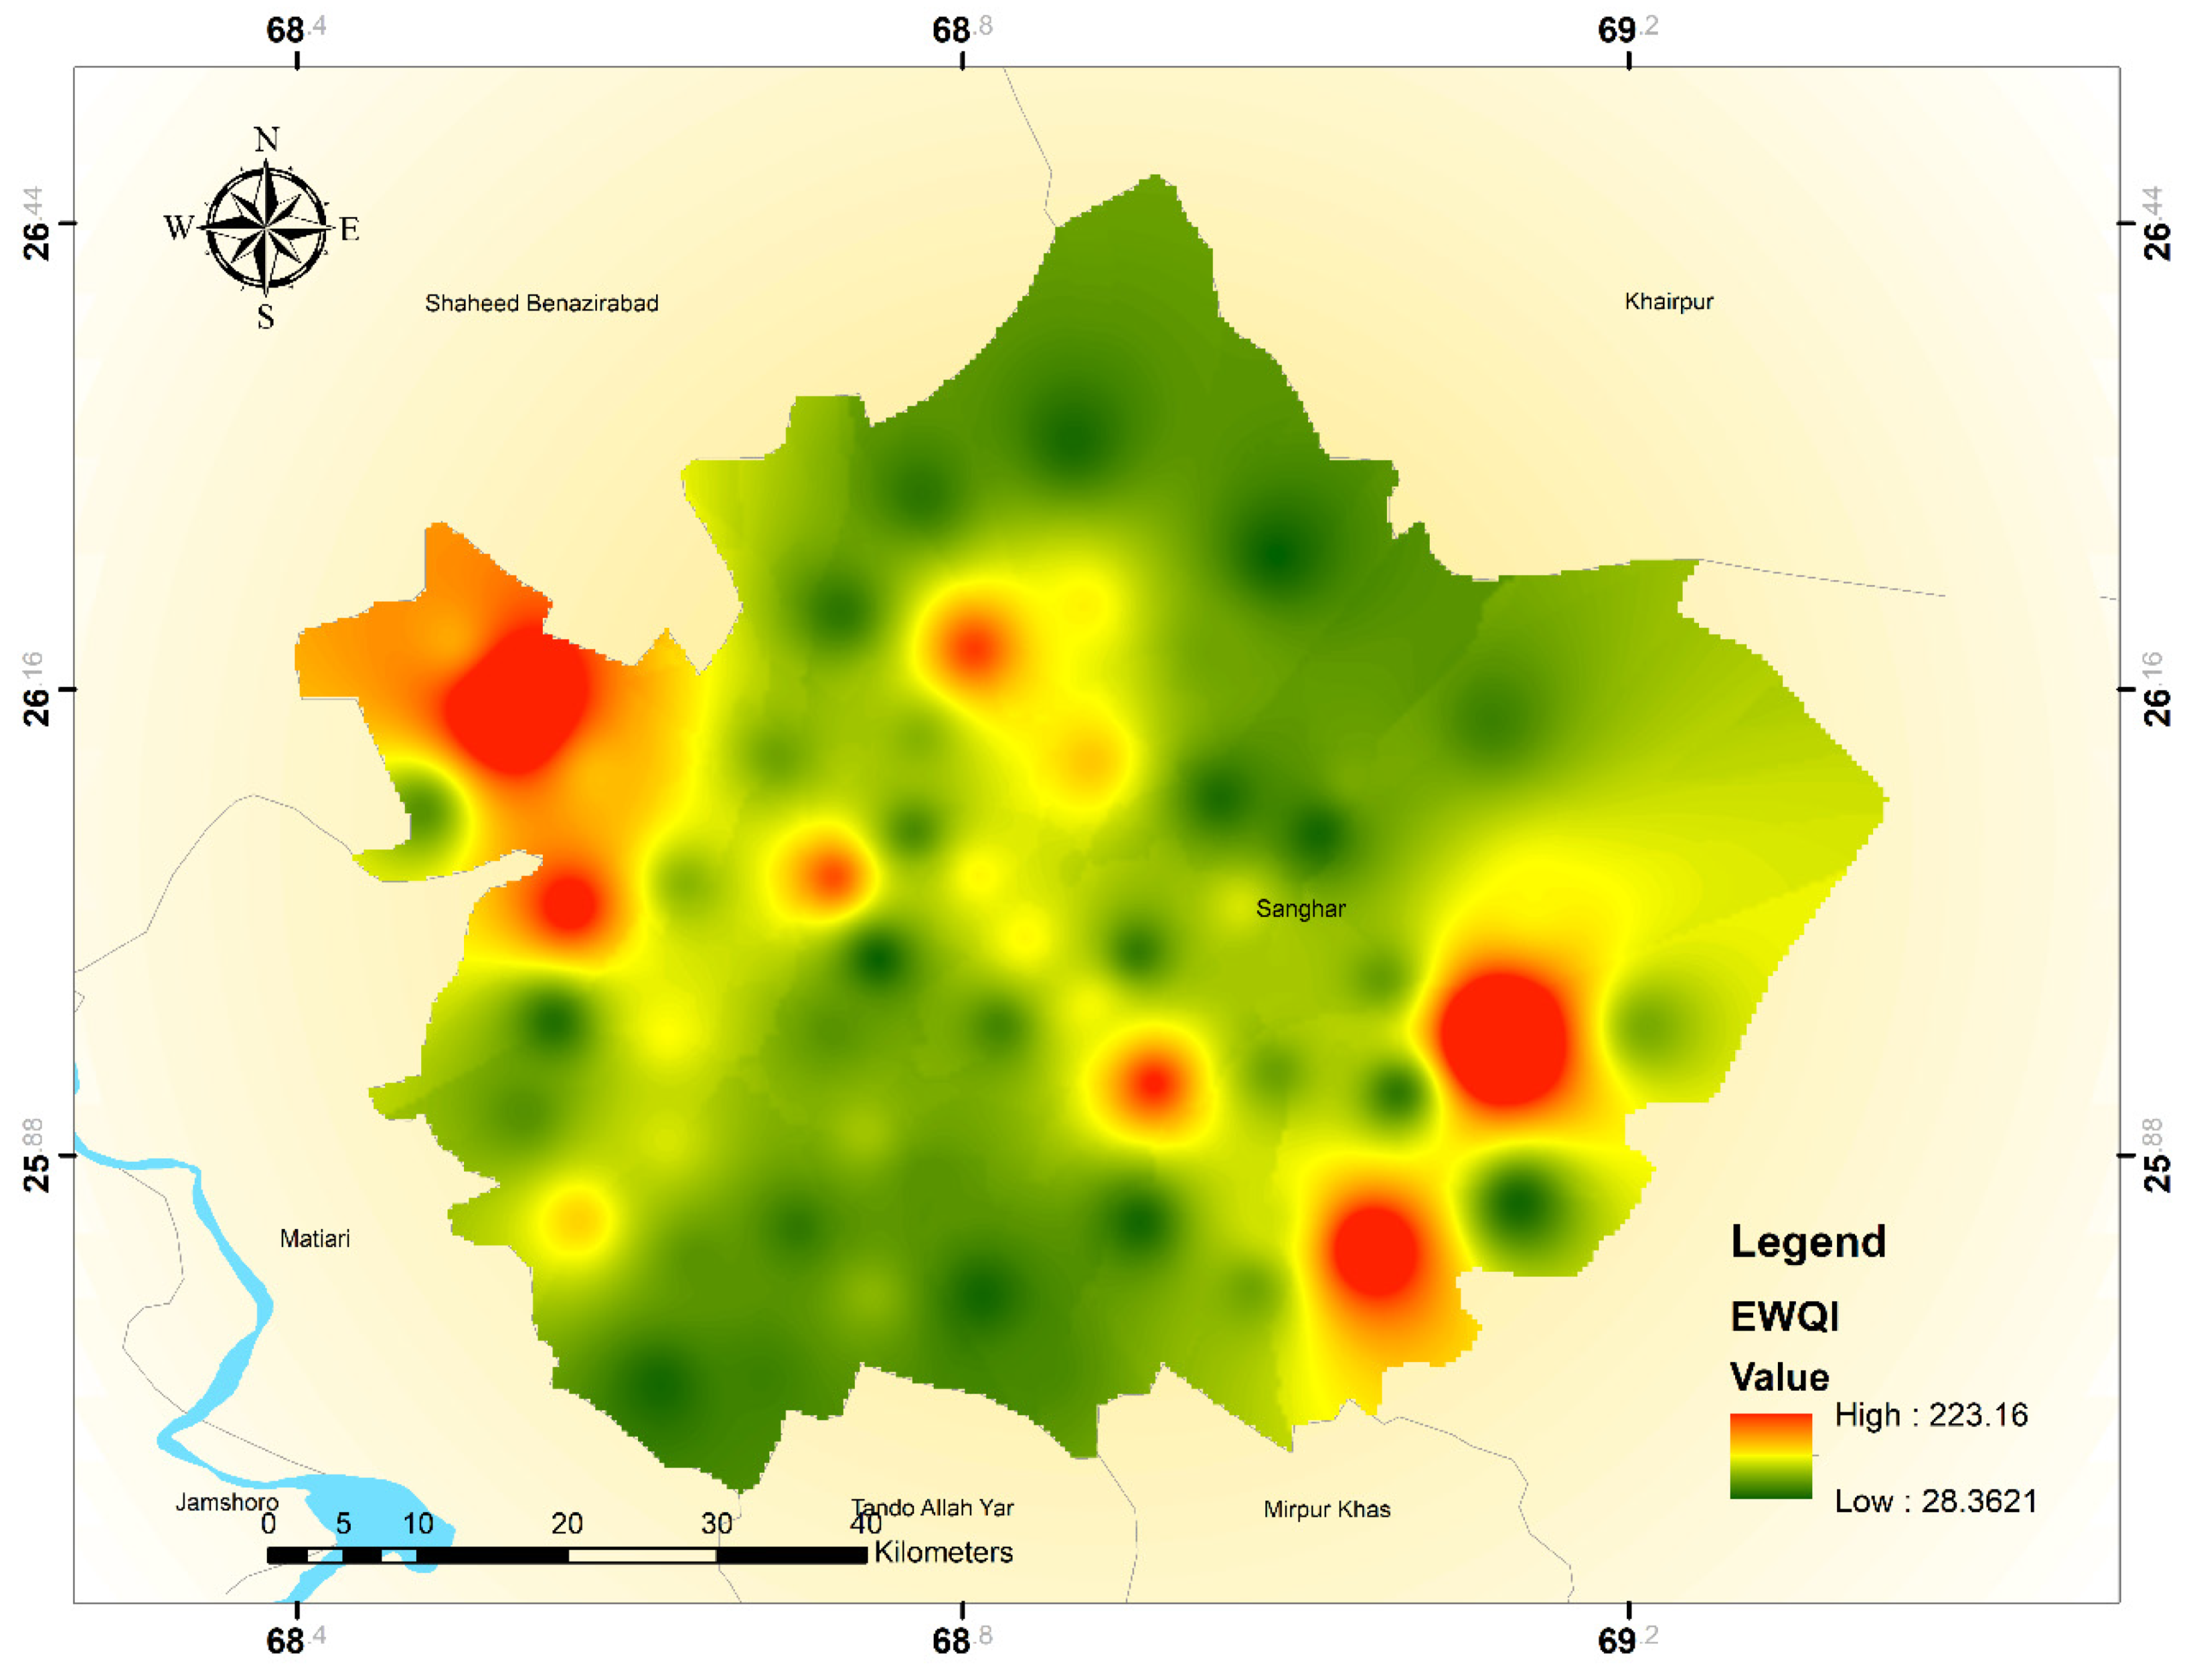
3.8. Groundwater Quality Assessment

The entropy water quality index (EWQI) technique was used to evaluate the excellence of groundwater in the research area. EWQI has been widely used to assess groundwater quality [83].
However, EWQI values are classified into five categories: excellent (<25), good (25–50), medium (50–100), poor (100–150), and extremely poor (>150). According to EWQI, the suitability of groundwater samples is presented in Table 4.
The majority of water samples (n = 32) are considered “good”, with a contribution rate of 54.24%. The samples (n = 20) fell in the “medium” category with a percentage contribution of 33.90%, whereas the samples (n = 17, and n = 11) were classified with 27.86% and 18.03% contribution for “poor” and “extremely poor” categories as shown in Table 4. None of the samples were considered in excellent drinking water class. Overall, most samples showed medium to good water quality levels, indicating that groundwater sources of the studied regions are suitable for drinking purposes except (n = 28) samples in the poor and extremely poor category in district Sanghar. The suitability map of water quality is shown in Figure 8.

4. Conclusions

This study has been conducted for the first time in this area based on several combinations of statistical analysis, graphical techniques, and hydrochemical modeling applied to understand groundwater chemistry, evolution, and suitability for drinking use in the studied region. Statistical analysis shows that the abundance of cations and anions is in a decreasing route, of Na+ > Ca2+ > Mg2+ > K+, and HCO3 > Cl > SO42− > NO3. The richness of Na+ and HCO3 demonstrates that silicate weathering is the dominant factor affecting the main ion chemistry of groundwater in the study area. However, correlation and graphical relation between ions also reveal that ion exchange, rock weathering, and dissolution of carbonate minerals play an essential role in governing groundwater chemistry. Moreover, the Gibbs diagram showed that rock dominance had been identified as a fundamental natural component that controls groundwater evolution. In contrast, a few samples fall into the evaporation dominance zone, suggesting the importance of evaporation in the shallow groundwater depth zone. According to the hydrochemical facies data, the groundwater samples were mixed with an NaCl and CaHCO3 type. A few samples had mixed with CaMgCl type, interpreting the hydrochemical behavior of rock–water interaction.
Moreover, geochemical modeling-derived saturation indices show that the waterlogged phase is under-saturated compared to evaporite, such as gypsum and halite having negative values. In contrast, the excessive stage with carbonates such as calcite and dolomite has positive values. In the current study, 45% of groundwater samples showed As contamination above WHO recommended guideline values. The EWQI results revealed that 17 samples were found in poor and 11 samples in extremely poor quality, with a percentage value of 27.86% and 18.03%. However, no groundwater sample was found in excellent water status for drinking and household motive. The range mentioned above of groundwater samples is influenced by the dissolving process and leaching of rock-salt and gypsum-bearing rock formations.

Author Contributions

Z.U.: Conceptualization, Methodology, Writing original draft, M.A.T.: Methodology, A.R. (Abdur Rashid): Software and validation, J.G.: validation, A.S.: Software and results analysis, M.I.: visualization. A.R. (Abdur Rauf): formal analysis and investigation, S.B.: methodology and formal analysis, Z.M.A.: data curation, Y.N.M.: funding acquisition. All authors have read and agreed to the published version of the manuscript.

Funding

King Khalid University funded this work through a research group project under Grant No. (R.G.P.1/39/42).

Institutional Review Board Statement

Not applicable.

Informed Consent Statement

Not applicable.

Data Availability Statement

The data presented in this study are available in the main text of the article.

Acknowledgments

King Khalid University funded this work through a Research group project under grant number (R.G.P.1/39/42).

Conflicts of Interest

The authors declare that they have no known competing financial interest or personal relationships that could have appeared to influence the work reported in this paper.

References

  1. Singh, R.; Gayen, A.; Kumar, S.; Dewangan, R. Geo-spatial distribution of arsenic contamination of groundwater resources in intricate crystalline aquifer system of Central India: Arsenic toxicity manifestation and health risk assessment. Hum. Ecol. Risk Assess. Int. J. 2021, 27, 1588–1612. [Google Scholar] [CrossRef]
  2. Kobya, M.; Soltani, R.D.C.; Omwene, P.I.; Khataee, A. A review on decontamination of arsenic-contained water by electrocoagulation: Reactor configurations and operating cost along with removal mechanisms. Environ. Technol. Innov. 2020, 17, 100519. [Google Scholar] [CrossRef]
  3. Monteiro De Oliveira, E.C.; Caixeta, E.S.; Santos VS, V.; Pereira, B.B. Arsenic Exposure from Groundwater: Environmental Contamination, Human Health Effects, and Sustainable Solutions. J. Toxicol. Environ. Health 2021, 24, 119–135. [Google Scholar] [CrossRef] [PubMed]
  4. Sathe, S.S.; Goswami, L.; Mahanta, C.; Devi, L.M. Integrated factors controlling arsenic mobilization in an alluvial floodplain. Environ. Technol. Innov. 2020, 17, 100525. [Google Scholar] [CrossRef]
  5. Amir, M.; Asghar, S.; Ahsin, M.; Hussain, S.; Ismail, A.; Riaz, M.; Naz, S. Arsenic exposure through drinking groundwater and consuming wastewater-irrigated vegetables in Multan, Pakistan. Environ. Geochem. Health 2021, 43, 5025–5035. [Google Scholar] [CrossRef] [PubMed]
  6. Masood, N.; Batool, S.; Farooqi, A. Groundwater pollution in Pakistan. In Global Groundwater; Elsevier: Amsterdam, The Netherlands, 2021; pp. 309–322. [Google Scholar]
  7. Rashid, A.; Farooqi, A.; Gao, X.; Zahir, S.; Noor, S.; Khattak, J.A. Geochemical modeling, source apportionment, health risk exposure and control of higher fluoride in groundwater of sub-district Dargai, Pakistan. Chemosphere 2019, 243, 125409. [Google Scholar] [CrossRef]
  8. Soomro, A.; Qureshi, A.L.; Jamali, M.A.; Ashraf, A. Groundwater investigation through vertical electrical sounding at hilly area from Nooriabad toward Karachi. Acta Geophys. 2019, 67, 247–261. [Google Scholar] [CrossRef]
  9. Farooqi, A.; Masuda, H.; Firdous, N. Toxic Fluoride and Arsenic Contaminated Groundwater in the Lahore and Kasur Districts, Punjab, Pakistan and Possible Contaminant Sources. Environ. Pollut. 2007, 145, 839–849. [Google Scholar] [CrossRef]
  10. Udayalaxmi, G.; Himabindu, D.; Ramadass, G. Geochemical Evaluation of Groundwater Quality in Selected Areas of Hyderabad, Ap, India. Indian J. Sci. Technol. 2010, 3, 546–553. [Google Scholar] [CrossRef]
  11. Rashid, A.; Khan, S.; Ayub, M.; Sardar, T.; Jehan, S.; Zahir, S.; Ullah, H. Mapping Human Health Risk from Exposure to Potential Toxic Metal Contamination in Groundwater of Lower Dir, Pakistan: Application of Multivariate and Geographical Information System. Chemosphere 2019, 225, 785–795. [Google Scholar] [CrossRef]
  12. Rashid, A.; Khattak, S.A.; Ali, L.; Zaib, M.; Jehan, S.; Ayub, M.; Ullah, S. Geochemical profile and source identification of surface and groundwater pollution of District Chitral, Northern Pakistan. Microchem. J. 2018, 145, 1058–1065. [Google Scholar] [CrossRef]
  13. Shafiq, W.; Ullah, H.; Zaheer, M.; Mehmood, M.; Farooq, U.; Khan, M.J.; Mashwani, S.A.; Ullah, S. Aquifer Characterization and Physiochemical Analysis of District Dera Ghazi Khan Punjab, Pakistan. Rud. -Geološko-Naft. Zb. (Min. -Geol. -Pet. Bull.) 2021, 36, 47–57. [Google Scholar] [CrossRef]
  14. Nickson, R.T.; McArthur, J.M.; Shrestha, B.; Kyaw-Myint, T.O.; Lowry, D. Arsenic and Other Drinking Water Quality Issues, Muzaffargarh District, Pakistan. Appl. Geochem. 2005, 20, 55–68. [Google Scholar] [CrossRef]
  15. Parvaiz, A.; Khattak, J.A.; Hussain, I.; Masood, N.; Javed, T.; Farooqi, A. Salinity enrichment, sources and its contribution to elevated groundwater arsenic and fluoride levels in Rachna Doab, Punjab Pakistan: Stable isotope (δ2H and δ18O) approach as an evidence. Environ. Pollut. 2020, 268, 115710. [Google Scholar] [CrossRef] [PubMed]
  16. Baig, J.A.; Kazi, T.G.; Arain, M.B.; Afridi, H.I.; Kandhro, G.A.; Sarfraz, R.A.; Jamal, M.K.; Shah, A.Q. Evaluation of arsenic and other physico-chemical parameters of surface and ground water of Jamshoro, Pakistan. J. Hazard. Mater. 2009, 166, 662–669. [Google Scholar] [CrossRef] [PubMed]
  17. Kamble, B.S.; Saxena, P.R.; Kurakalva, R.M.; Shankar, K. Evaluation of seasonal and temporal variations of groundwater quality around Jawaharnagar municipal solid waste dumpsite of Hyderabad city, India. SN Appl. Sci. 2020, 2, 1–22. [Google Scholar] [CrossRef] [Green Version]
  18. Naseem, S.; Rafique, T.; Bashir, E.; Bhanger, M.I.; Laghari, A.; Usmani, T.H. Lithological Influences on Occurrence of High-Fluoride Groundwater in Nagar Parkar Area, Thar Desert, Pakistan. Chemosphere 2010, 78, 1313–1321. [Google Scholar] [CrossRef] [PubMed]
  19. Mushtaq, N.; Masood, N.; Khattak, J.A.; Hussain, I.; Khan, Q.; Farooqi, A. Health risk assessment and source identification of groundwater arsenic contamination using agglomerative hierarchical cluster analysis in selected sites from upper Eastern parts of Punjab province, Pakistan. Hum. Ecol. Risk Assess. Int. J. 2020, 27, 999–1018. [Google Scholar] [CrossRef]
  20. Abeer, N.; Khan, S.A.; Muhammad, S.; Rasool, A.; Ahmad, I. Health risk assessment and provenance of arsenic and heavy metal in drinking water in Islamabad, Pakistan. Environ. Technol. Innov. 2020, 20, 101171. [Google Scholar] [CrossRef]
  21. Lanjwani, M.F.; Khuhawar, M.Y.; Jahangir Khuhawar, T.M.; Lanjwani, A.H.; Soomro, W.A. Evaluation of hydrochemistry of the Dokri groundwater, including historical site Mohenjo-Daro, Sindh, Pakistan. Int. J. Environ. Anal. Chem. 2021, 1–25. [Google Scholar] [CrossRef]
  22. Chandio, T.A.; Khan, M.N.; Muhammad, M.T.; Yalcinkaya, O.; Wasim, A.A.; Kayis, A.F. Fluoride and arsenic contamination in drinking water due to mining activities and its impact on local area population. Environ. Sci. Pollut. Res. 2020, 28, 2355–2368. [Google Scholar] [CrossRef] [PubMed]
  23. Lanjwani, M.F.; Khuhawar, M.Y.; Khuhawar, T.M.J. Groundwater quality assessment of Shahdadkot, Qubo Saeed Khan and Sijawal Junejo Talukas of District Qambar Shahdadkot, Sindh. Appl. Water Sci. 2019, 10, 26. [Google Scholar] [CrossRef] [Green Version]
  24. Gul, M.; Mashhadi, A.F.; Iqbal, Z.; Qureshi, T.I. Monitoring of arsenic in drinking water of high schools and assessment of carcinogenic health risk in Multan, Pakistan. Hum. Ecol. Risk Assess. Int. J. 2019, 26, 2129–2141. [Google Scholar] [CrossRef]
  25. Sodhi, K.K.; Kumar, M.; Agrawal, P.K.; Singh, D.K. Perspectives on Arsenic Toxicity, Carcinogenicity and Its Systemic Remediation Strategies. Environ. Technol. Innov. 2019, 16, 100462. [Google Scholar] [CrossRef]
  26. Rahman, Z.U.; Ahmad, S.; Fidel, R.; Khalid, S.; Ahmad, I.; Humphrey, O.S.; Khan, H.; Khan, B. Faecal and nitrate contamination in the groundwater of Mardan district, Pakistan. Environ. Geochem. Health 2021, 43, 3615–3624. [Google Scholar] [CrossRef] [PubMed]
  27. Natasha; Bibi, I.; Shahid, M.; Niazi, N.K.; Younas, F.; Naqvi, S.R.; Shaheen, S.M.; Imran, M.; Wang, H.; Hussaini, K.M.; et al. Hydrogeochemical and health risk evaluation of arsenic in shallow and deep aquifers along the different floodplains of Punjab, Pakistan. J. Hazard. Mater. 2020, 402, 124074. [Google Scholar] [CrossRef]
  28. Rashid, A.; Ayub, M.; Javed, A.; Khan, S.; Gao, X.; Li, C.; Ullah, Z.; Sardar, T.; Muhammad, J.; Nazneen, S. Potentially harmful metals, and health risk evaluation in groundwater of Mardan, Pakistan: Application of geostatistical approach and geographic information system. Geosci. Front. 2020, 12, 101128. [Google Scholar] [CrossRef]
  29. Chen, X.; Zeng, X.-C.; Kawa, Y.K.; Wu, W.; Zhu, X.; Ullah, Z.; Wang, Y. Microbial reactions and environmental factors affecting the dissolution and release of arsenic in the severely contaminated soils under anaerobic or aerobic conditions. Ecotoxicol. Environ. Saf. 2019, 189, 109946. [Google Scholar] [CrossRef]
  30. Javed, A.; Baig, Z.U.; Farooqi, A. Arsenic contamination of irrigation wells and associated human health hazards in the Punjab plains of Pakistan. Environ. Technol. Innov. 2021, 23, 101678. [Google Scholar] [CrossRef]
  31. Talib, M.A.; Tang, Z.; Shahab, A.; Siddique, J.; Faheem, M.; Fatima, M. Hydrogeochemical Characterization and Suitability Assessment of Groundwater: A Case Study in Central Sindh, Pakistan. Int. J. Environ. Res. Public Health 2019, 16, 886. [Google Scholar] [CrossRef] [PubMed] [Green Version]
  32. Shahab, A.; Qi, S.; Zaheer, M. Arsenic contamination, subsequent water toxicity, and associated public health risks in the lower Indus plain, Sindh province, Pakistan. Environ. Sci. Pollut. Res. 2018, 26, 30642–30662. [Google Scholar] [CrossRef]
  33. Azizullah, A.; Khattak MN, K.; Richter, P.; Häder, D.P. Water Pollution in Pakistan and Its Impact on Public Health—A Review. Environ. Int. 2011, 37, 479–497. [Google Scholar] [CrossRef]
  34. Ashraf, U.; Zhang, H.; Anees, A.; Mangi, H.N.; Ali, M.; Zhang, X.; Imraz, M.; Abbasi, S.S.; Abbas, A.; Ullah, Z.; et al. A Core Logging, Machine Learning and Geostatistical Modeling Interactive Approach for Subsurface Imaging of Lenticular Geobodies in a Clastic Depositional System, SE Pakistan. Nat. Resour. Res. 2021, 30, 2807–2830. [Google Scholar] [CrossRef]
  35. Ashraf, U.; Zhu, P.; Yasin, Q.; Anees, A.; Imraz, M.; Mangi, H.N.; Shakeel, S. Classification of reservoir facies using well log and 3D seismic attributes for prospect evaluation and field development: A case study of Sawan gas field, Pakistan. J. Pet. Sci. Eng. 2018, 175, 338–351. [Google Scholar] [CrossRef]
  36. Memon, A.H.; Ghanghro, A.B.; Jahangir, T.M.; Lund, G.M. Arsenic Contamination in Drinking Water of District Jamshoro, Sindh, Pakistan. Biomed. Lett. 2016, 2, 31–37. [Google Scholar]
  37. Ali, M.; Ma, H.; Pan, H.; Ashraf, U.; Jiang, R. Building a rock physics model for the formation evaluation of the Lower Goru sand reservoir of the Southern Indus Basin in Pakistan. J. Pet. Sci. Eng. 2020, 194, 107461. [Google Scholar] [CrossRef]
  38. Ashraf, U.; Zhang, H.; Anees, A.; Ali, M.; Zhang, X.; Abbasi, S.S.; Mangi, H.N. Controls on Reservoir Heterogeneity of a Shallow-Marine Reservoir in Sawan Gas Field, SE Pakistan: Implications for Reservoir Quality Prediction Using Acoustic Impedance Inversion. Water 2020, 12, 2972. [Google Scholar] [CrossRef]
  39. Jamshidi, A.; Morovati, M.; Mofrad, M.M.G.; Panahandeh, M.; Soleimani, H.; Alamdari, H.A. Water Quality Evaluation and Non-Cariogenic Risk Assessment of Exposure to Nitrate in Groundwater Resources of Kamyaran, Iran: Spatial Distribution, Monte-Carlo Simulation, and Sensitivity Analysis. J. Environ. Health Sci. Eng. 2021, 19, 1–15. [Google Scholar] [CrossRef]
  40. Rehman, F.; Cheema, T.; Azeem, T.; Naseem, A.A.; Khan, I.; Iqbal, N.; Shaheen, A.; Rehman, Q.U. Groundwater quality and potential health risks caused by arsenic (As) in Bhakkar, Pakistan. Environ. Earth Sci. 2020, 79, 1–13. [Google Scholar] [CrossRef]
  41. Gao, Y.; Qian, H.; Ren, W.; Wang, H.; Liu, F.; Yang, F. Hydrogeochemical characterization and quality assessment of groundwater based on integrated-weight water quality index in a concentrated urban area. J. Clean. Prod. 2020, 260, 121006. [Google Scholar] [CrossRef]
  42. Natasha, N.; Shahid, M.; Khalid, S.; Bibi, I.; Naeem, M.A.; Niazi, N.K.; Rinklebe, J. Influence of Biochar on Trace Element Uptake, Toxicity and Detoxification in Plants and Associated Health Risks: A Critical Review. Crit. Rev. Environ. Sci. Technol. 2021, 1–41. [Google Scholar] [CrossRef]
  43. Amiri, V.; Rezaei, M.; Sohrabi, N. Groundwater quality assessment using entropy weighted water quality index (EWQI) in Lenjanat, Iran. Environ. Earth Sci. 2014, 72, 3479–3490. [Google Scholar] [CrossRef]
  44. Gu, X.; Xiao, Y.; Yin, S.; Hao, Q.; Liu, H.; Hao, Z.; Meng, G.; Pei, Q.; Yan, H. Hydrogeochemical Characterization and Quality Assessment of Groundwater in a Long-Term Reclaimed Water Irrigation Area, North China Plain. Water 2018, 10, 1209. [Google Scholar] [CrossRef] [Green Version]
  45. Przydatek, G.; Kanownik, W. Physicochemical indicators of the influence of a lined municipal landfill on groundwater quality: A case study from Poland. Environ. Earth Sci. 2021, 80, 1–14. [Google Scholar] [CrossRef]
  46. Selvakumar, S.; Ramkumar, K.R.; Chandrasekar, N.; Magesh, N.S.; Kaliraj, S. Groundwater quality and its suitability for drinking and irrigational use in the Southern Tiruchirappalli district, Tamil Nadu, India. Appl. Water Sci. 2014, 7, 411–420. [Google Scholar] [CrossRef] [Green Version]
  47. Li, J.; Chen, Q.; Wang, T.; Wang, H.; Ni, J. Hydrochemistry and nutrients determined the distribution of greenhouse gases in saline groundwater. Environ. Pollut. 2021, 286, 117383. [Google Scholar] [CrossRef]
  48. Abbas, M.; Shen, S.L.; Lyu, H.M.; Zhou, A.; Rashid, S. Evaluation of the Hydrochemistry of Groundwater at Jhelum Basin, Punjab, Pakistan. Environ. Earth Sci. 2021, 80, 1–17. [Google Scholar] [CrossRef]
  49. Devi, G.; Goswami, L.; Kushwaha, A.; Sathe, S.S.; Sen, B.; Sarma, H.P. Fluoride distribution and groundwater hydrogeochemistry for drinking, domestic and irrigation in an area interfaced near Brahmaputra floodplain of North-Eastern India. Environ. Nanotechnol. Monit. Manag. 2021, 16, 100500. [Google Scholar] [CrossRef]
  50. Zhang, Y.; Li, X.; Luo, M.; Wei, C.; Huang, X.; Xiao, Y.; Pei, Q. Hydrochemistry and Entropy-Based Groundwater Quality Assessment in the Suining Area, Southwestern China. J. Chem. 2021, 2021, 5591892. [Google Scholar] [CrossRef]
  51. Rashid, A.; Guan, D.-X.; Farooqi, A.; Khan, S.; Zahir, S.; Jehan, S.; Khattak, S.A.; Khan, M.S.; Khan, R. Fluoride prevalence in groundwater around a fluorite mining area in the flood plain of the River Swat, Pakistan. Sci. Total Environ. 2018, 635, 203–215. [Google Scholar] [CrossRef] [PubMed] [Green Version]
  52. Shakoor, M.B.; Niazi, N.K.; Bibi, I.; Rahman, M.M.; Naidu, R.; Dong, Z.; Shahid, M.; Arshad, M. Unraveling Health Risk and Speciation of Arsenic from Groundwater in Rural Areas of Punjab, Pakistan. Int. J. Environ. Res. Public Health 2015, 12, 12371–12390. [Google Scholar] [CrossRef] [PubMed] [Green Version]
  53. Çiner, F.; Sunkari, E.D.; Şenbaş, B.A. Geochemical and Multivariate Statistical Evaluation of Trace Elements in Groundwater of Niğde Municipality, South-Central Turkey: Implications for Arsenic Contamination and Human Health Risks Assessment. Arch. Environ. Contam. Toxicol. 2021, 80, 164–182. [Google Scholar] [CrossRef]
  54. Ghaffari, M.; Chavoshbashi, A.A.; Eslami, A.; Hatami, M.H.; Pourakbar, M.; Hashemi, M. Spatial and temporal variation of groundwater quality around a volcanic mountain in northwest of Iran. Groundw. Sustain. Dev. 2021, 14, 100627. [Google Scholar] [CrossRef]
  55. Das, S.; Nag, S.K. Hydrogeochemical Assessment and Appraisal of Groundwater Quality in Saltora Block, Bankura District, West Bengal, India. Int. J. Energy Water Resour. 2021, 1–22. [Google Scholar] [CrossRef]
  56. Sutradhar, S.; Mondal, P. Groundwater suitability assessment based on water quality index and hydrochemical characterization of Suri Sadar Sub-division, West Bengal. Ecol. Inform. 2021, 64, 101335. [Google Scholar] [CrossRef]
  57. He, S.; Li, P.; Wu, J.; Elumalai, V.; Adimalla, N. Groundwater Quality under Land Use/Land Cover Changes: A Temporal Study from 2005 to 2015 in Xi’an, Northwest China. Hum. Ecol. Risk Assess. Int. J. 2020, 10, 2771–2797. [Google Scholar] [CrossRef]
  58. Singh, K.K.; Tewari, G.; Kumar, S. Evaluation of Groundwater Quality for Suitability of Irrigation Purposes: A Case Study in the Udham Singh Nagar, Uttarakhand. J. Chem. 2020, 2020, 1–15. [Google Scholar] [CrossRef]
  59. Zhang, H.; Cheng, S.; Li, H.; Fu, K.; Xu, Y. Groundwater pollution source identification and apportionment using PMF and PCA-APCA-MLR receptor models in a typical mixed land-use area in Southwestern China. Sci. Total Environ. 2020, 741, 140383. [Google Scholar] [CrossRef]
  60. Abdelaziz, S.; Gad, M.I.; El Tahan, A.H.M. Groundwater quality index based on PCA: Wadi El-Natrun, Egypt. J. Afr. Earth Sci. 2020, 172, 103964. [Google Scholar] [CrossRef]
  61. Liu, T.; Gao, X.; Zhang, X.; Li, C. Distribution and assessment of hydrogeochemical processes of F-rich groundwater using PCA model: A case study in the Yuncheng Basin, China. Acta Geochim. 2019, 39, 216–225. [Google Scholar] [CrossRef]
  62. Ali, L.; Rashid, A.; Khattak, S.A.; Zeb, M.; Jehan, S. Geochemical control of potential toxic elements (PTEs), associated risk exposure and source apportionment of agricultural soil in Southern Chitral, Pakistan. Microchem. J. 2019, 147, 516–523. [Google Scholar] [CrossRef]
  63. Li, C.; Sanchez, G.M.; Wu, Z.; Cheng, J.; Zhang, S.; Wang, Q.; Li, F.; Sun, G.; Meentemeyer, R.K.; Li, C.; et al. Spatiotemporal patterns and drivers of soil contamination with heavy metals during an intensive urbanization period (1989–2018) in southern China. Environ. Pollut. 2020, 260, 114075. [Google Scholar] [CrossRef] [PubMed]
  64. Kaur, L.; Rishi, M.S.; Siddiqui, A. Deterministic and probabilistic health risk assessment techniques to evaluate non-carcinogenic human health risk (NHHR) due to fluoride and nitrate in groundwater of Panipat, Haryana, India. Environ. Pollut. 2019, 259, 113711. [Google Scholar] [CrossRef] [PubMed]
  65. Rajput, H.; Goyal, R.; Brighu, U. Modification and optimization of DRASTIC model for groundwater vulnerability and contamination risk assessment for Bhiwadi region of Rajasthan, India. Environ. Earth Sci. 2020, 79, 1–15. [Google Scholar] [CrossRef]
  66. Joshi, N.; Rahaman, M.M.; Thakur, B.; Shrestha, A.; Kalra, A.; Gupta, R. Assessing the Effects of Climate Variability on Groundwater in Northern India. In World Environmental and Water Resources Congress 2020: Groundwater, Sustainability, Hydro-Climate/Climate Change, and Environmental Engineering; American Society of Civil Engineers: Reston, VA, USA, 2020; pp. 41–52. [Google Scholar]
  67. Ali, L.; Rashid, A.; Khattak, S.A.; Gao, X.; Jehan, S.; Javed, A. Geochemical modeling, fate distribution, and risk exposure of potentially toxic metals in the surface sediment of the Shyok suture zone, northern Pakistan. Int. J. Sediment Res. 2021, 36, 656–667. [Google Scholar] [CrossRef]
  68. Onodera, S.I.; Kimbi, S.B.; Nozaki, S.; Tomozawa, Y.; Wang, K.; Rusydi, A.F.; Saito, M. Impact of Citrus Agriculture on the Quality of Water Resource in a Small Steep Island, Seto Inland Sea, Japan. GEOMATE J. 2021, 20, 109–114. [Google Scholar]
  69. Gibbs, R.J. Mechanisms Controlling World Water Chemistry. Science 1970, 170, 1088–1090. [Google Scholar] [CrossRef] [PubMed]
  70. Haji, M.; Karuppannan, S.; Qin, D.; Shube, H.; Kawo, N.S. Potential human health risks due to groundwater fluoride contamination: A case study using multi-techniques approaches (GWQI, FPI, GIS, HHRA) in Bilate River Basin of Southern Main Ethiopian Rift, Ethiopia. Arch. Environ. Contam. Toxicol. 2021, 80, 277–293. [Google Scholar] [CrossRef]
  71. Marandi, A.; Shand, P. Groundwater chemistry and the Gibbs Diagram. Appl. Geochem. 2018, 97, 209–212. [Google Scholar] [CrossRef]
  72. Balamurugan, P.; Kumar, P.; Shankar, K.; Nagavinothini, R.; Vijayasurya, K. Non-Carcinogenic Risk Assessment of Groundwater in Southern Part of Salem District in Tamilnadu, India. J. Chil. Chem. Soc. 2020, 65, 4697–4707. [Google Scholar] [CrossRef]
  73. Srivastava, A.K.; Parimal, P.S. Source rock weathering and groundwater suitability for irrigation in Purna alluvial basin, Maharashtra, central India. J. Earth Syst. Sci. 2020, 129, 1–18. [Google Scholar] [CrossRef]
  74. Khan, F.; Krishnaraj, S.; Raja, P.; Selvaraj, G.; Cheelil, R. Impact of hydrogeochemical processes and its evolution in controlling groundwater chemistry along the east coast of Tamil Nadu and Puducherry, India. Environ. Sci. Pollut. Res. 2020, 28, 18567–18588. [Google Scholar] [CrossRef]
  75. Karunanidhi, D.; Aravinthasamy, P.; Deepali, M.; Subramani, T.; Roy, P.D. The effects of geochemical processes on groundwater chemistry and the health risks associated with fluoride intake in a semi-arid region of South India. RSC Adv. 2020, 10, 4840–4859. [Google Scholar] [CrossRef] [Green Version]
  76. Vinnarasi, F.; Srinivasamoorthy, K.; Saravanan, K.; Gopinath, S.; Prakash, R.; Ponnumani, G.; Babu, C. Chemical weathering and atmospheric carbon dioxide (CO2) consumption in Shanmuganadhi, South India: Evidences from groundwater geochemistry. Environ. Geochem. Health 2020, 43, 771–790. [Google Scholar] [CrossRef] [PubMed]
  77. Madhav, S.; Raju, N.J.; Ahamad, A. A study of hydrogeochemical processes using integrated geochemical and multivariate statistical methods and health risk assessment of groundwater in Trans-Varuna region, Uttar Pradesh. Environ. Dev. Sustain. 2020, 23, 7480–7508. [Google Scholar] [CrossRef]
  78. Kaleem, M.; Naseem, S.; Bashir, E.; Shahab, B.; Rafique, T. Discrete geochemical behavior of Sr and Ba in the groundwater of Southern Mor Range, Balochistan, a tracer for igneous and sedimentary rocks weathering and related environmental issues. Appl. Geochem. 2021, 130, 104996. [Google Scholar] [CrossRef]
  79. Brahman, K.D.; Kazi, T.G.; Afridi, H.I.; Naseem, S.; Arain, S.S.; Ullah, N. Evaluation of high levels of fluoride, arsenic species and other physicochemical parameters in underground water of two sub districts of Tharparkar, Pakistan: A multivariate study. Water Res. 2013, 47, 1005–1020. [Google Scholar] [CrossRef]
  80. Sunkari, E.D.; Abu, M.; Zango, M.S. Geochemical evolution and tracing of groundwater salinization using different ionic ratios, multivariate statistical and geochemical modeling approaches in a typical semi-arid basin. J. Contam. Hydrol. 2021, 236, 103742. [Google Scholar] [CrossRef] [PubMed]
  81. Zhang, J.; Zhou, J.; Zhou, Y.; Zeng, Y.; Ji, Y.; Sun, Y.; Lei, M. Hydrogeochemical characteristics and groundwater quality assessment in the plain area of Yarkant River Basin in Xinjiang, P.R. China. Environ. Sci. Pollut. Res. 2021, 1–13. [Google Scholar] [CrossRef] [PubMed]
  82. Bari, J.A.; Vennila, G.; Karthikeyan, P. Appraisal of hydrogeochemical processes and groundwater quality in Bhavani taluk Erode district, Tamil Nadu, India. Arab. J. Geosci. 2021, 14, 1–20. [Google Scholar] [CrossRef]
  83. Adimalla, N. Application of the Entropy Weighted Water Quality Index (EWQI) and the Pollution Index of Groundwater (PIG) to Assess Groundwater Quality for Drinking Purposes: A Case Study in a Rural Area of Telangana State, India. Arch. Environ. Contam. Toxicol. 2021, 80, 31–40. [Google Scholar] [CrossRef] [PubMed]
Figure 1. Groundwater sampling points and geological settings represent different formations in the study area.
Water 13 03477 g001
Figure 2. Piper diagram shows the category of water type in the study area.
Water 13 03477 g002
Figure 3. Groundwater chemistry of major ions versus Log TDS. The data plotted as: (a) Na+/Na+ + Ca2+ mg/L versus Log TDS, and (b) Cl/Cl + HCO3 mg/L verses Log TDS.
Water 13 03477 g003
Figure 4. Relationship of ions in meq/L viz. (a) Na+ versus Cl, (b) Na+ versus Total cations, (c) Ca2+ + Mg2+ versus HCO3 + SO42− to represent carbonate dissolution and silicate weathering, (d) Ca2+ + Mg2+ versus HCO3, respectively.
Water 13 03477 g004
Figure 5. (a) Relationships of HCO3/Na+ versus Ca2+/Na+, (b) Mg2+/Na+ versus Ca2+/Na+ represent silicate weathering, carbonate weathering, and evaporite dissolution in the study area.
Water 13 03477 g005
Figure 6. Saturation indices (a) Calcite against TDS, (b) Dolomite against TDS, (c) Gypsum against TDS, and (d) Halite against TDS, respectively, in the study area.
Water 13 03477 g006
Figure 7. Plots showing (a) CAI-1 versus CAI-2; (b) (Ca2+ + Mg2+) − (HCO3 + SO42−) versus (Na+ +K+) − Cl.
Water 13 03477 g007
Figure 8. Suitability assessment map of EWQI showing high and low regions in the study area.
Water 13 03477 g008
Table 1. Statistical analysis of physicochemical parameters in the groundwater sources of the Study area.
ParametersECpHTDSTHNa+K+Ca2+Mg2+HCO3ClSO42−NO3As
Mean12007.667393161252.816141.42331581370.9712.9
Median8567.65032508224631200110610.210
SD10290.446642441304.4447.431.51211701653.575.51
Minimum3056.81953020118139020200.105
Maximum55708.7356413506763524618259085010242725
WHO limit10006.6–8.510003020012200150-2502501010
Note: All parameters are represented in mg/L except EC, and As their unit is µs/cm and µg/L.
Table 2. Principal component analysis of groundwater quality parameters.
ParametersF1F2F3F4
EC0.990.01−0.05−0.08
pH0.360.800.020.31
TDS0.90−0.13−0.03−0.14
TH0.93−0.150.060.06
Na+0.940.09−0.10−0.16
K+0.370.040.910.06
Ca2+0.96−0.060.08−0.01
Mg2+0.97−0.14−0.050.04
HCO30.910.00−0.04−0.08
Cl0.98−0.07−0.080.01
SO42−0.940.10−0.01−0.20
NO30.54−0.55−0.120.60
As0.420.78−0.150.14
Eigenvalues8.881.681.120.98
Variability %68.3312.927.084.54
Cumulative %68.3381.2588.3492.88
Table 3. Correlation coefficient among groundwater quality parameters.
pHECTDSTHNa+K+Ca2+Mg2+HCO3ClSO42−
pH1.000
EC 0.335 1.000
TDS 0.190 0.8941.000
TH 0.251 0.9040.8201.000
Na+ 0.364 0.9740.8550.8171.000
K+ 0.182 0.319 0.2920.3790.2641.000
Ca2+ 0.302 0.9480.8780.9200.8620.4201.000
Mg2+ 0.252 0.9600.8670.9500.8820.3020.9531.000
HCO3 0.299 0.9210.7790.8110.8910.3000.8890.8851.000
Cl 0.287 0.9880.8960.9110.9510.2970.9470.9640.8941.000
SO42− 0.389 0.9550.8700.8550.9500.3270.8810.8950.7970.9211.000
Values in bold are different from 0 with a significance level alpha = 0.05.
Table 4. Classification of groundwater quality according to the entropy water quality index (EWQI).
EWQIRankQualityNo. of Samples%
<251Excellent00.00
25–502Good1321.31
50–1003Medium2032.78
100–1504Poor1727.86
>1505Extremely poor1118.03
Publisher’s Note: MDPI stays neutral with regard to jurisdictional claims in published maps and institutional affiliations.

