Article

Dynamics of Mid-Channel Bar during Different Impoundment Periods of the Three Gorges Reservoir Area in China

1
Chongqing Institute of Green and Intelligent Technology, Chinese Academy of Sciences, Chongqing 400714, China
2
Key Laboratory of Reservoir Aquatic Environment, Chinese Academy of Sciences, Chongqing 400714, China
3
School of Architecture and Urban Planning, Chongqing Jiaotong University, Chongqing 400074, China
4
Institute of Agricultural Resources and Environment, Tibet Academy of Agricultural and Animal, Husbandry Science, Lhasa 850000, China
*
Author to whom correspondence should be addressed.
Water 2021, 13(23), 3427; https://doi.org/10.3390/w13233427
Submission received: 2 November 2021 / Revised: 20 November 2021 / Accepted: 1 December 2021 / Published: 3 December 2021

Abstract

:
The dynamics of the mid-channel bars (MCBs) in the Three Gorges Reservoir (TGR) were substantially impacted by the large water-level changes due to the impoundments of the TGR. However, it is still not clear how the morphology of the MCBs changed under the influence of water level and hydrological regime changes induced by the impoundments and operation of the TGR. In this work, the MCBs in the TGR were retrieved using Landsat remote sensing images from 1989 to 2019, and the spatio-temporal variations in the number, area, morphology and location of the MCBs during different impoundment periods were investigated. The results showed that the number and area of MCBs changed dramatically with water-level changes, and the changes were dominated by MCBs with an area less than 0.03 km2 and larger than 1 km2. The area of MCBs decreased progressively with the rising water level, and the number generally showed a decreasing trend, with the minimum number occurring at the third stage when the water level reached 139 m, resulting in the maximum average area at this period. The ratio of length to width of the MCBs generally decreased with the changes in hydrological and sediment regimes, leading to a shape adjustment from narrow–long to relatively short–round with the rising of the water level. The water impoundments of the TGR led to the migration of the dominant area from the upper section to the middle section of the TGR and resulted in a more even distribution of MCBs in the TGR. The results improve our understanding of the mechanisms of the development of MCBs in the TGR under the influence of water impoundment coupled with the annually cyclic hydrological regime and longer periods of inundation and exposure.

1. Introduction

The mid-channel bar (MCB) is formed by favorable hydrological conditions in the river. It is a stable island above the river’s water level, formed by the gradual development and shaping of the river siltation over a long period [1,2]. The development of MCB is influenced by exogenous materials such as sediment, the transport capacity of flowing water and the sediment concentration, as well as by dam construction and reservoir regulations [3,4,5,6]. The dynamics of MCBs were significantly impacted by the water-level changes due to the impoundment of the TGR. [7,8]. On the one hand, some original MCBs in the Yangtze River were submerged, while some new MCBs were formed from the inundation of low-lying lands and point bars by the reservoir, due to the rising of the water level [9,10]. On the other hand, some MCBs were periodically exposed and submerged due to the annually cyclic hydrological regime induced by the TGR operation. Therefore, the morphology of the MCBs in the TGR changed significantly under the influence of these hydrological regime changes, which are expected to have an important impact on channel stability, water–land interactions and biological diversity [11,12,13].
Over the past century, great efforts have been made to investigate the formation and development processes of MCBs in bifurcated channel stretches, using field observations [14], remote sensing [5], theoretical generalized models and mathematical models [15,16,17]. Many experiments have also been conducted to explore the morphological dynamics of MCBs [18,19,20]. However, most of the studies are based on ideal environmental conditions, including constant flow, slope, etc. Furthermore, many other environmental factors affecting the development of MCBs were not considered [21,22]. In recent years, the rapid development of numerical simulation technology, remote sensing and spatial analysis in geographic information science has provided an opportunity to monitor and model the dynamics of MCBs at multi-spatial and multi-temporal scales [23,24]. Schuurman et al. [15] generated datasets of water depth, flow and sediment transport of MCBs based on physical models, and further developed a conceptual network model describing the interactions of MCBs, sub-branches and river channels. Liu et al. [25] investigated the proportion of riverine sand partitioning when MCBs reached their stable equilibrium form, using an analytical hydrodynamics method. Rasbold et al. [26] identified the development signatures of MCBs based on the theory of sedimentology. Adami et al. [22] used wavelength, migration rate and height to investigate the spatio-temporal variations of the morphological dynamics of the MCBs in the Alpine Rhine over the last 30 years.
As the longest river in China, the Yangtze River has an important strategic position and a role in boosting the development of the cities along its length [27]. The morphological development of MCBs in the Yangtze River is of great significance in maintaining the stability of the river and enhancing the function of the “golden channel” [28]. However, the construction of the Three Gorges Dam (TGD) has significantly changed the hydrological and sediment regimes downstream of the TGD over the last 30 years, altering the hydrological conditions for the development of the MCBs [28,29,30]. Based on long-term observations, multi-temporal remote sensing data and model simulations, many studies have been conducted to monitor the changes in the MCBs in the middle and lower reaches of the Yangtze River [31,32]. The results showed significant morphological changes in the MCBs after the TGD operation [5,33], and revealed the process [28] and mechanism for the development of MCBs [33] downstream of the TGD. In contrast, under the influence of the annually cyclic hydrological regime and of longer inundation and exposure periods induced by the TGR operation, the morphological development process of MCBs in the TGR and their response to hydrological and sediment regime changes differs greatly from those downstream of the TGD [34]. However, due to the lack of relevant studies, it is still not clear how the morphology of the MCBs changes under the influence of water level and hydrological regime changes induced by the impoundments and operation of the TGR.
Therefore, this study was carried out to fill the knowledge gap. The main objectives of this study were to: (1) retrieve the MCBs from Landsat images and construct datasets of morphological changes of MCBs in the TGR; (2) investigate the spatio-temporal variations in the numbers, areas, morphology and locations of the MCBs during different impoundment periods. The study helps to reveal the mechanisms for the development of MCBs in the TGR; it also offers a scientific basis for the planning, optimal utilization and ecological restoration of the MCBs in the TGR.

2. Materials and Methods
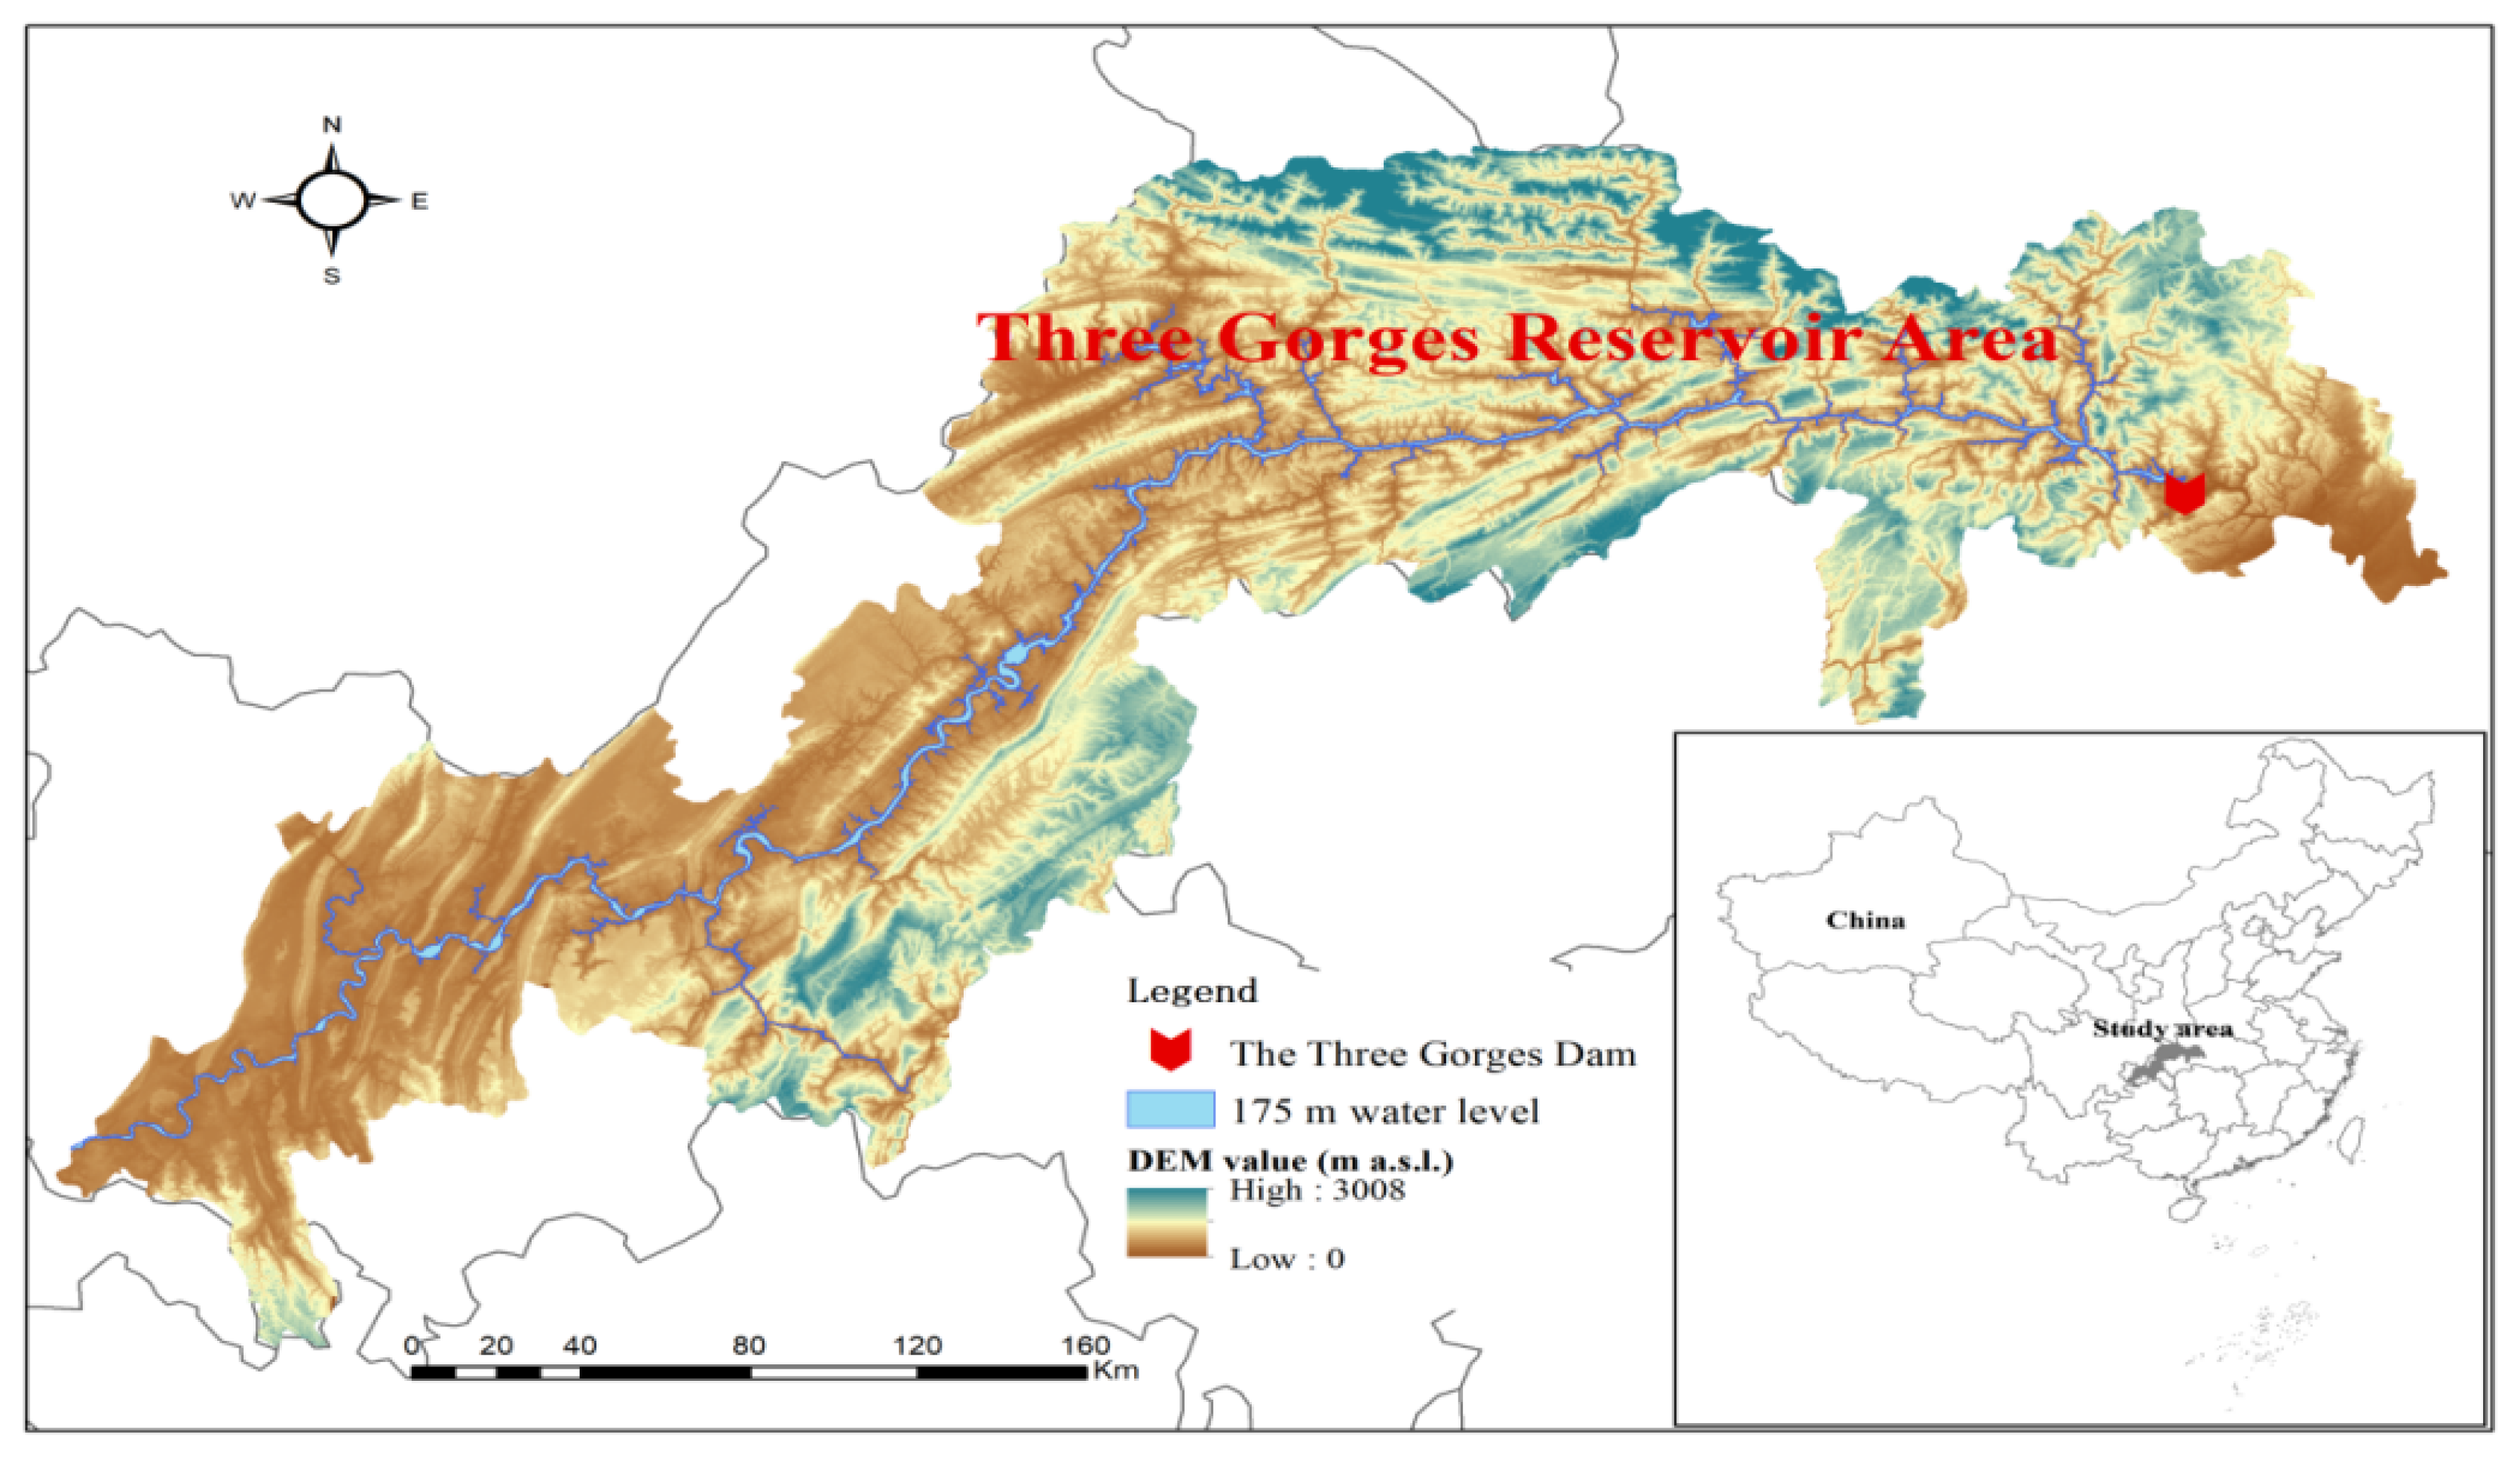
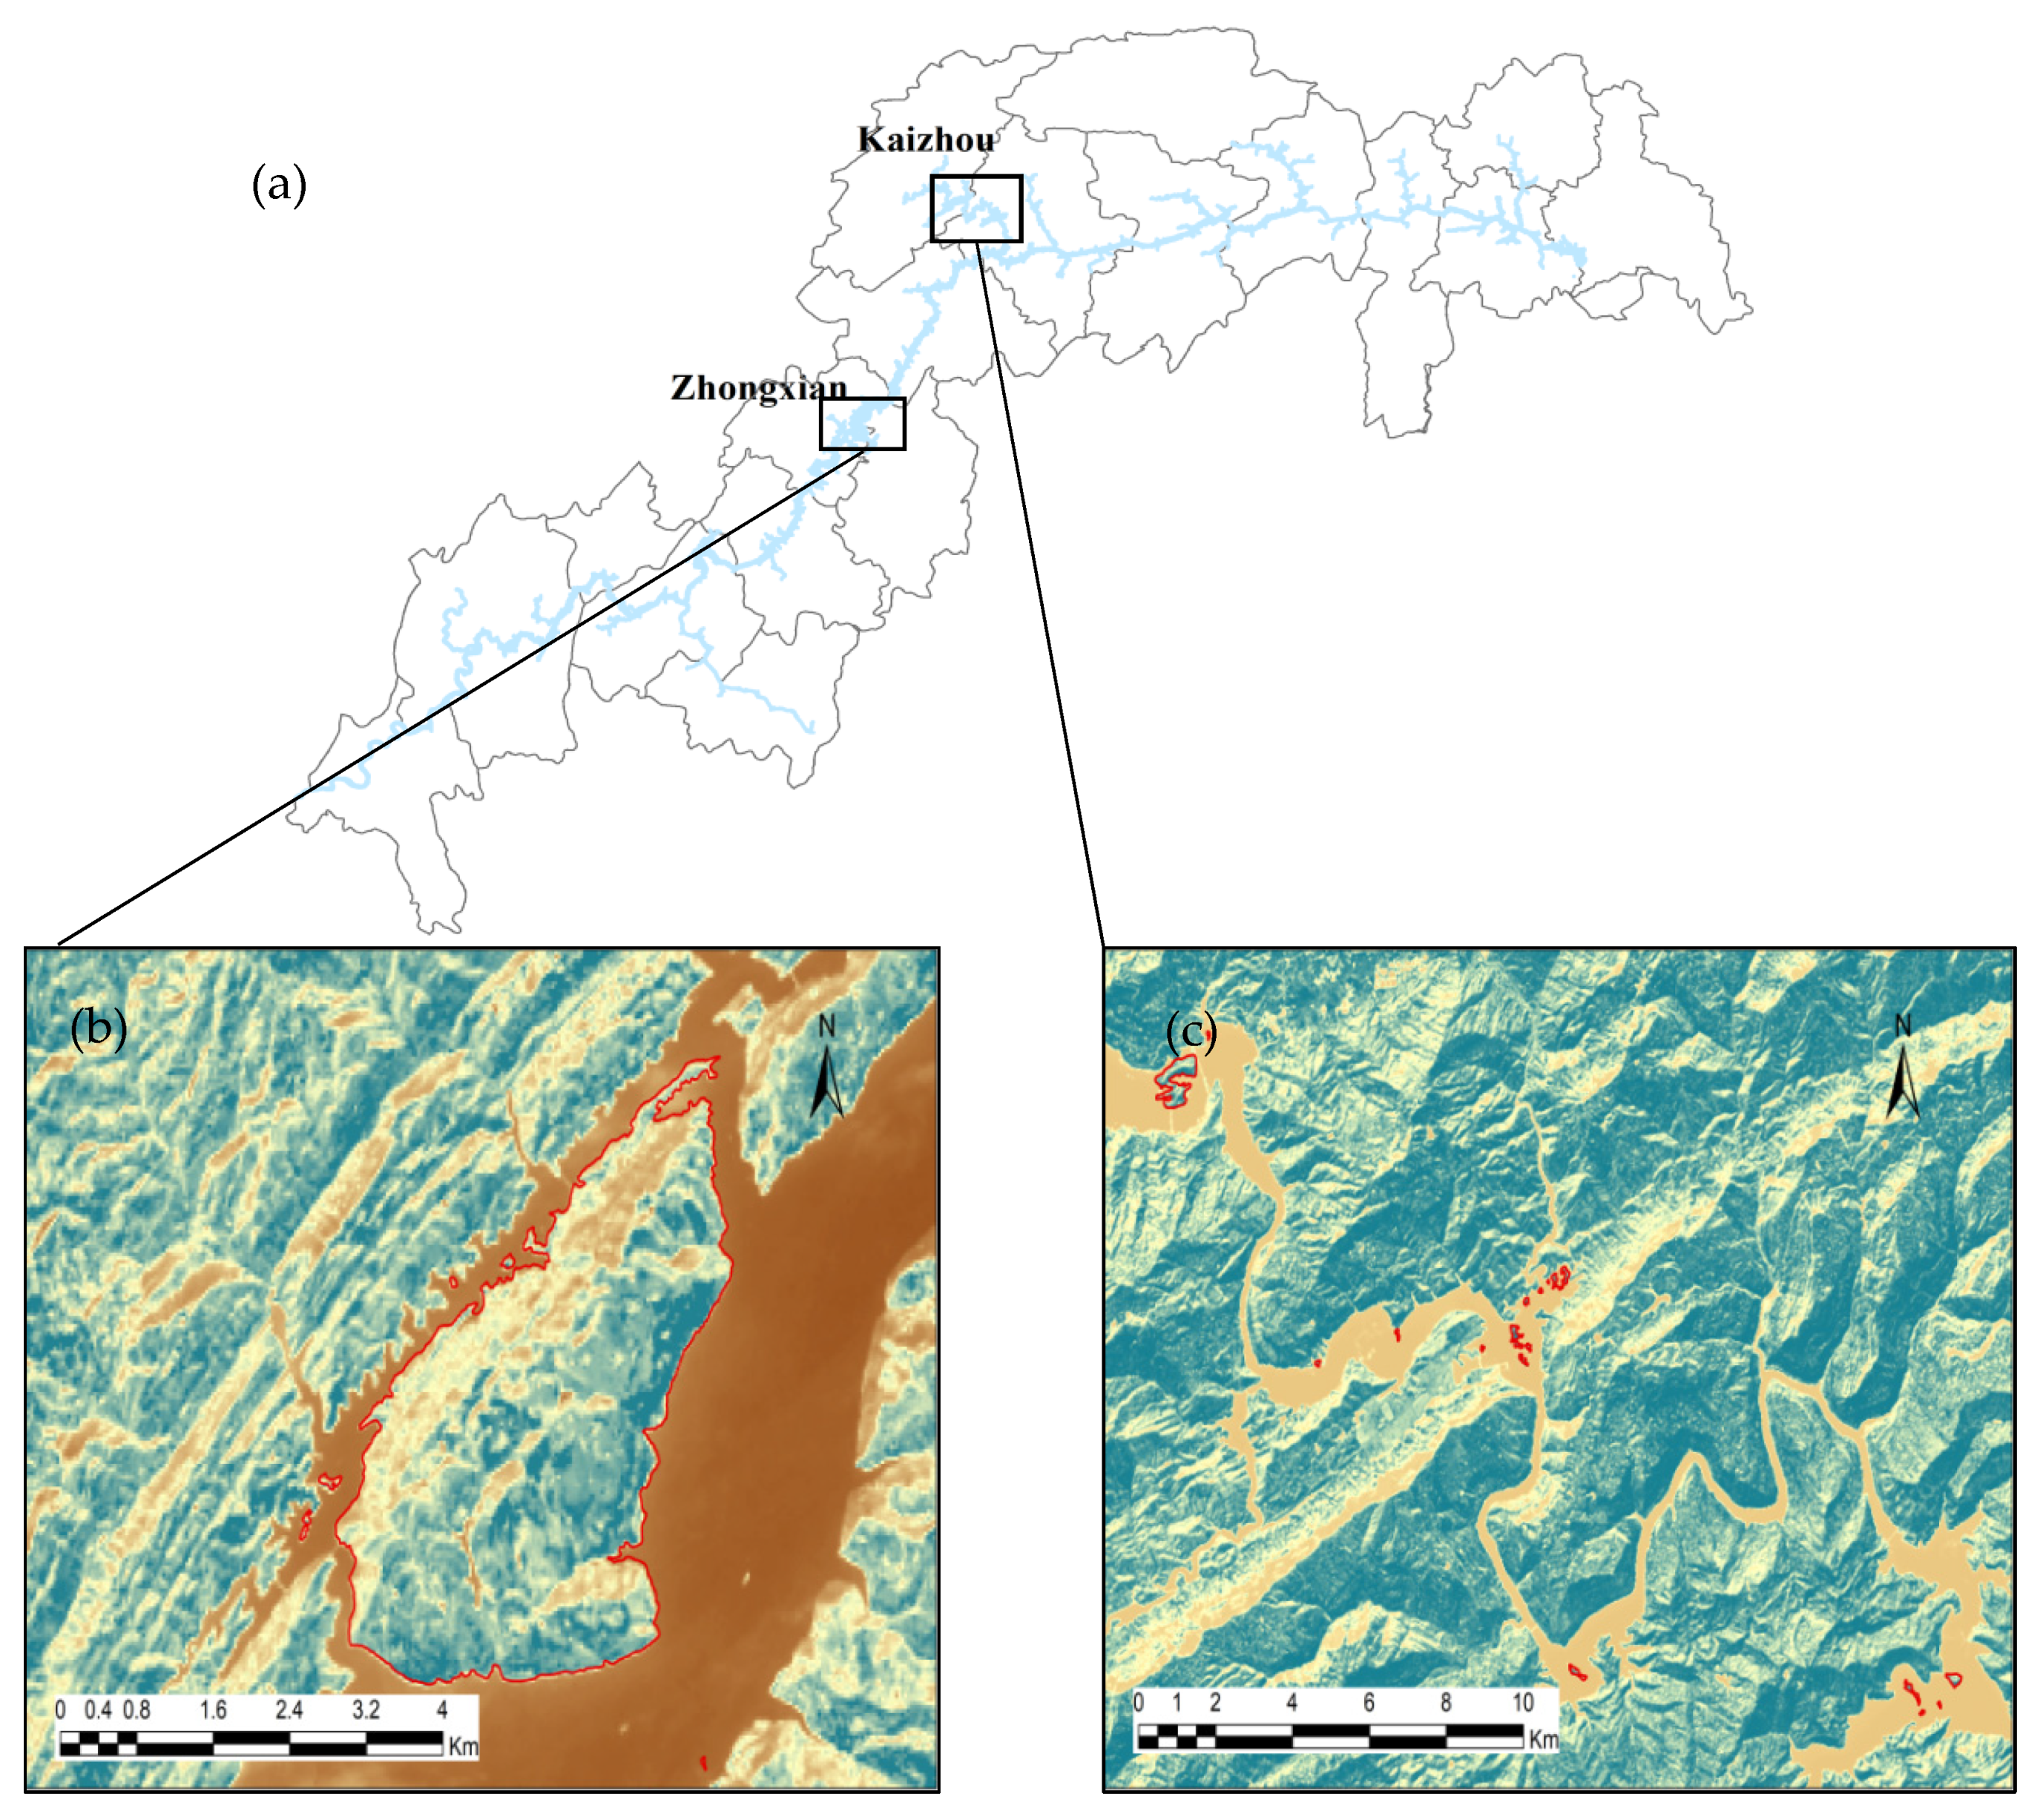
2.1. Study Area

The Three Gorges Reservoir (TGR) is located in the lower section of the main waterway in the upper reaches of the Yangtze River, which is a typical mountainous river. It extends from Jiangjin District in Chongqing to Yichang City in Hubei Province, from west to east (Figure 1). The topography of the Three Gorges Reservoir Area (TGRA) is dominated by mountains and hills. The TGRA has a subtropical monsoon climate with an average annual temperature of 17–19° and annual precipitation of 1000–1800 mm [35]. After the official operation of the TGR, it formed a narrow-valley reservoir with a total length of 660 km and a surface area of 1084 km2. The geographical location of the TGR is between 28°56′ and 31°44′ east (longitude) and between 106°16′ and 111°28′ north (latitude), which includes 25 districts and counties in Hubei and Chongqing municipalities.

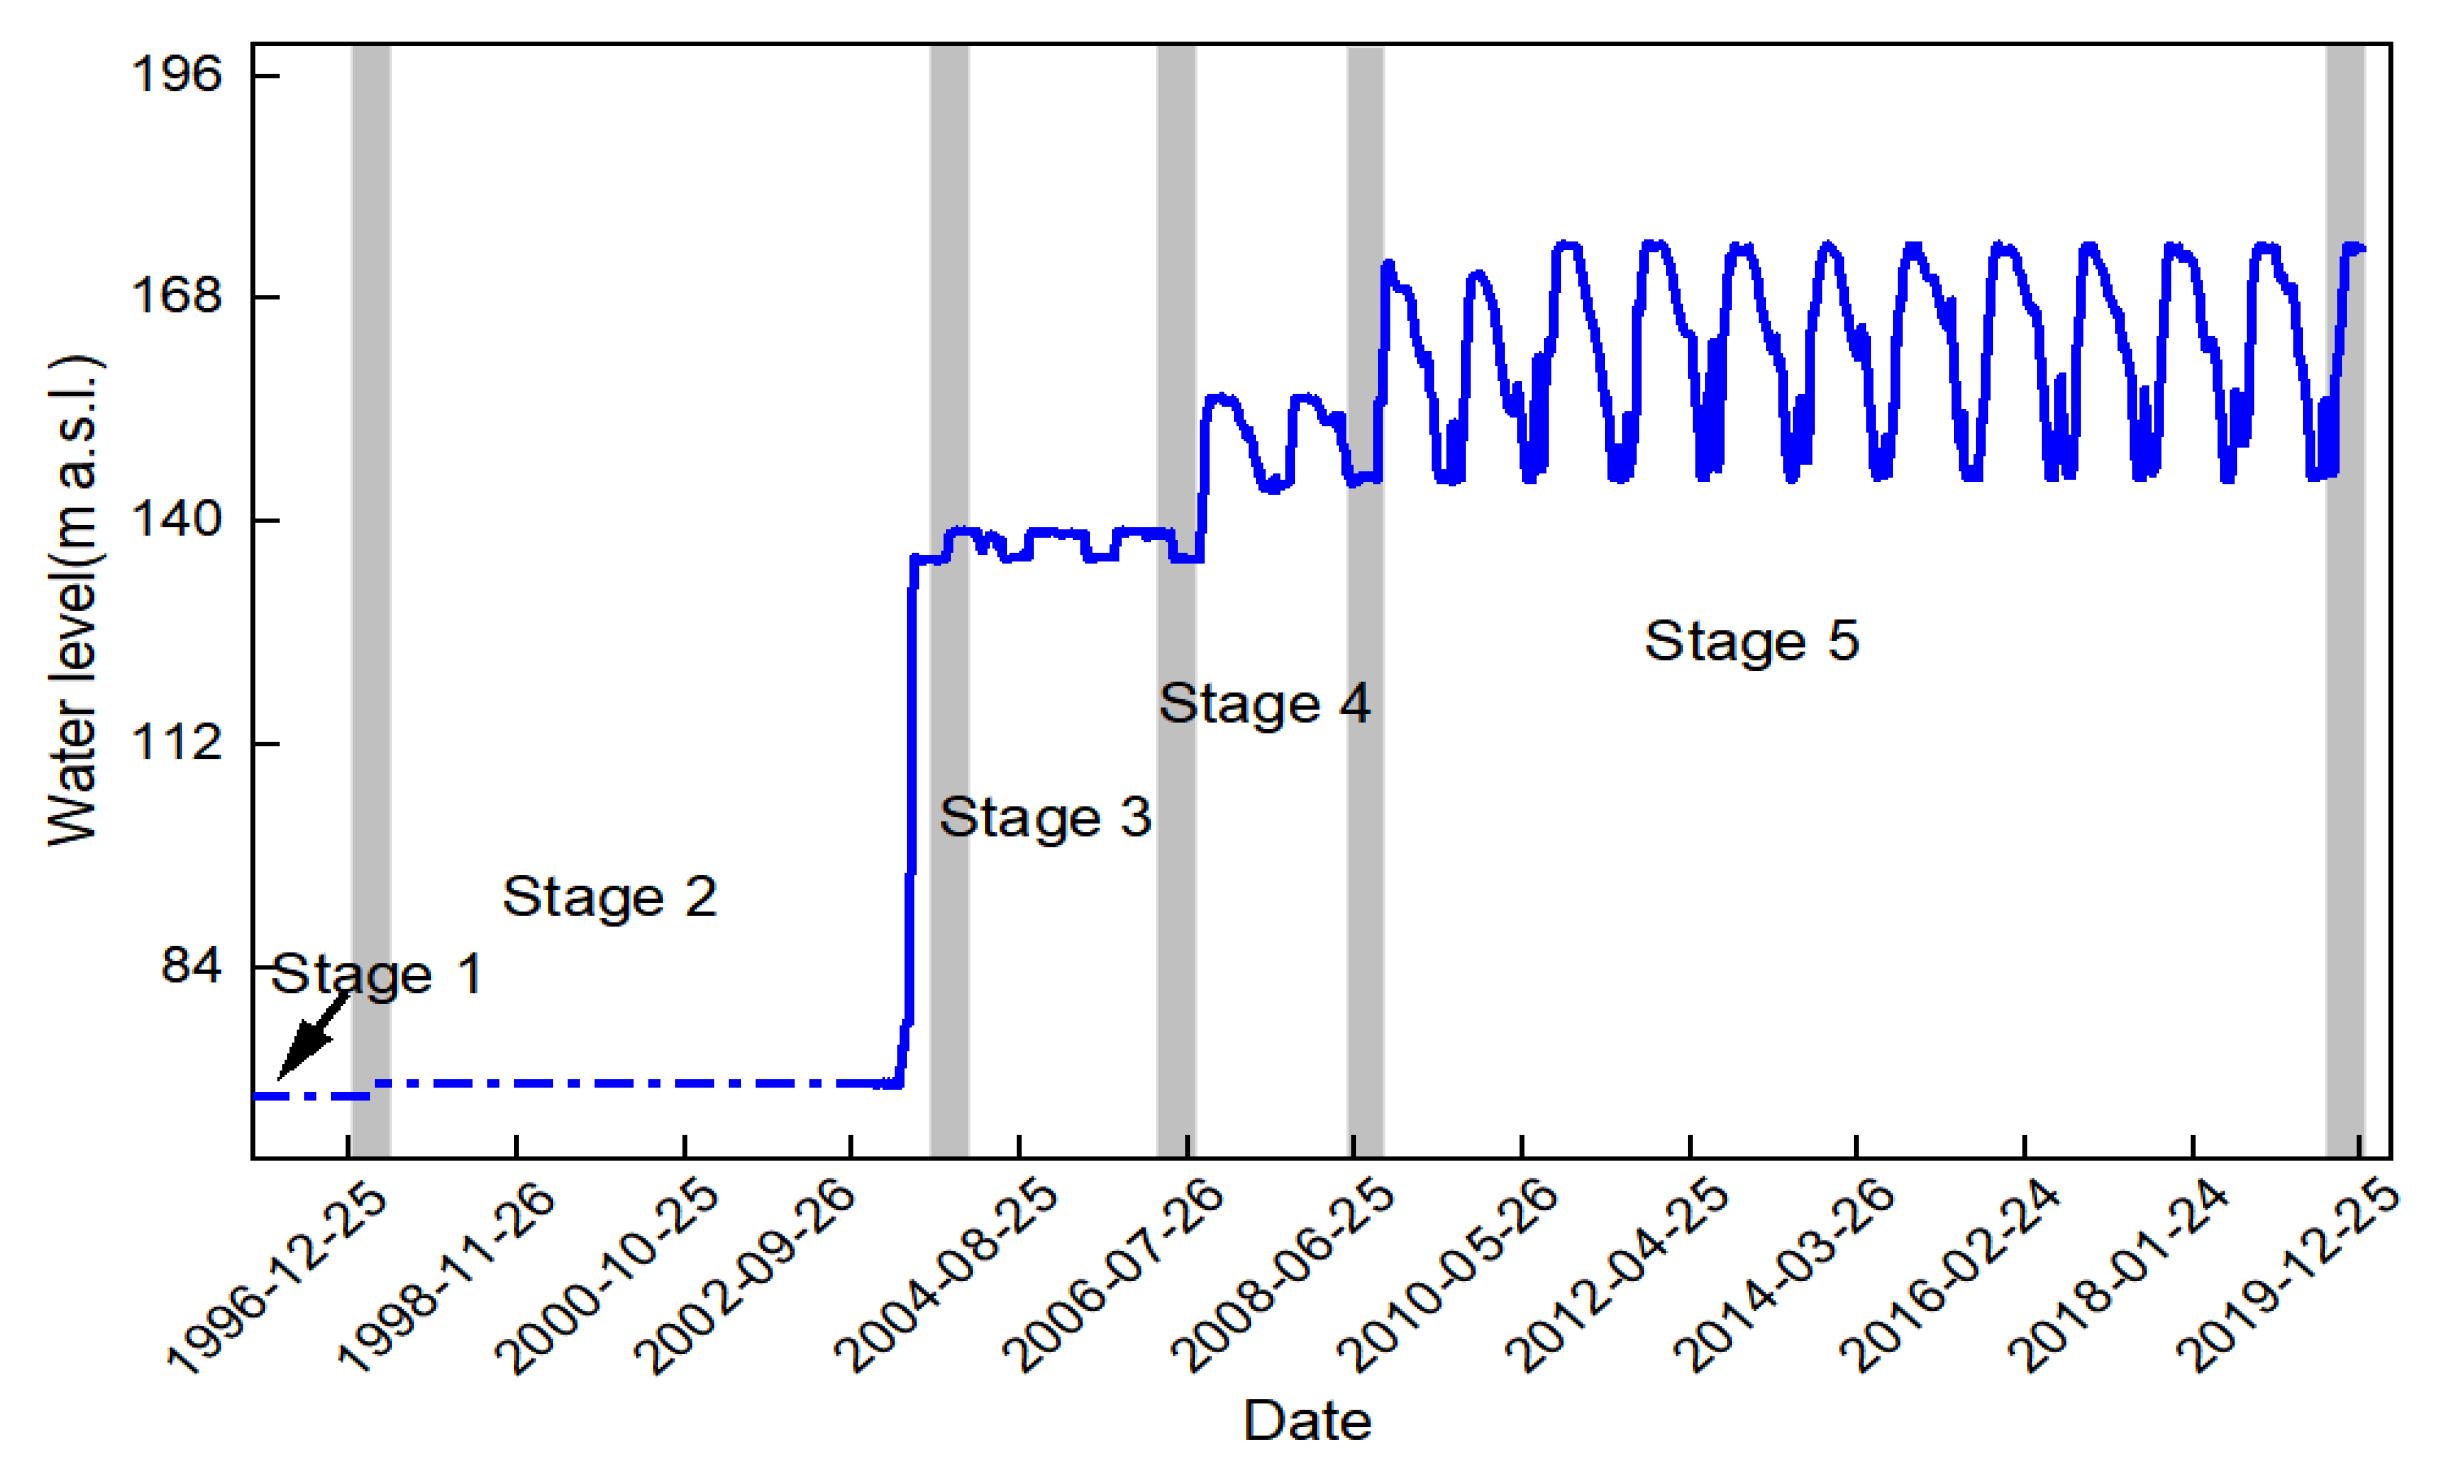
2.2. Division of Impoundment Periods

The upper reaches of the Yangtze River were successfully intercepted by the TGD in 1997, raising the reservoir water level to approximately 66 m above sea level. The TGR began storing water in steps from 139 m in June 2003, to 156 m in October 2006 and 175 m in November 2009. It was officially operated after one year of experimental water storage, in 2009 [36]. Thus, based on the construction phase and the changes in the water levels of the TGD (Figure 2), five stages were identified to investigate the morphological changes in the MCBs.

2.3. Data Collection

The spatial information of the MCBs was retrieved using multi-temporal Landsat images. Since the TGR had been in operation for more than twenty years from the interception of the Yangtze River, three criteria were employed to ensure data consistency regarding the spatial-temporal resolution and retrieval accuracy for the MCBs. Firstly, images with less cloud cover were used where possible [5,23]. Secondly, images acquired during the dry season (i.e., November to March) were used, to reduce the difference in water levels during the different stages. Lastly, due to the influence of the 16-day-long revisit cycle of the Landsat satellite, it was difficult to obtain images with the same water levels for different strips. Therefore, images with similar water levels were obtained as far as possible.
A total of 36 images were collected, with an spatial resolution of 30 m, following these criteria. These images, spanning the 39th–42nd strips of the Landsat satellite were obtained from the Chinese Geospatial Data Cloud (http://www.gscloud.cn/). The data pre-processing, including single-band extraction, false color synthesis and geometric correction, etc., was carried out using ENVI 5.3 software. Many previous studies proved that these images can be used to monitor the landscape dynamics with reasonable accuracy [5,23,24]. Detailed information on the collected image data is shown in Table 1. The data on the water level, sediment and siltation of the TGR were obtained from the Yangtze River Sediment Bulletin (http://www.cjw.gov.cn/zwzc/bmgb/) and Yangtze River Three Gorges Group (https://www.ctg.com./sxjt/sqqk/index.html).

2.4. Retrieval of MCBs from Landsat Images

MCBs were retrieved from Landsat images using auto-classification coupled with manual inspection and digitization. They were initially auto-retrieved using the modified normalized difference water index (MNDWI) developed by Xu [37]. This index was derived from the normalized difference water index (NDWI), which highlighted the water information in the image by normalizing the spectral difference between the green band and the mid-infrared band [38]. The MNDWI has been proved to be an effective method for retrieval of the MCBs with reasonable accuracy [5,23]. The MNDWI was calculated as:
MNDWI = ρ G r e e n ρ M I R ρ G r e e n + ρ M I R
where ρGreen and ρMIR are the reflectances of the green band and mid-infrared band [37], respectively.
Due to differences in the spectral features among different images, some MCBs were misclassified as other landscapes, while some other landscapes were misclassified as MCBs since they had similar spectral features. Thus, the automatically retrieved vector data of MCBs need to be manually modified and verified by combing them with the observed data such as water levels, hydrological data and land use data. Such modification can significantly improve the retrieval accuracy of MCBs from Landsat images.

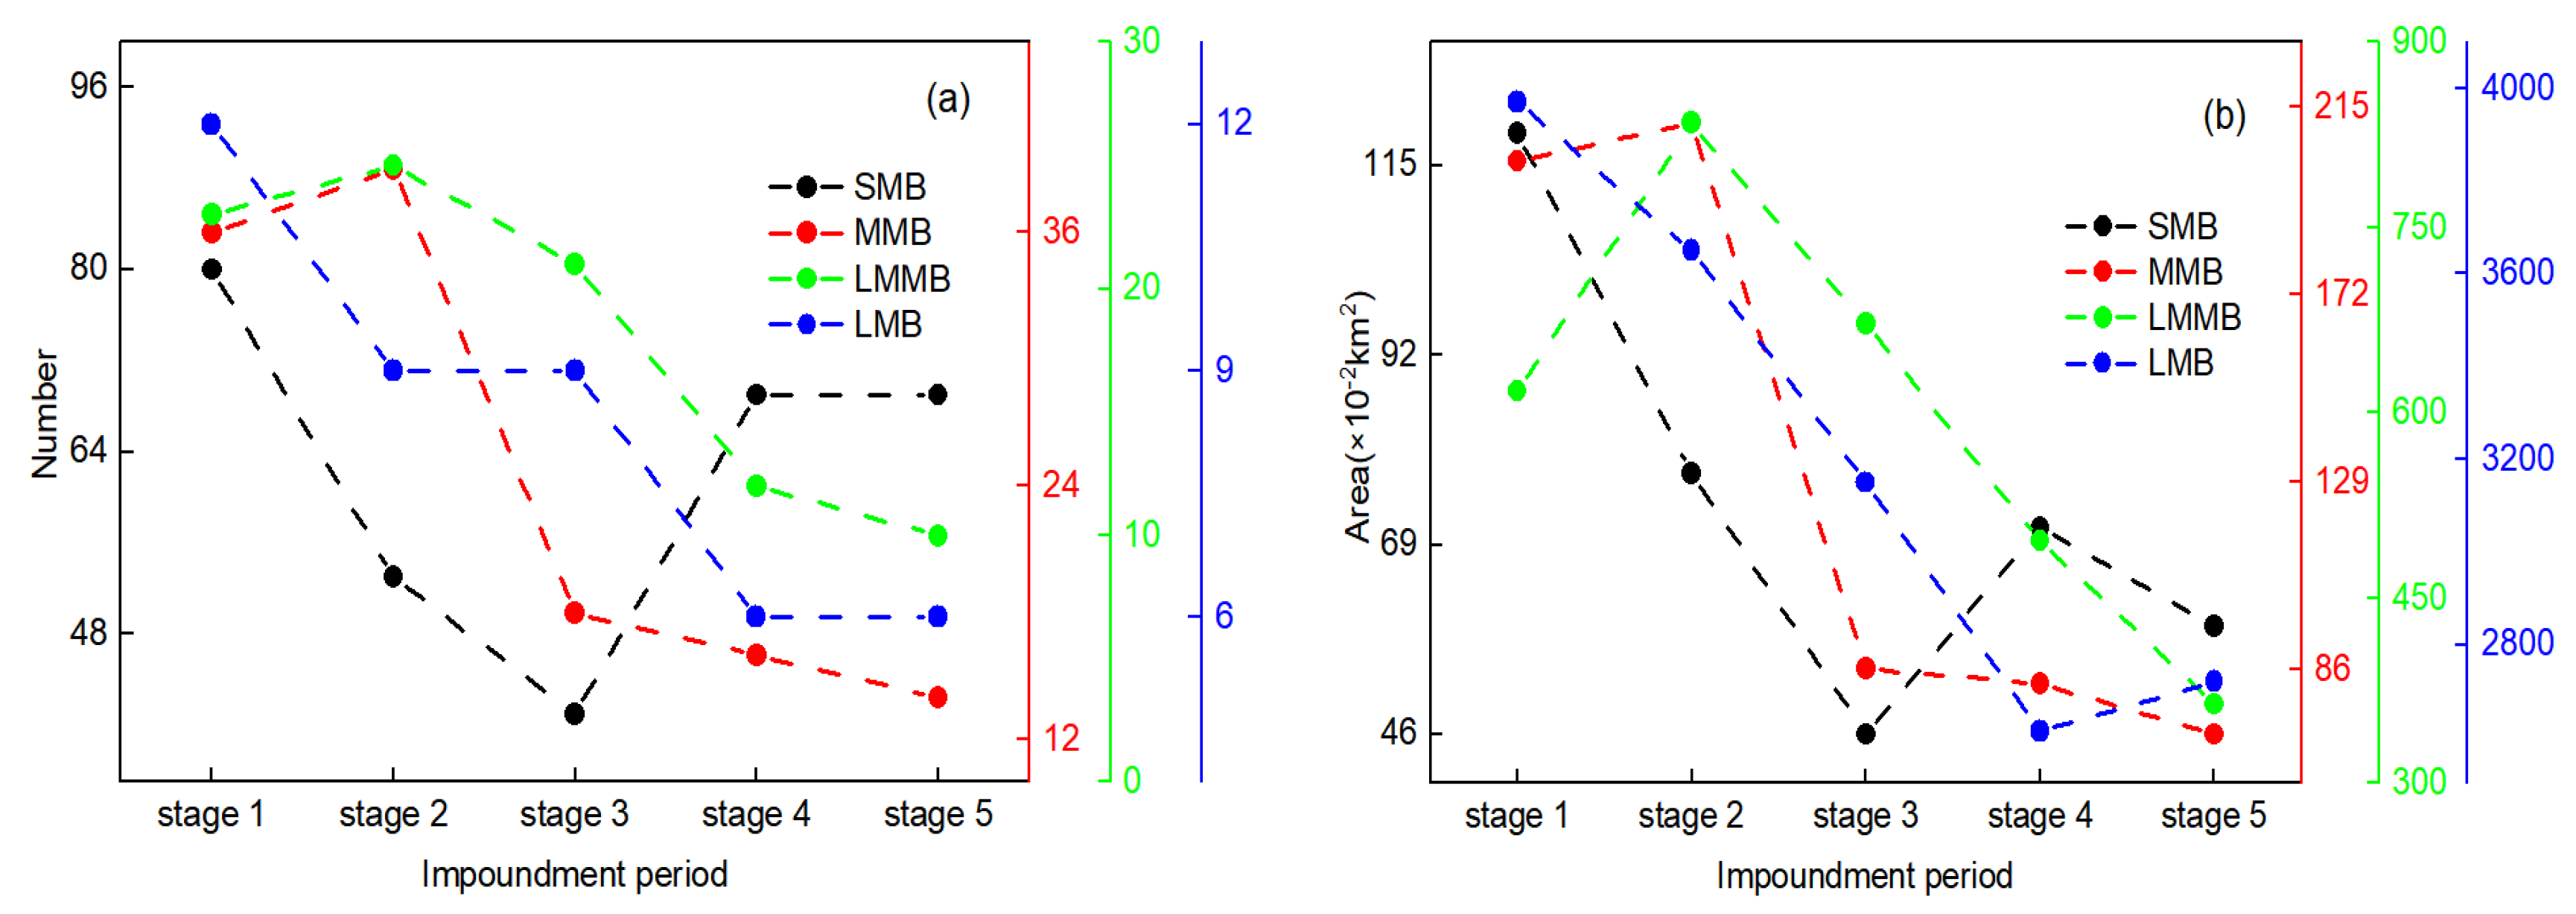
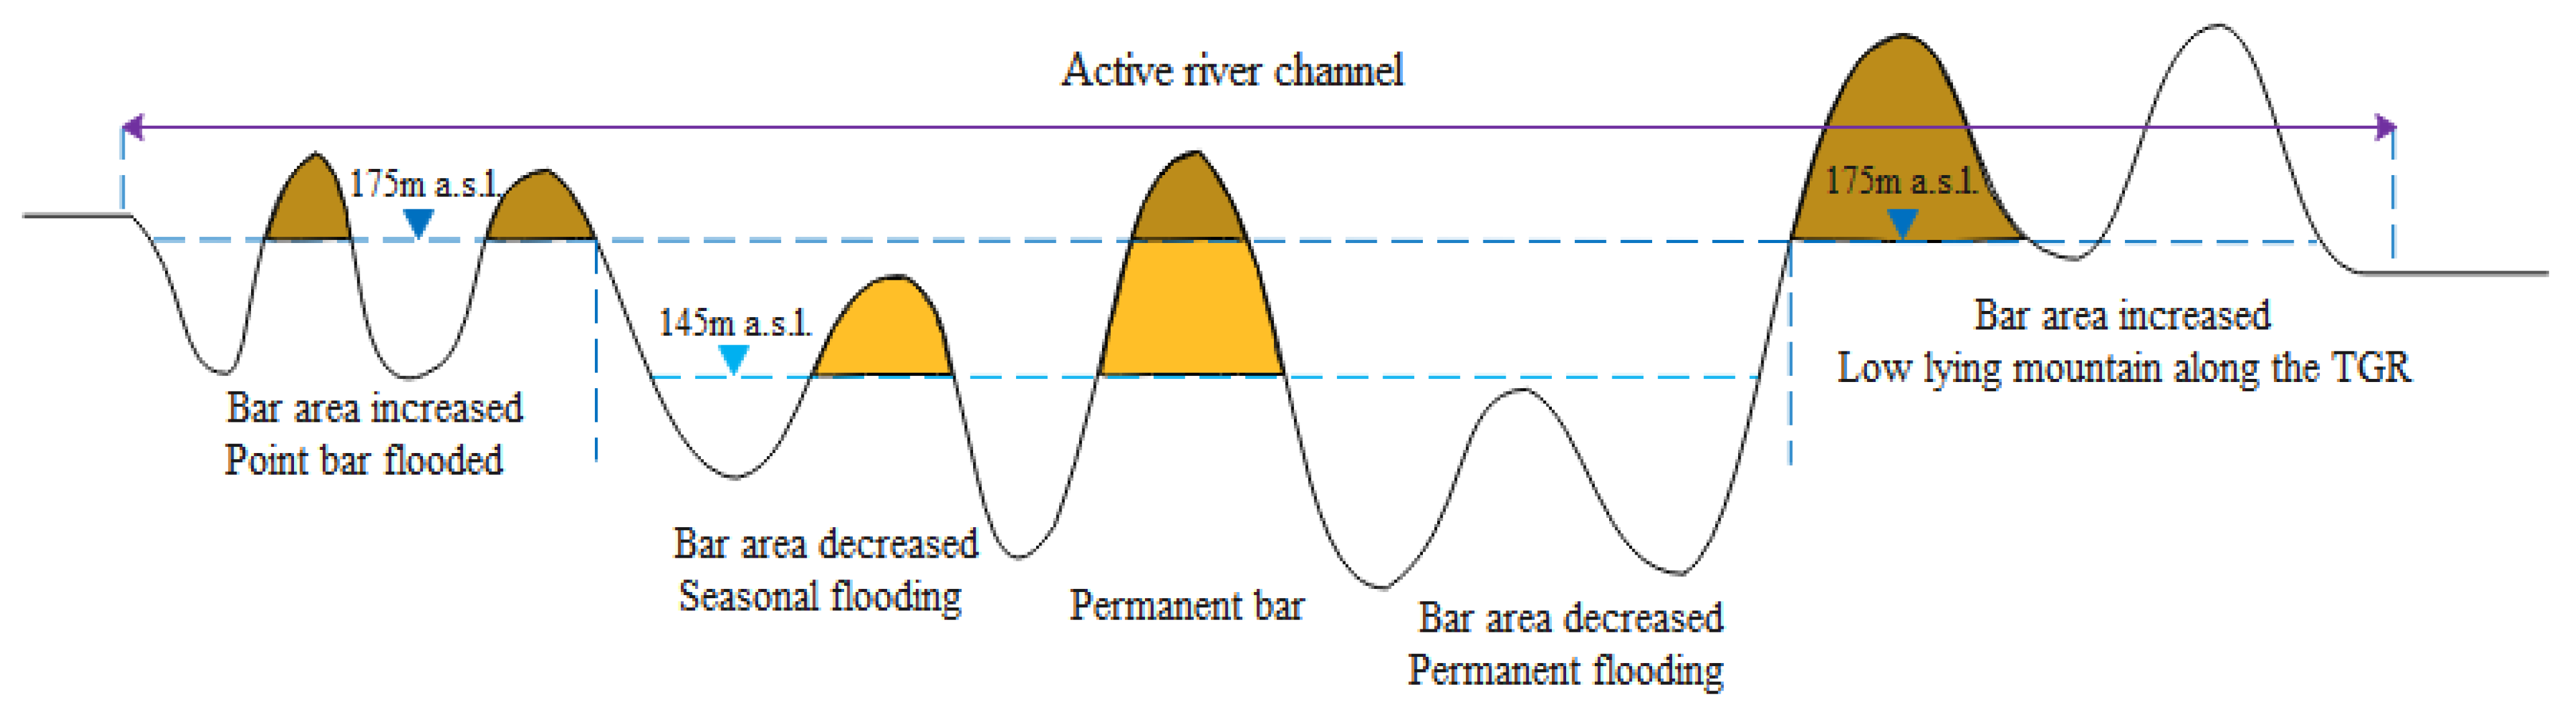
2.5. Classification of MCBs

A field survey showed that the areas of MCBs varied greatly in the TGR, and previous studies found that MCBs with different sizes had different responses to the changes in the hydrological and sediment regimes [5]; thus, all the MCBs were reclassified into 4 types based on different areas: small MCBs with an area less than 0.03 km2 (SMB), medium MCBs with an area less than 0.1 km2 (MMB), medium–large MCBs with an area less than 1 km2 (MLMB) and large MCBs with an area greater than 1 km2 (LMB).

2.6. Analysis Method for the Dynamics of MCBs

2.6.1. Index of Area and Shape

The area and perimeter of a single MCB can be directly calculated from the vector data of MCBs using ArcGIS software. The length and width changes of MCBs can reflect their adjustment to the changes in hydrological and sediment regimes [39]. The ratio of length to width (LWR) was used as a comprehensive index to investigate the morphological characteristics of, and changes in, MCBs [5,23]. This was calculated as:
LWR = L W
where L and W are the length and width of the MCB, respectively.

2.6.2. The Coefficient of Variation (CV)

The CV was used to measure the spatial variability of the morphological characteristics of MCBs. It has been proved to be a useful indicator for investigating the variations in spatial features and is widely used in landscape ecology [5]. It was calculated as:
CV = 1 x 1 n i = 1 n ( x i x ¯ ) 2
where xi, x and n are the LWR of each MCB, average LWR and number of MCBs, respectively.

2.6.3. The Gravity Center Shifting Model

The gravity center shifting model was used for investigating the spatial change trends of MCBs during different impoundment stages [40].
X s = i = 1 n ( A s i x i ) / i = 1 n A s i
Y s = i = 1 n ( A s i y i ) / i = 1 n A s i
where Xs and Ys are the latitude and longitude of the gravity center of all the MCBs at stage s, respectively, Asi is the area of the ith MCB at stage s, xi and yi are the latitude and longitude of the geometric center of the ith MCB, respectively, and n is the total number of MCBs.
The following equation was used for calculating the shifting distance of the gravity center:
D s s = ( Y s Y S ) 2 + ( X s X S ) 2
where Ds′−s is the shifting distance of the gravity center, Xs and Ys are the latitude and longitude of the gravity center of all the MCBs at stage s′, respectively, and Xs and Ys are the latitude and longitude of the gravity center of all the MCBs at stage s, respectively.

3. Results

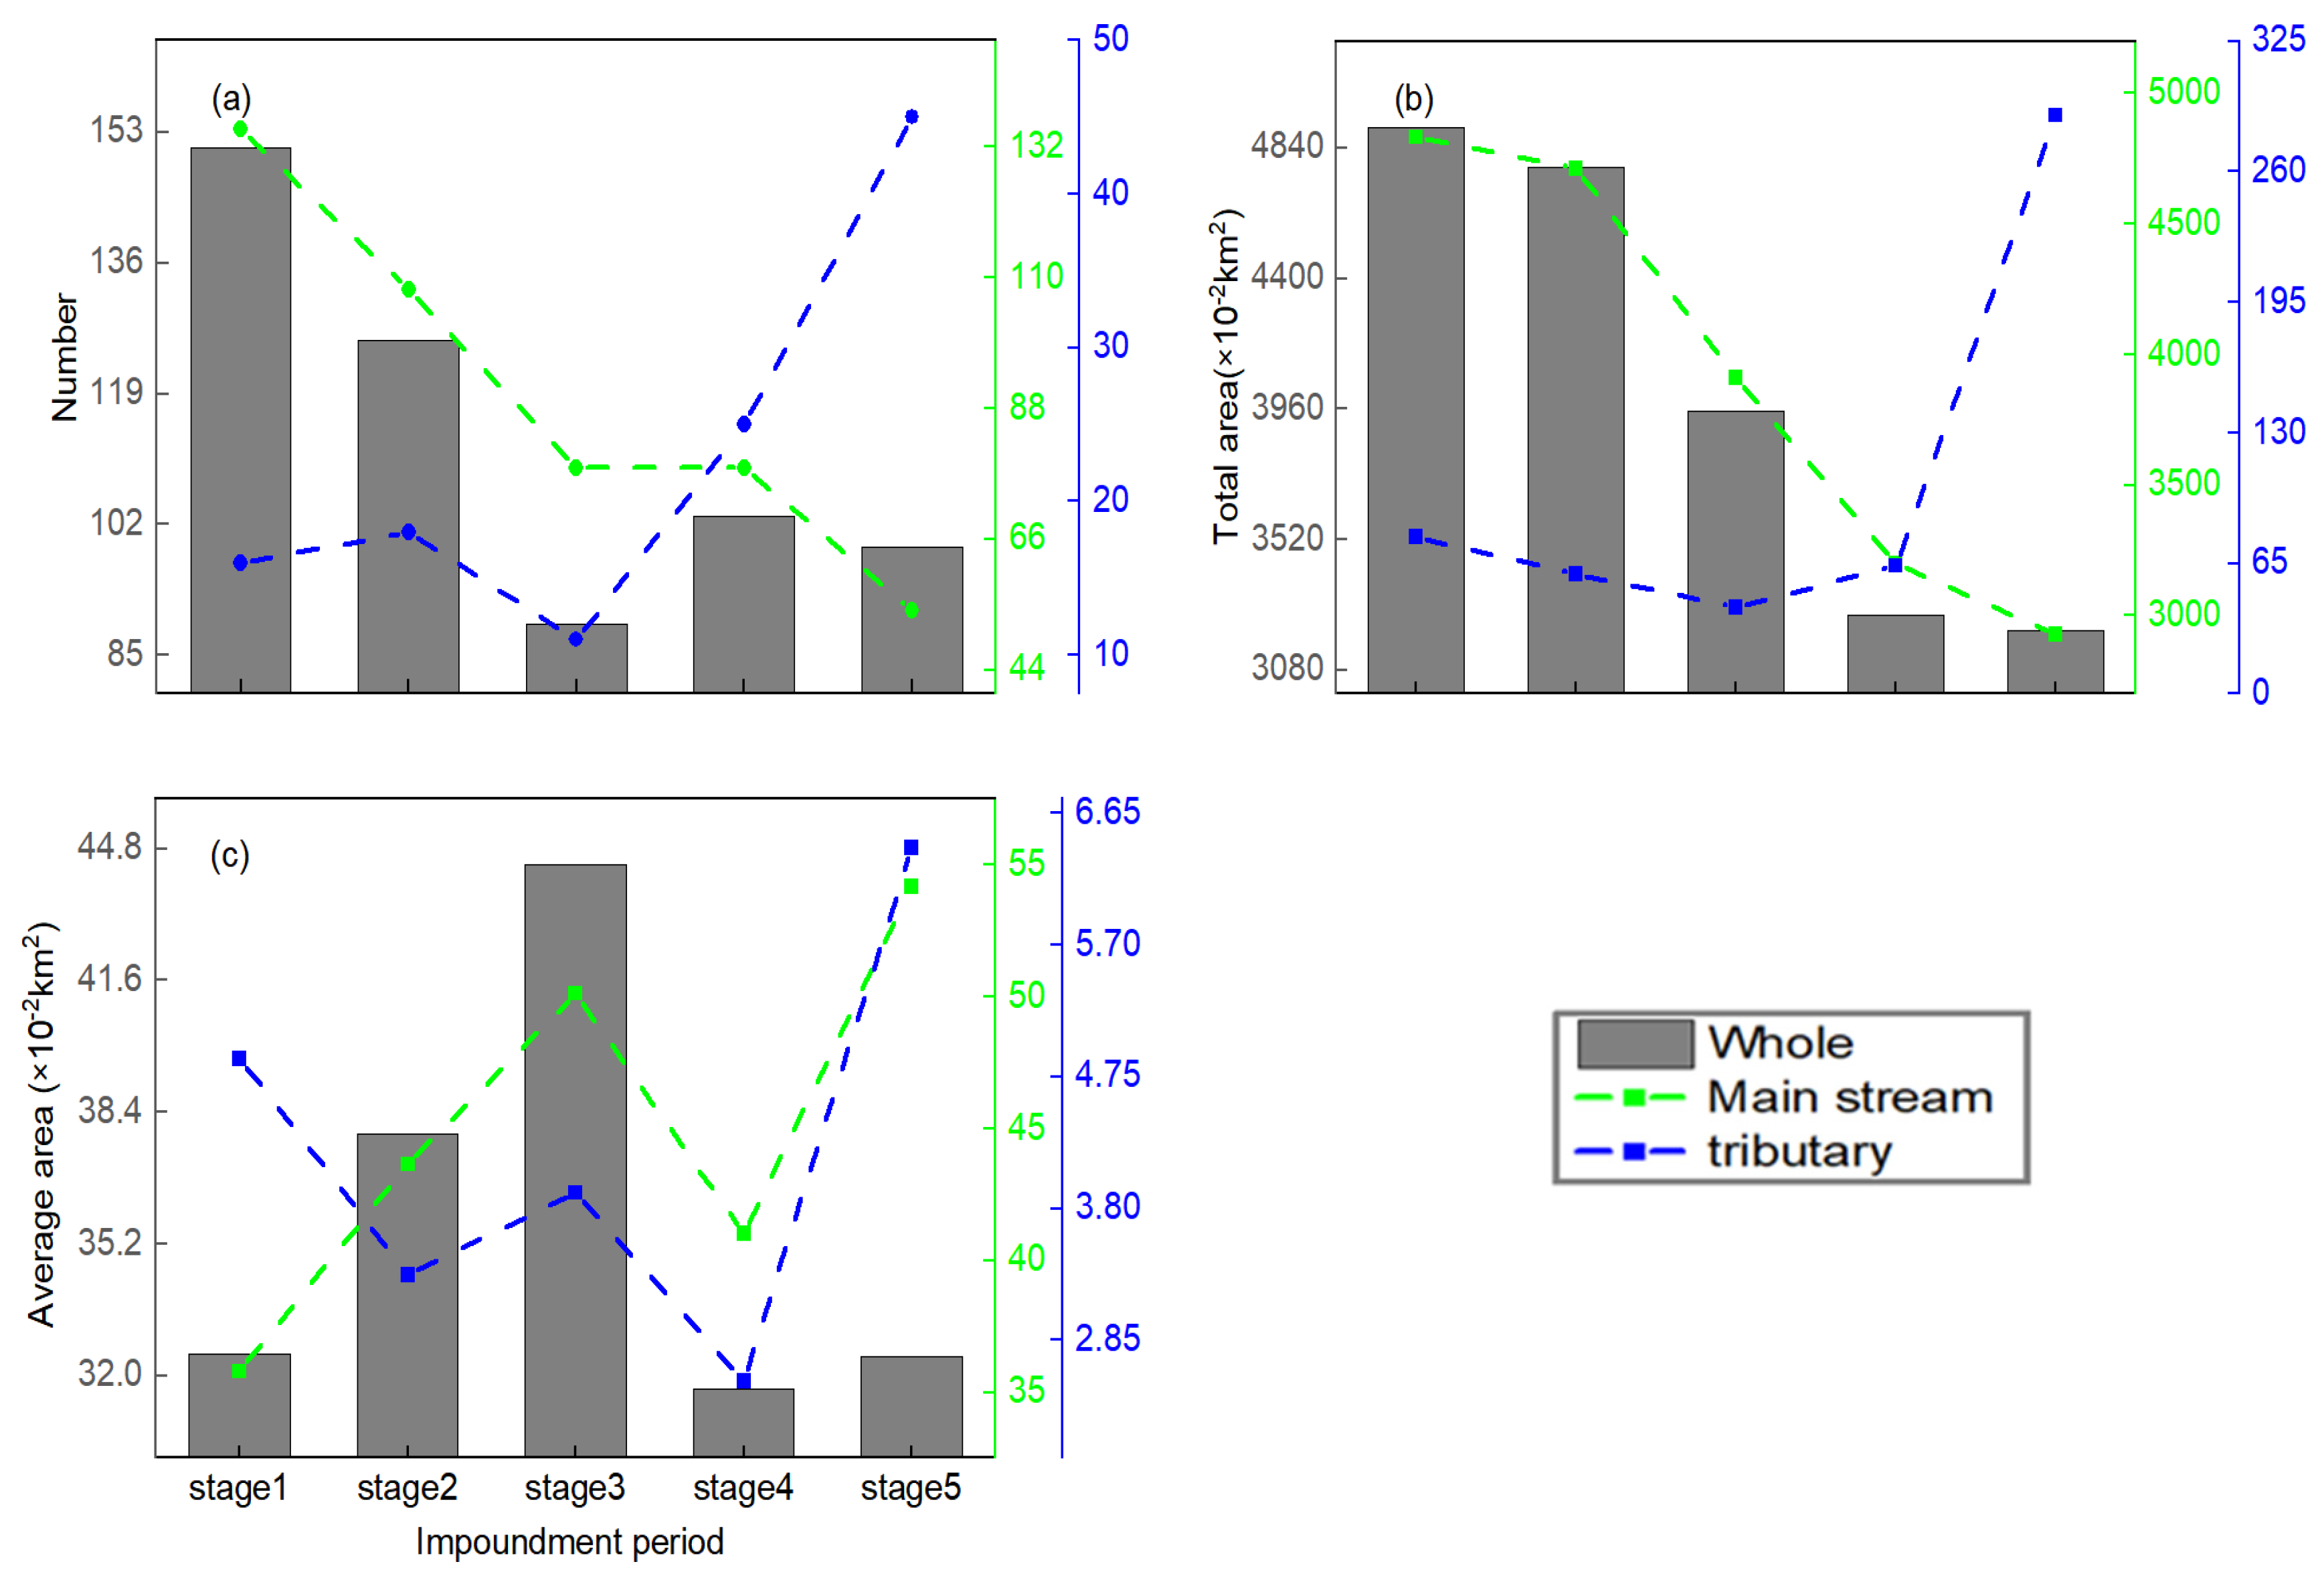
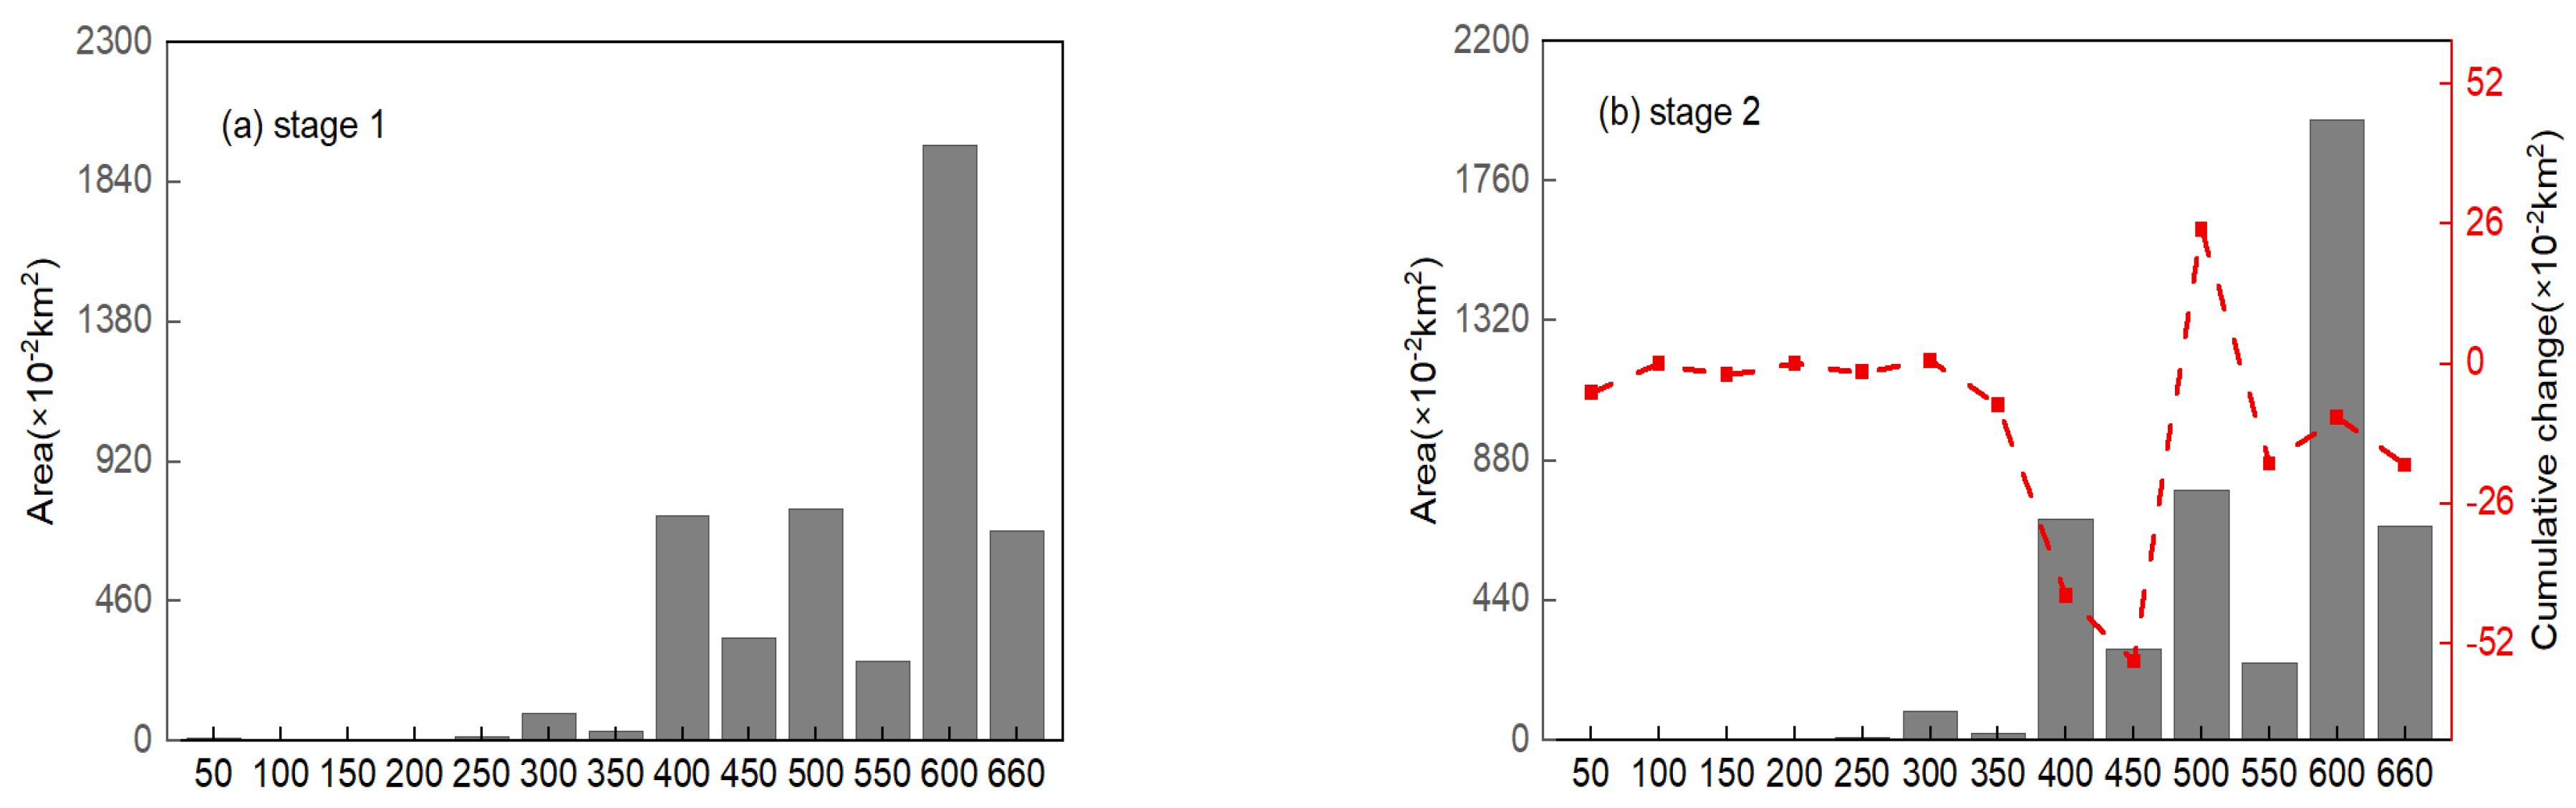
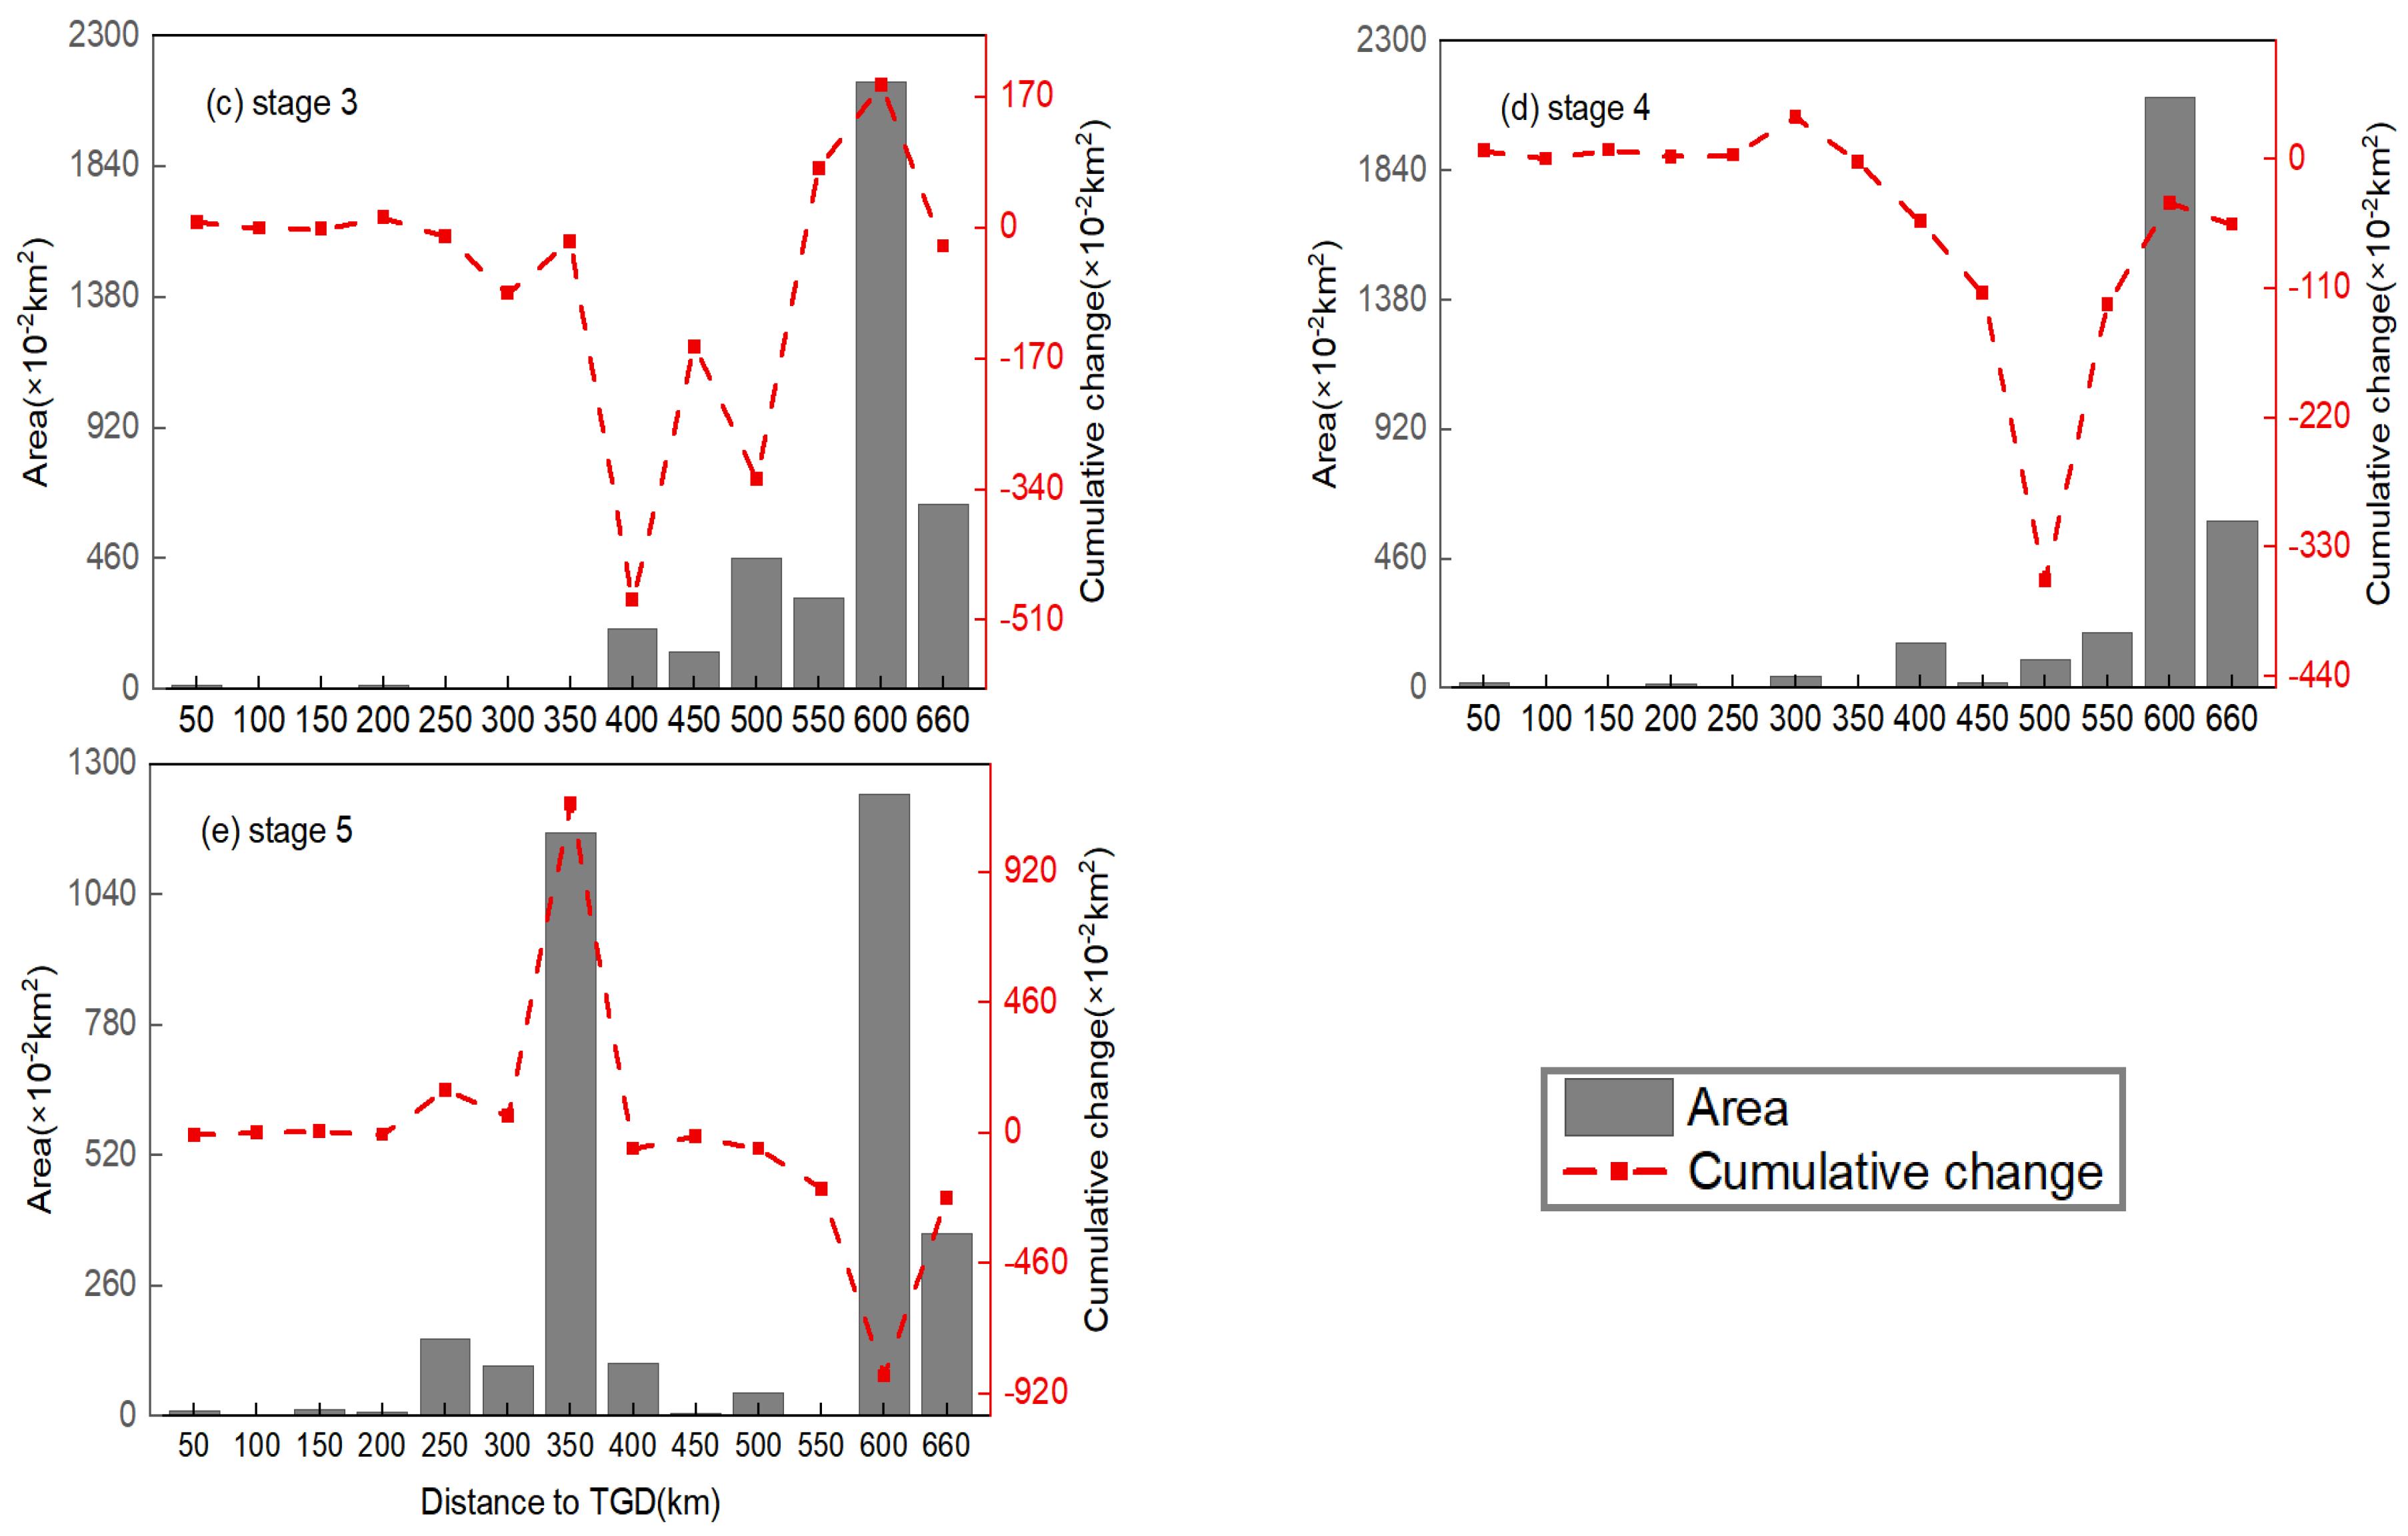
3.1. Variations in Area and Number of MCBs

Retrieved results from Landsat images showed significant variations in the area and number of MCBs in the TGR (Figure 3). The area and number presented different trends with respect to the changes in water level during different impoundment periods. The number of MCBs ranged between 89 and 150, with an average of 113 in the TGR; 90 MCBs were located in the main stream and accounted for 79.7% of the total number, and the remaining MCBs were located in tributaries (Figure 3a).
The number and area of MCBs changed dramatically with water-level changes (Figure 3). The maximum number of MCBs occurred at stage 1 under the natural hydrological regime. The number decreased sharply to 89 at stage 3 when the water level reached 139 m, while it increased to 103 at stage 4 when the water level rose to 156 m and slightly declined to 99 at stage 5 when the water level increased to 175 m. The number trend for MCBs in the main stream differed greatly from that in tributaries. It decreased progressively from 139 at stage 1 to 54 at stage 5, in the main stream. The number slightly increased from stage 1 to stage 2 and then slightly decreased in stage 3 in tributaries, while it sharply increased from a minimum of 11 at stage 3 to a maximum of 45 at stage 5.
The area of MCBs in the TGR varied greatly from 0.2 to 1134 (×10−2 km2), with the average area ranging between 31.69 (×10−2 km2) at stage 4 and 44.42 (×10−2 km2) at stage 3. The average area in the main stream was much higher than that in tributaries, with maximum values of 54.19 (×10−2 km2) and 6.4 (×10−2 km2), respectively (Figure 3c). The total area decreased progressively from a maximum of 4910.56 (×10−2 km2) at stage 1 to a minimum of 3214.6 (×10−2 km2) at stage 5, with the rising of the water level, and the most obvious changes occurred between stage 2 and stage 4 (Figure 3b). The total area in the main stream presented a similar trend to that in the whole reservoir. The total area changed slightly from stage 1 to stage 4 in tributaries, and then increased sharply to a maximum of 288.07 (×10−2 km2) at stage 5.
The area and number changes in MCBs for the different classes are presented in Figure 4. In terms of the number, the MCBs in the TGR were dominated by SMBs followed by MMBs, accounting for 55.6% and 20.9% of the total number on average, respectively. In contrast, the MCBs were dominated by LMBs followed by LMMBs in terms of area, accounting for 80.2% and 14.8% of the total area on average, respectively. The number and area variations in the MCBs differed greatly for different sizes, with the most obvious changes in number and area appearing in SMBs (Figure 4a) and LMBs (Figure 4b), respectively. The number of SMBs dramatically decreased from stage 1 to stage 3, then increased sharply to stage 5, which was the main reason for the sharp change in the total number in tributaries from stage 4 to stage 5. The numbers of MMBs, LMMBs and LMBs generally showed a similar decreasing trend as the water level rose. The trend for area changes in MCBs in the TGR was determined by that of LMBs generally, due to the dominant role of LMBs in the total area. MMBs presented a similar trend to LMMBs regarding area, with an increase from stage 1 to stage 2 and a significantly decreasing trend from stage 2 to stage 5.

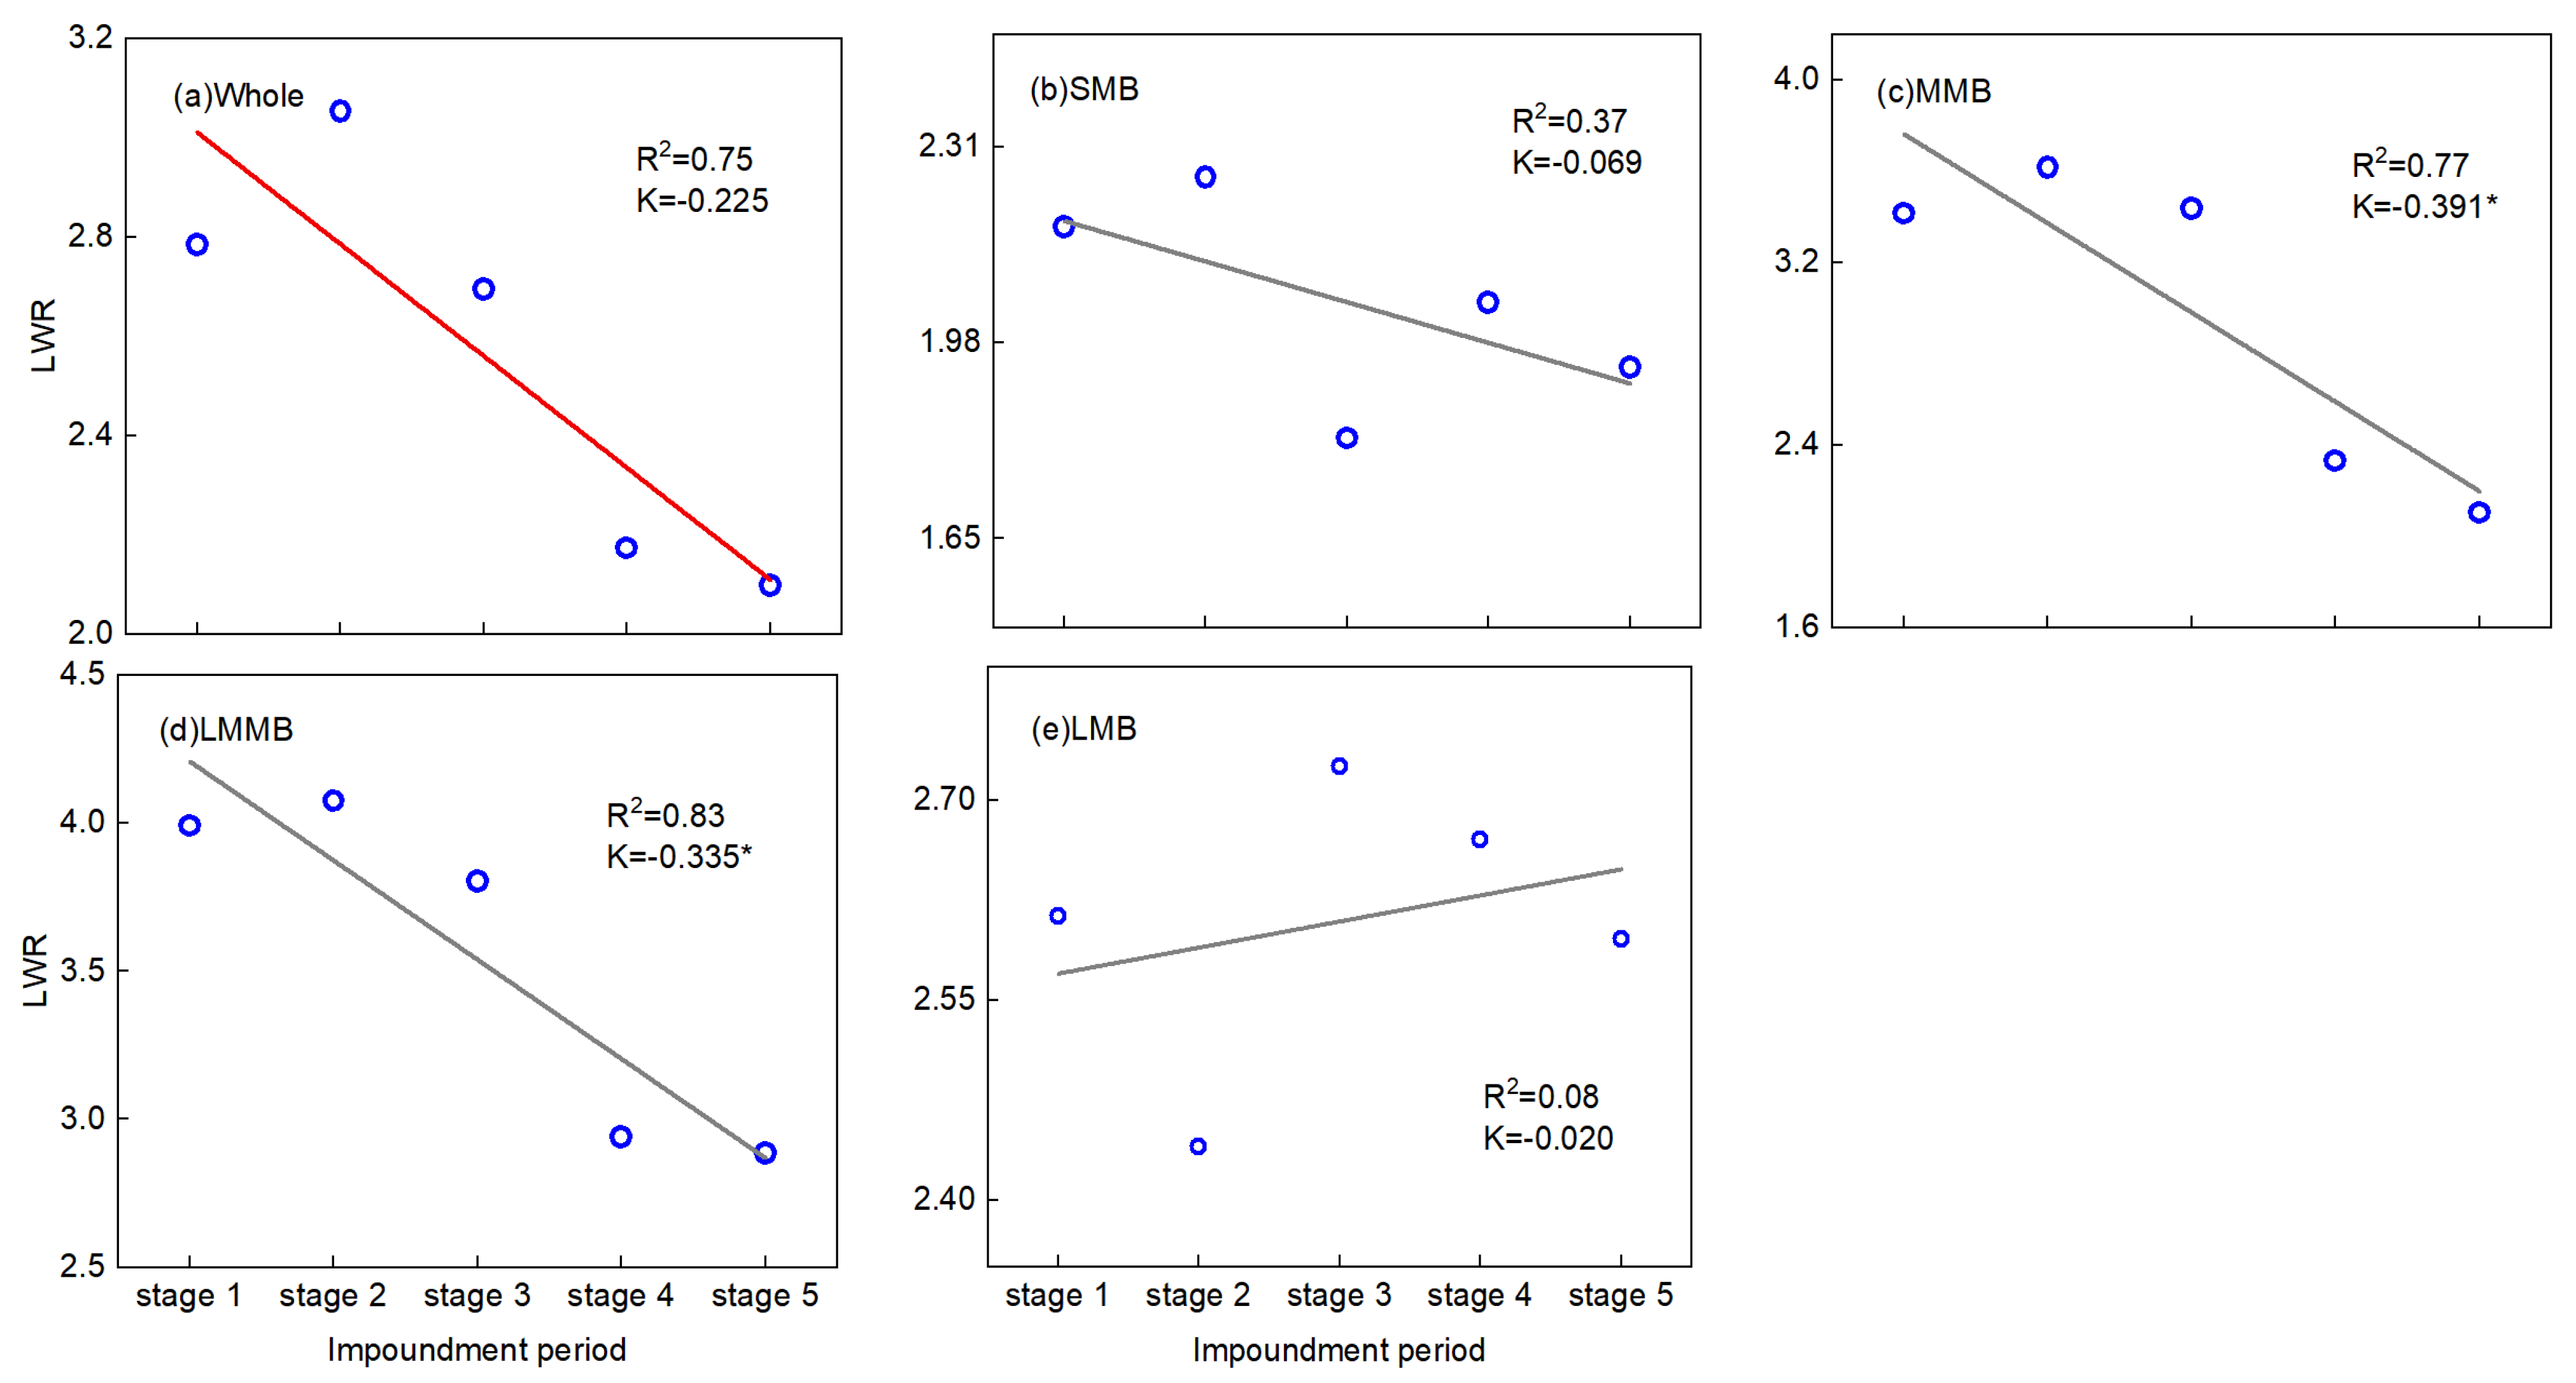
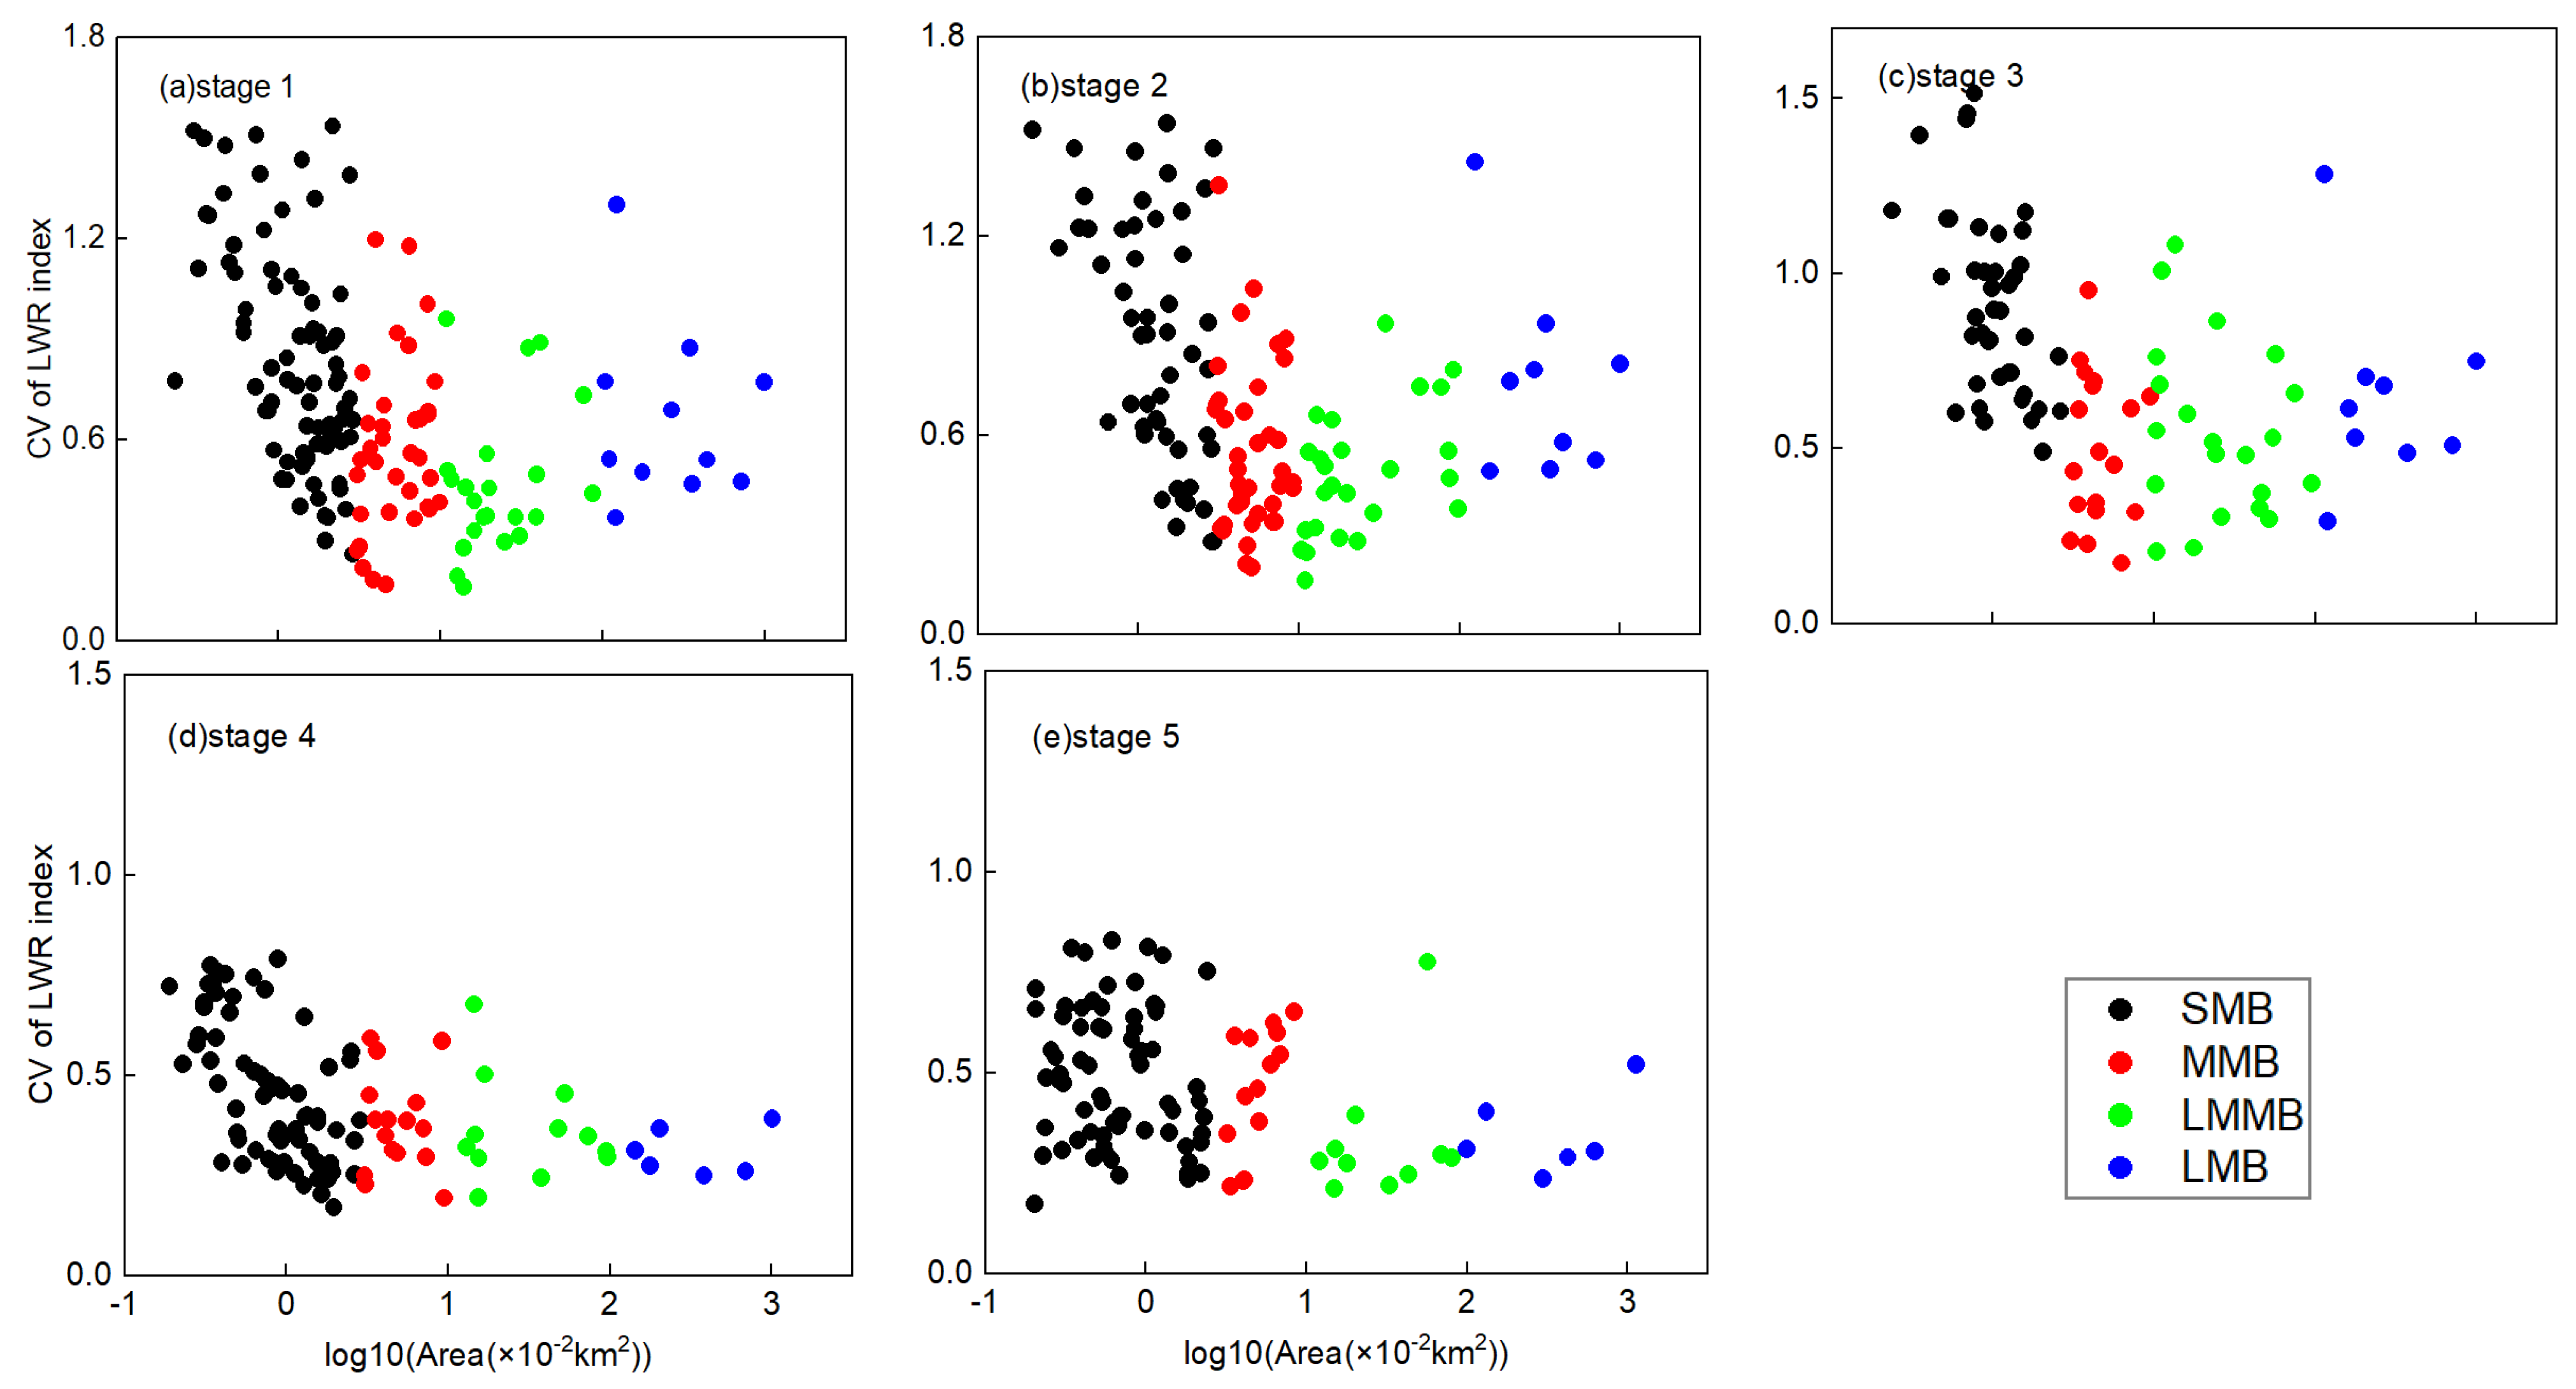
3.2. Morphological Changes of MCBs

The temporal variation of the LWR is presented in Figure 5. The LWR of MCBs in the TGR ranged between 2.09 and 3.05, with an average of 2.56. The changing LWR generally indicates a morphological adjustment of MCBs following the changes in hydrological and sediment regimes induced by the operation of the TGR. The LWR increased from stage 1 to a peak at stage 2, and then decreased from stage 2 to a minimum at stage 5. This suggests that the morphology of MCBs tended to change from a narrow–long shape to a short–round shape with the rising of the water level. On average, LMMBs had the highest LWR followed by MMBs, while the lowest LWR was observed for SMBs, generally indicating that the LMMBs and MMBs tended to be a narrow–long shape, while the SMBs tended to be a short–round shape. The LWR variation of MCBs differed greatly among the different classes, with the most obvious change occurring in LMBs, suggesting that the effect of impoundment on the morphology of LMBs was more pronounced than the effect on SMBs, MMBs and LMMBs. The effect for LMBs was relatively small from stage 1 to stage 2, resulting in only slight changes in LWR, while a significant effect appeared at stage 3 when the water level rose to 139 m. MMBs showed similar trend to LMMBs regarding the LWR, with an increase from stage 1 to stage 2 and a decreasing trend from stage 3 to stage 5. Compared to LMBs, MMBs and LMMBs, SMBs had a more stable LWR with lower fluctuations probably due to the fact that SMBs often had a shorter development time and a short–round morphology.
The LWR stability of the MCBs is shown in Figure 6. Generally, the CV decreased with an increase in the area of the MCB, indicating that larger MCBs tended to have a more stable morphology, and vice versa. The MCBs in the river, with natural hydrological and sediment regimes, often showed large morphological changes due to the large variations in erosion and siltation, resulting in a higher CV at stage 1. However, the conversion from natural river to man-made reservoir resulted in a rise in the water level, which significantly weakens the hydrodynamic conditions, leading to the CV changing from being scattered to being more clustered, as the water level rose from stage 1 to stage 5, as can been seen in Figure 6. This change was more evident for the LMBs.

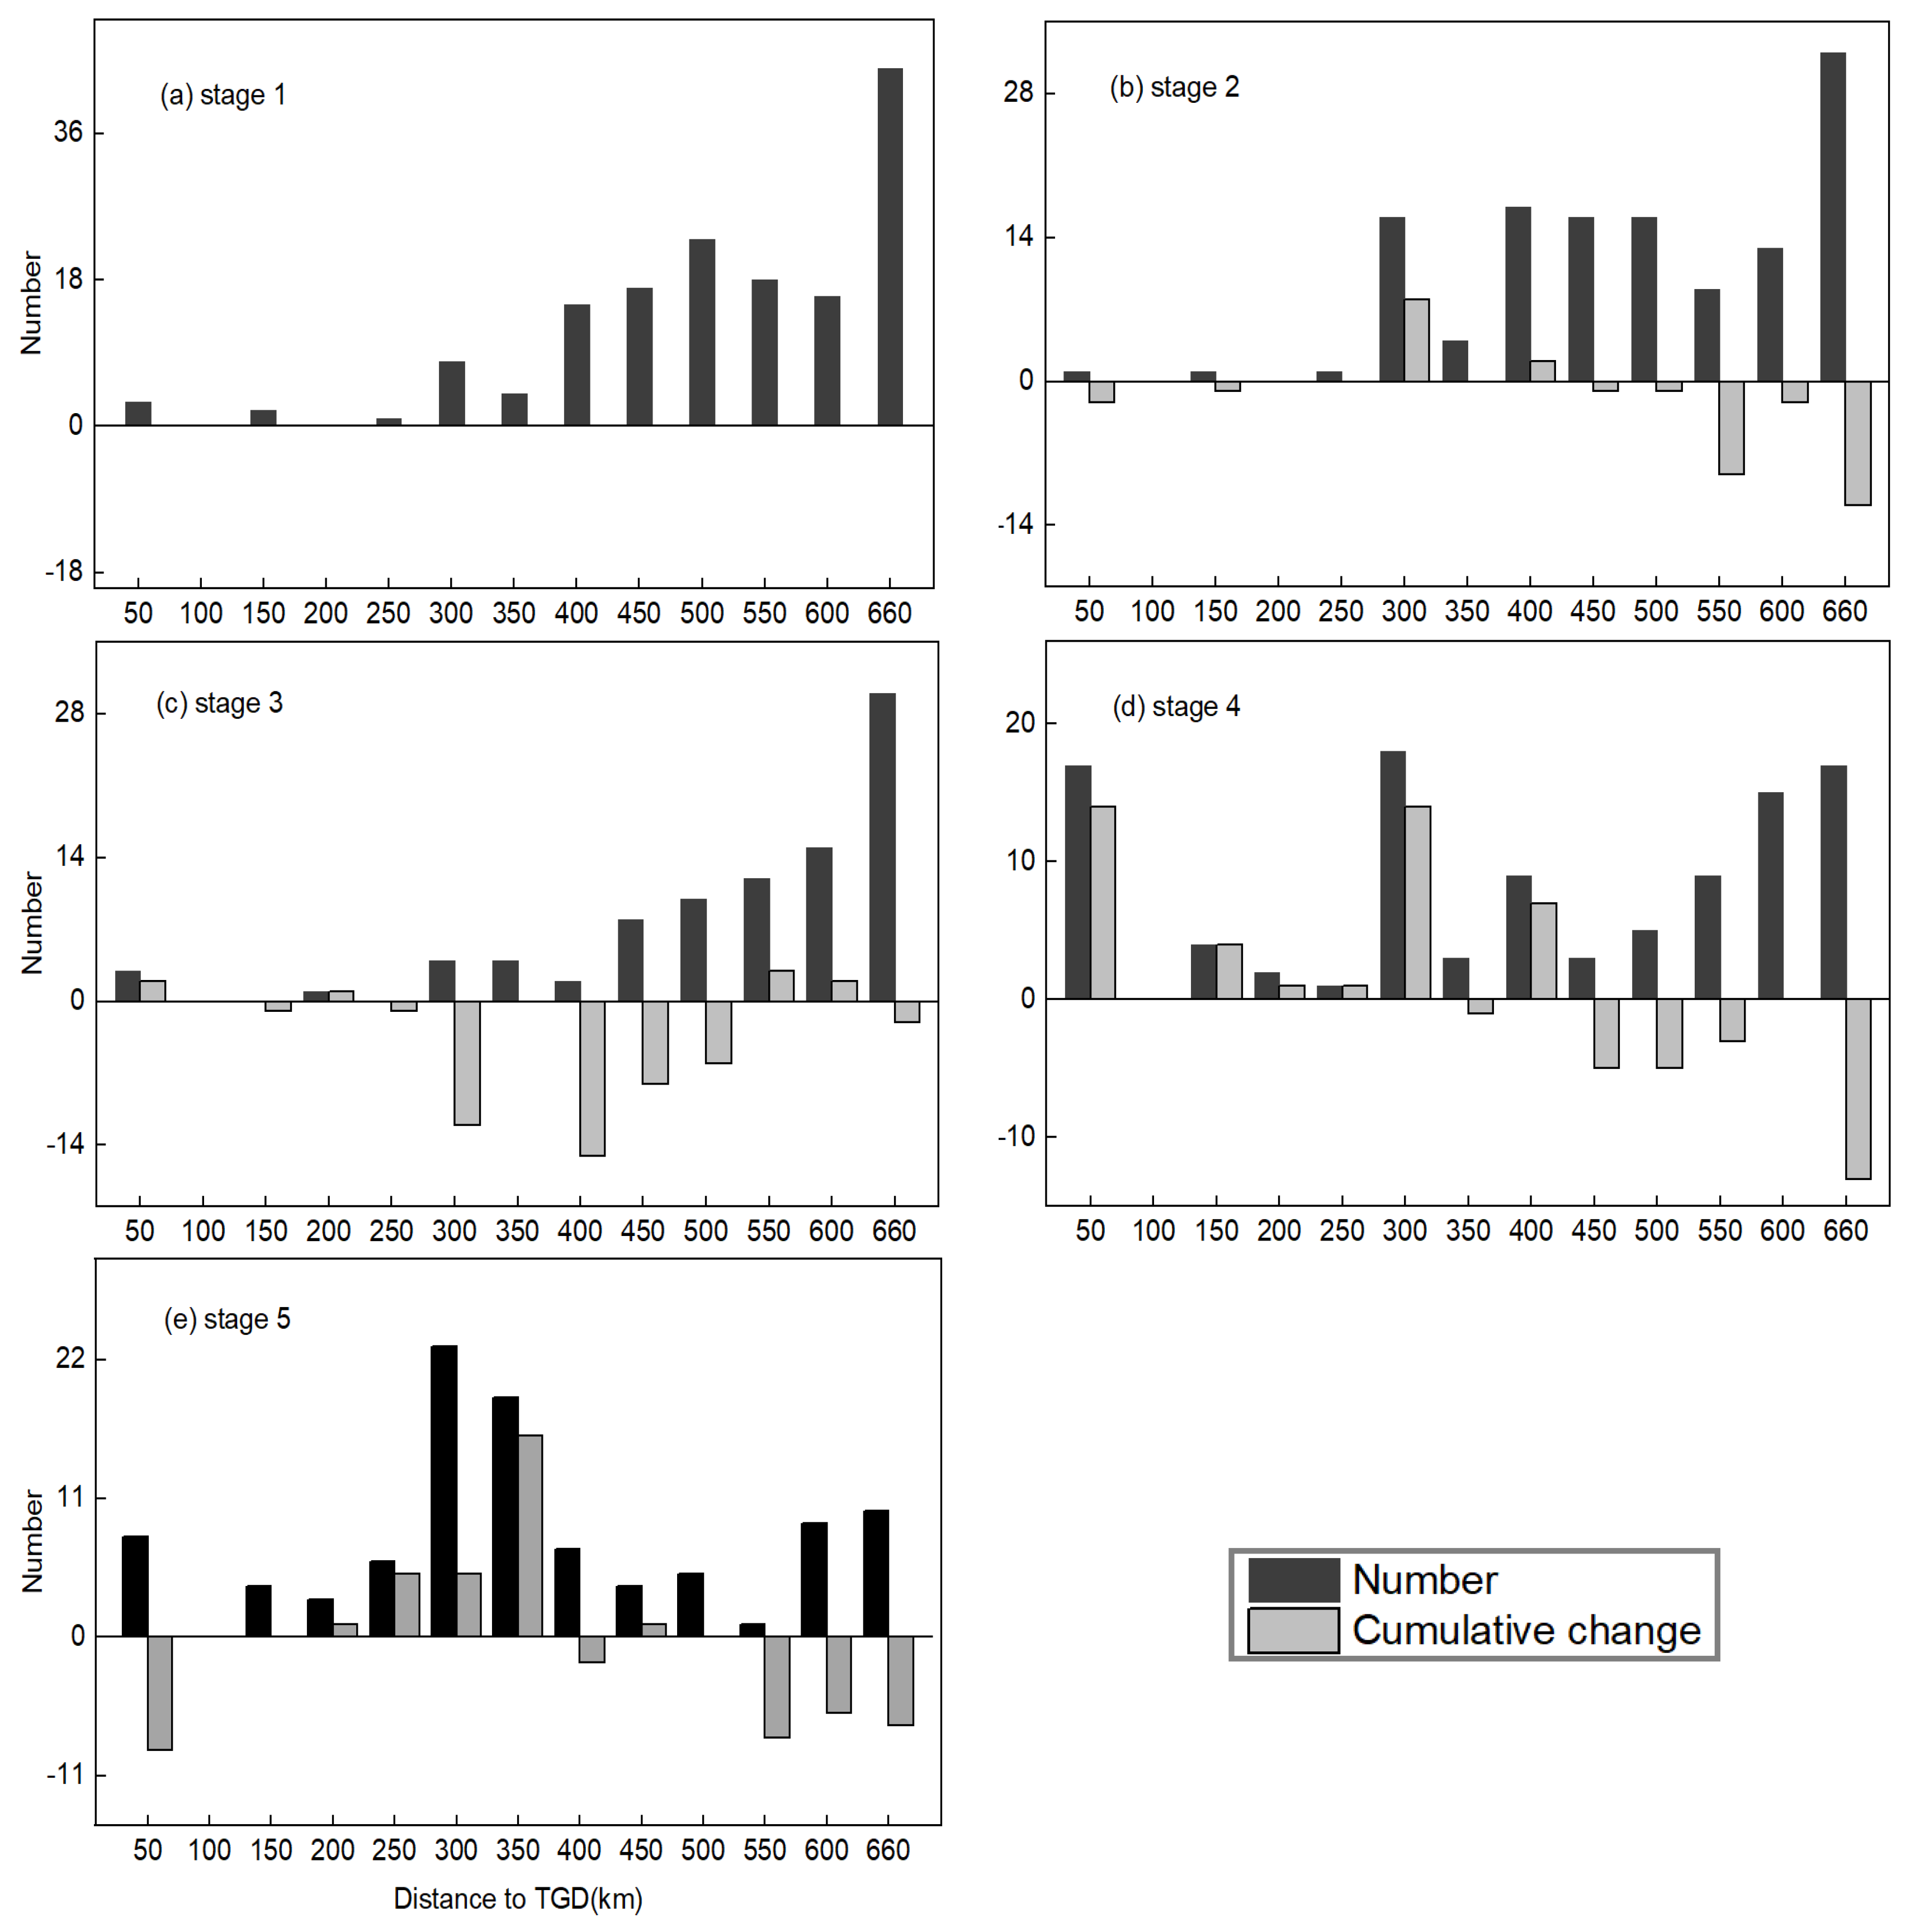
3.3. Spatial Distribution of MCBs in TGR

The spatial distributions of the number and area of MCBs in the TGR are shown in Figure 7 and Figure 8, respectively. It can be seen that the MCBs were unevenly distributed spatially. They were mostly distributed in the upper section of the TGR at 300 km from the TGD, accounting for 96.7% and 99.4% of the total number (Figure 7a) and area (Figure 8a) at stage 1. The distributions of the MCBs at the second stage (Figure 7b and Figure 8b) were generally similar to those at stage 1. The number and area of MCBs in the upper section of the TGR were reduced mainly due to the influence of human activities such as sand mining, which contributed mostly to the number decrease in MCBs from stage 1 to stage 2. A total of 41 MCBs with a total area of 1068.03 (×10−2 km2) disappeared in the section of TGR from 250 to 500 km from the TGD (Figure 7c), due to the inundation occurring when the water level rose to 139 m at stage 3. The number of MCBs changed dramatically in the whole reservoir as the water level increased from 139 m to 156 m at stage 4 (Figure 7d). In the section from the dam to 400 km from the dam, 40 new MCBs formed following the inundation of low-lying mountain tops by the reservoir, while the area changed slightly (Figure 8d), and meanwhile 26 MCBs disappeared in the section from 400 to 660 km from the dam due to the inundation when the water level rose, leading to a drastic decline in the area. After the official operation of the TGR in 2009, 26 new MCBs formed in the section from 200 to 350 km from the TGD (Figure 7e), resulting in the number proportion increasing from 6.3% at stage 3 to 48.5% at stage 5, and the area proportion increasing to 44.1% (Figure 8e). However, 21 MCBs with a total area up to 1287.11 (×10−2 km2) disappeared in the section from 500 to 660 km from the TGD due to the inundation when the water level rose to 175 m. The spatial variation of MCBs during the different stages was caused mainly by the rising water level and the expansion of the inundation area created by the water impoundments of the TGR. The results suggest that water impoundments at the TGR had led to the migration of the dominant area from the upper to the middle section of the TGR, resulting in a more even distribution of MCBs in the TGR.

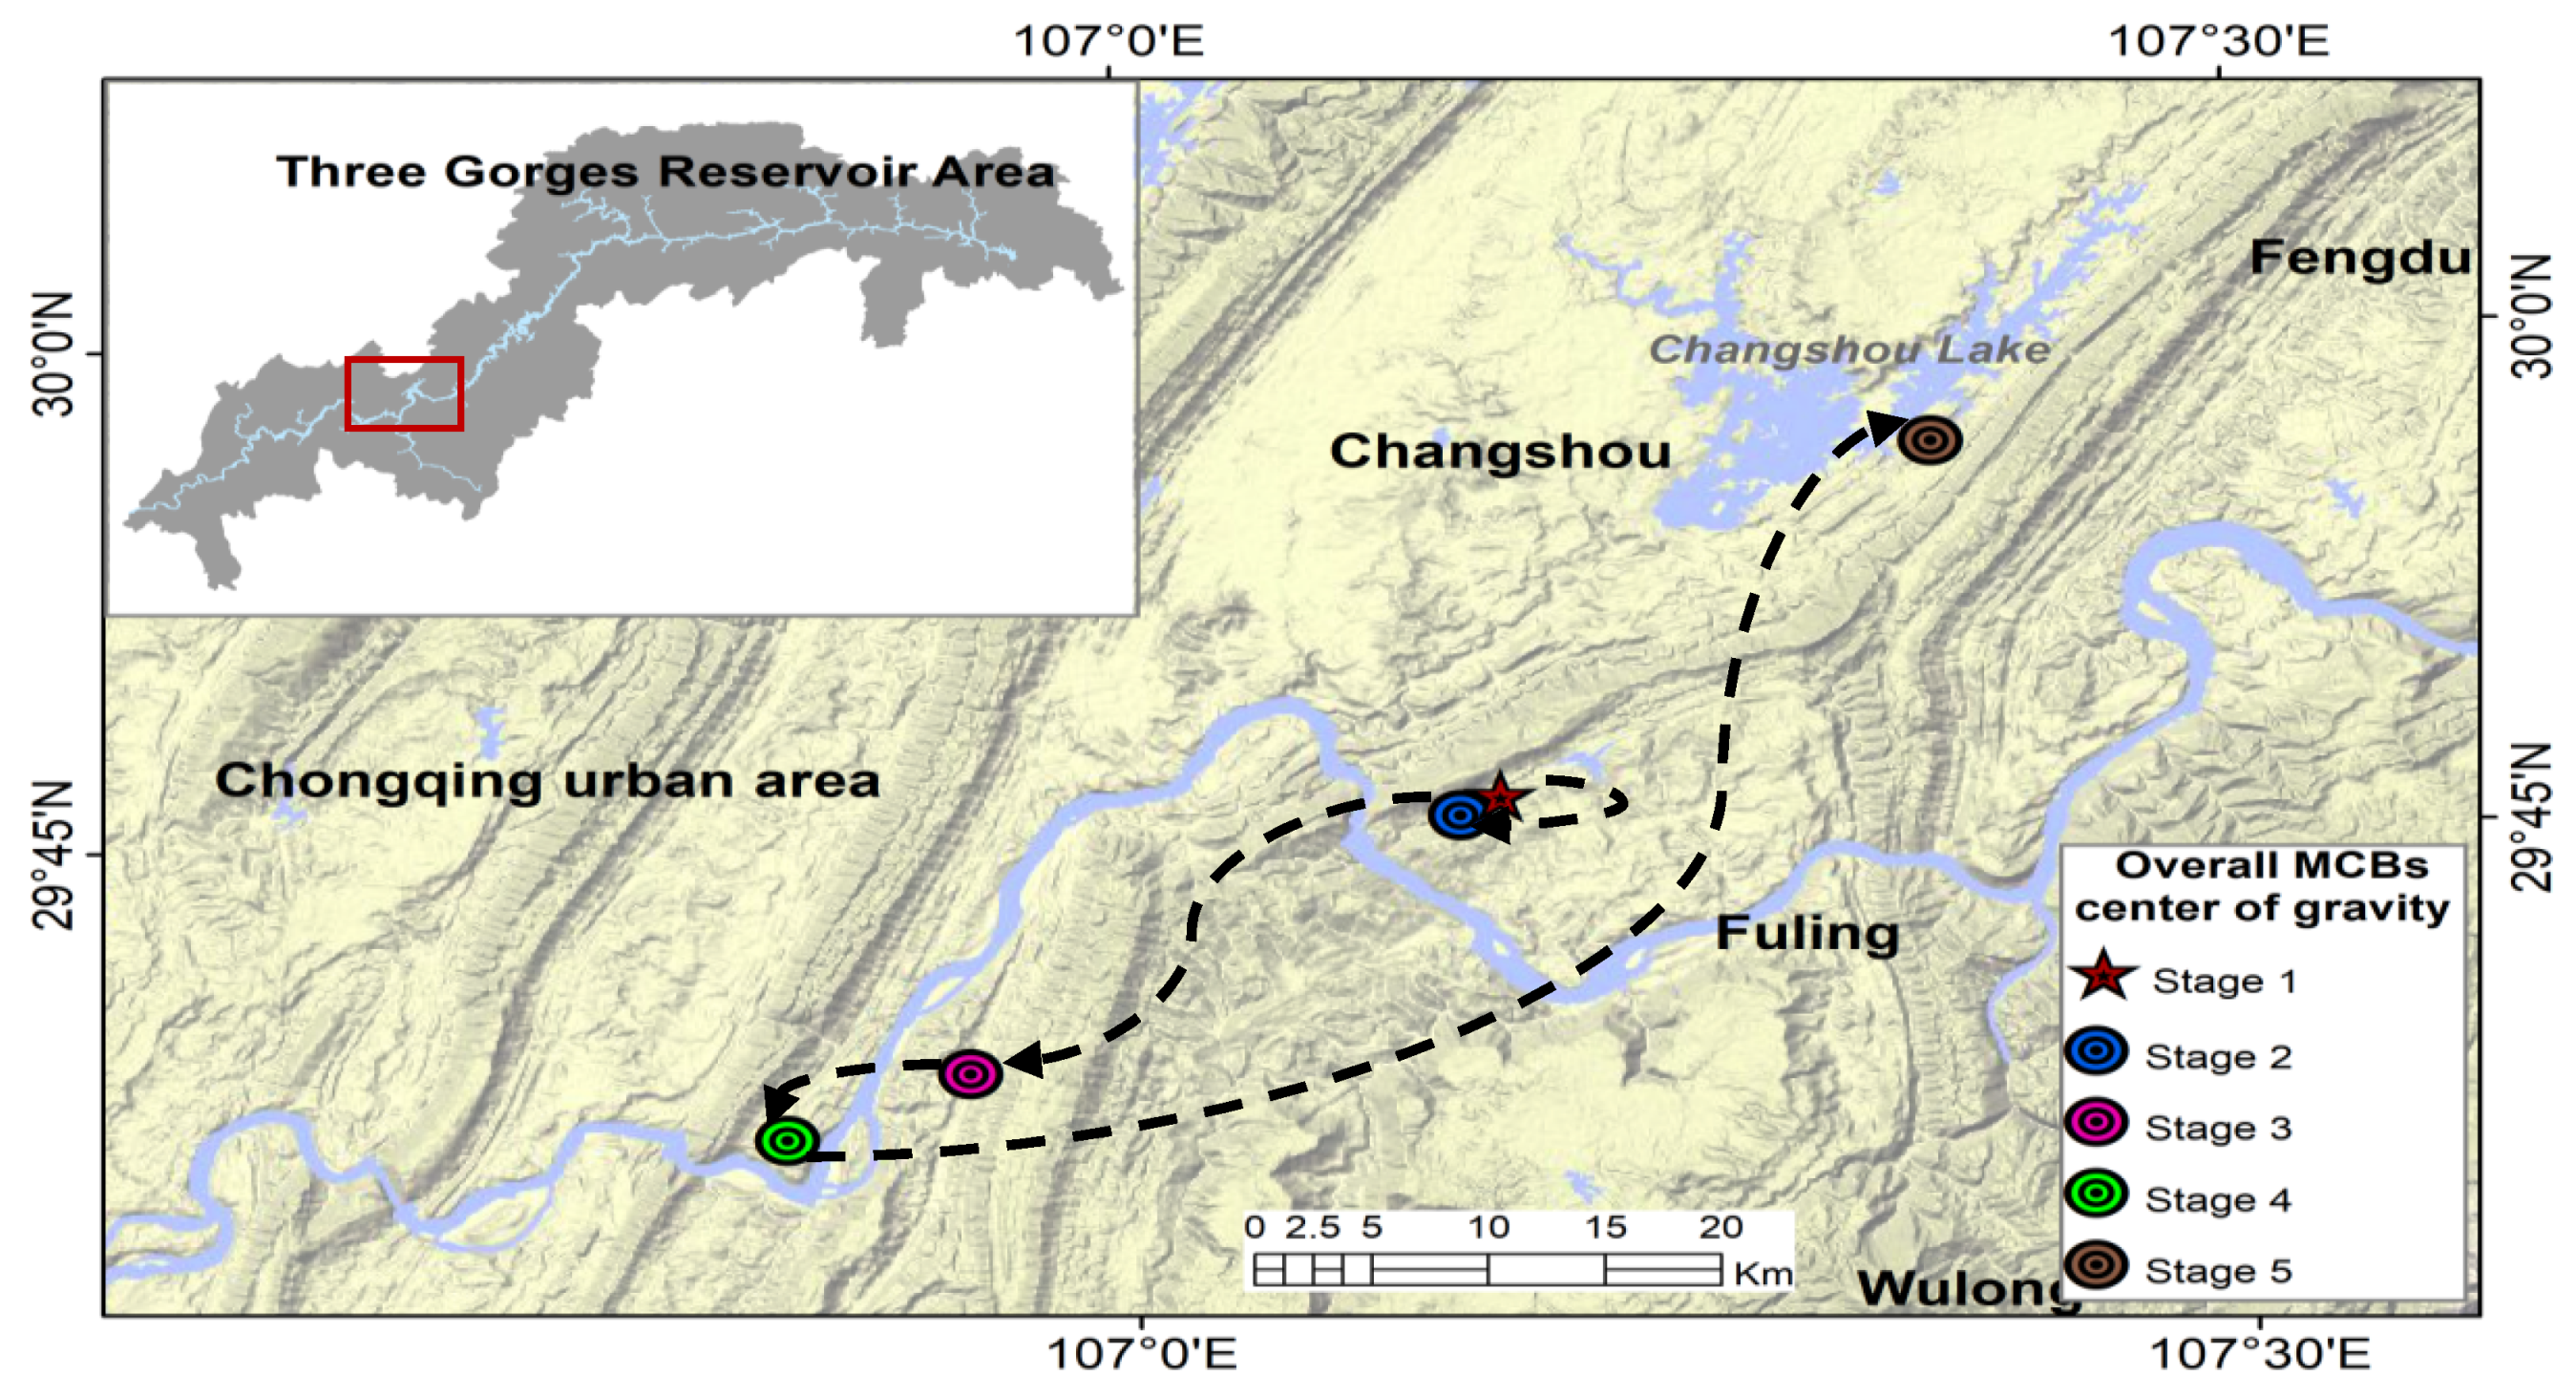
3.4. Gravity Center Migration of MCBs

The weighted gravity center by area of the MCBs was compared during different impoundment periods, and the migration routes are presented in Figure 9. Generally, the spatial location of the gravity center of the MCBs varied obviously with the water level changes during different water impoundment periods. The gravity center migrated 2.04 km south-westwards after the interception of the Yangtze River at stage 2. It continued to move south-westwards with the rising of the water level, with migration distances of 25.68 km and 9.39 km when the water level reached 139 m at stage 3 and 156 m at stage 4, respectively. The migration direction of MCBs was consistent with the tail direction of the TGR, which was significantly associated with the expansion of the inundation area towards the tail direction of the TGR induced by the rising water level. However, many new MCBs formed in the middle section of the TGR, owing to the inundation of low-lying mountain tops by the reservoir, induced by the water level rising to 175 m at stage 5. This resulted in a notable migration of the gravity center to the middle section of the TGR. As can been seen from Figure 8, the gravity center moved 70.63 km north-eastwards from stage 4 to stage 5, which was opposite to the migrations from stage 1 to stage 4.

4. Discussion

The Yangtze River had a natural hydrological and sediment regime before the construction of the TGD, where the MCBs developed with a relatively stable balance between erosion and siltation [37]. However, the construction of the TGD has significantly changed the hydrological and sediment regimes of the Yangtze River over the past decades, which has seriously disrupted this balance. Many previous observations and studies found tremendous riverbed erosion in the middle and lower reaches of the Yangtze River, mainly due to the intercepting of sediment and discharging of clear water since the initial impoundment of the TGD [30,32,41]. The degree of erosion became weaker as the distance from the TGD increased [5,23,28]. The MCBs in the TGR varied dramatically under the influence of notable changes in the hydrological and sediment regimes of the TGR induced by the weakened hydrodynamic condition and rising water levels from stage 1 to stage 5 [36,42]. The surface area of the TGR has expanded as the water level rose since the initial impoundment of the TGD [42,43]. This resulted in a large portion of the previous MCBs being submerged, contributing to a subsequent reduction in the areas of the exposed MCBs. Meanwhile, many new MCBs formed from the inundation of point bars and low-lying mountain tops by the reservoir (Figure 10). A large number of new MCBs appeared, especially in the area of the TGR with the largest fluctuations in water level, in Kaizhou county (Figure 11).
Human activities such as sand mining caused an unsaturated sediment transportation capacity of the flow of the TGR (Figure 12) before stage 3, which led to poor stability of the riverbed and MCBs in the TGR. In addition, the conversion from river to reservoir weakened the hydrodynamic condition when the water level reached 139 m at stage 3. The flow rate slowed and a great deal of sediment was trapped in the reservoir, and the water level was the dominant influence on the MCBs [43]. The morphology of the naturally developed MCBs often took typical forms such as oval, bamboo-leaf and sickle-shaped forms. However, the morphology of MCBs changed greatly as the water level rose, regulated by the man-made dam [6,7]. Due to the coupled effect of natural hydrological and sediment regimes and water-level changes regulated by the TGD, the MCBs in the fluctuating backwater zone of the TGR were more affected by siltation than those in the perennial backwater zones. Thus, more attention and protection should be paid to MCBs in fluctuating backwater zones.
However, limitations and uncertainties associated with the remote sensing image data may exist and need to be improved in future work. In the data acquisition stage, we did our best to collect Landsat images with similar times and water levels to reduce the potential effect on the morphology, numbers and areas of the retrieved MCBs. However, it is very difficult to obtain ideal image data, mainly due to the influence of cloud cover, the difference in spectral features and the revisit cycle of the Landsat satellite, leading to a certain degree of uncertainty in the analysis and results. Thus, more remote sensing images need to be employed and collected from other platforms to reduce the influence of acquisition times, spectral differences and water levels. In the context of the “storing clean water and discharging sandy water” operation schedule [7,8], the influence of the annually cyclic hydrological regime and the longer inundation and exposure induced by the TGR operation, the water level of the TGR fluctuated dramatically between 145 and 175 m, with increase periods from September to January in the following year, and decrease periods from January to September. The present study only investigated the dynamics of MCBs from October to January. It will be necessary to further investigate the changes in MCBs during the year.
Due to the coupled effect of natural hydrological and sediment regimes and water-level changes regulated by the TGD, the development mechanism of MCBs in the fluctuating backwater zones differed from that in the perennial backwater zones, and this was mainly influenced by water-level changes regulated by the TGD. This was not explored in this study. Nevertheless, the scientific findings help to reveal the mechanisms of the development of MCBs in the TGR and can also offer a scientific basis for planning, optimal utilization and ecological restoration of the MCBs in the TGR.

5. Conclusions

This work investigated the spatio-temporal variations in the number, area, morphology and location of MCBs in the TGR during different impoundment periods, using Landsat images. The results showed that the number of MCBs ranged between 89 and 150 with an average of 113, and the area varied greatly from 0.2 to 1134 (×10−2 km2) with an average of 31.69. The number and area of MCBs changed dramatically with the water-level changes induced by the impoundments and operation of the TGR. The total area of MCBs decreased progressively from stage 1 to stage 5, with the most significant changes occurring between stage 2 and stage 4. Although the number showed a decreasing trend, the minimum number appeared at stage 3, which was dominated by the change in the number of SMBs. The number and area variations of MCBs differed greatly among MCBs with different sizes, with the most obvious changes appearing for SMBs and LMBs, respectively. The LWR of MCBs in the TGR ranged between 2.09 and 3.05 with an average of 2.56. It generally decreased as the water level rose, suggesting that the morphology of MCBs tended to change from a narrow–long shape to a short–round shape. The LWR variation of MCBs differed greatly among different sizes, with the most obvious changes occurring in SMBs, suggesting that the effect of impoundment on the morphology of SMBs was more pronounced than the effect on MMBs, LMMBs and LMBs. The MCBs were unevenly distributed spatially. They were mostly distributed in the upper section of the TGR at stage 1, under a natural hydrological regime. The water impoundments of the TGR led to the migration of the dominant area from the upper to the middle section of the TGR, resulting in a more even distribution of MCBs in the TGR and the migration of the gravity center of MCBs from the upper to the middle section of the TGR.
This study showed the enormous impacts of the operation of the TGD on the morphological dynamics of MCBs. While the mechanisms of the development of MCBs in the TGR are complex, it will be necessary to investigate these changes further in the future.

Author Contributions

Q.T.: conceptualization, data curation and writing—original draft. D.T.: visualization, formal analysis and funding acquisition. Y.J.: software and methodology. L.Y.: investigation. S.Z.: funding acquisition. Q.C.: writing—review. S.W.: project administration. J.C.: resources, reviewing and supervision. All authors have read and agreed to the published version of the manuscript.

Funding

This research was funded by the Youth Innovation Promotion Association, grant number 2018417, 2021385, the National Natural Science Foundation of China, grant number 41901130, 42061015, the Strategic Priority Research Program of the Chinese Academy of Sciences, grant number XDA23040500, Chongqing Science and Technology project, grant number cstc2019jscx-dxwtBX0007, cstc2021jcyj-msxmX0187, Chongqing Municipal Bureau of Water Resources, grant number 5000002021BF40001 and the Institute of Agricultural Resources and Environment, Tibet Academy of Agricultural and Animal Husbandry Science, grant number 2020ZZKT-01.

Institutional Review Board Statement

Not applicable.

Informed Consent Statement

Not applicable.

Data Availability Statement

Landsat TM, Landsat OLI and the water level, sediment and siltation data for the TGR used in this paper can be downloaded from the Chinese Geospatial Data Cloud, Yangtze River Sediment Bulletin and the Yangtze River Three Gorges Group website.

Acknowledgments

We thank the funding supporters of this work, and the scientific research foundation provided by the Key Laboratory of Reservoir Aquatic Environment, Chinese Academy of Sciences.

Conflicts of Interest

The authors declare no conflict of interest.

References

  1. Słowik, M. Sedimentary record of point bar formation in laterally migrating anabranching and single-channel meandering rivers (The Obra Valley, Poland). Z. Geomorphol. 2016, 60, 259–279. [Google Scholar] [CrossRef]
  2. Afzalimehr, H.; Maddahi, M.R.; Sui, J. Bedform characteristics in a gravel-bed river. J. Hydrol. Hydromech. 2017, 65, 366–377. [Google Scholar] [CrossRef] [Green Version]
  3. Wang, P.; Fu, K.D.; Huang, J.; Duan, X.; Yang, Z. Morphological changes in the lower Lancang River due to extensive human activities. PeerJ 2020, 8, e9471. [Google Scholar] [CrossRef] [PubMed]
  4. Long, J.; Li, H.; Wang, Z.; Wang, B.; Xu, Y. Three decadal morphodynamic evolution of a large channel bar in the middle Yangtze River: Influence of natural and anthropogenic interferences. Catena 2021, 199, 105128. [Google Scholar] [CrossRef]
  5. Wen, Z.; Yang, H.; Zhang, C.; Shao, G.; Wu, S. Remotely Sensed Mid-Channel Bar Dynamics in Downstream of the Three Gorges Dam, China. Remote Sens. 2020, 12, 409. [Google Scholar] [CrossRef] [Green Version]
  6. Jaballah, M.; Camenen, B.; Pénard, L.; Paquier, A. Alternate bar development in an alpine river following engineering works. Adv. Water Resour. 2015, 81, 103–113. [Google Scholar] [CrossRef]
  7. Li, W.; Yang, S.; Xiao, Y.; Fu, X.; Hu, J.; Wang, T. Rate and Distribution of Sedimentation in the Three Gorges Reservoir, Upper Yangtze River. J. Hydraul. Eng. 2018, 144, 05018006. [Google Scholar] [CrossRef]
  8. Zhang, W.; Yuan, J.; Han, J.; Huang, C.; Li, M. Impact of the Three Gorges Dam on sediment deposition and erosion in the middle Yangtze River: A case study of the Shashi Reach. Hydrol. Res. 2016, 47, 175–186. [Google Scholar] [CrossRef] [Green Version]
  9. Wintenberger, C.L.; Rodrigues, S.; Claude, N.; Jugé, P.; Bréhéret, J.; Villar, M. Dynamics of nonmigrating mid-channel bar and superimposed dunes in a sandy-gravelly river (Loire River, France). Geomorphology 2015, 248, 185–204. [Google Scholar] [CrossRef]
  10. Klösch, M.; Blamauer, B.; Habersack, H. Intra-event scale bar-bank interactions and their role in channel widening. Earth Surf. Process. Landf. 2015, 40, 1506–1523. [Google Scholar] [CrossRef]
  11. Hooke, J.M.; Yorke, L. Channel bar dynamics on multi-decadal timescales in an active meandering river. Earth Surf. Process. Landf. 2011, 36, 1910–1928. [Google Scholar] [CrossRef]
  12. Wang, J.; Dai, Z.; Mei, X.; Lou, Y.; Wei, W.; Ge, Z. Immediately downstream effects of Three Gorges Dam on channel sandbars morphodynamics between Yichang-Chenglingji Reach of the Changjiang River, China. J. Geogr. Sci. 2018, 28, 629–646. [Google Scholar] [CrossRef] [Green Version]
  13. Li, D.F.; Lu, X.X.; Chen, L.; Wasson, R. Downstream geomorphic impact of the Three Gorges Dam: With special reference to the channel bars in the Middle Yangtze River. Earth Surf. Process. Landf. 2019, 44, 2660–2670. [Google Scholar] [CrossRef]
  14. Adami, L. Long Term Morphodynamics Ofalternate Bars in Straightenedrivers: A multiple Perspective. Ph.D. Thesis, The University of Trento, Trento, Italy, April 2016. [Google Scholar]
  15. Schuurman, F.; Kleinhans, M.G. Bar dynamics and bifurcation evolution in a modelled braided sand-bed river. Earth Surf. Process. Landf. 2015, 40, 1318–1333. [Google Scholar] [CrossRef]
  16. Yang, H. Numerical investigation of avulsions in gravel-bed braided rivers. Hydrol. Process. 2020, 34, 3702–3717. [Google Scholar] [CrossRef]
  17. Wang, D.; Ma, Y.; Liu, X.; Huang, H.Q.; Huang, L.; Deng, C. Meandering-anabranching river channel change in response to flow-sediment regulation: Data analysis and model validation. J. Hydrol. 2019, 579, 124209. [Google Scholar] [CrossRef]
  18. Crosato, A.; Mosselman, E.; Desta, F.B.; Uijttewaal, W.S. Experimental and numerical evidence for intrinsic nonmigrating bars in alluvial channels. Water Resour. Res. 2011, 47, 77–79. [Google Scholar] [CrossRef] [Green Version]
  19. Yang, H.; Lin, B.; Sun, J.; Huang, G. Simulating Laboratory Braided Rivers with Bed-Load Sediment Transport. Water 2017, 9, 686. [Google Scholar] [CrossRef] [Green Version]
  20. Redolfi, M.; Welber, M.; Carlin, M.; Tubino, M.; Bertoldi, W. Morphometric properties of alternate bars and water discharge: A laboratory investigation. Earth Surf. Dynam. 2020, 8, 789–808. [Google Scholar] [CrossRef]
  21. Tubino, M.; Repetto, R.; Zolezzi, G. Free bars in rivers. J. Hydraul. Res. 1999, 37, 759–775. [Google Scholar]
  22. Adami, L.; Bertoldi, W.; Zolezzi, G. Multidecadal dynamics of alternate bars in the Alpine Rhine River. Water Resour. Res. 2016, 52, 8921–8938. [Google Scholar] [CrossRef]
  23. Lyu, Y.; Fagherazzi, S.; Tan, G.; Zheng, S.; Feng, Z.; Han, S.; Shu, C. Hydrodynamic and geomorphic adjustments of channel bars in the Yichang-Chenglingji Reach of the Middle Yangtze River in response to the Three Gorges Dam operation. Catena 2020, 193, 104628. [Google Scholar] [CrossRef]
  24. Cyples, N.; Ielpi, A.; Dirszowsky, R.W. Planform and stratigraphic signature of proximal braided streams: Remote-sensing and ground-penetrating-radar analysis of the Kicking Horse River, Canadian Rocky Mountains. J. Sediment. Res. 2020, 90, 131–149. [Google Scholar] [CrossRef]
  25. Liu, X.; Huang, H.; Ddeng, C. A theoretical investigation of the hydrodynamic conditions for equilibrium island morphology in anabranching rivers. Adv. Water Sci. 2014, 25, 477–483. [Google Scholar]
  26. Rasbold, G.G.; Stevaux, J.C.; Parolin, M.; Leli, I.T.; Luz, L.D.; Guerreiro, R.L.; Brito, H.D. Sponge spicules as indicators of paleoenvironmental changes in island deposits-Upper Paraná River, Brazil. Palaeogeogr. Palaeoclimatol. Palaeoecol. 2019, 536, 109391. [Google Scholar] [CrossRef]
  27. Fu, B.-J.; Wu, B.-F.; Lue, Y.-H.; Xu, Z.-H.; Cao, J.-H.; Niu, D.; Yang, G.-S.; Zhou, Y.-M. Three Gorges Project: Efforts and challenges for the environment. Prog. Phys. Geogr. Earth Environ. 2010, 34, 741–754. [Google Scholar] [CrossRef]
  28. Lou, Y.; Mei, X.; Dai, Z.; Wang, J.; Wei, W. Evolution of the mid-channel bars in the middle and lower reaches of the Changjiang (Yangtze) River from 1989 to 2014 based on the Landsat satellite images: Impact of the Three Gorges Dam. Environ. Earth Sci. 2018, 77, 394. [Google Scholar] [CrossRef]
  29. Edmonds, R.L. The Sanxia (3 Gorges) Project—The environmental argument surrounding China super dam. Glob. Ecol. Biogeogr. Lett. 1992, 2, 105–125. [Google Scholar] [CrossRef]
  30. Gao, B.; Yang, D.; Yang, H. Impact of the Three Gorges Dam on flow regime in the middle and lower Yangtze River. Quatern. Int. 2013, 304, 43–50. [Google Scholar] [CrossRef]
  31. Gao, C.; Chen, S.; Yu, J. River islands’ change and impacting factors in the lower reaches of the Yangtze River based on remote sensing. Quatern. Int. 2013, 304, 13–21. [Google Scholar] [CrossRef]
  32. Yang, S.L.; Milliman, J.D.; Li, P.; Xu, K. 50,000 dams later: Erosion of the Yangtze River and its delta. Glob. Planet. Chang. 2011, 75, 14–20. [Google Scholar] [CrossRef]
  33. Wang, Z.; Li, H.; Cai, X. Remotely Sensed Analysis of Channel Bar Morphodynamics in the Middle Yangtze River in Response to a Major Monsoon Flood in 2002. Remote Sens. 2018, 10, 1165. [Google Scholar] [CrossRef] [Green Version]
  34. Ren, S.; Zhang, B.; Wang, W.; Yuan, Y.; Guo, C. Sedimentation and its response to management strategies of the Three Gorges Reservoir, Yangtze River, China. Catena 2021, 199, 105096. [Google Scholar] [CrossRef]
  35. Chen, J.; Yang, H.; Lv, M.; Xiao, Z.; Wu, S. Estimation of monthly pan evaporation using support vector machine in Three Gorges Reservoir Area, China. Theor. Appl. Climatol. 2019, 138, 1095–1107. [Google Scholar] [CrossRef]
  36. Xiang, R.; Wang, L.; Li, H.; Tian, Z.; Zheng, B. Temporal and spatial variation in water quality in the Three Gorges Reservoir from 1998 to 2018. Sci. Total Environ. 2021, 768, 144866. [Google Scholar] [CrossRef]
  37. Xu, H. Modification of normalised difference water index (NDWI) to enhance open water features in remotely sensed imagery. Int. J. Remote Sens. 2006, 27, 3025–3033. [Google Scholar] [CrossRef]
  38. McFeeters, S.K. The use of the Normalized Difference Water Index (NDWI) in the delineation of open water features. Int. J. Remote Sens. 1996, 17, 1425–1432. [Google Scholar] [CrossRef]
  39. Li, Z.; Wang, Z.; Zhang, K. Relationship between morphology of typical sand bars and river channels. J. Sediment. Res. 2012, 1, 68–73. (In Chinese) [Google Scholar]
  40. Hu, L.; Jiang, C.; Li, Z.B.; Zhang, X.; Li, P.; Wang, Q.; Zhang, W.J. Evolution Path Analysis of Economic Gravity Center and Air Pollutants Gravity Center in Shaanxi Province. Adv. Mater. Res. 2012, 361–363, 1359–1363. [Google Scholar] [CrossRef]
  41. Huang, H.; Deng, C.; Nanson, G.C.; Fan, B.; Liu, X.; Liu, T.; Ma, Y. A test of equilibrium theory and a demonstration of its practical application for predicting the morphodynamics of the Yangtze River. Earth Surf. Process. Landf. 2014, 39, 669–675. [Google Scholar] [CrossRef]
  42. Ji, Y.; Tang, Q.; Yan, L.; Wu, S.; Yan, L.; Tan, D.; Chen, J.; Chen, Q. Spatiotemporal Variations and Influencing Factors of Terrestrial Evapotranspiration and Its Components during Different Impoundment Periods in the Three Gorges Reservoir Area. Water 2021, 13, 2111. [Google Scholar] [CrossRef]
  43. Tang, Q.; Bao, Y.; He, X.; Fu, B.; Collins, A.L.; Zhang, X. Flow regulation manipulates contemporary seasonal sedimentary dynamics in the reservoir fluctuation zone of the Three Gorges Reservoir, China. Sci. Total Environ. 2016, 548, 410–420. [Google Scholar] [CrossRef] [PubMed]
Figure 1. Geographic location of the study area.
Water 13 03427 g001
Figure 2. The water-level changes of TGR and division of impoundment period.
Water 13 03427 g002
Figure 3. Number and area changes for MCBs during different impoundment periods: (a) number, (b) total area and (c) average area.
Water 13 03427 g003
Figure 4. Number and area changes in MCBs with different sizes: (a) number, (b) area.
Water 13 03427 g004
Figure 5. LWR changes in MCBs with different sizes: (a) whole, (b) SMBs, (c) MMBs, (d) LMMBs and (e) LMBs.
Water 13 03427 g005
Figure 6. Relationship between CV of LWR and area of MCBs with different sizes in different impoundment periods: (a) stage 1, (b) stage 2, (c) stage 3, (d) stage 4 and (e) stage 5.
Water 13 03427 g006
Figure 7. Spatial distribution and changes in the number of MCBs in different impoundment periods: (a) stage 1, (b) stage 2, (c) stage 3, (d) stage 4 and (e) stage 5.
Water 13 03427 g007
Figure 8. Spatial distribution and changes in the area of MCBs in different impoundment periods: (a) stage 1, (b) stage 2, (c) stage 3, (d) stage 4 and (e) stage 5.
Water 13 03427 g008aWater 13 03427 g008b
Figure 9. Gravity center migration of MCBs during different impoundment periods.
Water 13 03427 g009
Figure 10. Schematic diagram of impacts of water-level rising on MCBs of the TGR.
Water 13 03427 g010
Figure 11. MCBs formed by the flooding of low-lying mountain tops: (a) Three Gorges Reservoir Area, (b) in Zhongxian and (c) in Kaizhou.
Water 13 03427 g011
Figure 12. Water discharge and sediment amounts at the three key gauging stations in the different impoundment periods. (a) Annual runoff volume from 2002 to 2019, (b) annual sediment amount from 2002 to 2019 and (c) annual sedimentation amount from 2000 to 2019.
Water 13 03427 g012
Table 1. Detailed information on the collected remote sensing images.
Impoundment
Period
SensorAcquisition DateNumberResolutionData Sources
Stage 1Landsat5 TM24 January 1993, 29 January 1994,
1 November 1995, 17 November 1995,
26 December 1995, 5 February 1996
630 mGeospatial Data Cloud
Stage 2Landsat5 TM5 November 2000, 17 January 2001,
10 February 2001, 12 March 2001,
27 December 2001, 8 January 2002,
28 November 2002
730 mGeospatial Data Cloud
Stage 3Landsat5 TM24 January 2004, 7 December 2004,
6 January 2005, 2 February 2005,
7 December 2005, 2 January 2006,
4 February 2006
730 mGeospatial Data Cloud
Stage 4Landsat5 TM3 February 2007, 1 March 2007,
22 February 2008, 23 March 2008,
15 November 2008, 21 November 2008
2 December 2008, 3 February 2009
830 mGeospatial Data Cloud
Stage 5Landsat8 OLI22 January 2015, 17 December 2015,
25 January 2016, 15 November 2016,
22 December 2017, 31 December 2017,
14 January 2018, 12 February 2018
830 mGeospatial Data Cloud
Publisher’s Note: MDPI stays neutral with regard to jurisdictional claims in published maps and institutional affiliations.

