Article

Study on Health Evaluation of an Ecological Irrigation District in Helan County, China

1
College of Water Conservancy and Civil Engineering, Shandong Agricultural University, Tai’an 271018, China
2
State Key Laboratory of Simulation of Water Cycle in River Basin, China Institute of Water Resources and Hydropower Research, Beijing 100038, China
*
Authors to whom correspondence should be addressed.
These authors contributed equally to this work as first co-authors.
Water 2021, 13(23), 3325; https://doi.org/10.3390/w13233325
Submission received: 5 October 2021 / Revised: 18 November 2021 / Accepted: 19 November 2021 / Published: 23 November 2021
(This article belongs to the Special Issue Water and Soil Resources Management in Agricultural Areas)

Abstract

:
The construction of ecological irrigation districts is of great significance to protect the Yellow River ecology and achieve sustainable development of the local ecological economy. Taking the ecological irrigation district of Helan County as the study area, a health evaluation index system of the irrigation district was established, including three primary indexes of ecological environment, modernization level, and agricultural production and benefit, and 20 secondary indexes. Then, the Topsis method, entropy weight evaluation method, fuzzy pattern recognition model, and variable fuzzy model were used to evaluate the health of the Helan ecological irrigation district. In order to avoid the one-sidedness of the evaluation results of a single evaluation method, a combined evaluation method named deviation maximization combined evaluation method was used to combine each single evaluation result. The evaluation results by the combined evaluation method showed the following: (1) The ecological health of Helan irrigation district had a trend of becoming better from 2007 to 2016. (2) The grey correlation analysis showed that the soil salt content, groundwater depth, canal lining rate, ratio of efficient water-saving irrigation area, information level of the irrigation district, water productivity, agricultural unilateral aquatic output value, irrigation water consumption per mu, and coefficient of effective utilization of farmland irrigation water were closely related to the evaluation results. (3) In order to effectively improve the ecological health of Helan irrigation districts, it is necessary to reduce soil salt content and groundwater salinity, increase canal linings, promote water-saving irrigation measures, and agricultural information construction, etc.

1. Introduction

China is a country with a large population and agriculture. Additionally, agricultural modernization is one of the goals of national modernization. Apart from modernization, the construction of an ecological civilization and sustainable development are both also highly valued by China. Irrigation districts, which exhibit an important infrastructure of agriculture and rural areas, play an important role in guaranteeing national food security, promoting farmers’ continuous income increase, improving the rural ecological environment, and balancing urban and rural development [1]. The ecological irrigation districts arose with the integration of ecological problems in the modern agricultural production system. It greatly solved the ecological environment problems caused by traditional irrigation districts and became the main development direction of agricultural irrigation district construction. At present, the study of ecological irrigation districts mainly focuses on its concept and evaluation. The concept and evaluation are emphatically studied for the purpose of interpreting the characteristics of ecological irrigation districts and defining the parts of non-ecological irrigation districts, which is convenient for targeted treatments.
The concept of ecological irrigation district originates from the water-saving irrigation district. However, it is not limited to the improvement of the efficiency of water resource utilization; the potential for expansion should be further considered. This concept, which is undergoing proposal, continuous deepening and refinement, and interpretation from its initial abstract description, reflects people’s expectations for the future construction of irrigation districts under certain economic and social conditions. Schaeffer [2] first put forward the concept of ecological irrigation districts. Jiang [3] proposed that a self-sustaining and economically feasible virtuous cycle system should be required by ecological irrigated districts based on ecological theories. Mao [4] advocated for the construction of a water-saving and ecological irrigation district, which can maintain and promote the virtuous cycle development of the irrigation district, and improve the use of water resources, economic, and environmental resources. Based on the analysis and summary of the development concepts of China’s irrigation districts in different historical periods, Gu et al. [5] believed that ecological irrigation districts should be a new type of district with perfect engineering systems, scientific and efficient resource utilization, healthy irrigation district ecosystems, significant benefits for agriculture and sidings, coordination between irrigation districts and river basins, and sustainable development. Yang et al. [6] proposed that an ecological irrigation district should be guided by the harmony between humans and nature. An ecological irrigation district is a modern and advanced irrigation district mode with healthy ecosystems, efficient use of resources, scientific and orderly management, and support of engineering facilities. The construction of the index system is the primary health evaluation problem in ecological irrigation districts. Bos [7], Bottrall and Mundial [8], and Abernethy [9] presented empirical indexes for performance evaluation when classifying irrigation performance indexes, including productivity, fairness, utility, cost-effectiveness, and sustainability et al., which were mainly used to measure the performance of direct irrigation water elements. Later, Bos [10] further proposed other indexes for irrigation management via a system containing 40 indexes, such as water shortage, maintenance, environmental sustainability, socio-economic and management indexes, etc. In 1990, Brookers [11] indicated that ecological irrigation districts can also continuously maintain the stability of the surrounding environment and keep high productivity and sustainability. Charles et al. [12,13] designed a set of special programs for the comprehensive evaluation of established irrigation systems. The main technical indexes in these programs included uniformity, possible surface runoff, abnormal pressure loss, etc., and the main comprehensive indexes included irrigation district characteristics, crop evaporation, water transport, water quality, power charges and water charges. Many of these indicators require measured results of the operation of the system. Therefore, it is more effective to improve the operation and management level of irrigation systems. Because many indexes need the measured data of the irrigation system, it is more effective to improve the operation and management level of the irrigation system. In 1998, the International Water Management Institute [14] published and reviewed nine irrigation performance indexes, most of which relate the yield of irrigated agriculture to major inputs of water, land, and capital. Furthermore, members of the International Commission on Irrigation & Drainage (ICID) described in detail the types and properties of indexes for irrigation system evaluation, providing a 77 indexes system with a classification of four groups, including water balance, environment, economy, and emerging indexes [15]. They concluded that the indexes of each group should be combined in the evaluation because performance was evaluated from different perspectives.
Due to the complexity of the factors influencing the health of ecological irrigation districts, whether the evaluation model is properly constructed will directly affect the accuracy of the health evaluation of ecological irrigation districts. In recent years, with the rapid development of various evaluation methods and artificial intelligence algorithms, they are widely used in irrigation district evaluations, such as fuzzy set theory, artificial neural network, support vector machine, and so on. Lilenfeld et al. [16] used data envelopment method to estimate the wastewater of agricultural irrigation in Kansas, USA. Komaragiri [17] used the multi-attribute utility theory to evaluate the irrigation system and achieved good results. Okada et al. [18,19] analyzed the engineering transformation of irrigation districts by the analytic hierarchy process (AHP). Garcia-Melon et al. [20] appraised farmland based on the analytic network process. Hu [21] used the fuzzy hierarchical comprehensive evaluation model to evaluate the ecology of irrigation districts. Nowadays, a single evaluation method is usually applied to obtain the evaluation results in most studies [22,23,24,25,26,27,28,29,30,31,32]. However, the results were not always inconsistent even when evaluating the same sample, owing to the different evaluation mechanisms, dimensionless mode, and weights of evaluation indexes. There are two shortcomings in the single evaluation method: (1) the single evaluation method only evaluates the evaluation object from a certain angle, which leads to information loss and omission; (2) different single evaluation methods obtain different evaluation ranking, but there is currently no unified method to judge the advantages and disadvantages of various evaluation methods. It is common to have inconsistency in various evaluation methods. It is also incomplete to use only one method for evaluation. In order to solve the above problems, a combination evaluation methods is put forward to combine each single evaluation result. In order to achieve the purpose of using more sample information, various single evaluation methods with the same property are integrated together through a combined evaluation method to eliminate the boundedness of a single evaluation method.
Ningxia Yellow River Diversion Irrigation district is located in the upper reaches of the Yellow River between the Lower Riverside and Shizuishan hydrological stations, along the two sides of the Yellow River terrain, which presents a “J”-shaped zoning distribution. It is located in a mid-temperate arid area with a continental climate, with characteristics of drought, little rain and strong evaporation. The Helan County of Ningxia Hui Autonomous Region is located in the core area of the Yellow River Diversion Irrigation district. The construction of the ecological irrigation district is of great significance to protect the Yellow River ecology and achieve the sustainable development of the local ecological economy. In this study, ecological health evaluation was carried out taking the Helan County ecological irrigation district as an example. Firstly, the geographical location and natural conditions of this ecological irrigation district are described. Secondly, evaluation indexes and their criteria of ecological health in the irrigation district are established, including three primary indexes of ecological environment, modernization level, and agricultural production and benefit, and 20 secondary indexes. Thirdly, a combination evaluation method named deviation maximization combined evaluation method combining the Topsis method, entropy weight evaluation method, fuzzy pattern recognition model, and variable fuzzy model is established. Finally, the main factors affecting the evaluation results are identified via grey correlation analysis, proposing the rectification measures for irrigation districts subsequently. The structure of this article is shown in Figure 1.

2. Materials and Methods
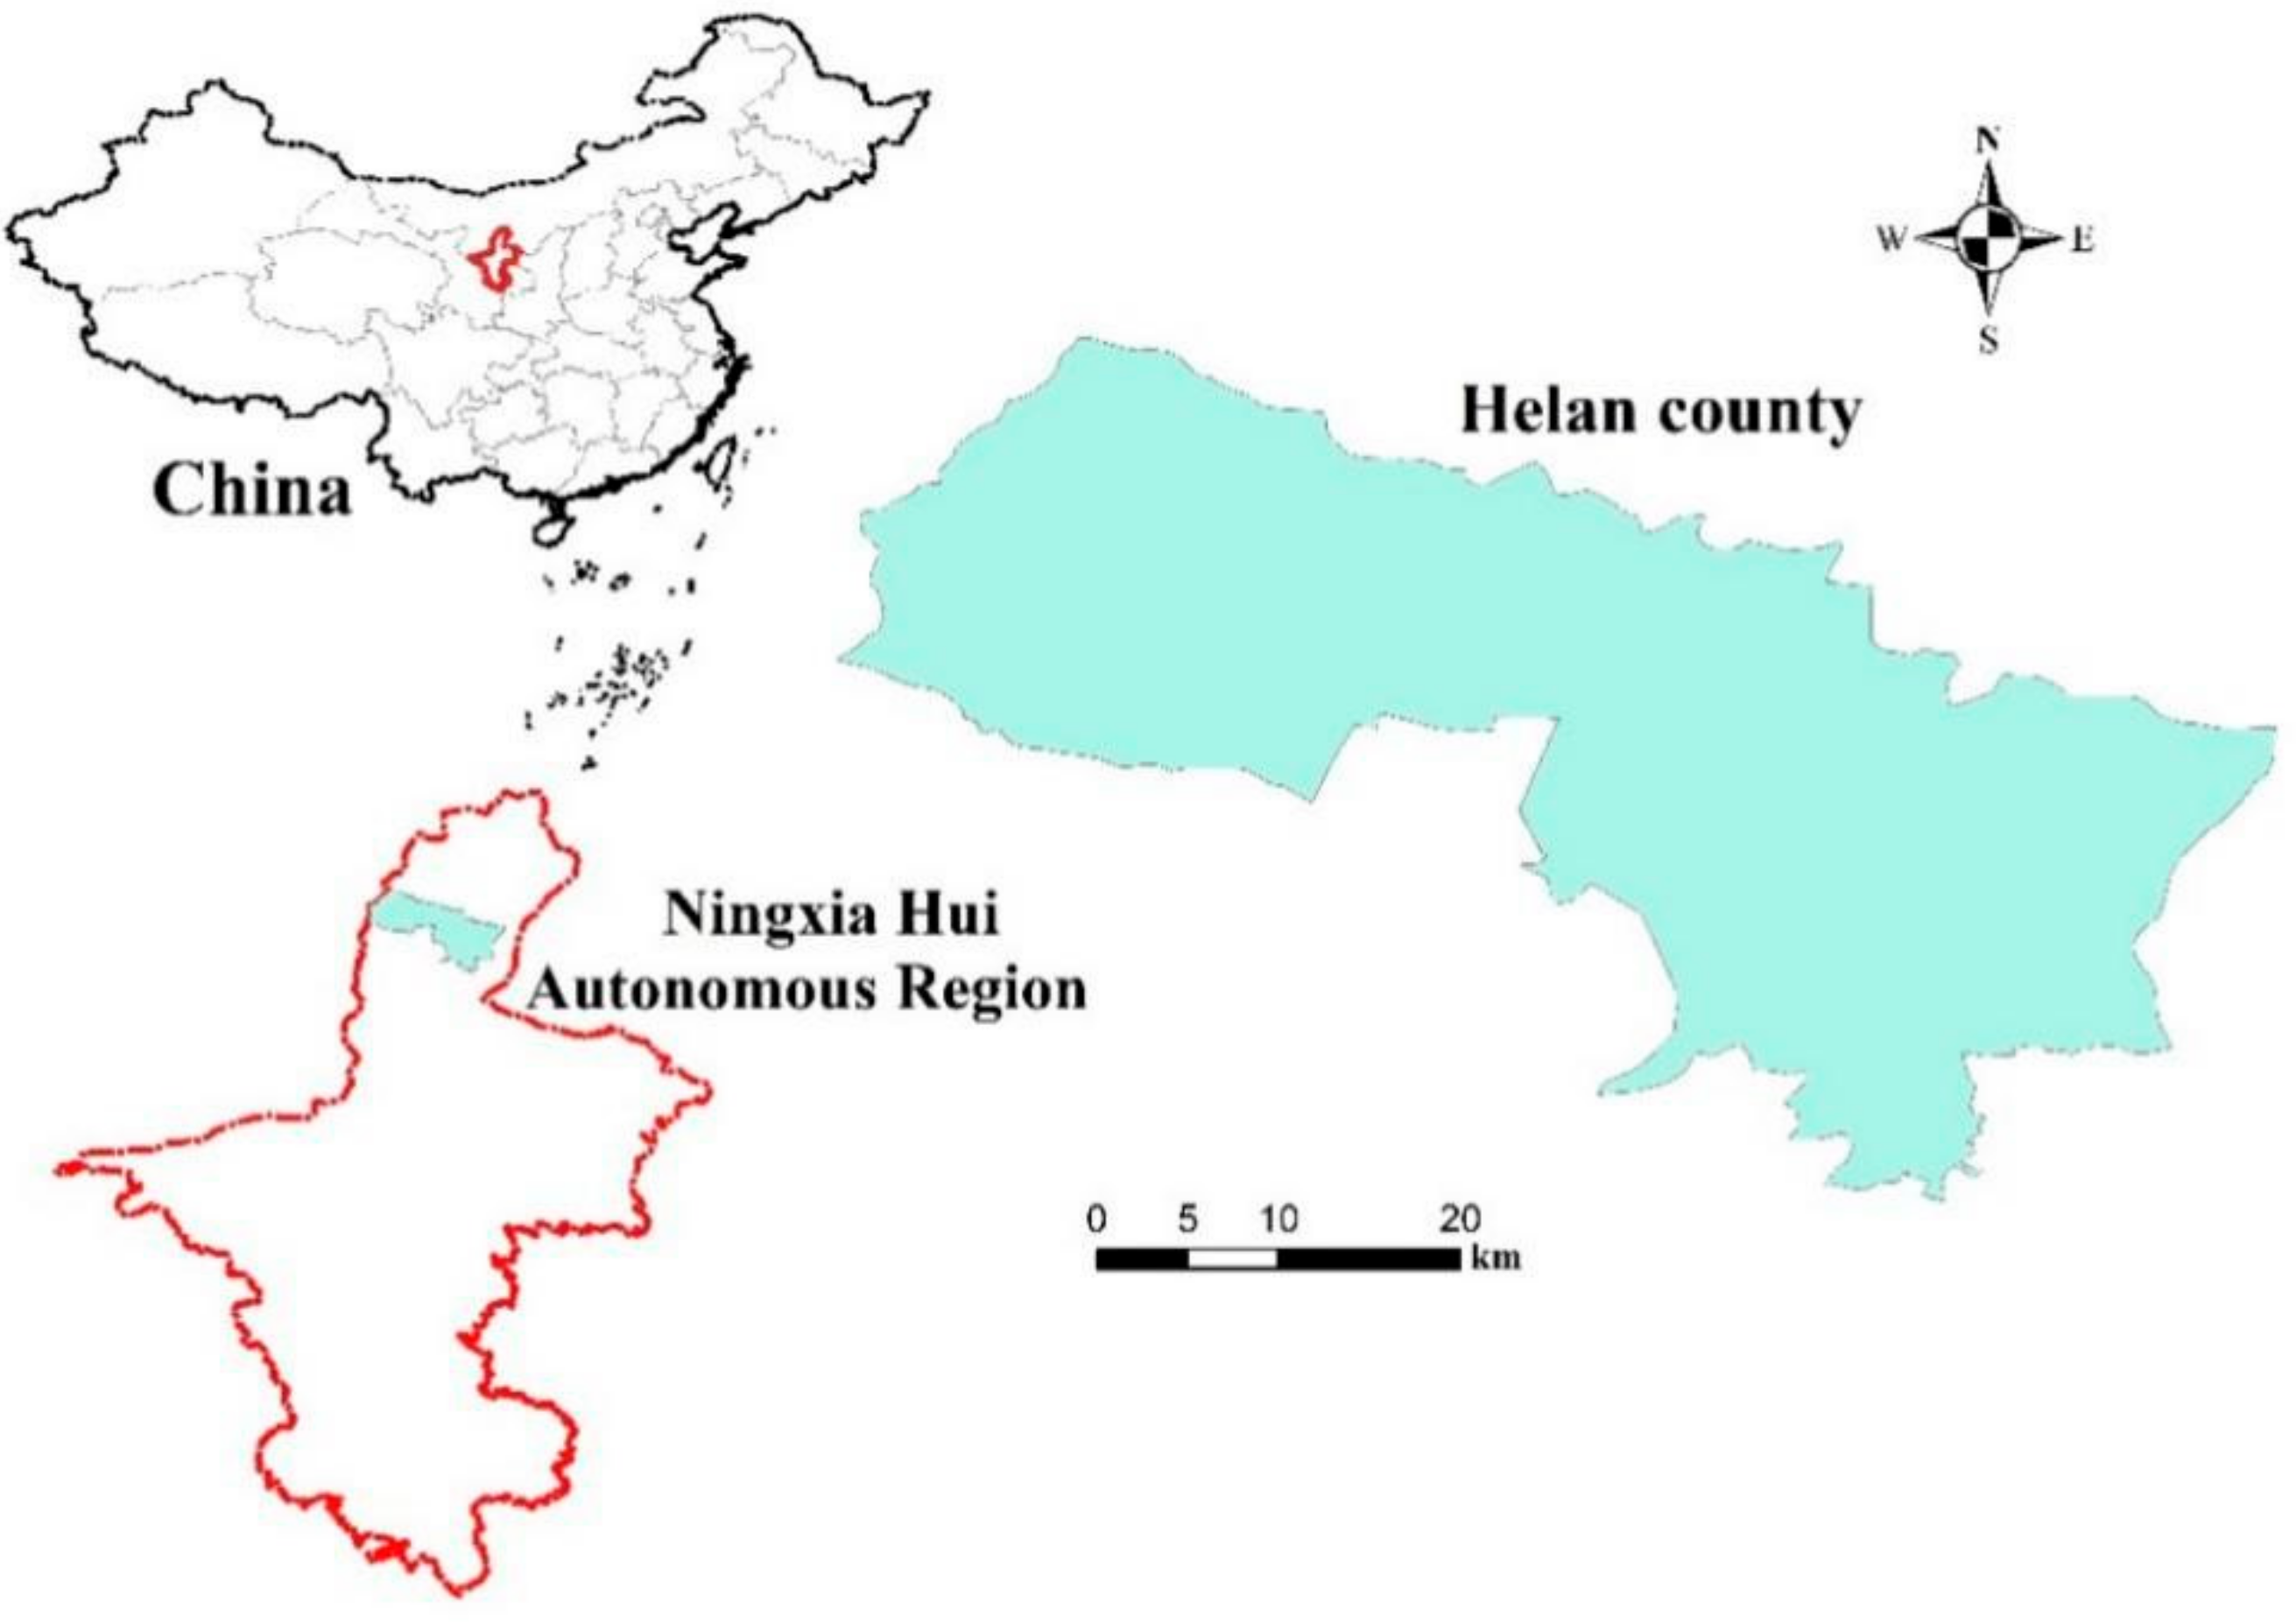
2.1. Study Area

Helan County is located in the north-central part of the Ningxia Hui Autonomous Region, under the jurisdiction of Yinchuan City, China. The geographical coordinates are between 105°53′ E~106°36′ E and 38°26′ N~38°48′ N, with a land area of 1595.5 km2. The specific geographical location is shown in Figure 2. Helan County is mainly composed of western mountains and central and eastern plains. The altitude of Helan Mountain in the west is more than 1400 m. The sloping plain in the eastern foot of Helan Mountain and the Yellow River alluvial plain in the center and east are 1122~1400 m and 1000~1122 m above sea level, respectively. The Yellow River alluvial plain has a flat terrain and deep soil layer, which has been cultivated for more than 2000 years.
The Helan ecological irrigation district is adjacent to the Helan Mountain in the west and the Yellow River in the east, which is located in the north-central part of the Qingtongxia irrigation district. It belongs to the temperate continental monsoon climate with annual sunshine hours ranging from 2851 to 3106 h, an effective cumulative temperature of 1534.9 °C, and an effective cumulative temperature of 961.6 °C from July to September. The multi-year mean relative humidity is 58.0% with the lowest and highest value of 45.7% and 71.7%. The annual average wind speed is 2.2 m/s. Sandstorms mostly occur in spring and soil erosion is relatively heavy. The annual precipitation is 193 mm, which is mostly concentrated in June to September of each year, accounting for 80% of the annual precipitation. More precisely, 50–60% of the annual precipitation concentrates in July to August. The annual evaporation capacity is 1716.8 mm varying greatly within a year, which is mainly influenced by air temperature, sunshine, humidity, and wind speed. In winter, the evaporation capacity is small, and Helan County is rich in light, water, and heat resources, which is conducive to the growth, development, and nutrient accumulation of crops.

2.2. Construction of Health Evaluation Index System of Ecological Irrigation Districts

2.2.1. Principles for Constructing a Health Evaluation Index System of Ecological Irrigation Districts

A reasonable evaluation index system is the basis of ecological irrigation district evaluation. The principles of representativeness, systematicness, gradation, independence, and operability should be considered when selecting evaluation indexes for an ecological irrigation district. Representativeness means that the selected indexes should be able to characterize the essential features of the ecological irrigation district. Meanwhile, each index should characterize the health features of the ecological irrigation district from various different perspectives. Systematicness means that the selected indexes must form a complete system. Gradation means that the selected indexes should be composed of different levels and elements. Independence means that the selected indexes should avoid overlapping information as much as possible. Operability means that the selected indexes should be easy to obtain and calculate.

2.2.2. Health Evaluation Index System of the Ecological Irrigation District

A reasonable index system for evaluating the health of the ecological irrigation district was established with reference to existing results. This system considered the principles of index selection and the actual condition of the ecological irrigation district in Helan County, with the ecological health of the irrigation district as an evaluation objective. This evaluation index system includes 3 primary indexes and 20 secondary indexes, of which the 3 primary indexes are the ecological environment, the modernization level, and the agricultural production and benefit of the irrigation district. The meaning and unit of each index are shown in Table 1.
By consulting statistical yearbooks of Helan County, Yinchuan City and the Ningxia Hui Autonomous Region, water resource bulletins of Yinchuan City and the Ningxia Hui Autonomous Region, the Ningxia water conservancy statistical bulletin, the Helan county development planning and water resource allocation plan etc., the data of 20 secondary indexes of the Helan ecological irrigation district from 2007 to 2016 was collected.

2.2.3. Classification of Health Evaluation Indexes of Ecological Irrigation Districts
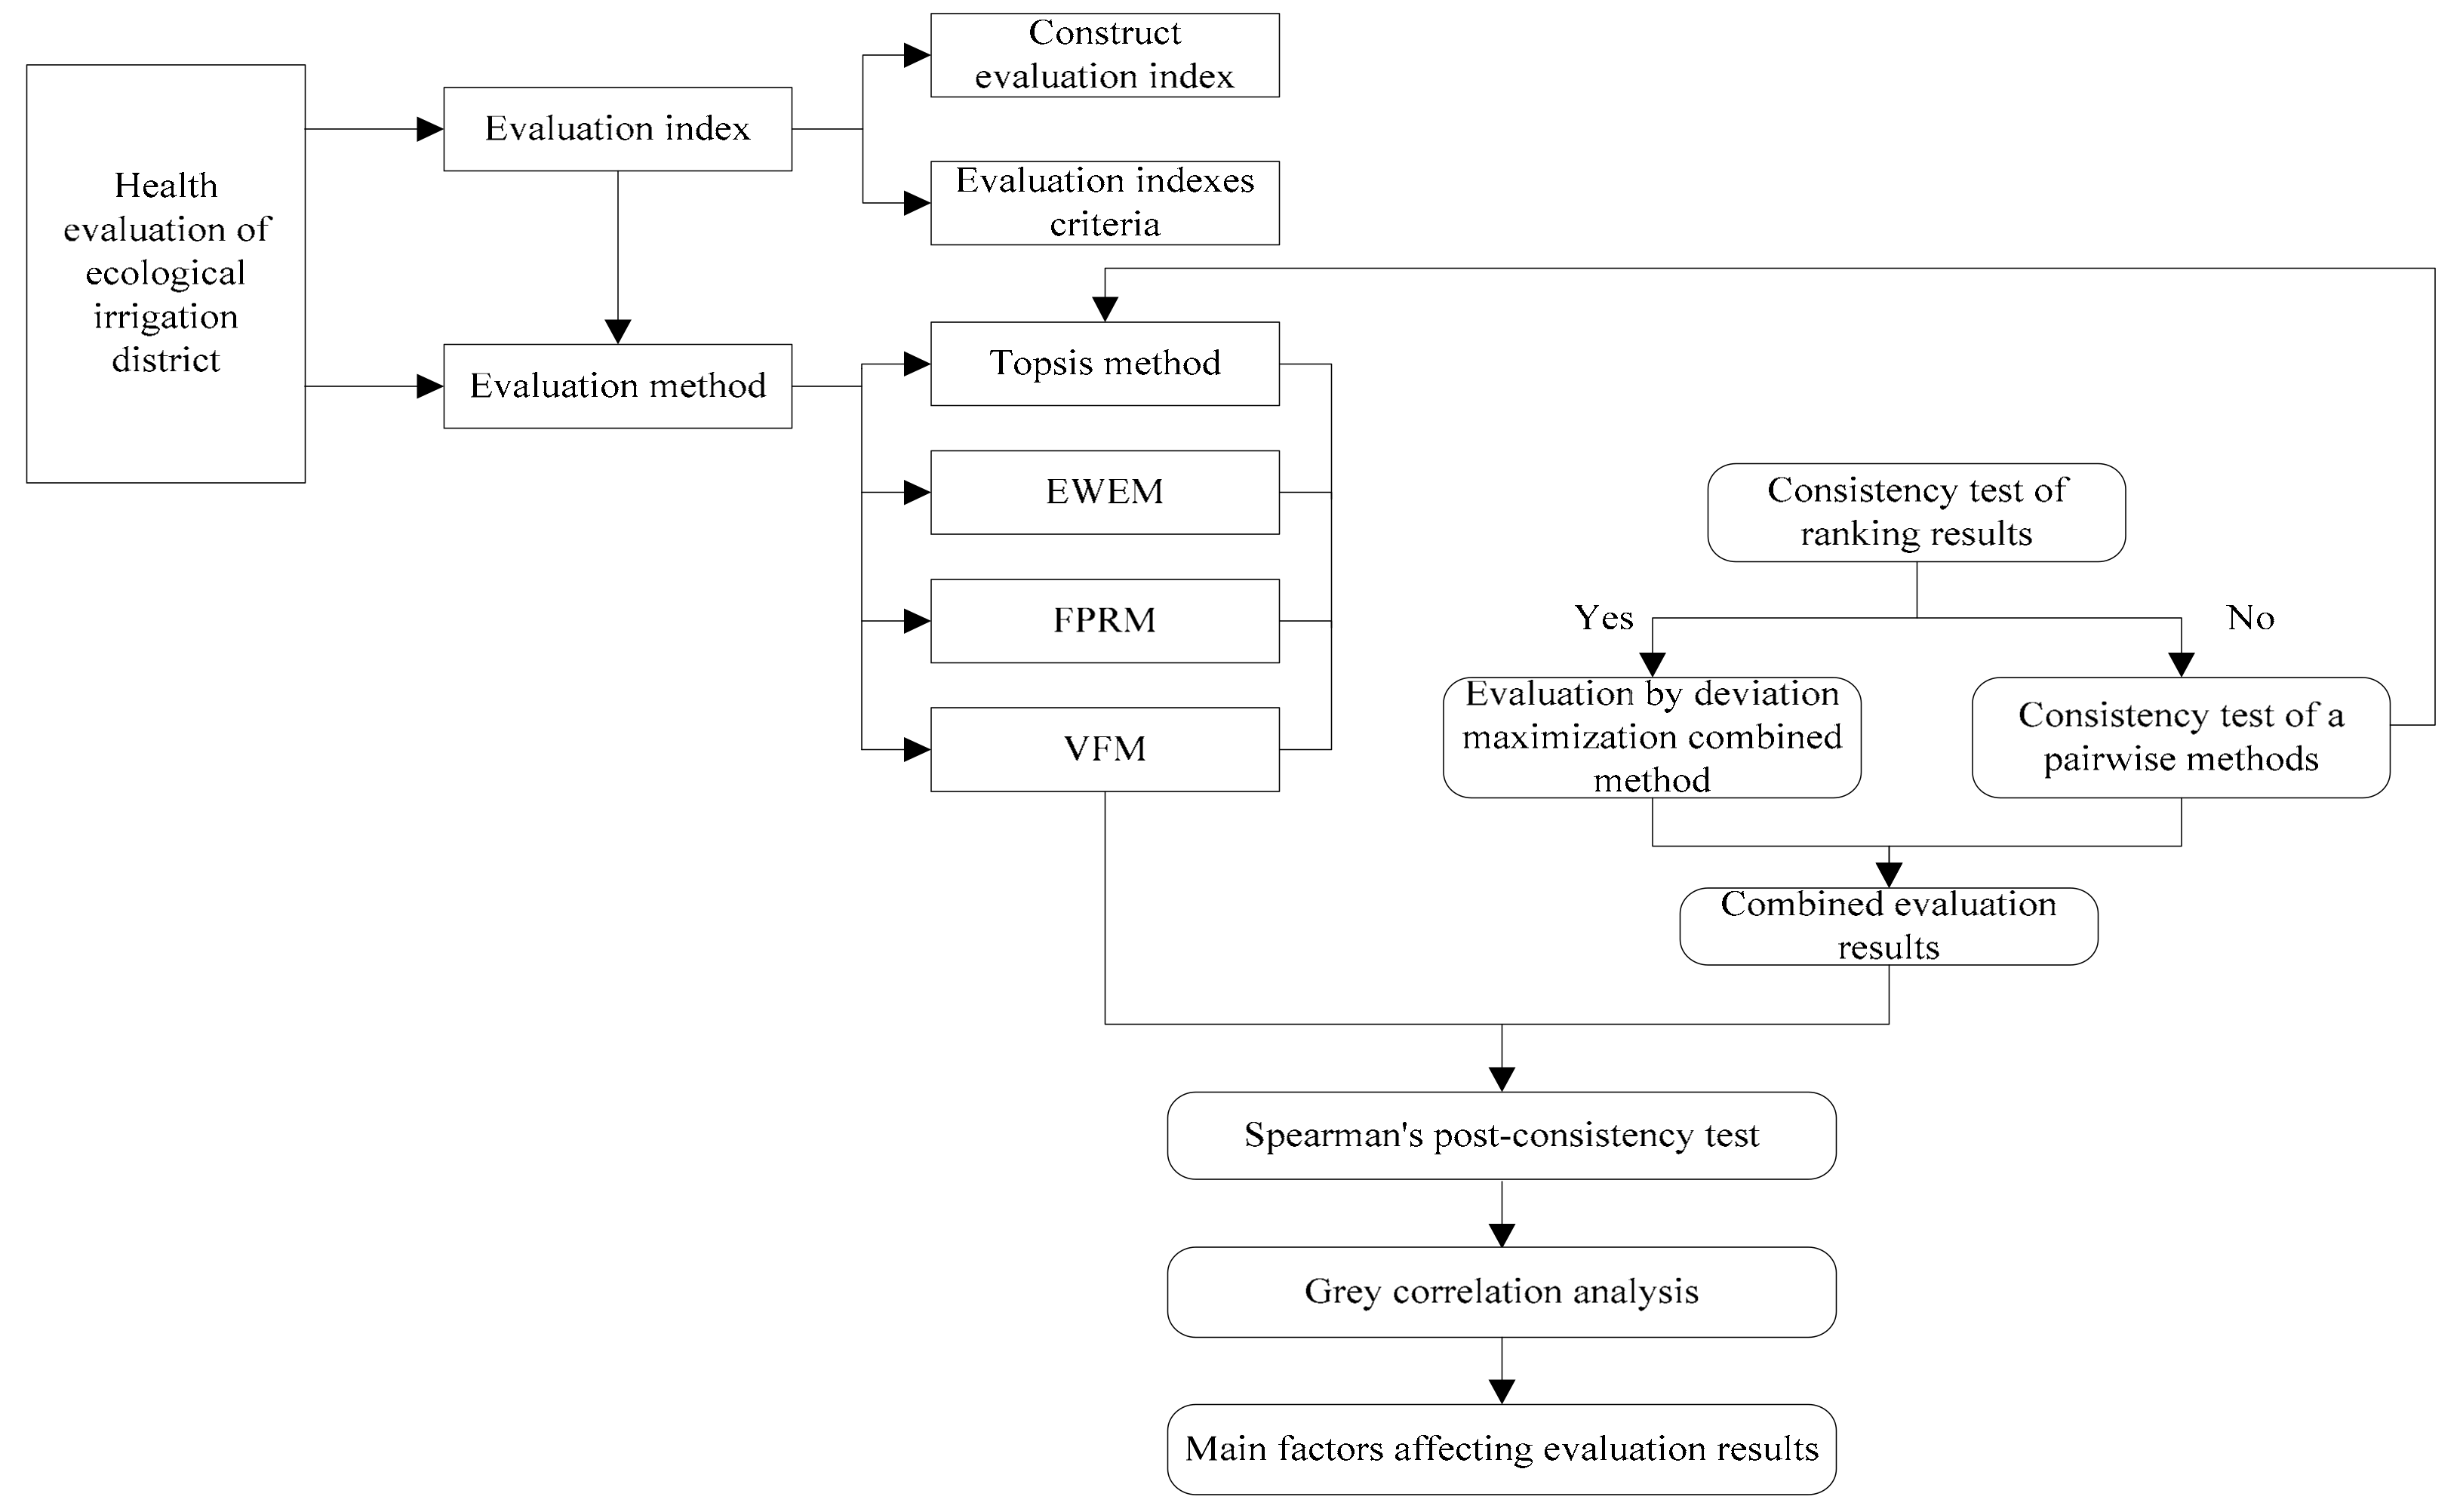
It is also crucial to establishing criteria for evaluation indexes to evaluate the health condition of ecological irrigation districts, which directly affects the scientificity of the evaluation results. There are no recognized criteria for the health evaluation of ecological irrigation districts. The following five principles are generally followed: (1) the service function of the ecological environment could not be damaged; (2) the current situation and future development should be reflected objectively and benefit; (3) should be able to help people to stay healthy; (4) should be able to quantify through mathematical models; (5) the criteria should be higher than the background value.
Based on China’s national, industry, and local standards, international standards, and the situation of the ecological irrigation district in Helan County, the primary and secondary indexes are classified as five grades, which are very healthy (Grade I), healthy (Grade II), sub-healthy (Grade III), unhealthy (Grade IV), and morbid (Grade V). The evaluation criteria of each index are shown in Table 2.

2.3. Methods

2.3.1. Weight Calculation Approaches

The weight calculation approaches adopted in this paper are Analytical Hierarchy Process (AHP), Entropy Weight Method (EWM), and combined weighting method.
AHP is one of the multi-criteria evaluation techniques and decision-making methods, which was developed by Saaty [33]. It enables us to garner priority of the goal element according to pairwise comparisons of elements in a clustering group. These pairwise comparisons accrue relative measurement considering tangible and intangible factors of the goal by the decision-maker [34].
Entropy is a concept in thermodynamics, which was first introduced in information theory by Shannon [35], and is now widely used in engineering technology, social economy, and other fields. EWM is proposed as a measurement for uncertainty in information and formulated in terms of probability theory. The uncertainty of data in communication processes is called information entropy; the lower the information entropy is, the higher the weight will be. The EWM works in steps as follows:
Step 1: The collected historical data of the secondary indexes mentioned in Section 2.2 are formulated as an information decision matrix X = (xij)m×n (i = 1, 2, ..., m; j = 1, 2, ..., n); m represents the number of secondary indexes, n is the total number of years.
Step 2: The initial decision matrix X is standardized to obtain the standardizing decision matrix B = (bij)m×n.
Step 3: The information entropy for each evaluation index i is defined as:
e i = j = 1 n s i j l n s i j / l n n
s i j = 1 + b i j / j = 1 n 1 + b i j
when sij = 0 or 1, sijln(sij) = 0.
Step 4: The weight obtained from information entropy for each index i is expressed as follows:
w i = d i / i = 1 m d i
where di is index difference coefficient, di = 1 − ei, and 0 w i 1 , and i = 1 m w i = 1 .
AHP is simple and convenient. However, the weight calculated by it is subjective and arbitrary on the part of experts. In contrast, EWM is less influenced by subjectivity. Nevertheless, the obtained values are restricted by samples in evaluation and results vary to some degree with the same data by different calculation methods. The combined weighting method is based on the combination of AHP and EWM, which exhibits the advantages of human experience and judgment and the objectivity of objectives.
Suppose the weight calculated by EWM is w1, the weight calculated by AHP is w2, and the combined weight is w, which is determined as follows:
w = tw1+ (1 − t) w2
where t is the proportion of the weight calculated by EWM in the combined weight.

2.3.2. Evaluation Methods

(1) Topsis method
The Topsis method was introduced by Hwang and Yoon [36]. It assumes a distance calculation where the ideal solution must have the shortest distance to the positive ideal solution and the longest distance to the negative ideal solution. It is a common method for multi-objective decision analysis, which is widely used in many fields such as benefit evaluation, decision-making, and management.
(2) Entropy weight evaluation method (EWEM)
According to the bij calculated by EWM, the evaluation value EVj for the jth year is as follows:
E V j = i = 1 m b i j × w i
where wi is the weight of index j. The larger the evaluation value, the better the evaluation object.
(3) Fuzzy pattern recognition model (FPRM) and variable fuzzy model (VFM)
Fuzzy sets theory was first presented by Zadeh in 1965 and has been applied in many fields. Based on this, Chen proposed the multi-objective fuzzy optimum selection model, fuzzy pattern recognition model [37] and variable fuzzy model [38], etc. The advantage of the above methods is that they can not only rank different samples according to their superiority and inferiority, but also obtain the membership degree of each sample to the superior one. In this paper, the fuzzy pattern recognition model (FPRM) and the variable fuzzy model (VFM) are used to evaluate the health of the ecological irrigation district.
(4) Deviation maximization combined evaluation method
The evaluation results of different evaluation methods are not the same due to the different principles of various evaluation methods. The combined evaluation method was employed to solve this problem. The combined evaluation method appropriately combines the evaluation results of different evaluation methods, and comprehensively uses the information provided by various methods to improve the evaluation and accuracy levels as much as possible. The essence of combined evaluation is to determine the weight of each evaluation method through a combined evaluation method without human intervention, to ensure that each evaluation method is “fair competition” in the combined evaluation method, and to improve the accuracy of the final combined evaluation value. Deviation maximization combined evaluation method is adopted in this paper, and the steps are as follows:
Step 1: Consistency test of ranking results
The Kendall-W coefficient is applied to test the consistency of the evaluation results of multiple evaluation methods [39]. If the evaluation results of various evaluation methods are consistent, then go to step 2; if they are inconsistent, perform the consistency test of pairwise methods, and then select several evaluation methods with consistency.
Suppose the ranks of n evaluation objective obtained and m evaluation methods are represented by the matrix PX = (pxij)n×m, and the evaluation values are represented by matrix PJ = (pjij)n×m, where pxij and pjij are the ranking value and evaluation value of the ith (i = 1, 2, …, n) evaluation object calculated by the jth (j = 1,2, …, m) evaluation methods, respectively.
Suppose that:
χ 2 = m n 1 W
W = 12 i = 1 n r i 2 3 m 2 n n + 1 2 / m 2 n n 2 1
r i = j = 1 m p x i j
where χ 2 obeys the chi-square distribution with freedom degrees (n − 1). Given the significance level α, check the chi-square distribution table to determine χ α 2 n 1 . When χ α 2 n 1 , it indicates that the evaluation methods are consistent at the significance level α; otherwise, they are not consistent.
Step 2: Constructing the deviation maximization combined evaluation method
The results of the combination evaluation method are generally divided into two forms: ranking value and evaluation value. In comparison, the evaluation value has more information than the ranking value. The deviation maximization combined evaluation method can combine the evaluation values of various evaluation methods to obtain an evaluation value that can cover all information. The specific process is as follows [40]:
① PJ is standardized to obtain PJ* = (pjij*)n×m by using Equations (9)–(11).
The larger the evaluation value, the better.
p j i j * = p j i j p j i m i n p j i m i n i m a x
The smaller the evaluation value, the better.
p j i j * = p j i j i m a x p j i m a x i m a x
The closer the evaluation value is to a median, the better,
p j i j * = 1 p j i j p j i * m a x t = 1 , 2 , , n p j i t p j i *
where pji* is the ideal value of index i.
② Solve the real symmetric matrix according to Equation (12).
H = P J * T P J *
③ The maximum eigenvalue and standard eigenvector λ′ of H are solved.
④ Determine the combined weight vector λj according to the value of each component in λ′, where:
If λj′ ≥ 0, then:
λ j = λ j / λ j
If λj′ ≤ 0, then:
λ j = λ j / λ j
⑤ Solve the combined evaluation values by Equation (15) and sort them.
Z i = j = 1 m λ j p j i j *
Step 3: Spearman’s post-consistency test of combined evaluation
Although the evaluation results obtained by the combined evaluation method are more scientific and reasonable than those of a single method, a certain random deviation may also occur. Spearman rank correlation coefficient is used for the post-consistency test of combination evaluation in this paper.
① Calculate the rank correlation coefficient dj between the ranking values of the combined evaluation method and those of a single evaluation method by Spearman rank correlation coefficient Equation (16) and solve for the average value of dj,
d j = 1 6 i = 1 n D i 2 n n 2 1
where Di is the rank difference of ith evaluation object between the rank of the combined evaluation method and that of a single evaluation method.
② Calculate the test statistics t by Equation (17). Given the significance level α = 0.01, check the t distribution table to determine t0.01. If t > t0.01, it indicates that the combined evaluation method is closely related to the four single evaluation methods, so the evaluation results calculated by the combined evaluation method have higher credibility; otherwise, it is not credible.
t = d ¯ n 2 1 d ¯ 2

2.3.3. Grey Correlation Analysis

It is effective to use the grey correlation analysis theory established by Deng [41] in 1982 when it comes to uncertain systems. The object of grey system theory is a small sample consisting of partial information known and partial information unknown, as well as poor information and uncertain systems. The grey system model has no special requirements or restrictions on the experimental observation data. As a very simple and easy-to-learn new theory, the grey system theory has a very vast application field. For this study, the main indexes affecting the evaluation results were found out by grey correlation analysis.

3. Results

3.1. Weight Calculation

The weights of each primary index and secondary index of EWM calculates as follows: ① the data of the secondary indexes from 2007 to 2016 are standardized; ② the entropy values and index difference coefficients of the secondary indexes included in the ecological environment, modernization level, and agricultural production and benefit are calculated according to Equation (1); ③ the index difference coefficients of the 9 secondary indexes included in the ecological environment of the irrigation district are brought into Equation (3). The weight of each secondary index in the ecological environment is further calculated. Similarly, the weight of each secondary index of the modernization level and the agricultural production and benefit is calculated, which are shown in the second column of Table 3; ④ the indexes’ difference coefficients of the three primary indexes are brought into Equation (3) to calculate the weight of each primary index, and the results are 0.4761, 0.2652, 0.2587.
In AHP, the primary indexes are the first level of the hierarchical architecture, and the secondary indexes are the second level. The weights of secondary indexes calculated by AHP are shown in the third column of Table 3. The weights of primary indexes are 0.5, 0.25, 0.25.
The weight calculated by EWM is assigned to 0.8, and the weight calculated by AHP is 0.2, for the purpose of eliminating the one-sidedness of the calculation results of one weight calculation method, fully considering the importance of indexes reflected in historical data, and reducing the impact of human factors. Therefore, the combination weight w = 0.8w1 + 0.2w2 is shown in the fourth column of Table 3. The combined weights of primary indexes are 0.4809, 0.2622, 0.2569.

3.2. Calculation Results of Single Evaluation Method

The classification threshold values of the secondary indexes (I-II classification threshold values, II-III classification threshold values, III-IV classification threshold values, IV-V classification threshold values) and the irrigation district index data from 2007 to 2016 are used as the research object for evaluation. Moreover, the evaluation values of three primary indexes and the health of the ecological irrigation district are further calculated. As listed in Table A1, Table A2, Table A3 and Table A4, the evaluation results of the Topsis method is calculated by DPS, as well as the evaluation results of EWEM, FPRM, and VFM calculated by VB programming. The index weights used in the four methods are combined weights.
It can be seen from Table A1, Table A2, Table A3 and Table A4 that the evaluation values and ranks calculated by different methods are different even for the best and worst evaluation objects. It is impossible to decide which evaluation method is more reasonable. Therefore, the deviation maximization combined evaluation method is proposed to comprehensively consider the evaluation results of the above four evaluation methods.

3.3. Combined Evaluation Method

The evaluation results of different evaluation methods are not the same due to the different principles of various evaluation methods. However, the combined evaluation method can overcome this problem. Therefore, the deviation maximization combined evaluation method is applied to evaluate the health of the ecological irrigation district in Helan County.
(1) Consistency test of ranking results
The number of evaluation objects n = 14 and the evaluation method m = 4.
The ranking values of the ecological environment of the irrigation district calculated by the above four evaluation methods are shown in Table A1, Table A2, Table A3 and Table A4, from which i = 1 14 r i 2 can been calculated, that is i = 1 14 r i 2 = 15 , 698 . Substitute the parameters corresponding to the ecological environment into Equations (7) and (8), as follows:
W = 12 × 15 , 698 3 × 4 2 × 14 × 14 + 1 2 / 4 2 × 14 × 14 2 1 = 0.8511
χ 2 = 4 × 14 1 × 0.8511 = 44.26
Taking the significance level α = 0.05, so χ α 2 13 = 22.36 . Due to χ 2 = 44.26 > χ α 2 13 = 22.36 , the evaluation results of the four evaluation methods are consistent and can be used for a combined evaluation.
(2) Determine the weights of the four evaluation methods
① Standardize the matrix PJ of the ecological environment of the irrigation district to obtain the matrix PJ* by Equations (9)–(11), and use Equation (12) to solve the real symmetric matrix H, the results are as follows:
H = 1.3670 1.5633 1.5266 1.5148 1.5633 2.0269 2.1633 2.0986 1.5266 2.1633 2.6537 2.5299 1.5148 2.0986 2.5299 2.4238
② Solve the maximum eigenvalue of H is 7.9876 and the corresponding standard eigenvector λ′ = (0.3719, 0.4947, 0.5656, 0.545). Then according to Equation (13), the weights of the four evaluation methods are λ = (0.1881, 0.2502, 0.2861, 0.2756).
③ Use Equation (15) to calculate the combined evaluation values and ranks. The evaluation results are shown in Table 4.
④ In the same way, the combined evaluation values of the modernization level, the agricultural production and benefit, and the health of the ecological irrigation district are calculated and ranked, as shown in Table 4.
(3) Spearman’s post-consistency test of combined evaluation
Spearman rank correlation coefficients, corresponding averages of the primary index, and three secondary indexes are calculated according to Equation (16). In addition, the test statistic t is calculated according to Equation (17), as shown in Table A5. When taking the significance level α = 0.01, check the t distribution table to get t0.0114 = 2.624. It can be seen from Table A5 that the test statistics t of the ecological environment, modernization level, agricultural production, and benefit and health of the ecological irrigation district are all greater than t0.0114. Consequently, the deviation maximization combined evaluation method has high credibility.
As illustrated in Table A6, the grade threshold values are obtained according to the evaluation values of the classification threshold values. Thus, the health grade of the ecological irrigation district from 2007 to 2016 is acquired, which is listed in Table 5.
(4) Gray correlation analysis
In order to determine the main factors affecting the evaluation results of the ecological irrigation district in Helan County, the secondary indexes are taken as the system element set. Besides, we apply the grey correlation analysis to calculate the grey correlation degrees of the combined evaluation values and the secondary indexes.
As shown in Table 6, this research solves the grey correlation degrees of the ecological environment, modernization level, agricultural production, and benefits of the Helan irrigation district, as well as corresponding secondary indexes. According to the principle of the grey correlation analysis, the greater the grey correlation degree, the greater the impact of the index on the health of the ecological irrigation district. Moreover, a poor, general, better, and strong correlation could be obtained for a grey correlation degree of γi < 0.6, 0.6 < γi < 0.7, 0.7 < γi < 0.8, γi > 0.8. The raw data of secondary indexes with a grey correlation degree greater than 0.8 are drawn in Figure 3.

3.4. Results

As can be seen from Table 4, Table 5 and Table 6 and Figure 3:
(1) The combined evaluation values of the ecological environment of the irrigation district from 2007 to 2016 show an overall increasing trend. The rankings generally show a decreasing trend with a negligible increase in 2009 and 2014. The health grades of 2007 to 2016 are level IV, which corresponds to unhealthy. In summary, although the health grades of the ecological environment were not changed over the years, there is still a trend towards better health for combined evaluation values and ranking. The grey correlation analysis shows that the soil salinity content, groundwater depth, and groundwater salinity are highly correlated, while the water area rate is poorly correlated, and other indexes are correlated well. From the Figure 3a–c, it can be seen that the soil salt content curve shows a decreasing trend from 2007 to 2016, the groundwater depth curve shows an increasing trend, and the groundwater salinity curve shows a trend of increasing, decreasing and then increasing. Compared with the evaluation criteria of the three indexes in Table 2, the three indexes have a better trend in values and grades, which is the reason for the improvement of the ecological environment.
(2) The combined evaluation values of the modernization level of the irrigation district present a trend of increasing and then decreasing, which rise sharply from 2007 to 2014 and then decline slightly from 2014 to 2016. The rankings first decrease and then rise with an overall downward trend. The health grades are IV in 2007 to 2009, grade III from 2010 to 2012 and 2016, and grade II from 2013 to 2015, respectively. To summarize, the health of the modernization level over the years has shown a trend of becoming better before becoming worse. The grey correlation analysis shows that the canal lining rate, the ratio of the efficient water-saving irrigation area and the information level of the irrigation district are highly correlated. From the Figure 3d–f, it can be seen that the canal lining rate curve increases at first and then is stable from 2007 to 2016, the ratio of the efficient water-saving irrigation area curve shows an overall increasing trend, and the information level of the irrigation district curve decreases. Compared with the evaluation criteria of the three indexes in Table 2, the three indexes have a better trend in values and grades, which is the reason for the improvement of the modernization level of the irrigation district.
(3) The combined evaluation values of agricultural production and benefit of the irrigation district show an overall upward trend, with a slight decrease from 2007 to 2008 and a steady increase from 2008 to 2016. The rankings show a downward trend with a slight increase in 2008. For health grade, it was grade IV from 2007 to 2009, grade III from 2010 to 2015, and grade II in 2016. As discussed above, the health grades of the agricultural production and benefit show a trend of gradual improvement over the years. The grey correlation analysis suggests that the water productivity, agricultural unilateral aquatic output value, irrigation water consumption per mu, and coefficient of the effective utilization of farmland irrigation water are highly related. From the Figure 3g–j, it can be seen that the water productivity curve, the agricultural unilateral aquatic output value curve and the coefficient of the effective utilization of farmland irrigation water curve show an increasing trend from 2007 to 2016, the irrigation water consumption per mu curve shows a decreasing trend. Compared with the evaluation criteria of the four indexes in Table 2, the four indexes have a better trend in values and grades, which is the reason for the improvement of the agricultural production and benefit of the irrigation district.
(4) The combined evaluation values of the health of the ecological irrigation districts show a steady upward trend, and the evaluation value gradually increases from 2007 to 2016. The rankings show a downward trend. In 2016, it ranks the first with the highest degree of ecological health, while in 2007 it falls to the 10th with the lowest degree. The health grades are IV from 2007 to 2011 and III from 2012 to 2016. In summary, the health of the ecological irrigation district has a trend of gradual improvement over the years.

4. Discussion

4.1. Construction of Health Evaluation Index System of Ecological Irrigation District

The construction of the index system is the focus of evaluation research [42]. How to reasonably determine an evaluation index system based on different evaluation objects and purposes is the primary problem of health evaluation in ecological irrigation districts [32].
The construction of traditional irrigation districts pay more attention to engineering than ecology, which exposed a series of ecological problems. In the new era, China puts forward new requirements for traditional irrigation districts: we need the transition from the pursuit of engineering benefits to the pursuit of sustainable development, and pay more attention to the protection of the ecological environment. At present, the studies on irrigation district evaluation mainly focus on water-saving irrigation benefit evaluation, agricultural water-saving benefit evaluation, irrigation district operation benefit evaluation, and so on. But these evaluation studies rarely considered ecological and environmental factors. The understanding of ecological irrigation district health and its evaluation is still in the primary stages. How to construct the health evaluation index system of ecological irrigation districts based on the meaning of ecological irrigation districts and then evaluating and guiding the ecological irrigation district is key to the evaluation of ecological irrigation districts. Taking the ecological health of irrigation districts as the research object, this study comprehensively described the health status of the ecological irrigation district from three aspects: the ecological environment, the modernization level, and the agricultural production and benefit of the irrigation district.
Nine secondary indexes were set to reflect the ecological environment of the irrigation district, as shown in Table 1. Forest coverage rate, a commonly used indicator to evaluate terrestrial environmental conditions, is closely related to anthropogenic activities, livestock breeding, deforestation monitoring, and climate change [43,44,45,46]. Therefore, it is regarded as one of the secondary indexes of the ecological environment of the irrigation district. Groundwater is a crucial water source for irrigation and plays a substantial role in securing global food production [47,48,49]. The abnormal change of groundwater table will cause many ecological and environmental problems. When the groundwater table is too high, it will cause problems such as soil salinization; when it is too low, it will cause soil desertification and vegetation degradation. Therefore, there is a reasonable range of groundwater table in a certain district of the irrigation district. If the groundwater table is maintained within this range, the ecological environment of the irrigation district will not develop well, on the contrary, it will become worse. Therefore, the groundwater depth is selected as the secondary evaluation index in this study.
In addition, the factors which affect the water ecological environment, such as groundwater salinity, ammonia nitrogen concentration in surface water, soil salt content, pesticide application intensity and fertilizer application intensity, are also selected as secondary evaluation indexes.
Ecological irrigation districts are an advanced stage of modern irrigation districts, so the modernization level of the irrigation district is regarded as the second primary index of the health evaluation of an ecological irrigation district. The secondary indexes include the canal lining rate, effective irrigation area ratio, ratio of efficient water-saving irrigation area, total power of agricultural machinery, informatization level of irrigation district, etc.
Efficient irrigation water management has to be carried out to save water and maximize its productivity [50,51]. Supplemental irrigation and limited or deficit irrigation are effective ways to reduce irrigation water use and improve crop water use efficiency (WUE) [52,53]. It can be seen that the grain yield and water use efficiency are important indexes to characterize the quality of the irrigation district.
The ecological irrigation district should have high yield under a healthy ecological environment, and finally form a water-saving ecological irrigation district with excellent ecological environment, high economic benefits, perfect irrigation district functions, scientific and effective water resource allocation, and high ecological benefits per unit water volume. Therefore, agricultural production and benefit are regarded as the third primary index of the health evaluation of the ecological irrigation district. The secondary indexes include agricultural unilateral aquatic output value, grain yield, average irrigation water consumption per mu, coefficient of effective utilization of farmland irrigation water, water productivity, cropping intensity, etc.
In summary, the primary and secondary indexes selected in this study can represent the essential characteristics of the ecological irrigation district and each index can represent the health characteristics of the ecological irrigation district from different angles. The most important is that these indexes are easy to obtain and have strong operability.

4.2. Determination of Index Weight

How to reasonably identify the weight of indexes is central to the construction of a health evaluation model of an ecological irrigation district. Whether the index weight is reasonable or not affects the correctness and scientificity of the evaluation results to a great extent. At present, the methods to determine the index weight are divided into three categories, namely, subjective weighting method, objective weighting method and combination weighting method. The subjective weighting methods determine the index weight according to the attention of decision makers to the index, such as AHP [33], the TACTIC method [53] and the Delphi method [54], etc. The weights determined by the objective weighting methods are calculated from the actual data of each index, such as principal component analysis [55], EWM [35], and the multi-objective programming method [56], etc. The weights calculated by combination weighting methods are obtained by the combination of subjective and objective weights, such as the multiplicative combination weighting method, the additive combination weighting method, the linear weighting method, and the multi-attribute decision-making weighting method, and so on.
Presently, most of the research has used a single subjective weighting method or objective weighting method to determine the index weight. For example, Hu [21], Fang et al. [22], Zhao [23], and Chang [25] adopted subjective weighting methods, in which the first three used AHP, and the fourth one was based on expert opinions. Li [24], Zhao [57], and Wang [29] used EWM, the coefficient of variation method, and the random forest model, respectively, to determine the index weight, which are all objective weighting methods.
The subjective weighting method and the objective weighting method have their own advantages and disadvantages. The index weight obtained by the subjective weighting method is given subjectively by experts according to their personal experience and judgment, which is easy to implement but has great subjectivity and arbitrariness. The subjectivity of the objective weighting method is small, but the weight is restricted by the samples participating in the evaluation. Sometimes the weights calculated by different samples are quite different, and the weights calculated by different methods are different under the same samples. In order to take into account the empirical judgment of decision-makers and reflect the objective characteristics of indexes, this paper combines AHP and EWM to determine the index weight to avoid the one-sidedness of the evaluation results caused by a single weighting method in existing research.

4.3. Construction of Health Evaluation Models of Ecological Irrigation Districts

At present, most evaluations of irrigation districts are used as a single evaluation method. For example, Lilenfeld et al. [16], Komaragiri [17], and Garcia-Melon et al. [20] adopted the data envelopment method, multi-attribute utility theory, and analytic network process, respectively, to evaluate the irrigation system. Okada et al. [18,19] analyzed the engineering transformation of irrigation districts by AHP. Hu [21], Fang et al. [22], Zhao [23], Li et al. [24], and Chang [25] applied the fuzzy set theory to evaluate ecological irrigation districts. Qie et al. [26], Ye et al. [27], and Shekofteh [28] used neural network or its improved algorithm to evaluate the cultivated land quality. Lai et al. [29], Jiang et al. [30] and Khamoshi et al. [31] adopted a support vector machine, a projection pursuit classification model, and a random forest to evaluate operation status of irrigation district, respectively.
As can be seen from Table A4, ① the ranks calculated by different methods are different even for the best and worst evaluation objects; ② the evaluation objects with the largest gaps are different when comparing any two evaluation methods; ③ the evaluation results of FPRM and VFM are the closest, followed by EWEM, FPRM and VFM, and the difference of evaluation results between Topsis and the other three evaluation methods is the biggest. The reason for the inconsistency of different evaluation results is that the principle of different evaluation methods and the amount of information of the samples mined by different evaluation methods are different. Because it is difficult to judge which method is more reasonable, this paper adopts a deviation maximization combined evaluation method to combine each single evaluation result. This combination evaluation method includes three parts: pre-test, combination evaluation model, and post-test. The pre-test can ensure that the evaluation results are combined under the premise of consistency. The combination evaluation model can combine the evaluation values of various methods, rather than the ranks, so it can cover more information from a single evaluation result. The post-test can effectively avoid the random deviation of the combination evaluation results. The three parts of this combination evaluation method proposed in this paper effectively ensure the rationality of the combination evaluation results.

5. Conclusions

The combined evaluation values of the ecological environment, the agricultural production, and the benefit of the irrigation district show an overall increasing trend, while those of the modernization level of the irrigation district present an increasing and then decreasing trend. The health grades of the ecological environment have an unhealthy status (Grade IV) from 2007 to 2016; those of the modernization level range from the unhealthy status (Grade IV) from 2007 to 2009, to the sub-health status (Grade III) from 2010 to 2012, then to the health status (Grade II) from 2013 to 2015, and finally to the sub-health status (Grade III) in 2016; and those of the agricultural production and benefit range from the unhealthy status (Grade IV) from 2007 to 2009, then to the sub-health status (Grade III) from 2010 to 2015, and finally to the health status (Grade II) in 2016. Through the evaluation of the ecological irrigation district in Helan County from 2007 to 2016, it is found that there existed an unhealthy status (Grade IV) from 2007 to 2011 and a sub-healthy status (Grade III) from 2012 to 2016. From the steadily rising evaluation values, it can be seen that the ecological health status of the Helan irrigation district is gradually improving. Grey correlation analysis showed that in order to improve the ecological health of the Helan irrigation district, it is necessary to improve soil properties, reduce soil salinity and groundwater mineralization, increase canal lining, promote efficient water-saving irrigation equipment and information technology, and enhance the intelligent management of agricultural irrigation so as to increase agricultural production, reduce water consumption, and environmental pollution.

Author Contributions

Conceptualization, G.Y. and Z.P.; methodology, Q.Z. and Y.D.; software, G.W.; investigation, Q.Z. and Y.D.; data curation, Q.Z., Y.D. and P.Z.; writing—original draft preparation, Q.Z., Y.D. and J.P.; writing—review and editing, G.W. and Q.Z.; funding acquisition, G.Y. and Z.P. All authors have read and agreed to the published version of the manuscript.

Funding

This research was funded by the Key R & D projects of Ningxia Hui Autonomous Region (2018BBF02022); the Major Science and Technology Inovation Major Project of Shandong Province (2019JZZY010727); National Natural Science Foundation of China (51909151) and the Key Technology Research and Development Program of Shandong Province (2019GSF111043).

Institutional Review Board Statement

Not applicable.

Informed Consent Statement

Not applicable.

Data Availability Statement

The datasets used and/or analyzed during the current study are available from the corresponding authors upon reasonable request.

Acknowledgments

We would like to express our deepest gratitude to the Ningxia water conservancy for their help in data support.

Conflicts of Interest

The authors declare no conflict of interest.

Appendix A

Table A1. Evaluation values and ranks of ecological environments.
Evaluation ObjectTopsisEWEMFPRMVFM
Evaluation ValueRankEvaluation ValueRankEvaluation ValueRankEvaluation ValueRank
I-II0.944410.974511.511.51
II-III0.544320.769822.522.52
III-IV0.314130.538233.593.53
IV-V0.217640.3325114.5144.514
20070.1121100.2658133.69113.72211
20080.1065120.3036123.717123.72612
20090.1056140.2163143.749133.75313
20100.1064130.33693.554103.618
20110.1114110.3326103.46183.64910
20120.119590.342783.40863.6139
20130.157260.362263.38343.5126
20140.137480.356873.43573.6067
20150.153970.400953.39353.5054
20160.164650.410843.37233.5085
Note: I-II represents I-II classification threshold value; II-III represents II-III classification threshold value; III-IV represents III-IV classification threshold value; IV-V represents IV-V classification threshold value.
Table A2. Evaluation values and ranks of modernization levels.
Evaluation ObjectTopsisEWEMFPRMVFM
Evaluation ValueRankEvaluation ValueRankEvaluation ValueRankEvaluation ValueRank
I-II0.524260.94811.511.51
II-III0.458370.642632.552.52
III-IV0.3691130.2898103.5103.59
IV-V0.412120.0431144.5144.514
20070.413110.0777134.053134.43413
20080.418490.1076124.011124.29512
20090.4181100.1425113.933114.09611
20100.3362140.333193.36993.56310
20110.444380.418783.12983.3518
20120.57240.497272.85573.057
20130.735910.60152.32232.6825
20140.679120.711622.23522.5363
20150.545650.607442.39542.6664
20160.595930.527962.81562.8256
Table A3. Evaluation values and ranks of agricultural production and benefit.
Evaluation ObjectTopsisEWEMFPRMVFM
Evaluation ValueRankEvaluation ValueRankEvaluation ValueRankEvaluation ValueRank
I-II0.822410.887811.511.51
II-III0.640830.67232.532.52
III-IV0.353100.3741103.5103.512
IV-V0.1418140.1255144.5144.514
20070.2833130.236133.589123.47210
20080.3008120.2413123.698133.51713
20090.3346110.3182113.545113.47811
20100.399790.426993.19993.2619
20110.440880.473683.06383.1245
20120.489270.4966373.1396
20130.520260.492872.9963.2118
20140.533850.498452.95153.187
20150.596640.581842.80742.974
20160.721420.79122.31922.6933
Table A4. Evaluation values and ranks of health of the ecological irrigation district.
Evaluation ObjectTopsisEWEMFPRMVFM
Evaluation ValueRankEvaluation ValueRankEvaluation ValueRankEvaluation ValueRank
I-II0.92141111.511.51
II-III0.532120.70922.522.52
III-IV0.2530.359473.5103.59
IV-V0.129690.0737144.5144.514
20070.0617140.0787134.005123.8613
20080.0673130.1131114.018133.8512
20090.078120.0937123.872113.80811
20100.0943110.2615103.34793.50210
20110.1155100.299993.1683.4518
20120.149980.336683.04373.3577
20130.200750.377963.00263.2145
20140.185260.408552.99853.2636
20150.185270.434442.99243.1694
20160.226640.488132.98233.1583
Table A5. Spearman’s post-consistency test.
Evaluation ObjectSpearman Rank Correlation CoefficientsAverage Valuet
Topsis MethodEWEMFPRMVFM
Ecological environment0.72310.96920.89450.97800.89126.8062
Modernization level0.77140.982410.96480.92978.7420
Agricultural production and benefit0.99560.991210.93850.981317.6693
Health of ecological irrigation district0.85050.99120.98240.99120.953811.0032
Table A6. Classification threshold values.
Evaluation ObjectThreshold Values
IIIIVV
Ecological environment>10.6555~10.3402~0.65550.0634~0.3402<0.0634
Modernization level>0.88040.5840~0.88040.2613~0.58400.0428~0.2613<0.0428
Agricultural production and benefit>10.6967~10.3255~0.69670~0.3255<0
Health of ecological irrigation district>10.6495~10.3062~0.64950.0145~0.3062<0.0145

References

  1. Luo, L. The development countermeasure research of modernization irrigation district that adapt to the development of modern agriculture. China Rural Water Hydropower 2016, 8, 10–12. [Google Scholar]
  2. Schaeffer, D.J.; Herricks, E.E.; Kerster, H.W. Ecosystem health: I. Measuring ecosystem health. Environ. Manag. 1988, 12, 445–455. [Google Scholar] [CrossRef]
  3. Jiang, K.P. Thoughts on the Construction of Ecological Irrigation District-using the concept of Ecological Civilization to expand ideas and promote the Sustainable Development of Irrigation District. China Rural Water Hydropower 2004, 2, 4–10. [Google Scholar]
  4. Mao, Z. Advocate the construction of a water-saving and ecological irrigation district. China Water Resour. 2004, 18, 22–23. [Google Scholar]
  5. Gu, B.J.; Wang, C.; Wang, P.F. Study on concept of ecological irrigation district and it’s construction measures. China Rural Water Hydropower 2005, 12, 7–9. [Google Scholar]
  6. Yang, P.; Li, Y.; Zeng, X.; Yang, J.; Guo, Q.; Ren, S.; Su, Y. Ecological irrigation district: Studies on theory basis and supporting technical system. China Water Resour. 2009, 14, 32–35. [Google Scholar]
  7. Bos, M.G. Standards for irrigation efficiencies of ICID. J. Irrig. Drain. Div 1979, 105, 37–43. [Google Scholar] [CrossRef]
  8. Bottrall, A.F.; Mundial, B. Comparative Study of the Management and Organization of Irrigation Projects; World Bank: Washington, DC, USA, 1981. [Google Scholar]
  9. Abernethy, C.L. Performance criteria for irrigation systems. In Paper Presented at the International Conference on Irrigation Theory and Practice; University of Southampton: Southampton, UK, 1989; 10p. [Google Scholar]
  10. Bos, M.G. Performance indicators for irrigation and drainage. Irrig. Drain. Syst. 1997, 11, 119–137. [Google Scholar] [CrossRef]
  11. Brookers, A. Restoration and enhancement of engineered river channels: Some European experience. Regul. River. 1990, 5, 45–56. [Google Scholar] [CrossRef]
  12. Charles, M.B.; Robert, E.W.; Stuart, W.S. Irrigation System Evaluation Manual; California Department of Water Resources and Department of Agriculture Engineering: Sacramento, CA, USA, 1988. [Google Scholar]
  13. Charles, M.B.; Robert, E.W.; Stuart, W.S. Irrigation System Evaluation Manual; California Department of Water Resources and Department of Agriculture Engineering: Sacramento, CA, USA, 1999. [Google Scholar]
  14. Molden, D.J.; Sakthivadivel, R.; Perry, C.J.; De Fraiture, C. Indicators for Comparing Performance of Irrigated Agricultural Systems; IWMI Research Reports 44581; International Water Management Institute: Anand, India, 1998. [Google Scholar]
  15. Available online: https://www.icid.org/home.html (accessed on 29 September 2021).
  16. Lilienfeld, A.; Asmild, M. Estimation of excess water use in irrigated agriculture: A Data Envelopment Analysis approach. Agric. Water Manag. 2007, 94, 73–82. [Google Scholar] [CrossRef]
  17. Komaragiri, S.R.A.V. Multi attribute utility theory for irrigation system evaluation. Water Resour Manag. 2007, 21, 711–728. [Google Scholar]
  18. Okada, H.; Styles, S.W.; Grismer, M.E. Application of the Analytic Hierarchy Process to irrigation project improvement Part I. Impacts of irrigation project internal processes on crop yields. Agric. Water Manag. 2008, 95, 199–204. [Google Scholar] [CrossRef]
  19. Okada, H.; Styles, S.W.; Grismer, M.E. Application of the Analytic Hierarchy Process to irrigation project improvement Part II. How professionals evaluate an irrigation project for its improvement. Agric. Water Manag. 2008, 95, 205–210. [Google Scholar] [CrossRef]
  20. Garcia-Melon, M.; Ferris-Onate, J.; Aznar-Bellver, J.; Aragones-Beltran, P.; Poveda-Bautista, R. Farmland appraisal based on the analytic network process. J. Glob. Optim. 2008, 42, 143–155. [Google Scholar] [CrossRef]
  21. Hu, B. Evaluation of Jiangsu Water-Saving Ecological Irrigation Index System of Ecological Research and Software. Master’s Thesis, Yangzhou University, Yangzhou, China, 2011. [Google Scholar]
  22. Fang, Y.X.; Yang, P.L.; Song, S.L.; Du, J.; Xue, Y.D.; Su, Y.P. Secondary fuzzy comprehensive evaluation model for ecosystem health of irrigation district and its application. Trans. Chin. Soc. Agric. Eng. 2011, 27, 199–205. [Google Scholar]
  23. Zhao, X. Study on Ecological Health Assessment of Heping Irrigation District in Qing’an. Master’s Thesis, Northeast Agricultural University, Harbin, China, 2019. [Google Scholar]
  24. Li, H.L.; Wang, X.G.; Cui, Y.L.; Li, K.; Fang, B. Comprehensive evaluation methods for irrigation district. Adv. Water Sci. 2006, 17, 543–548. [Google Scholar]
  25. Chang, X.Y. Research on Theory and Evaluation of Ecological Irrigation District Construction. Master’s Thesis, North China University of Water Resources and Electric Power, Zheng Zhou, China, 2019. [Google Scholar]
  26. Qie, R.Q.; Guan, X.; Yan, X.J.; Dou, S.X.; Zhao, L. Method and its application of natural quality evaluation of arable land based on self-organizing feature map neural network. Trans. Chin. Soc. Agric. Eng. 2014, 30, 298–305. [Google Scholar]
  27. Ye, Y.; Zhao, X.; Hu, Y. Evaluation of cultivated land Quality in Pearl River Delta Based on GA-BP Neural Network. Ecol. Environ. Sci. 2018, 27, 964–973. [Google Scholar]
  28. Shekofteh, H.; Masoudi, A. Determining the features influencing the-S soil quality index in a semiarid region of Iran using a hybrid GA-ANN algorithm. Geoderma 2019, 355, 113908. [Google Scholar] [CrossRef]
  29. Lai, H.S.; Wu, C.F. Productivity Evaluation of Standard Cultivated Land Based on Rough Set and Support Vector Machine. J. Nat. Res. 2011, 26, 2141–2154. [Google Scholar]
  30. Jiang, G.Y.; Cao, H.L. Comprehensive evaluation methods for irrigation district. Res. Soil Water Conserv. 2006, 5, 87–89. [Google Scholar]
  31. Khamoshi, E.; Sarmadian, F.; Keshavarzi, A. Digital Soil Mapping Using Random Forest Model and Land Suitability Evaluation for Abyek Region, Qazvin Province, Iran. J. Range Watershed Manag. 2019, 71, 885–899. [Google Scholar]
  32. Wang, L.; Zhou, Y.; Li, Q.; Xu, T.; Wu, Z.; Liu, J. Application of Three Deep Machine-Learning Algorithms in a Construction Assessment Model of Farmland Quality at the County Scale: Case Study of Xiangzhou, Hubei Province, China. Agriculture 2021, 11, 72. [Google Scholar] [CrossRef]
  33. Saaty, R.W. The analytic hierarchy process-what it is and how it is used. Mathmatical. Model. 1987, 9, 161–176. [Google Scholar] [CrossRef] [Green Version]
  34. Saaty, T.L. How to make a decision—The analytic hierarchy process. Eur. J. Oper. Res. 1990, 48, 9–26. [Google Scholar] [CrossRef]
  35. Shannon, C.E.; Weaver, W. The Mathematical Theory of Communication; The University of Illinois Press: Urbana, USA, 1947. [Google Scholar]
  36. Hwang, C.L.; Yoon, K. Multiple Attribute Decision Making-Methods and Applications; Springer: Heidelberg, Germany, 1981. [Google Scholar]
  37. Li, Y.W.; Chen, S.Y.; Nie, X.T. Fuzzy pattern recognition approach to construction contractor selection. Fuzzy Optim Decis Ma. 2005, 4, 103–118. [Google Scholar]
  38. Chen, S.Y.; Xue, Z.C.; Li, M. Variable Sets principle and method for flood classification. Sci. China Technol. Sci. 2013, 9, 249–254. [Google Scholar] [CrossRef]
  39. Cheng, M.; Chen, H. Combination evaluation of sustainable development level of urban infrastructure. Urban Probl. 2012, 2, 15–21. [Google Scholar]
  40. Zeng, X.B. On the pre-test and post-test of combination evaluation method. Stat. Res. 1997, 14, 56–58. [Google Scholar]
  41. Deng, J.L. The Grey control system. J. Huazhong Inst. Technol. 1982, 10, 11–20. [Google Scholar]
  42. Zhu, M.; Liu, S.; Xia, Z.; Wang, G.; Hu, Y.; Liu, Z. Crop Growth Stage GPP-Driven Spectral Model for Evaluation of Cultivated Land Quality Using GA-BPNN. Agriculture 2020, 10, 318–333. [Google Scholar] [CrossRef]
  43. Purevdory, T.; Tateishi, R.; Ishiyama, T.; Honda, Y. Relationships between percent vegetation cover and vegetation indices. Int. J. Remote Sens. 1998, 19, 3519–3553. [Google Scholar] [CrossRef]
  44. Brockerhoff, E.G.; Barbaro, L.; Castagneyrol, B.; Forrester, D.I.; Gardiner, B.; González-Olabarria, J.R.; O’B Lyver, P.; Meurisse, N.; Oxbrough, A.; Taki, H.; et al. Forest biodiversity, ecosystem functioning and the provision of ecosystem services. Biodivers. Conserv. 2017, 26, 3005–3035. [Google Scholar] [CrossRef] [Green Version]
  45. Correia, R.A.; Bugalho, M.N.; Franco, A.M.A.; Palmeirim, J.M. Contribution of spatially explicit models to climate change adaptation and mitigation plans for a priority forest habitat. Mitig. Adapt. Strateg. Glob. Chang. 2018, 23, 371–386. [Google Scholar] [CrossRef] [Green Version]
  46. Gao, S.; Zhou, T.; Yi, C.X.; Shi, P.J.; Fang, W.; Liu, R.; Liang, E.; Camarero, J.J. Asymmetric impacts of dryness and wetness on tree growth and forest coverage. Agric. For. Meteorol. 2020, 288–289, 107980. [Google Scholar] [CrossRef]
  47. Giordano, M. Global groundwater? Issues and solutions. Annu. Rev. Environ. Resour. 2009, 34, 153–178. [Google Scholar] [CrossRef]
  48. Siebert, S.; Burke, J.; Faures, J.M.; Frenken, K.; Hoogeveen, J.; Döll, P.; Portmann, F.T. Groundwater use for irrigation—A global inventory. Hydrol. Earth Syst. Sci. 2010, 14, 1863–1880. [Google Scholar] [CrossRef] [Green Version]
  49. Wada, Y.; van Beek, L.P.H.; Bierkens, M.F.P. Nonsustainable groundwater sustaining irrigation: A global assessment. Water Resour. Res. 2012, 48, W00L06. [Google Scholar] [CrossRef]
  50. Li, P.; Ren, L. Evaluating the effects of limited irrigation on crop water productivity and reducing deep groundwater exploitation in the North China Plain using an agro-hydrological model: I. Parameter sensitivity analysis, calibration and model validation. J. Hydrol. 2019, 574, 497–516. [Google Scholar] [CrossRef]
  51. Fereres, E.; Soriano, M.A. Deficit irrigation for reducing agricultural water use. J. Exp. Bot. 2007, 58, 147–159. [Google Scholar] [CrossRef] [Green Version]
  52. Kang, S.Z.; Zhang, L.; Liang, Y.L.; Hu, X.; Cai, H.; Gu, B. Effects of limited irrigation on yield and water use efficiency of winter wheat in the Loess Plateau of China. Agric. Water Manag. 2002, 55, 203–216. [Google Scholar] [CrossRef]
  53. Vansnick, J. On the problem of weights in multiple criteria decision—The noncompensatory approach. Eur. J. Oper. Res. 1986, 24, 288–294. [Google Scholar] [CrossRef]
  54. Zhen, C.Q. The method of weight investigation and determination in Multi-objective decision-making. Syst. Eng. Theory Pract. 1987, 2, 16–24. [Google Scholar]
  55. Wold, S.; Esbensen, K.; Geladi, P. Principal component analysis. Chemom. Intell. Lab. Syst. 1987, 2, 37–52. [Google Scholar] [CrossRef]
  56. Nakayama, H. Interactive Multi-Objective Programming and Its Applications; Springer: Vienna, Austria, 1991. [Google Scholar]
  57. Zhao, R.; Wu, K. Soil Health Evaluation of Farmland Based on Functional Soil Management—A Case Study of Yixing City, Jiangsu Province, China. Agriculture 2021, 11, 583. [Google Scholar] [CrossRef]
Figure 1. The structure of this article.
Water 13 03325 g001
Figure 2. Geographical location of Helan County.
Water 13 03325 g002
Figure 3. The main secondary indexes’ raw data affecting the evaluation results of the ecological irrigation district in Helan County: (a) Soil salt content; (b) Groundwater depth; (c) Groundwater salinity; (d) Canal lining rate; (e) Ratio of efficient water-saving irrigation area; (f) Information level of irrigation district; (g) Water productivity; (h) Agricultural unilateral aquatic output value; (i) Irrigation water consumption per mu; (j) Coefficient of effective utilization of farmland irrigation water.
Water 13 03325 g003
Table 1. Health evaluation index system of the ecological irrigation district.
Target LayerPrimary IndexSecondary IndexUnitMeaningIndex Property 1
Health evaluation of ecological irrigation districtEcological environment A1Forest coverage rate B1%Forest coverage area/Total area+
Groundwater depth B2mDistance from surface to ground waterIntermediate
Water area rate B3%Area of rivers and lakes in the region/Total area of the region+
Groundwater salinity B4g/LThe content of soluble salt per unit volume of groundwater-
Ammonia nitrogen concentration in surface water B5mg/LThe content of ammonia nitrogen per unit volume of groundwater-
Soil salt content B6g/kgThe quality of salt in the soil accounts for the percentage of dry soil-
Pesticide application intensity B7kg/hm2The quality of pesticide sprayed per unit area-
Fertilizer application intensity B8kg/hm2The quality of fertilizer applied per unit area, calculated by the internationally accepted GLASOD-
Water and soil resources matching degree B9-Spatial mismatch index between agricultural irrigation water consumption and effective irrigation area-
Modernization level A2Canal lining rate B10%Lining channel length/Total channel length+
Effective irrigation area ratio B11%Effective irrigated area/Total arable land+
Ratio of efficient water-saving irrigation area B12%Efficient water-saving irrigation area/Irrigation area+
Total power of agricultural machinery B13kW·h·104The total power of various power machinery mainly used for agriculture, forestry, animal husbandry and fishery+
Information level of irrigation district B14-Informatization level of irrigation district-
Agricultural production and benefit A3Agricultural unilateral aquatic output value B15Yuan/m3Agricultural output value/Water consumption+
Grain yield B16kg/hm2Food crop yield per unit area of cultivated land+
Irrigation water consumption per mu B17m3Farmland irrigation water consumption/Actual irrigated area-
Coefficient of effective utilization of farmland irrigation water B18-Net irrigation water consumption/Gross irrigation water consumption+
Water productivity B19kg/m3Yield per unit of water resources under certain crop varieties and cultivation conditions+
Cropping intensity B20-The average number of crops planted on the same plot of land in a certain period (usually a year), that is, the total sown area of crops on the cultivated land in the year/Cultivated area+
1 The index property “+” means a positive index, that is, the larger the value, the better; “-” means a reverse index, that is, the smaller the value, the better; “Intermediate” means the closer to the median, the better.
Table 2. The evaluation criteria of each index of the Helan ecological irrigation district.
Primary IndexSecondary IndexIIIIIIIVV
A1B1≥50[40, 50)[20, 40)[10, 20)<10
B2[2.4, 2.6][2, 2.4) or (2.6, 2.8][1.6, 2) or (2.8, 3][1.2, 1.6) or (3, 3.2]<1.2 or >3.2
B3≥30[10, 30)[4, 10)[2, 4)<2
B4<0.8[0.8, 1.2)[1.2, 1.6)[1.6, 2)≥2
B5<0.15[0.15, 0.5)[0.5, 1.5)[1.5, 2)≥2
B6<0.694[0.694, 0.91)[0.91, 1.16)[1.16, 1.937)≥1.937
B7<3[3, 5)[5, 10)[10, 15)≥15
B8<1500[1500, 2000)[2000, 2500)[2500, 3000)≥3000
B9≤0.2(0.2, 0.3](0.3, 0.4](0.4, 0.5]>0.5
A2B10≥75[70, 75)[60, 70)[55, 60)<55
B11≥100[80, 100)[40, 80)[25, 40)<25
B12≥20[13, 20)[5, 13)[1, 5)<1
B13≥45[42, 45)[40, 42)[38, 40)<38
B14≤1(1, 2](2, 3](3, 4]>4
A3B15≥4.43[3.77, 4.43)[2.93, 3.77)[1.87, 2.93)<1.87
B16≥7500[6000, 7500)[3000, 6000)[1500, 3000)<1500
B17<800[800, 843)[843, 932)[932, 1035)≥1035
B18≥0.7[0.6, 0.7)[0.5, 0.6)[0.45, 0.5)<0.45
B19≥3[2.5, 3)[2, 2.5)[1.5, 2)<1.5
B20≥1.317[1.272, 1.317)[1.189, 1.272)[1.088, 1.189)<1.088
Table 3. Weights.
Table 3. Weights.
Secondary IndexWeights
EWMAHPCombined Weighting Method
B10.24280.02160.1985
B20.0650.03640.0593
B30.10390.03640.0904
B40.0590.1170.0706
B50.12890.1170.1265
B60.0890.1170.0946
B70.04410.2450.0843
B80.04960.2450.0887
B90.21780.06460.1871
B100.23160.14280.2139
B110.09080.04240.0811
B120.26020.07840.2238
B130.17070.260.1886
B140.24660.47640.2926
B150.1720.16520.1707
B160.09110.38560.15
B170.19240.16520.187
B180.25210.16520.2347
B190.16530.07520.1473
B200.1270.04360.1103
Table 4. Combined evaluation values and ranks.
Evaluation ObjectEcological EnvironmentModernization LevelAgricultural Production and BenefitHealth of Ecological Irrigation District
Evaluation ValueRankEvaluation ValueRankEvaluation ValueRankEvaluation ValueRank
I-II1-0.8804-1-1-
II-III0.6555-0.584-0.6967-0.6495-
III-IV0.3402-0.2613-0.3255-0.3062-
IV-V0.0634-0.0428-0-0.0145-
20070.166590.0991100.247990.108210
20080.174880.125890.2437100.11849
20090.1403100.159180.29880.13368
20100.211670.261570.404970.26147
20110.21760.38660.458260.29926
20120.230550.529850.488250.33655
20130.25730.730320.494340.37554
20140.237240.749210.507130.37633
20150.268720.619330.587320.39242
20160.276110.574240.766910.41781
Table 5. Health grade of the ecological irrigation district.
Evaluation Object2007200820092010201120122013201420152016
Ecological environmentIVIVIVIVIVIVIVIVIVIV
Modernization levelIVIVIVIIIIIIIIIIIIIIIIII
Agricultural production and benefitIVIVIVIIIIIIIIIIIIIIIIIIII
Health of ecological irrigation districtIVIVIVIVIVIIIIIIIIIIIIIII
Table 6. The grey correlation degrees of secondary indexes.
Primary IndexSecondary IndexGrey Correlation Degree
Ecological environmentB10.72132
B20.86468
B30.55501
B40.81474
B50.71067
B60.91602
B70.71869
B80.74255
B90.71521
Modernization levelB100.93391
B110.61284
B120.91287
B130.79987
B140.84384
Agricultural production and benefitB150.89509
B160.78039
B170.85748
B180.83586
B190.89756
B200.47682
Publisher’s Note: MDPI stays neutral with regard to jurisdictional claims in published maps and institutional affiliations.

