Article

Hydrological Response of the Kunhar River Basin in Pakistan to Climate Change and Anthropogenic Impacts on Runoff Characteristics

1
Department of Agricultural Engineering, Muhammad Nawaz Shareef University of Agriculture, Multan 66000, Pakistan
2
Institute of International Rivers and Eco-Security, Yunnan University, Kunming 650500, China
3
Department of Irrigation and Drainage, University of Agriculture, Faisalabad 380000, Pakistan
4
Department of Sanitary Engineering and Water Management, University of Agriculture in Krakow, 31-120 Kraków, Poland
5
Research Center of Fluid Machinery Engineering and Technology, Jiangsu University, Zhenjiang 212013, China
6
School of Biological and Environmental Sciences, Liverpool John Moores University, Liverpool L3 3AF, UK
7
International Centre for Integrated Mountain Development (ICIMOD), Lalitpur 44700, Nepal
*
Authors to whom correspondence should be addressed.
Water 2021, 13(22), 3163; https://doi.org/10.3390/w13223163
Submission received: 22 September 2021 / Revised: 31 October 2021 / Accepted: 2 November 2021 / Published: 9 November 2021
(This article belongs to the Special Issue Hydrology in Water Resources Management)

Abstract

:
Pakistan is amongst the most water-stressed countries in the world, with changes in the frequency of extreme events, notably droughts, under climate change expected to further increase water scarcity. This study examines the impacts of climate change and anthropogenic activities on the runoff of the Kunhar River Basin (KRB) in Pakistan. The Mann Kendall (MK) test detected statistically significant increasing trends in both precipitation and evapotranspiration during the period 1971–2010 over the basin, but with the lack of a statistically significant trend in runoff over the same time-period. Then, a change-point analysis identified changes in the temporal behavior of the annual runoff time series in 1996. Hence, the time series was divided into two time periods, i.e., prior to and after that change: 1971–1996 and 1997–2010, respectively. For the time-period prior to the change point, the analysis revealed a statistically significant increasing trend in precipitation, which is also reflected in the runoff time series, and a decreasing trend in evapotranspiration, albeit lacking statistical significance, was observed. After 1996, however, increasing trends in precipitation and runoff were detected, but the former lacked statistical significance, while no trend in evapotranspiration was noted. Through a hydrological modelling approach reconstructing the natural runoff of the KRB, a 16.1 m3/s (or 15.3%) reduction in the mean flow in the KRB was simulated for the period 1997–2010 in comparison to the period 1971–1996. The trend analyses and modeling study suggest the importance of anthropogenic activities on the variability of runoff over KRB since 1996. The changes in streamflow caused by irrigation, urbanization, and recreational activities, in addition to climate change, have influenced the regional water resources, and there is consequently an urgent need to adapt existing practices for the water requirements of the domestic, agricultural and energy sector to continue being met in the future.

1. Introduction

Human development has been increasing at a substantial rate since the Industrial Revolution [1], at the expense of anthropogenic activities causing land use changes, an increase in emissions of greenhouse gases (GHGs), and therefore climate change [2]. Both changes in climate and anthropogenic activities can affect hydrological processes of a river catchment [3,4], thus impacting on water resources, hydropower production [5,6], and crop yield [7]. According to the Intergovernmental Panel on Climate Change (IPCC) [8], GHG emission have caused a 0.85 °C increase in global mean temperature with associated changes in precipitation over the period from 1880 to 2012, thus impacting on the hydrological characteristics of the catchment [9], notably the volume of runoff [10] and peaks value [11], in addition to other runoff characteristics [12].
The identification of trends in precipitation and evapotranspiration time series (or more commonly temperature as a proxy for evapotranspiration) can help us understand the complex temporal variability of streamflow. Canchala et al. [10], for example, examined the variability of river flow of two Colombian rivers, which they corelated with various indices of atmospheric teleconnections as well as precipitation. Similarly, a trend analysis was performed on the runoff of the Athabasca River Basin in western Canada [11]. The author found that the decreasing trend in streamflow in recent decades was coherent with the temperature and precipitation trends, and that the trends in hydrological variables that the catchment have recently experienced are projected to continue under climate change.
The generation of runoff and its characteristics are not only affected by climatic changes, but also by anthropogenic activities [13]. For this reason, land-use/land-cover (LULC) types and changes in the latter are important to monitor, as the hydrological response of forested land, urbanized land [14], and cultivated land [15,16] to a precipitation event does vary. Applying a catchment-based approach with regard to managing the hydrology of a river basin, including water resources availability, for the benefits of all users is thus necessary [17].
There is a growing body of research on simulating the hydrological response and estimating changes in the characteristics of streamflow to the impacts of climate change and anthropogenic activities. The impacts of anthropogenic activities on streamflow were examined by [10,11,18,19], for instance, while other studies have focused on assessing the impacts of climate change on the hydrological response [20,21,22,23,24]. However, there is a limited number of studies that investigated the hydrological response to the impacts of both climate change and anthropogenic activities in river basin [2,9,25,26,27,28,29,30], those that have been performed to date have used various methods, including hydrological modeling [31,32], statistical techniques [33,34], empirical methods [35,36] and paired catchment techniques [37,38] and paired years methods [39,40], with each method having its limitations. For instance, in the case of hydrological modeling, the models require long-term and detailed data for their calibration, which are not always available. Moreover, the calibration of the model with limited input data can causes uncertainties and discrepancies in the model outputs. Empirical methods for their part, provide physical interpretation and have fewer data requirements, hence they are usually preferred in developing countries where there are fewer resources to monitor the hydrological conditions.
Many catchments have their source in mountainous regions and hence these regions play an important role in the water balance of areas located further downstream. The majority of inhabitants of the Kunhar River Basin (KRB), located in the western Himalaya of Pakistan, for instance, rely on agriculture for their livelihoods, with the water required for the latter originating from upstream mountain areas, and used for irrigation, power generation, recreation, and municipal use [41]. The region also has great potential for tourism and for further development in hydropower generation and agriculture, which may put additional pressure on water supply in the future.
The KRB has experienced changes in LULC types in recent decades. Woods burning to meet the domestic energy needs and a growing population have caused deforestation in the uphill areas of the basin [42], with forests being replaced by grasses and shrub [43]. Moreover, slope agriculture is becoming more and more common, causing further changes to the vegetation type over the basin [44]. A study conducted by Saifullah et.al. [45] determined the threshold levels and a climate-sensitivity model for the hydrological regime of the KRB. The current study is directly associated with the water-related ecosystem that is designed in accordance with the Sustainable Development Goals of the United Nations (SDGs 6.3), to integrate climate change measures and policies (SDGs 13.2), and anthropogenic impacts (SDGs 15.1.1).
The objectives of this study are: (1) To examine the temporal variability and trends in hydro-climatic variables over the KRB (2) to quantify of the relative contribution of climate change and anthropogenic activities on the variability of runoff in the KRB.

2. Materials and Methods
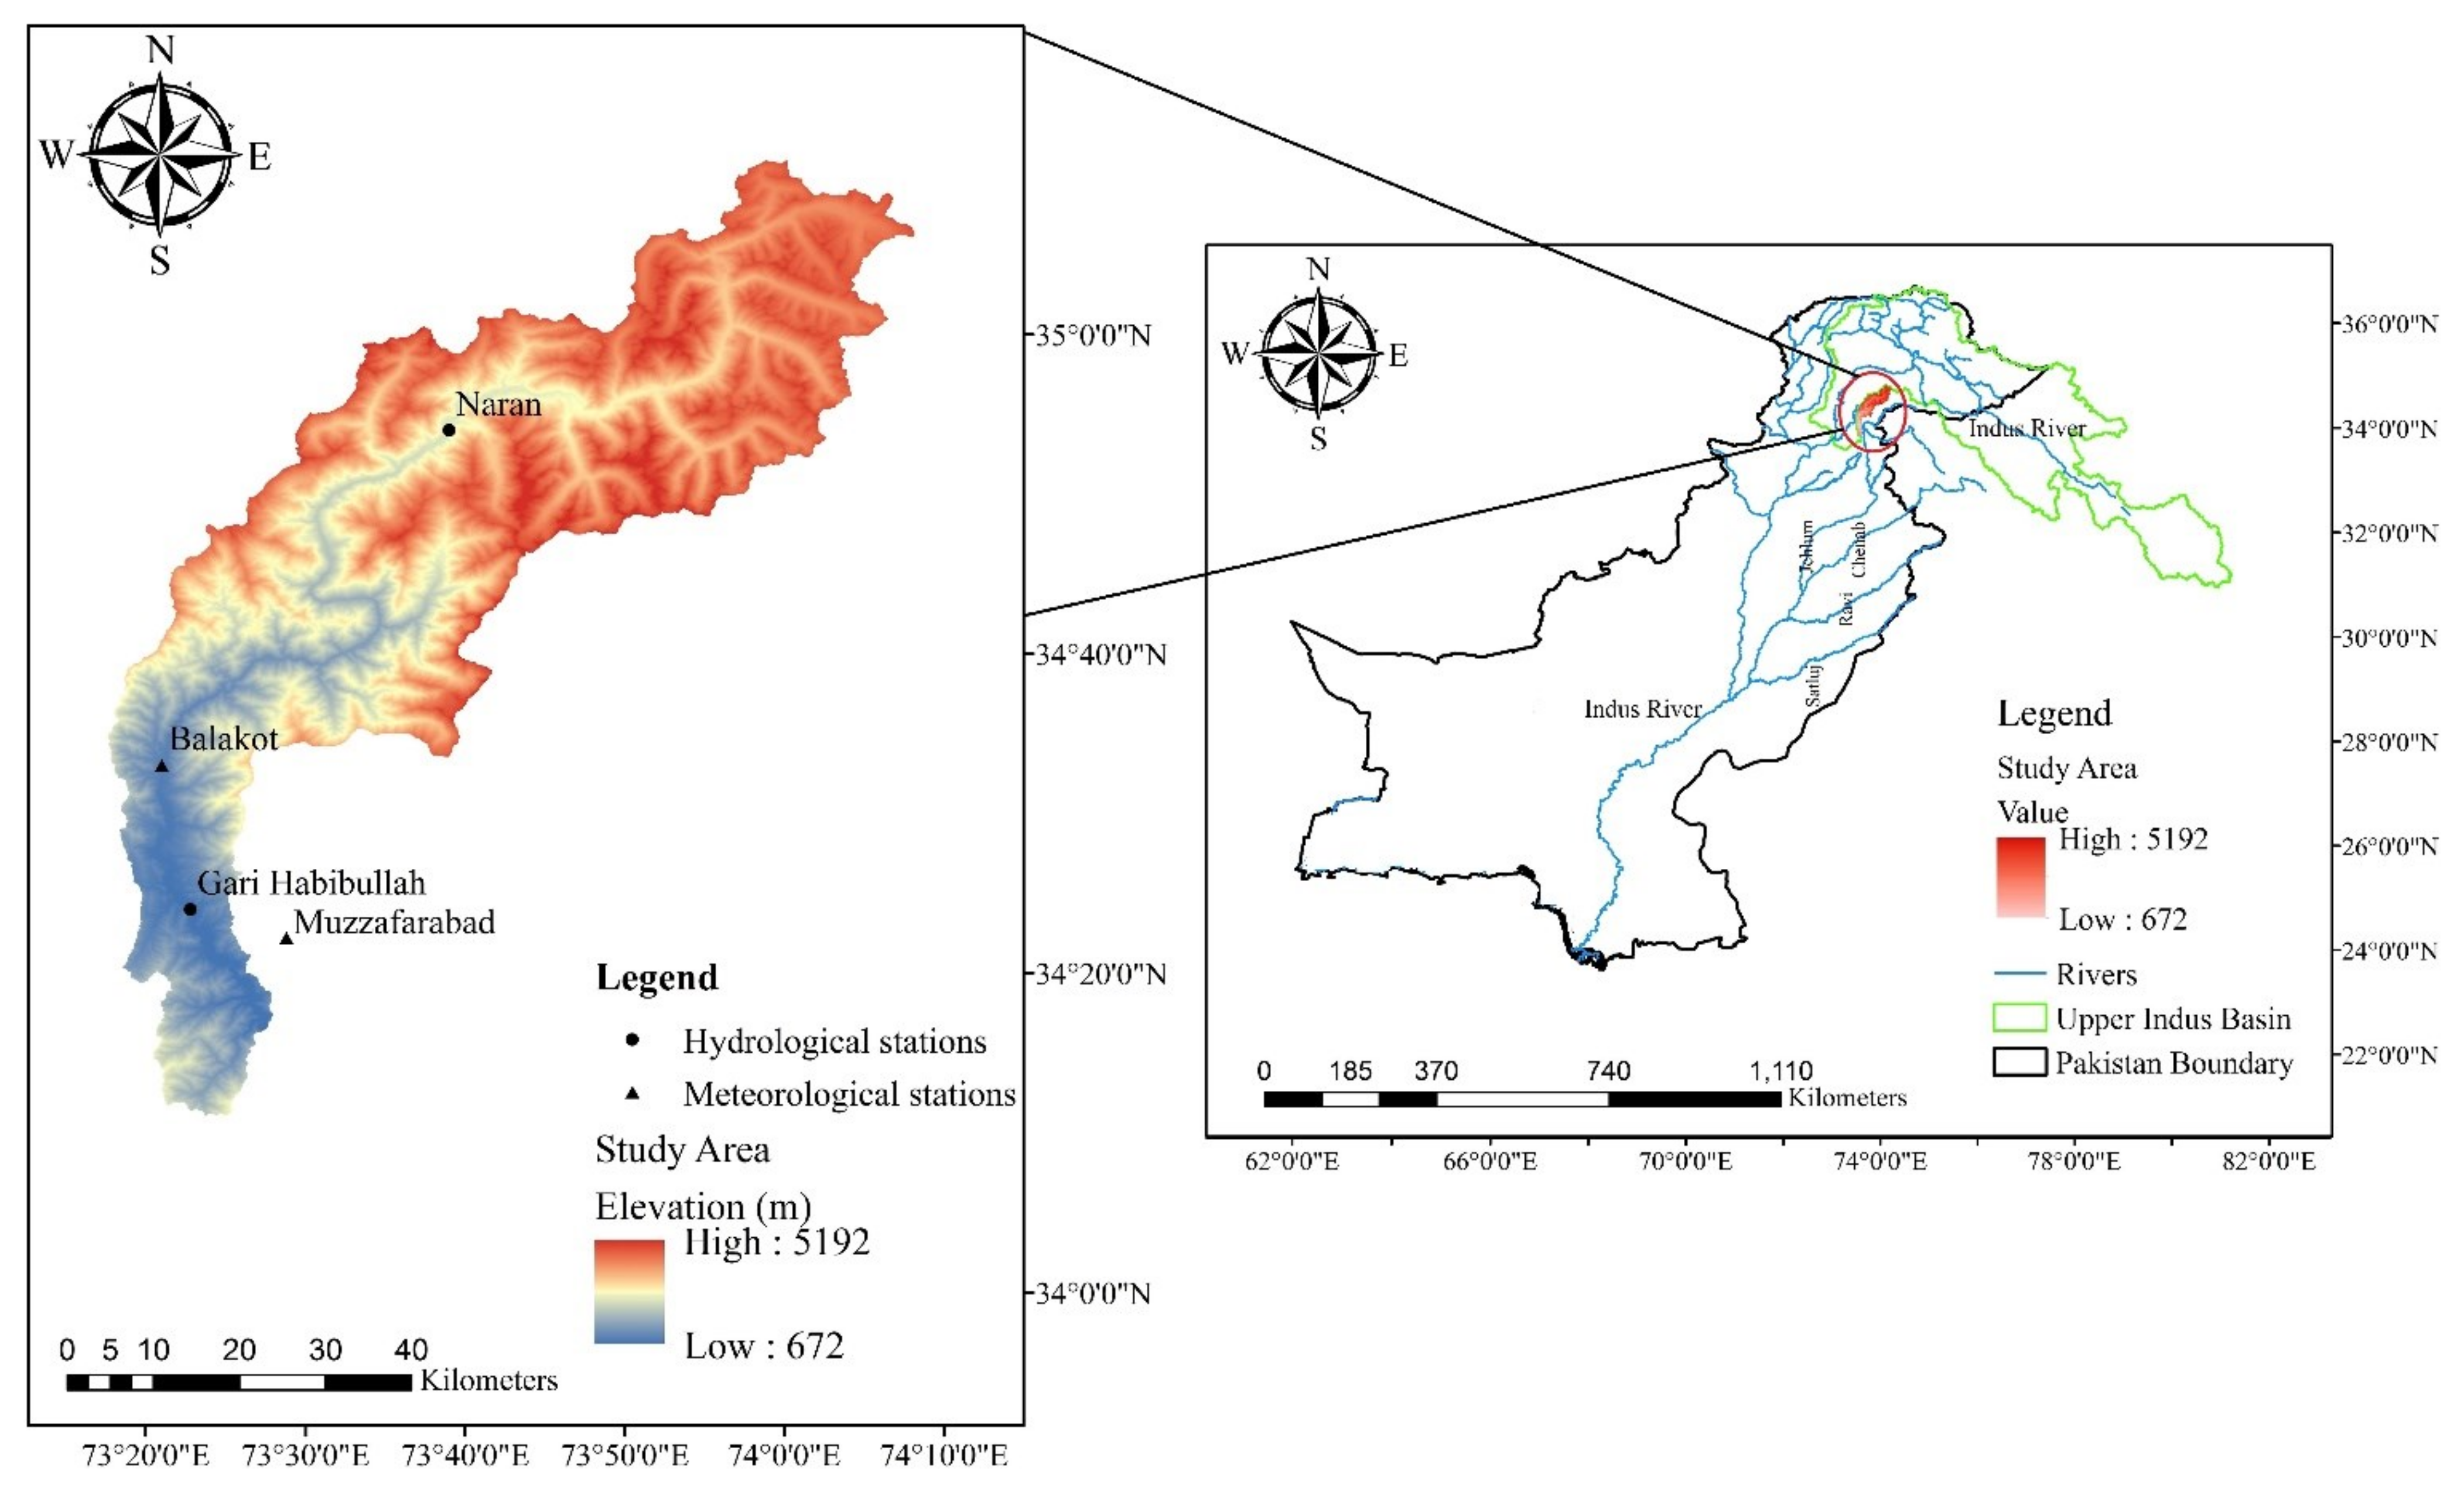
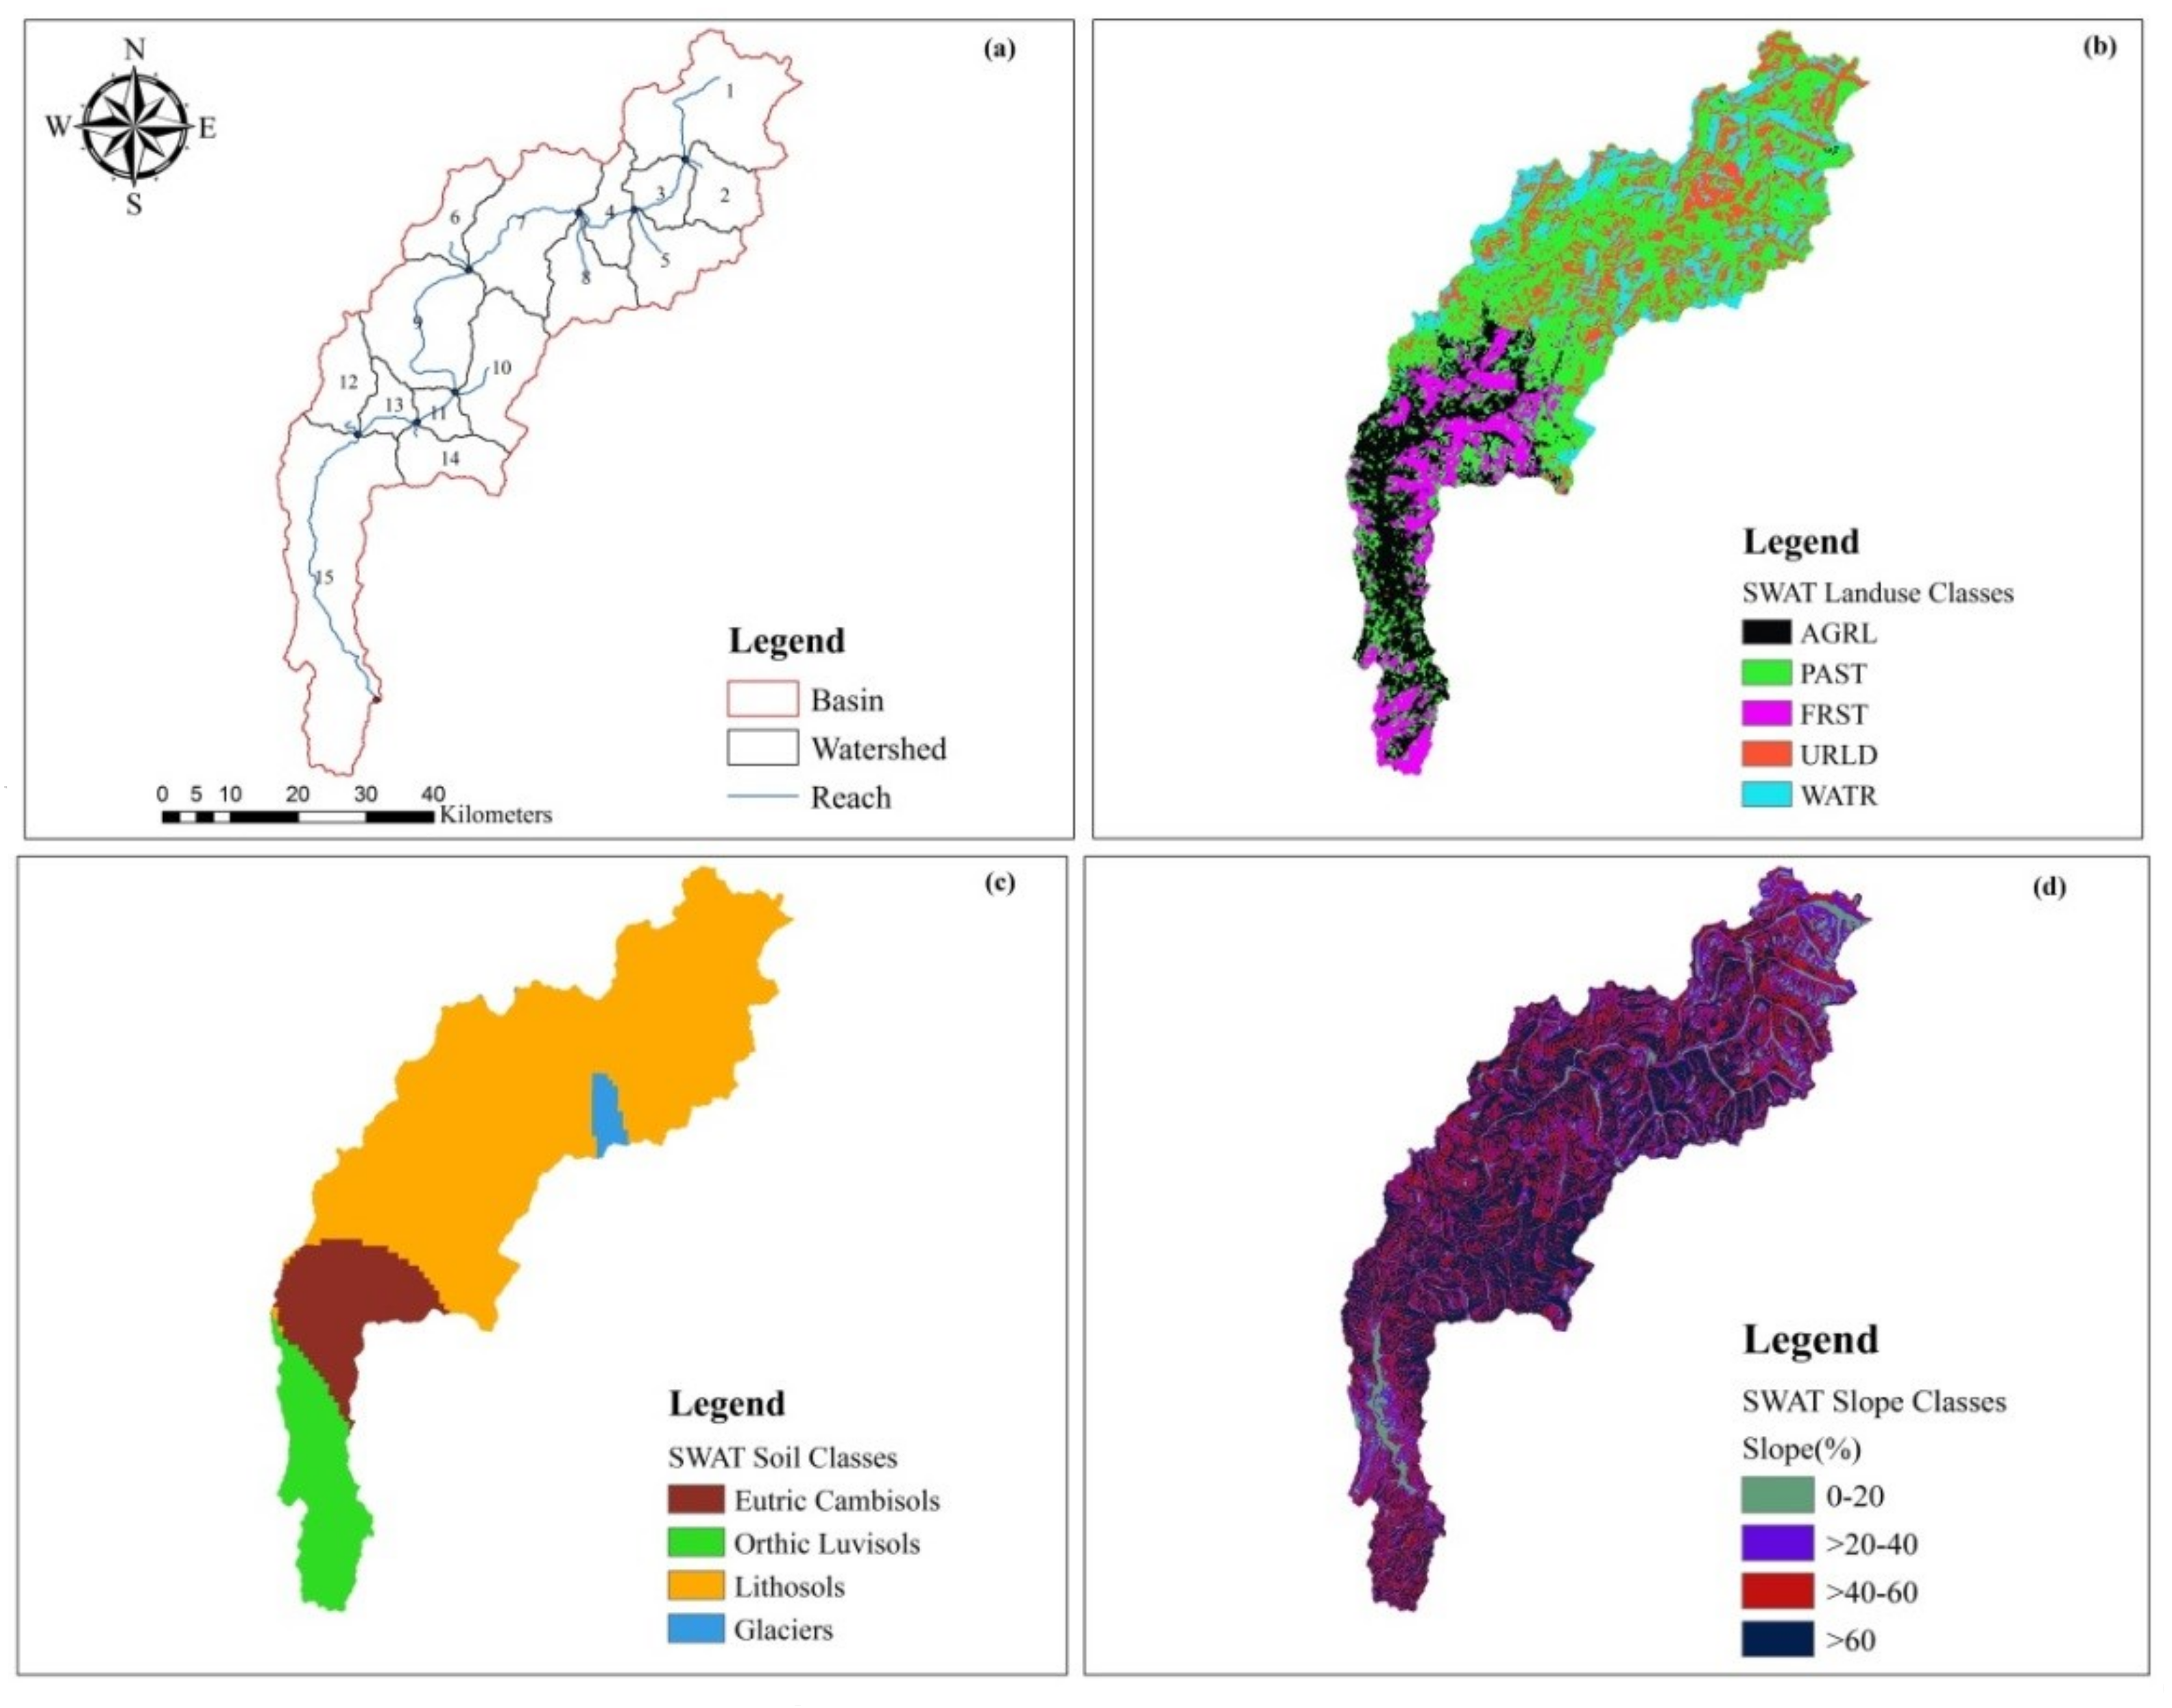
2.1. Study Area

This study was conducted in the KRB, a high-altitude catchment in Northern Pakistan (Figure 1). The Kunhar River is 171 km long; it originates in lake Lulusar in the Kaghan Valley of Khyber Pakhtunkhwa passing through the town of Jalkhand, Bata Kundi, Naran, Kaghan, Kwai, Balakot, and Garhi Habibullah and exiting into the Jhelum River at Rara [22]. The Kunhar River is an important source of water for the Mangla reservoir, which contributes nearly 11% of its water [46]. The drainage area of KRB is approximately 2600 km2, it is mountainous [44], with elevation ranging from 672 to 5192 m above sea level [47].
Mangla is the second-largest reservoir in Pakistan and its storage is used to irrigate nearly six million hectares of the country’s agricultural land, in addition to producing nearly 1000 MW of hydroelectricity [41,48]. The region experiences mild summers and cold winters. Average annual maximum temperature at Naran, Balakot, and Muzaffarabad is 12.3, 24.9, and 28.4 °C, respectively, whereas the average annual minimum temperature is 3.2, 12.4, and 13.5 °C, respectively [22]. Annual rainfall at Muzaffarabad and Balakot is on average, 1351 and 1531 mm, respectively [43]. The basin also receives a substantial amount of precipitation in the form of snowfall in the winter (December-March) [44].
The vegetation of the KRB is divers, consisting of coniferous and broadleaf forests, grasses and shrubs, in addition to bare soil and snow and glaciers, and water bodies (Figure 2, Table 1). Three dominant land cover types dominate the basin: grasses/shrubs, bare soil/rocks, and dense coniferous forests, with crops covering only 4.35% of the basin (Table 1).

2.2. Datasets and Pre-Processing

A Digital Elevation Model (DEM), with a 30 m resolution, was downloaded from the website of the United States Geological Survey (USGS) [49] and used to delineate the boundaries of the KRB. The land-cover data over the basin, for their part, were downloaded from the website of the International Center for Integrated Mountain Development (ICIMOD) [50], while the Harmonized World Soil Database v 1.2 was acquired from the website of Food and Agriculture Organization (FAO) [51]. There are two gauging stations and three meteorological stations in the KRB (Table 2). The Water and Power Development Authority (WAPDA) provided daily streamflow data from the two gauging stations, while daily temperature and precipitation data were obtained from the Pakistan Meteorological Department (PMD). Wind speed, solar radiation, and relative humidity were extracted from the ERA5 reanalysis dataset at an hourly time scale [52]. The analyses were performed at the monthly and annual time scales, but some methods required daily data, e.g., the hydrological model, as described below.

2.3. Methods

2.3.1. Mann Kendall Trend Test

Mann-Kendall (MK) trend test [53,54], calculated using Equations (1) and (2), is a commonly used non-parametric test to detect trends in a climatological and hydrological time series.
S = i = 1 n 1 j = i + 1 n s g n x j x i
s g n x j x i = + 1 ,     x j > x i     0 ,     x j = x i 1 ,     x j < x i
where xi and xj denote the data values at times i and j, respectively, n specifies the length of the data set. A positive value of S indicates an increasing trend, while a negative value refers to a decreasing trend. The variance of S, Var(S), is calculated using Equation (3), assuming a normally distributed time series with n > 10 and.
V a r S = n n 1 2 n + 5 i = 1 n t i i i 1 2 i + 5 18
where ti denotes the number of data ties. The test statistic, Z, is then calculated using Equation (4).
z = S 1 v a r S       S > 0 0       S = 0 S 1 v a r S       S < 0                                                      
In a two-tailed test, the standard Z value is compared with the standard normal distribution table at a 5% significance level (α). The null hypothesis (Ho) is rejected if |Z| > |Z1-α/2|, meaning that the trend is statistically significant, otherwise Ho is accepted, i.e., there is no presence of a statistically significant trend in the time series at the 95% confidence level.

2.3.2. Innovative Trend Analysis

The Innovative Trend Analysis (ITA) was proposed by Sen [55]. The technique consists of the dividing a time series into two subsets. Hence, the observed hydrological time series was divided into two sub-series after having re-arranged the time series in ascending order. Based on the Cartesian coordinate system, the first sub-series (Xi) is drawn on X-axis while the second (Xj) is on Y-axis as shown in Figure 3. Generally, the hydrological time series is described as trendless if it is located on the 1:1 (45°) straight line whereas it is a decreasing trend in time series if the data values are found below the triangular area of the straight line (45°), and an increasing trend if it is above it.

2.4. Change Point Analysis

A change-point analysis, as described in [11], was conducted on the time series with the purpose of determining the presence of abrupt changes in time series. Test determines the number of change points and estimate their time occurrence. This study used the Combinations of the Sum Boxes (CUSUM) plot to determine the change point in a time series. This procedure is described in [56] procedure. The accumulated sum of data points i.e., X1, X2, …, X24 is calculated and CUSUM graphs are produced. Moreover, in general, the average value displays periods that are greater than the average. Mostly, the values are below the average and the downward slope segment is displayed by the sudden changes in CUSUM direction, which points out an average or sudden change. The period of the CUSUM column is straightforward when the average or sudden change does not occur.

2.5. Double Mass Curve Analysis

The consistency of of hydrological time series is checked by comparing data for a single station using double mass curve analysis [57]. It can be used to correct the unstable precipitation data. It is basically a fraction of the accumulated image arithmetic figures in a variable different from the accumulated figures of another variable or the same variable occasionally. The relative mass ratios of these variables change concerning the interrelations between the variables. This may be due to changes in the data collection procedure or might be the physical changes that mark the relationship. It must not be thought that all discrepancies shown by a double mass curve were inconsistent due to changes in data collection methods or errors in data collection.

2.6. Flow Duration Curve

Flow Duration Curve (FDC) [58] is a graphical representation of the overall historical variability in river flow. FDC is a corresponding distribution function of daily flows. The probability that a certain value will be exceeded in a predefined future period is called the probability of exceedance. It is used to predict extreme events such as floods, hurricanes, and earthquakes. The exceedance probability P can be calculated using Equation (5).
P = M n + 1 × 100
where M specifies the ranked position on the listing (dimensionless) and n denotes the number of events during the data record. The exceedance predicts the probability of a given streamflow [11]. Further detail about FDC can be found in a study conducted by [11].

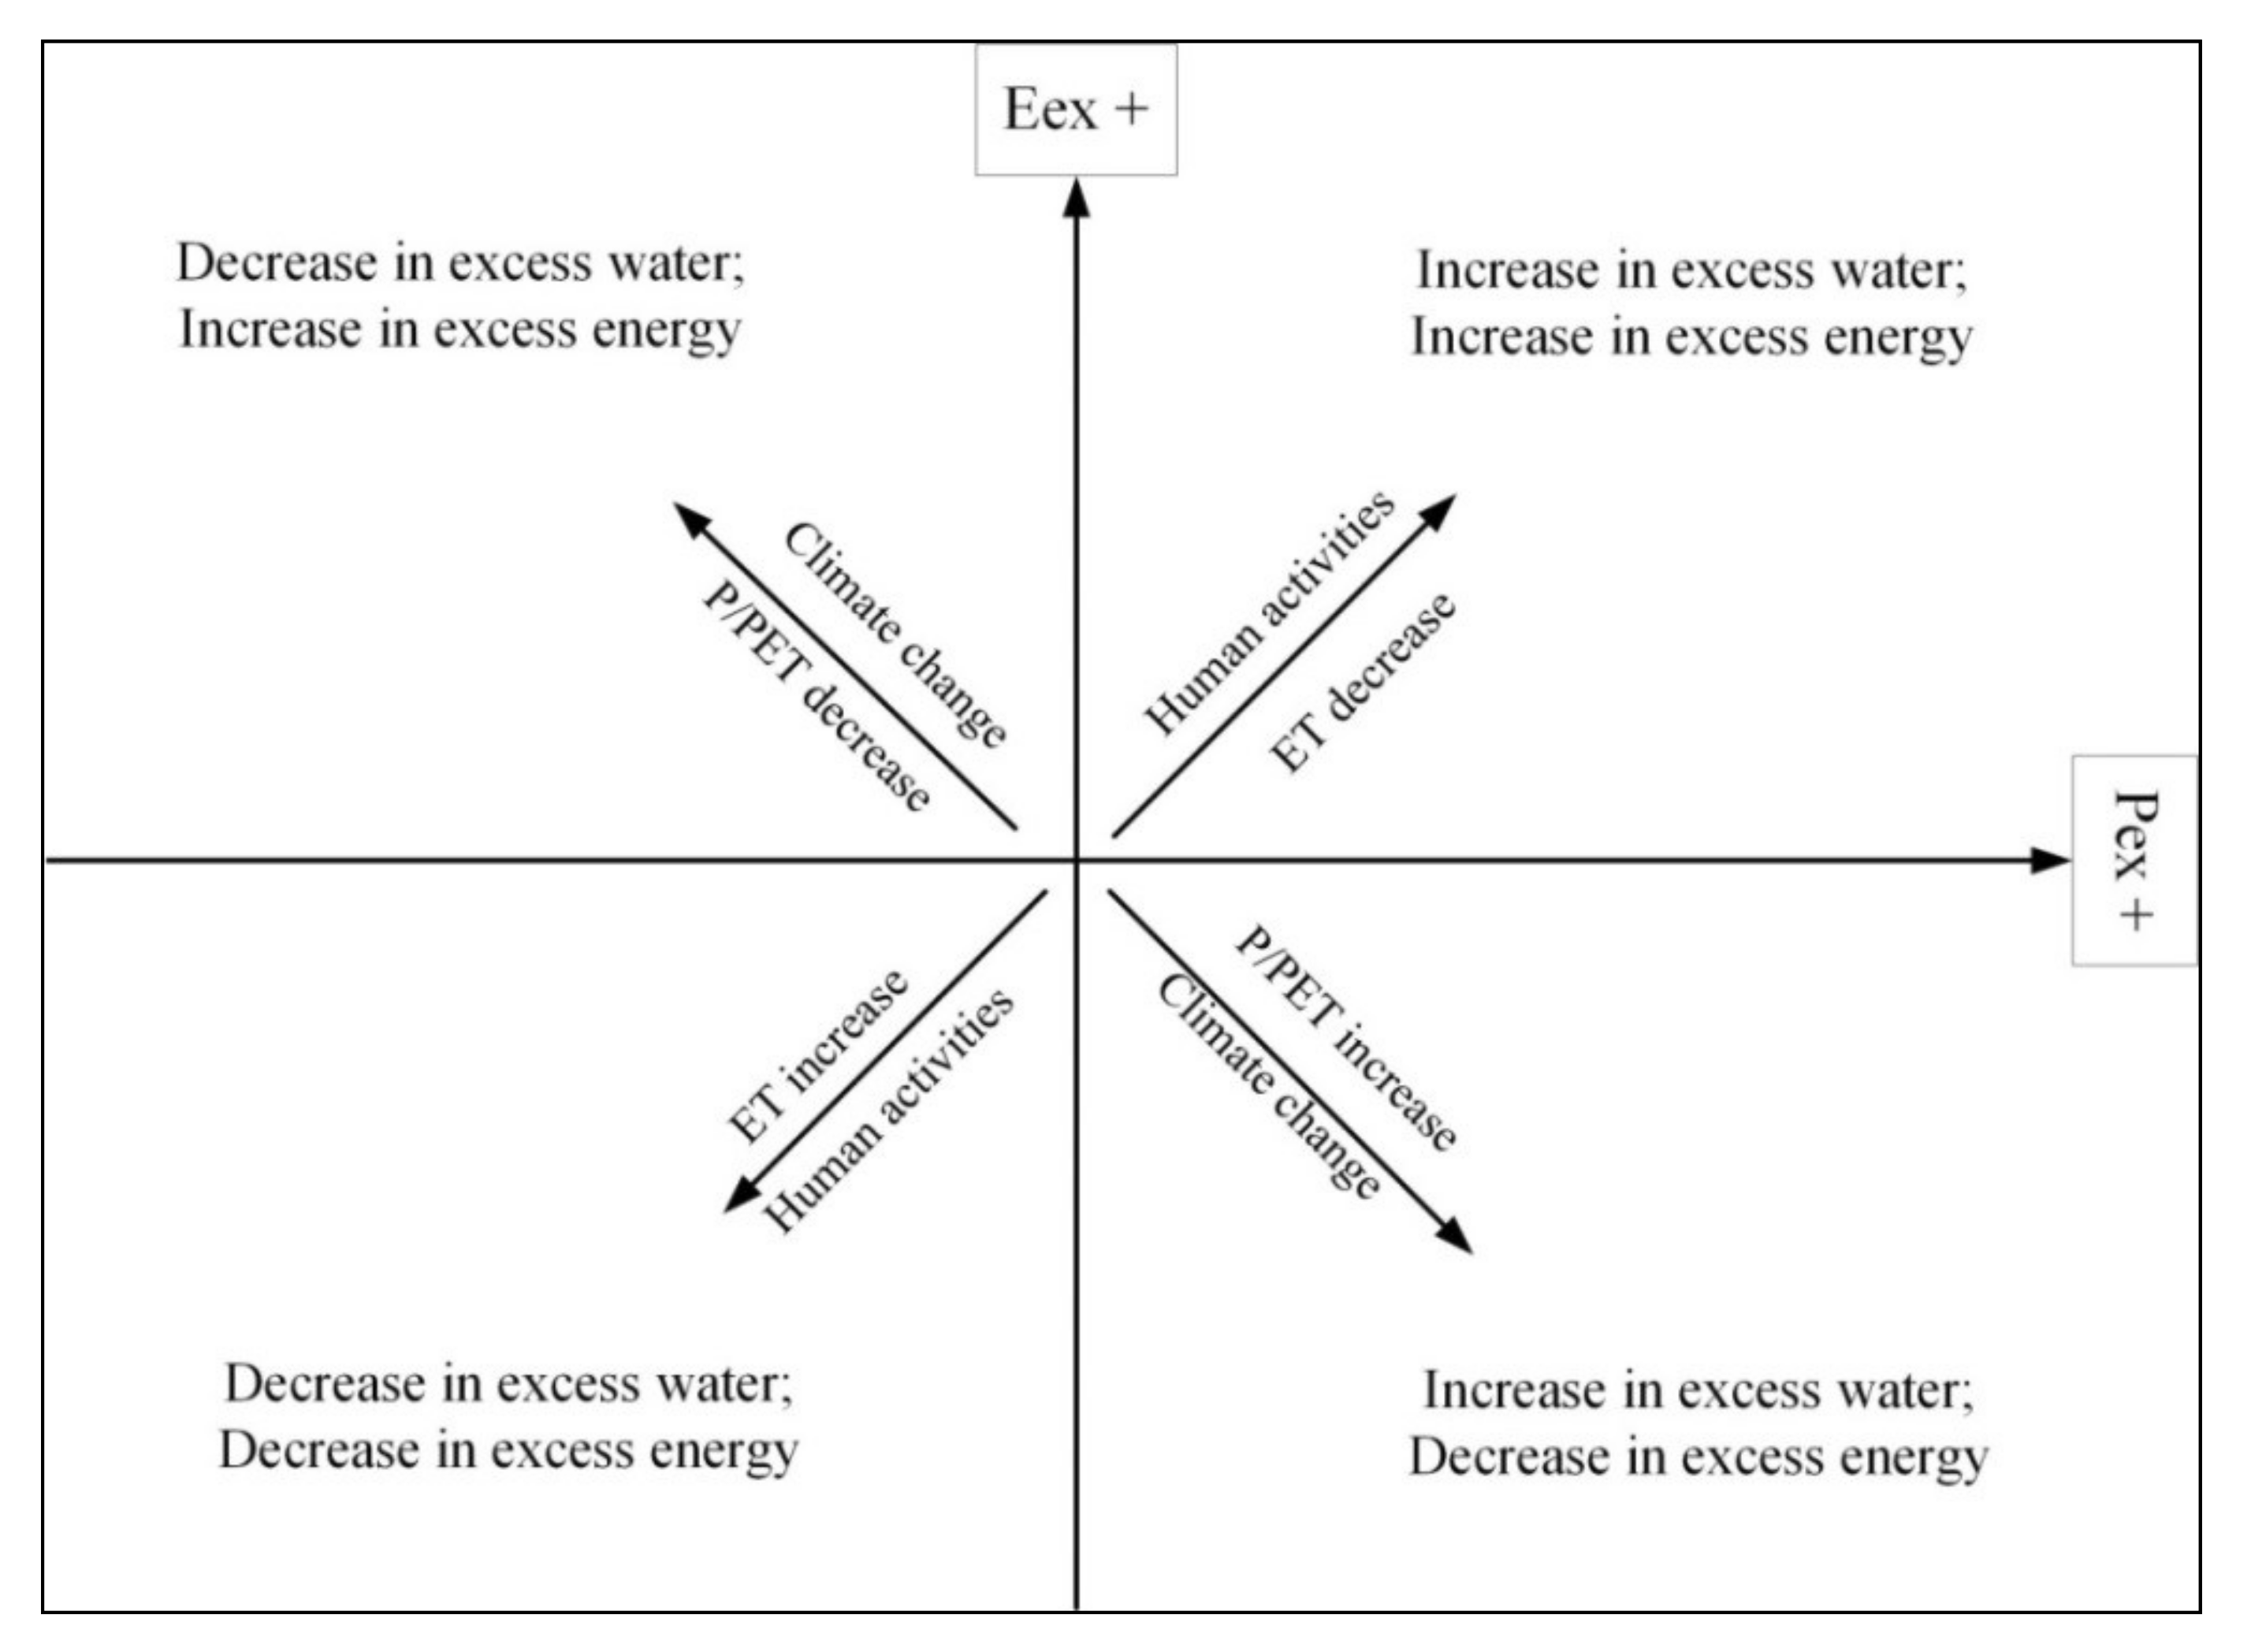
2.7. Eco-Hydrological Framework

This framework focuses on studying the interactions between water and ecological systems. The annual hydrological budget for a catchment can be expressed by Equation (6):
P = E T + Q + D + Δ S
where P stands for precipitation, ET for the evapotranspiration, Q for streamflow, D for deep groundwater losses, and Δ S for the changes in storage. Deep groundwater losses and changes in water storage can reasonably be assumed to be zero over a long time period. The available water and energy in an agricultural watershed can be assessed through the excess water P E x and excess energy ( E E x ) , which can be estimated using the following equations:
P E x =   P   E T P
  E E x = P E T     E T P E T
where PET denotes potential evapotranspiration. The value of P E x and E E x can range from 0 to 1. PET denotes potential evapotranspiration. The eco-hydrological analysis represented by Figure 4 is an example of the conceptual model that is applicable for understanding the soil water conservations measures and climatic variability impacts on watershed hydrology [59].

2.8. Climate Elasticity Model

Climate change impacts can also be assessed using the climate elasticity model [35,60,61]. Schaake [60] presented the concept of climate elasticity to assess the sensitivity of streamflow to climate changes. It can be defined as the relative change in streamflow divided by the relative change in a climate variable, precipitation for instance. Schaake [60] defined the precipitation elasticity, ε p , through Equation (9):
ε p P , Q = d Q Q d p P = d Q d P P Q
where P and Q represent precipitation and streamflow, respectively, and ε p denotes the precipitation elasticity. The precipitation elasticity of streamflow is a random variable that depends on P and Q. A non-parametric estimator of precipitation elasticity was defined by [35]. Another similar study conducted by [62] defined an estimator of precipitation elasticity of streamflow by Equation (10) given below:
Δ Q i Q ¯ = ε p .   Δ P i P ¯  
where ΔQi and ΔPi represents a change in annual streamflow and precipitation in comparison to the long-term average of Q and P, respectively. The current study used historical data of precipitation and streamflow from 1971 to 1996 for the calculating the precipitation elasticity. It also considers the impacts of evapotranspiration in the climate elasticity model by adding evapotranspiration to Equation (10), resulting in Equation (11):
Δ Q i Q ¯ = ε p .   Δ P i P ¯ + ε e t .   Δ E T E T ¯
where εp and ε e t designate precipitation and evapotranspiration elasticity of streamflow, respectively, in multiple regression systems whereas ΔET represents a change in annual mean evapotranspiration in comparison to the long-term mean evapotranspiration (ET).

2.9. Statistical Model

The linear regression between averaged annual precipitation (Pref) and annual runoff (Qref) can be represented by Equation (12):
Q r e f = a P r e f + b E T + c  
where ‘a and b’ represents the regression equation constant and ‘c’ denotes the regression intercept. The coefficients of the equation are determined by the least square method. Climate variability is due to external factors such as a, change in LULC and climate variability as represented by Equation (13):
Δ Q t o t a l = Δ Q p + Δ Q L
where Δ Q t o t a l denotes a change in observed mean annual streamflow which is the result of a change in streamflow due to climate change ( Δ Q p ) and anthropogenic activities ( Δ Q L ). Equation (14) specifies the difference between streamflow of the reference period and change period and the output is a change in average annual streamflow ΔQ.
Δ Q = Q 2 Q 1
where ΔQ denotes the change in average annual streamflow, Q 1 denotes the streamflow of the reference period whereas Q 2 denotes the streamflow during the change period.

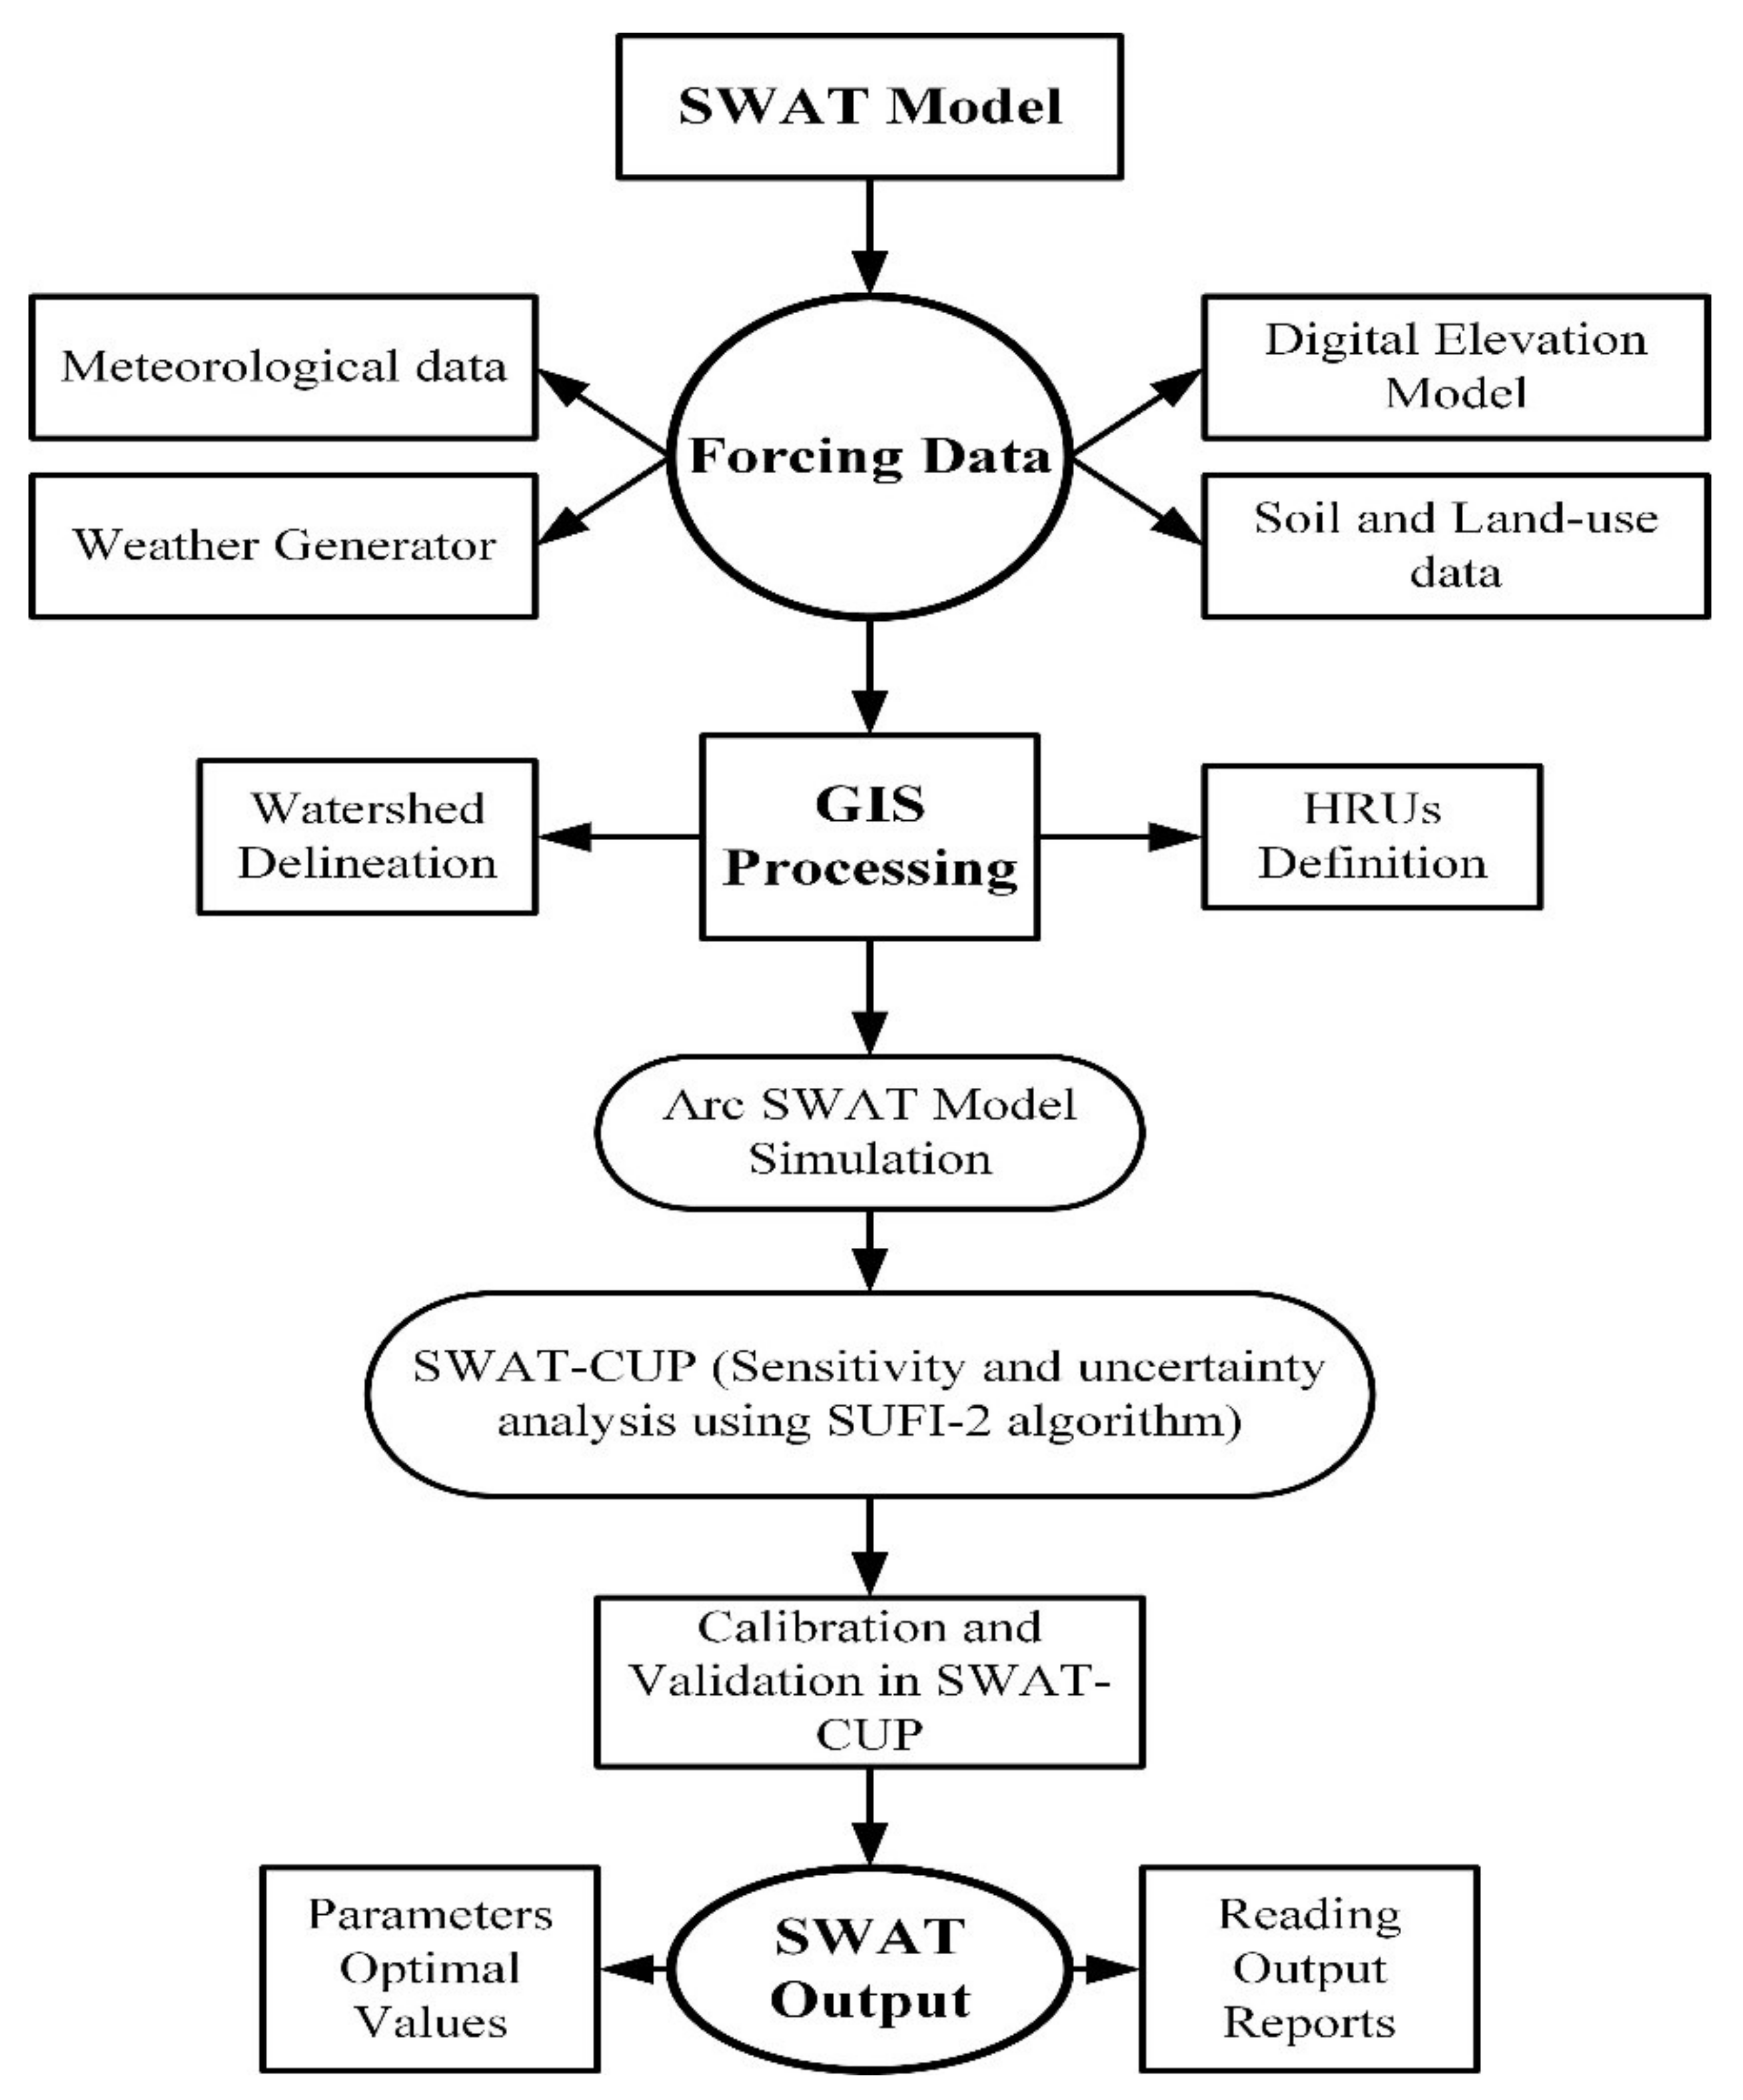
2.10. Hydrological Modeling

The Soil and Water Assessment Tool (SWAT) is a semi-distributed river basin scale model that can be used to compute the impacts of land-use changes by using climatic and streamflow data over a long period [32,63]. The SWAT model is based on the physical characteristics of the basin. In the Arc SWAT model, a watershed is divided into multiple subbasins and then each subbasin is further sub-divided into Hydrological Response Units (HRUs). The SWAT model simulates streamflow based on the following water balance Equation (15) [64]:
S W t = S W 0 + i = 1 t ( R d a y Q s u r f E a W s e e p Q g w )
where SWt denotes the final soil water content (mm); SW0 denotes the initial soil water content on the day i; ‘t’ designates the time (days); Rday specifies the amount of precipitation on the day i (mm); Qsurf represents the amount of precipitation on the day i (mm); Ea denotes the amount of evapotranspiration on the day i (mm); Wseep specifies the amount of water entering the vadose zone from the soil profile on the day i (mm) and Qgw represents the amount of return flow on the day i (mm).
The simulated runoff in the SWAT model can be achieved at the HRUs level by using the Soil Conservation Service (SCS) curve number method [65]. This method mainly depends on the soil, land cover, and hydrological characteristics. The basic equation of the SCS curve number method:
Q s u r f = R d a y 0.2 S 2 R d a y + 0.8 S
where Qsurf denotes the daily surface runoff (mm), Rday specifies the daily rainfall (mm) and S represents the retention parameter (mm). The parameter ‘S’ changes due to change in soil, land-use, water conservation measures, slope, and also with time due to variations in the soil water contents of the watershed. The retention parameter can be defined by Equation (17):
S = 25.4 1000 C N 10        
where S denotes the retention parameter which gives the value of the drainable volume of soil water per unit area of the saturated thickness (mm/day); CN represents the curve number. A more detailed explanation of the SWAT model can be found [65].
The current study divided the KRB into 15 subbasins and 223 HRUs were created based on the areas with homogeneous soil types, vegetation, and slope (Figure 5). The number of subbasins divisions depends on the stream networks of the watershed. Generally, the runoff values are not affected by the number of subbasins [66]. The land use, soil, and slope classification of the KRB in the Arc SWAT model are displayed in Figure 5. The major land-use type in the KRB is pasture whereas the major soil type is lithosols. The slope map shows that a major part of the basin lies at a slope greater than 60% (Figure 5).

2.10.1. Model Setup

The SWAT model requires the preparation of the forcing data such as soil type, land use, DEM, and climatic data. The key steps in the application of the SWAT model are displayed in Figure 6 and include; (a) watershed delineation and subbasin feature derivation; (b) HRU definition; (c) climatic inputs and weather generator; (d) simulation of the SWAT model; (e) sensitivity and uncertainty analysis, and (f) calibration and validation of the SWAT model.
The surface runoff volume was computed using the SCS curve number method [67]. The Penman-Monteith method was used for the calculation of evapotranspiration [68,69]. The SWAT model was run at the monthly time scale. The SWAT calibration and uncertainty program (SWAT-CUP) [70] was used for calibration, validation, sensitivity, and uncertainty analysis using the sequential uncertainty fitting algorithm (SUFI-2 algorithm). The SWAT model was calibrated for the period (1972–1981) and validated (1983–1996) against the observed flows at Gari Habibullah streamflow gauging station in SWAT-CUP.
The sensitivity analysis was performed in SWAT-CUP to determine the parameters that streamflow is most sensitive to. A total of 18 parameters of the SWAT model that relate to surface runoff, groundwater, and snowmelt were selected for model calibration in Table 3. The parameters related to snowmelt such as SMFMX, SMFMN, SFTMP and SMTMP, TLAPS, and others such as CN2, PLAPS, and ALPHA_BF were found to be more sensitive in the KRB as the basin is mainly snow-fed.

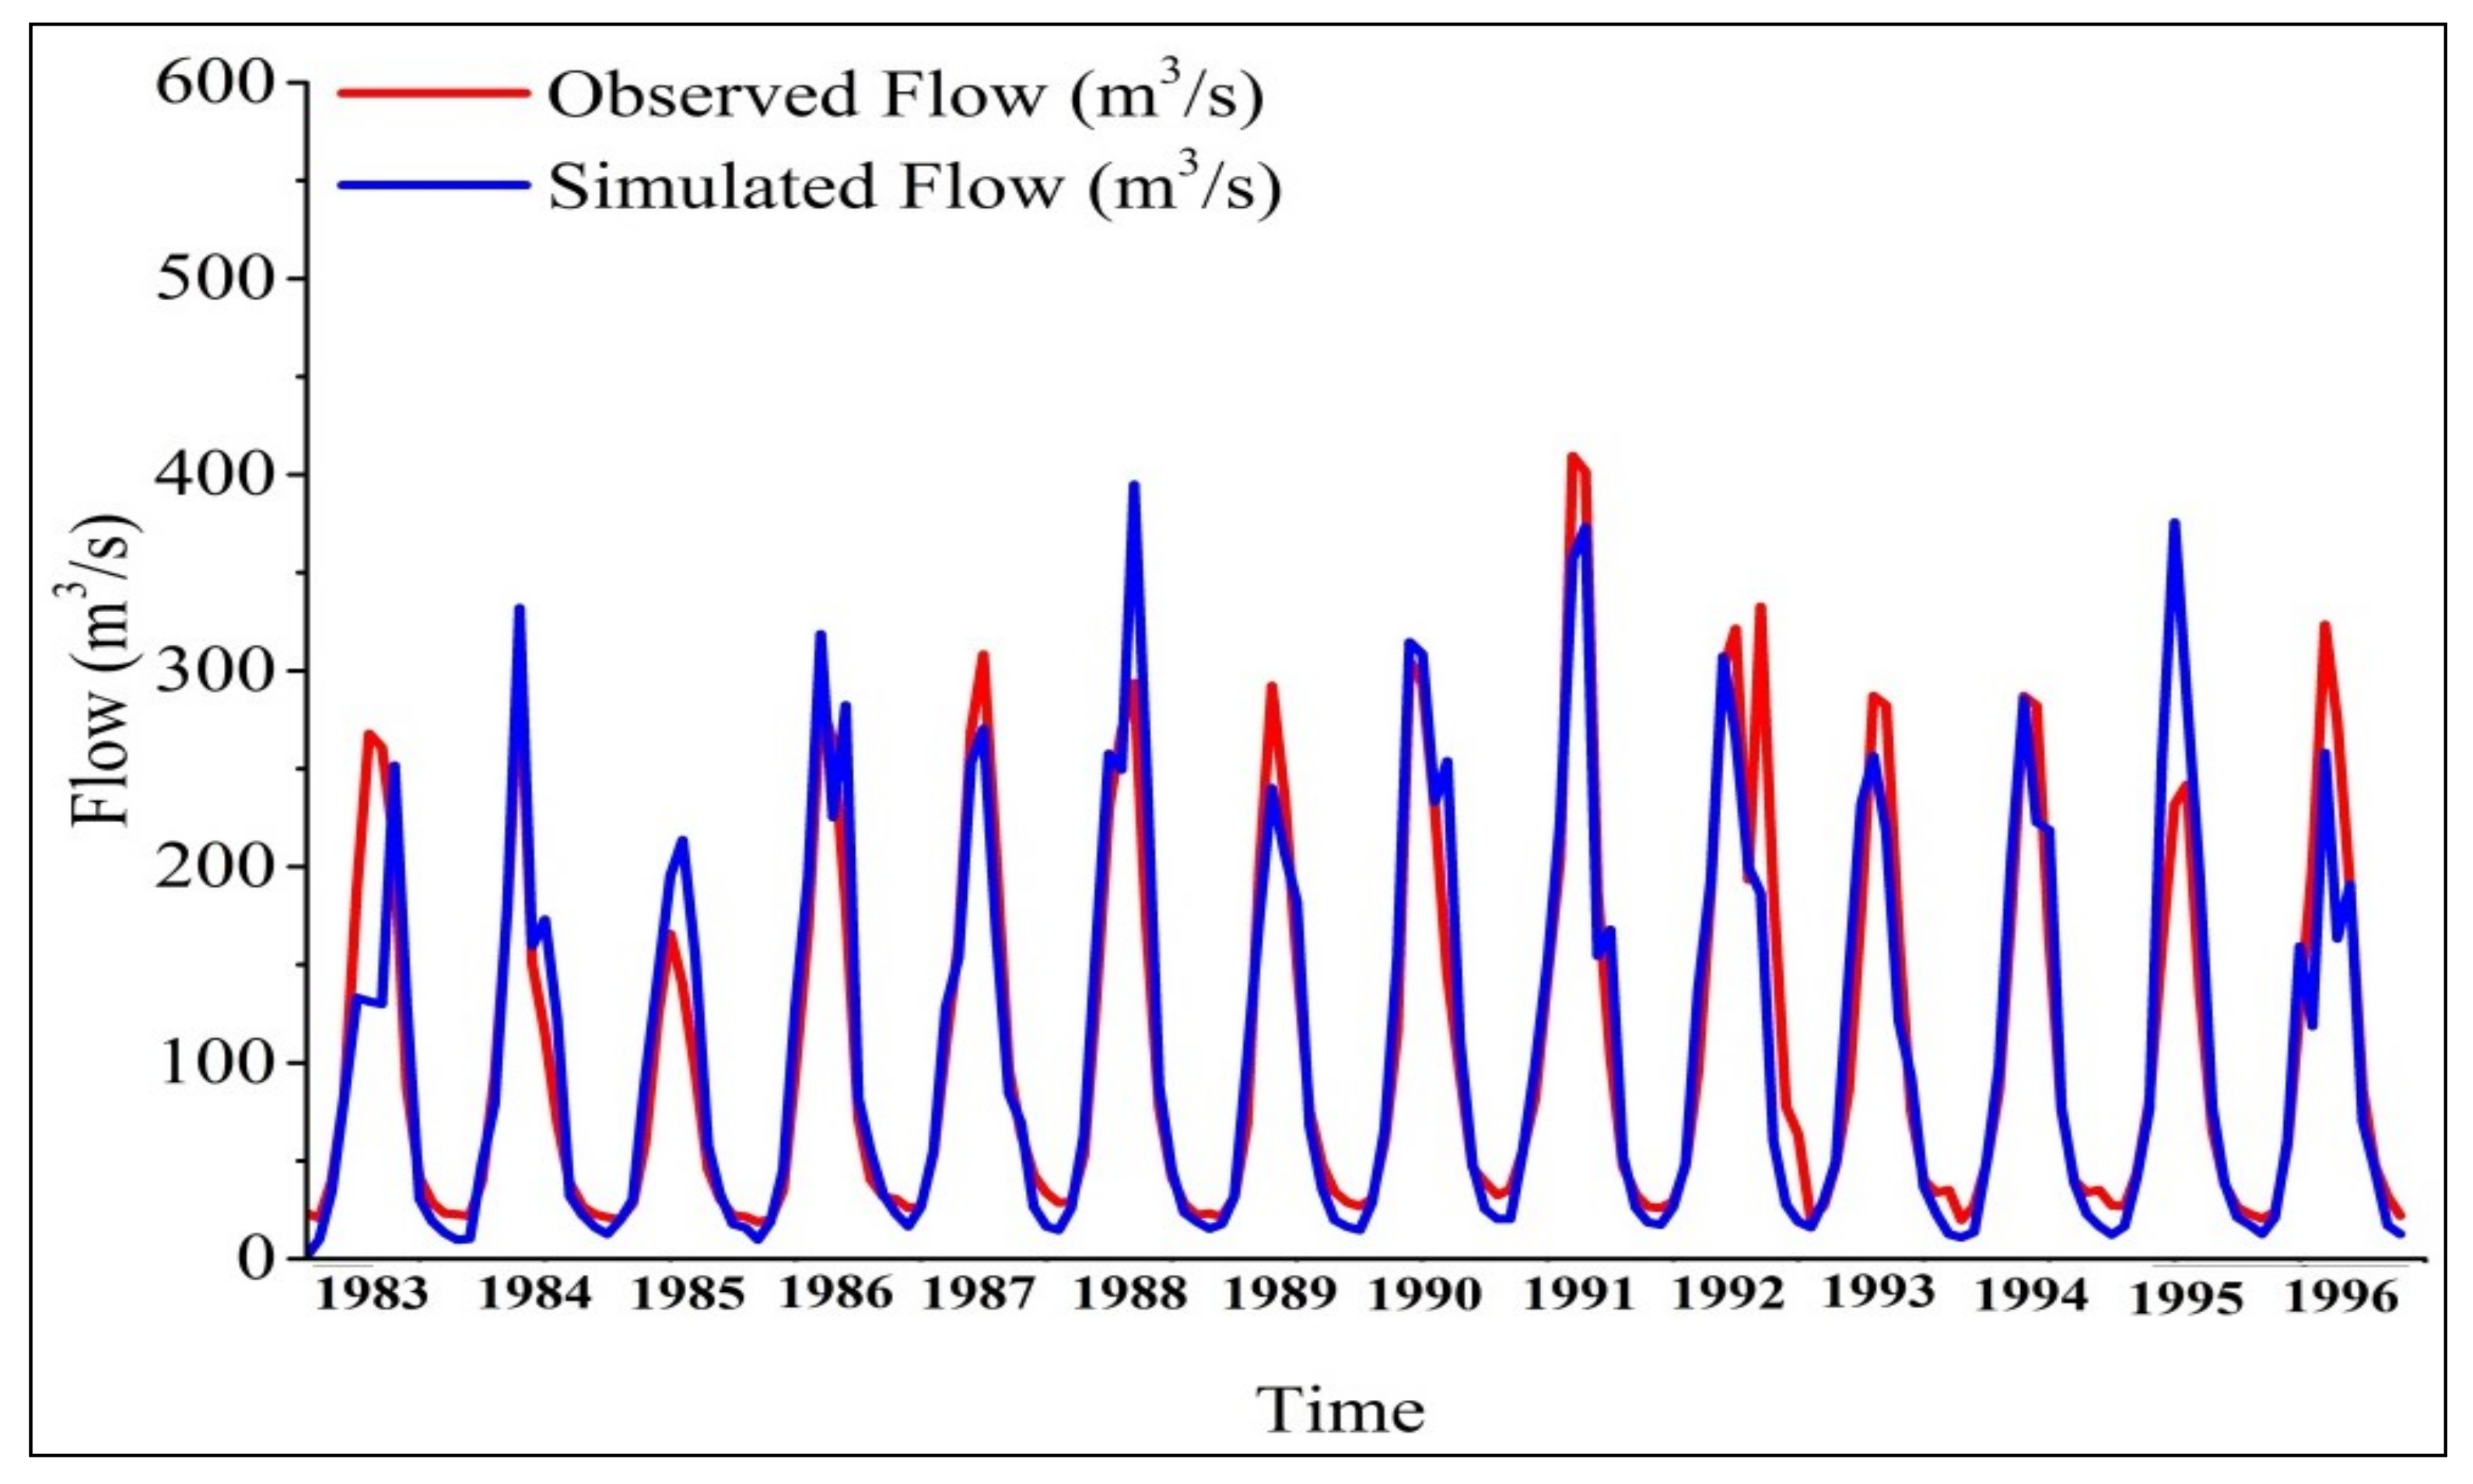
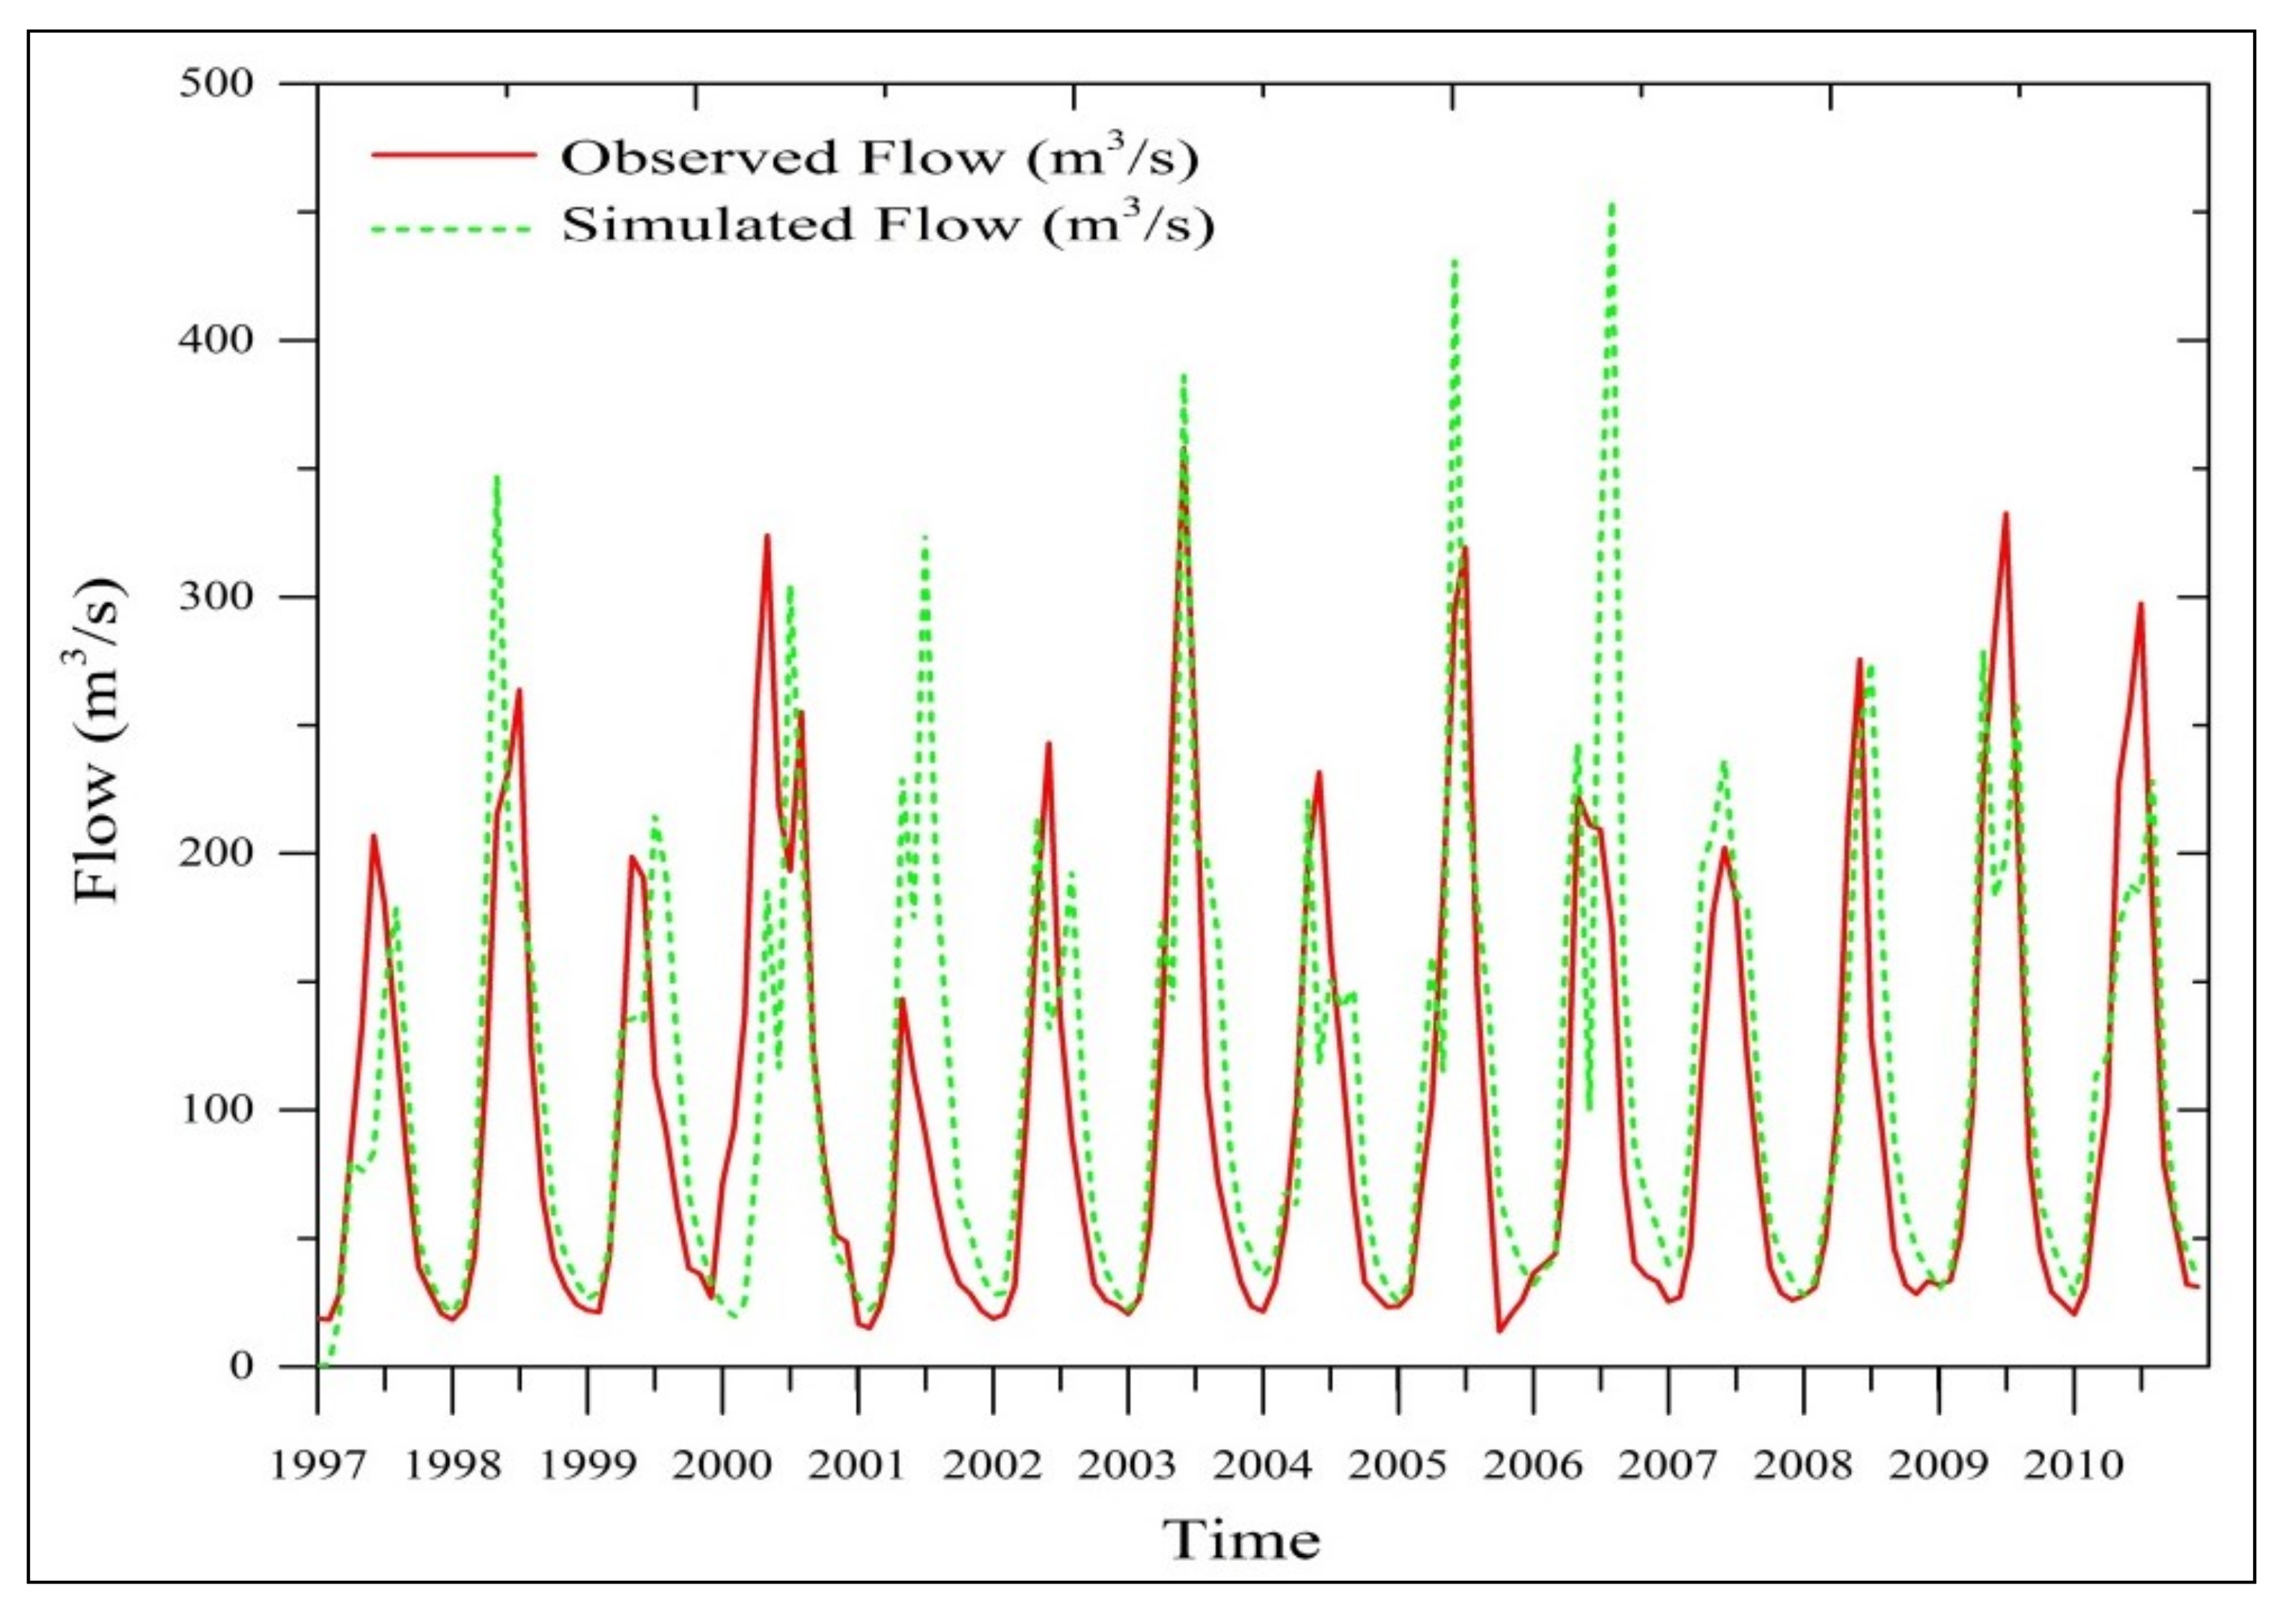
2.10.2. Model Performance and Evaluation Criteria

The performance of the SWAT model was assessed using the Nash-Sutcliffe model efficiency (NSE) and coefficient of determination (R2):
NSE = 1 i = 1 n Q 0 Q s 2 i = 1 n Q 0 Q ¯ o 2
R 2 = i = 1 n Q o Q ¯ o Q s Q ¯ s i = 1 n Q o Q ¯ o 2 i = 1 n Q s Q ¯ s 2 2      
where i denotes the time step and n specifies the total number of simulated time steps. Qo and Qs represent the observed and simulated streamflow values, respectively. NSE specifies how well the graph between observed and simulated data fits the 1:1 line. The value of NSE is considered satisfactory when NSE is higher than 0.5 [71]. The greater value of NSE, the better is the model accuracy. The model’s simulations are considered perfectly fit if NSE = 1 [72].
Whereas, R2 measures the strength of the linear relationship between the simulated and observed streamflow time series. R2 value can range between 0 and 1. The model is considered ideal if the R2 value is equal to 1, and satisfactory if R2 > 0.6 [71].

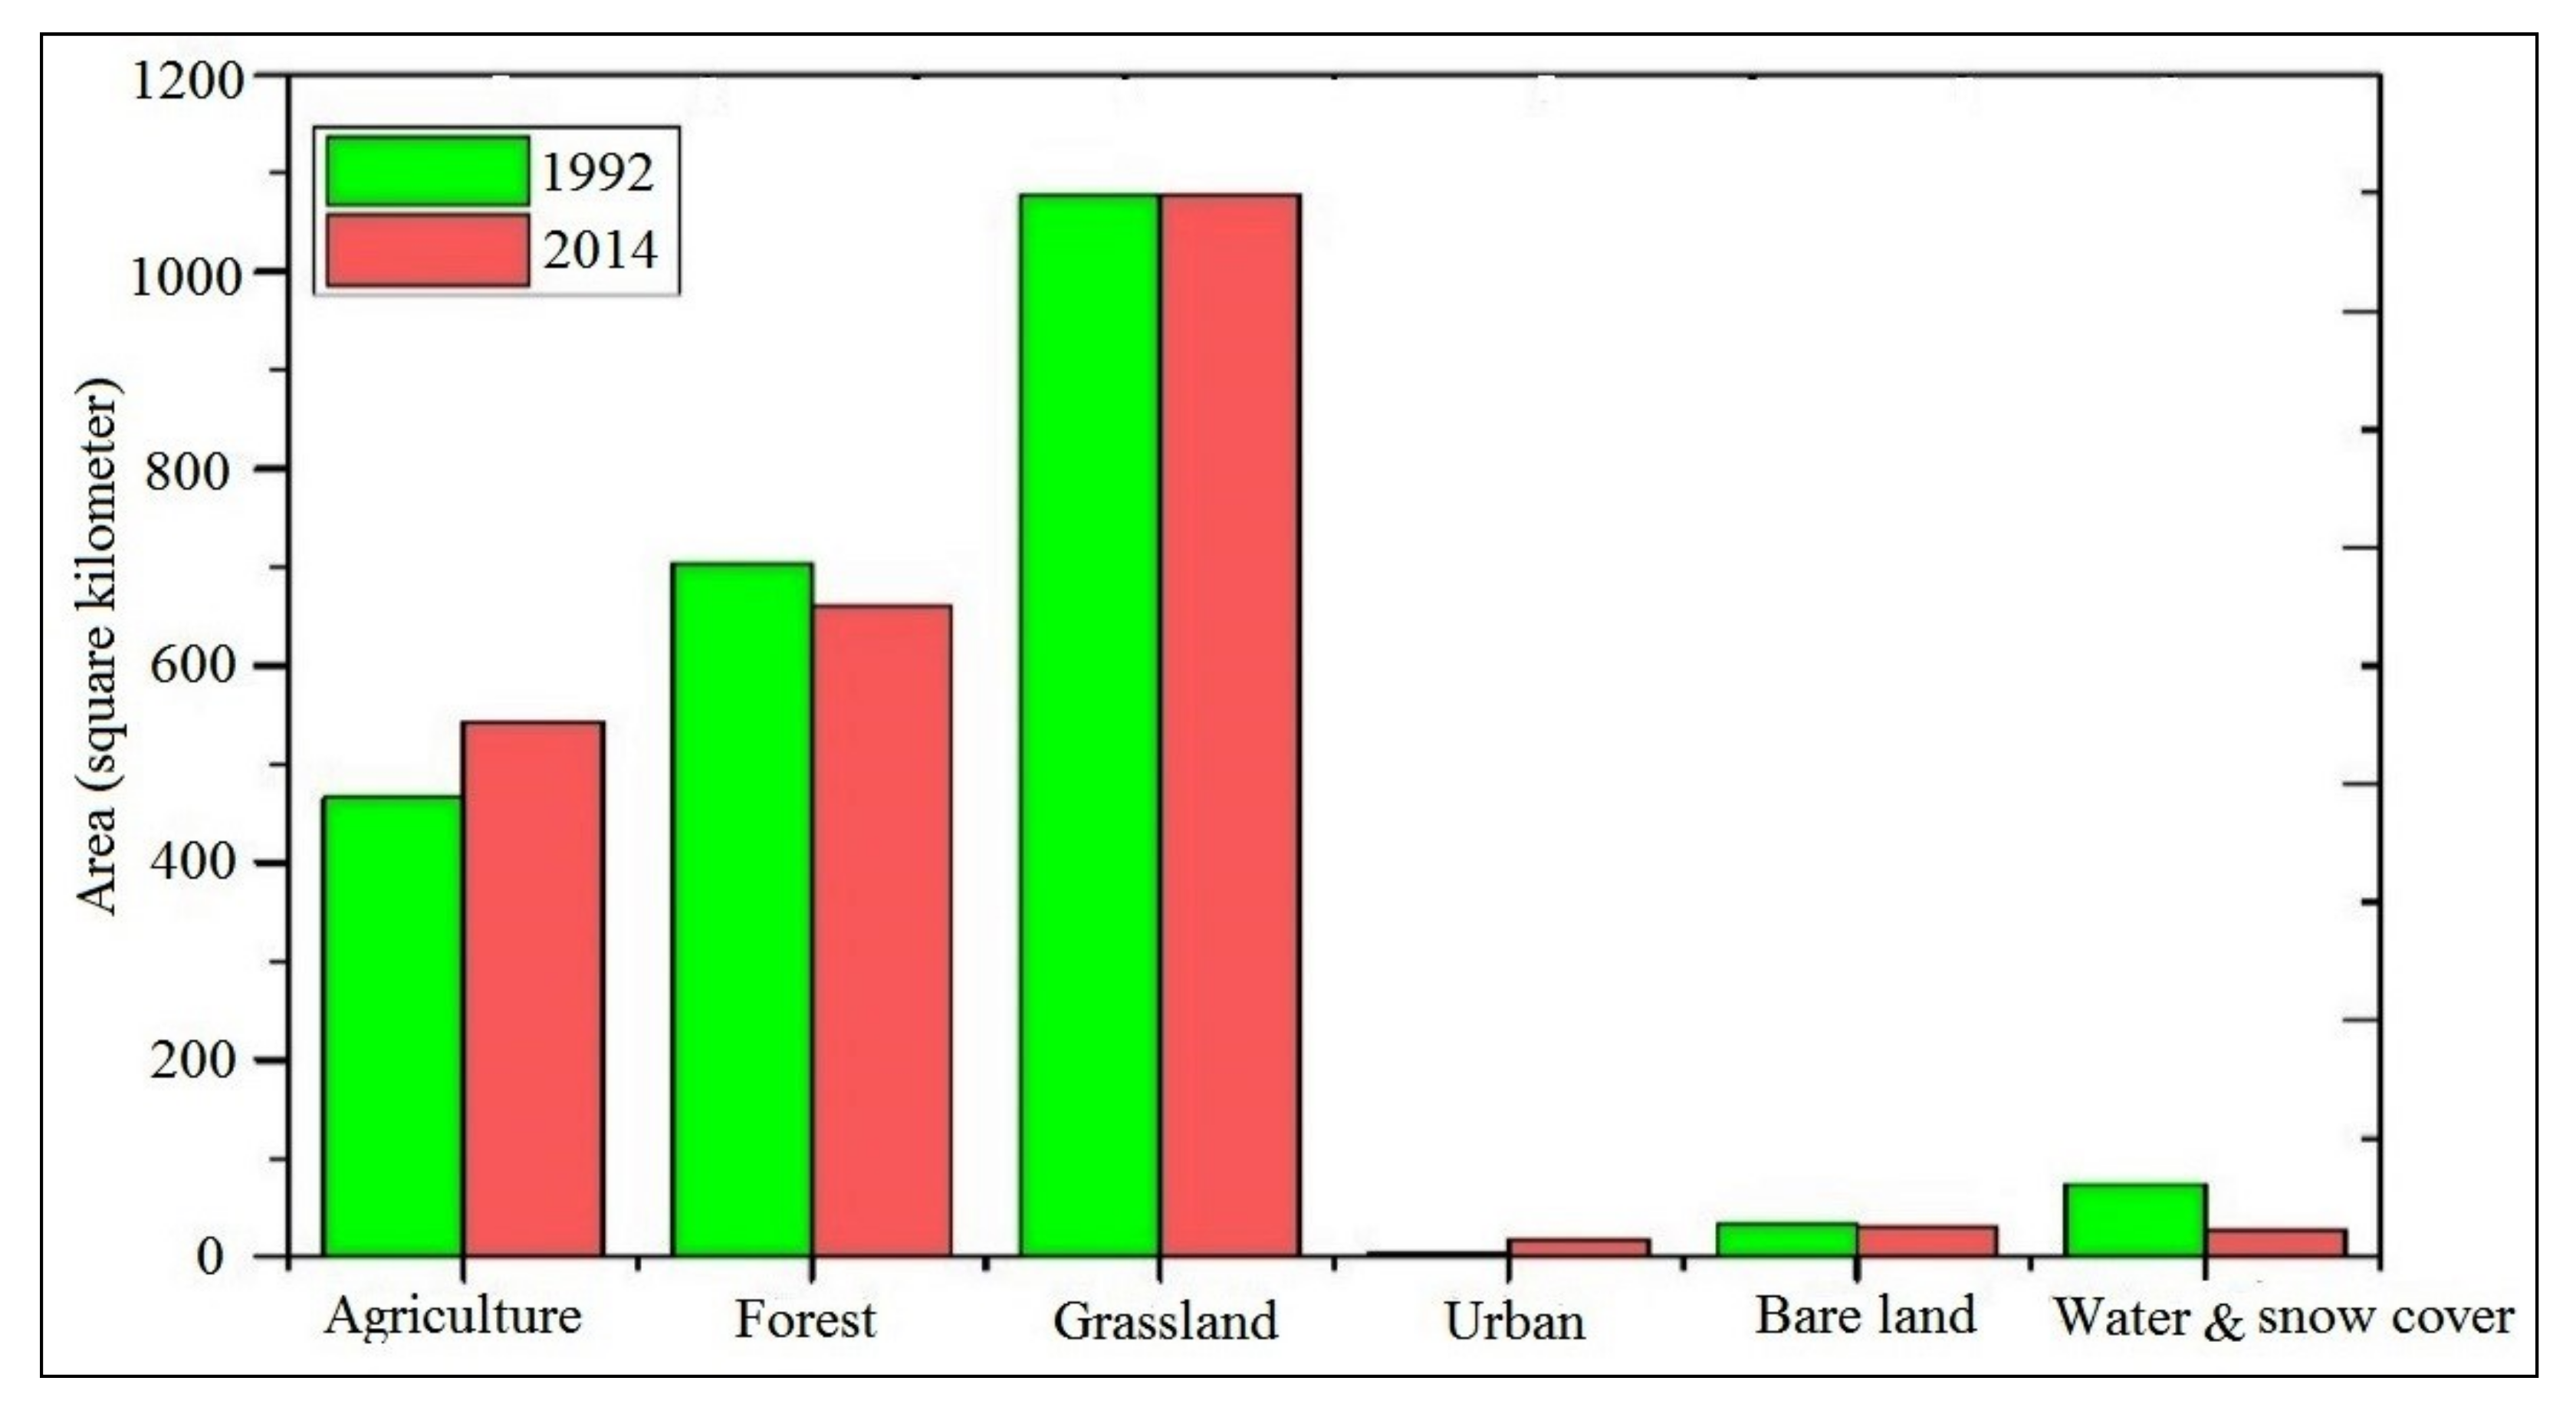
3. Results and Discussion

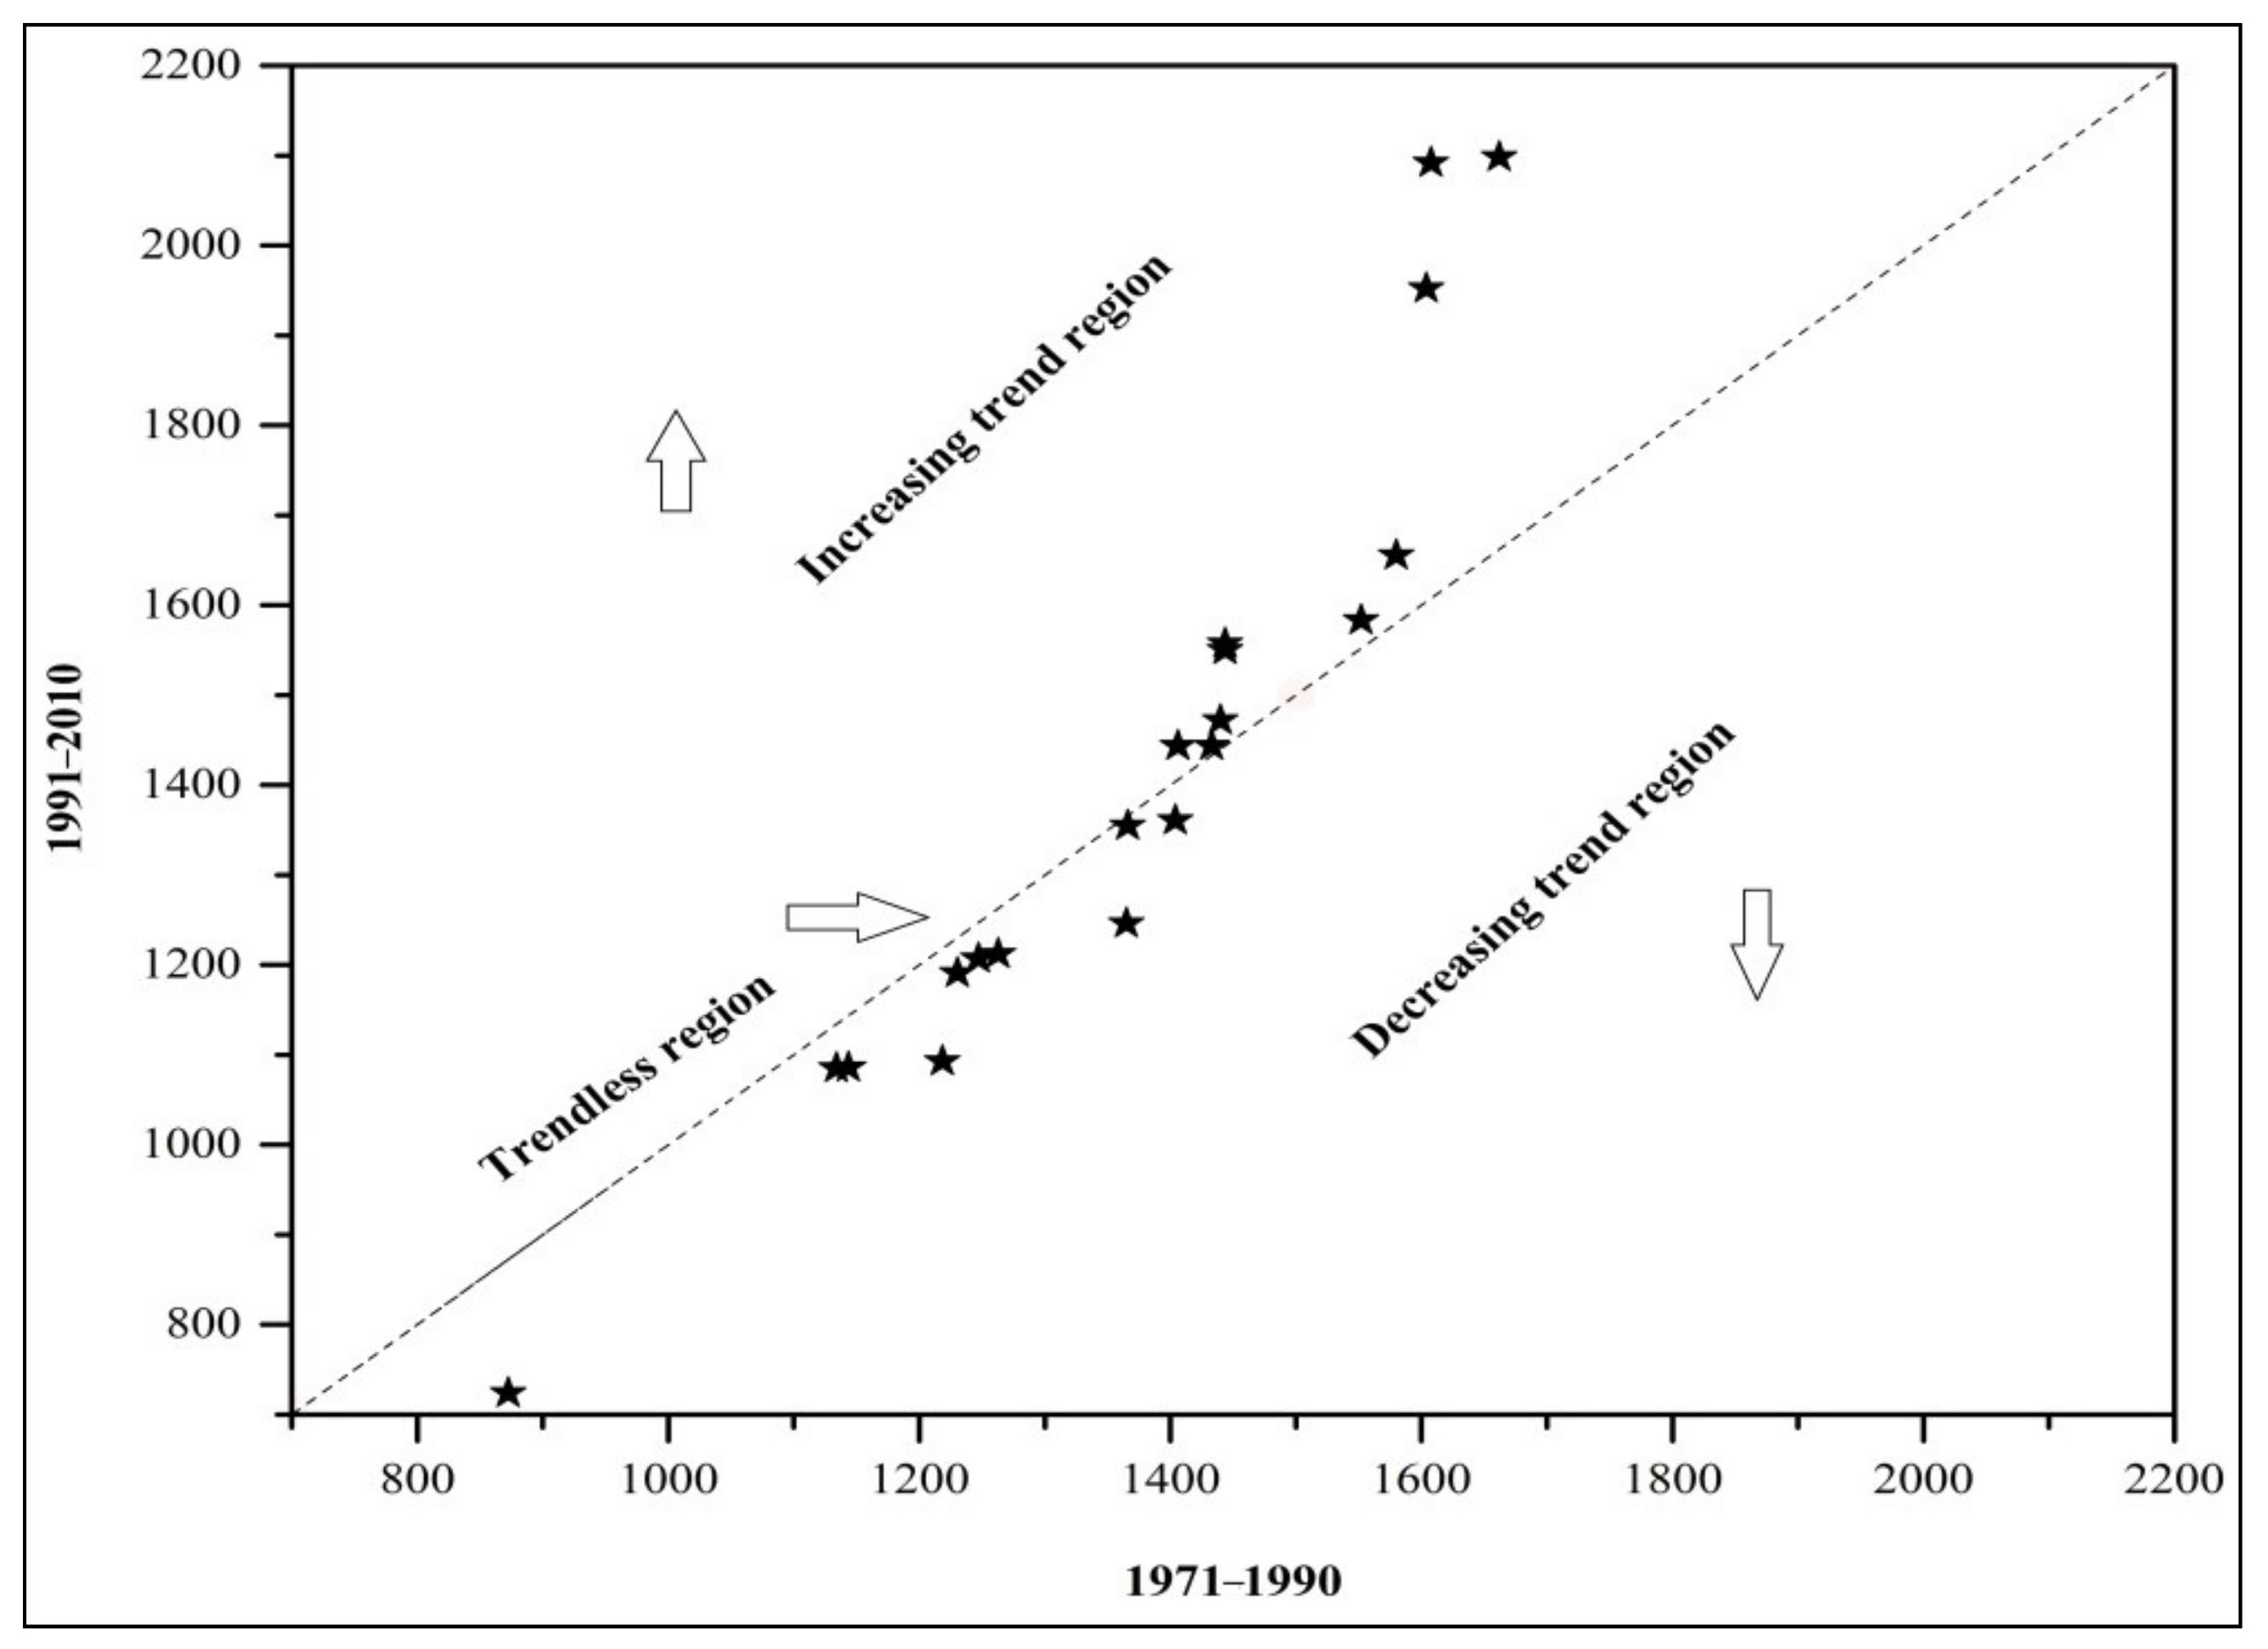
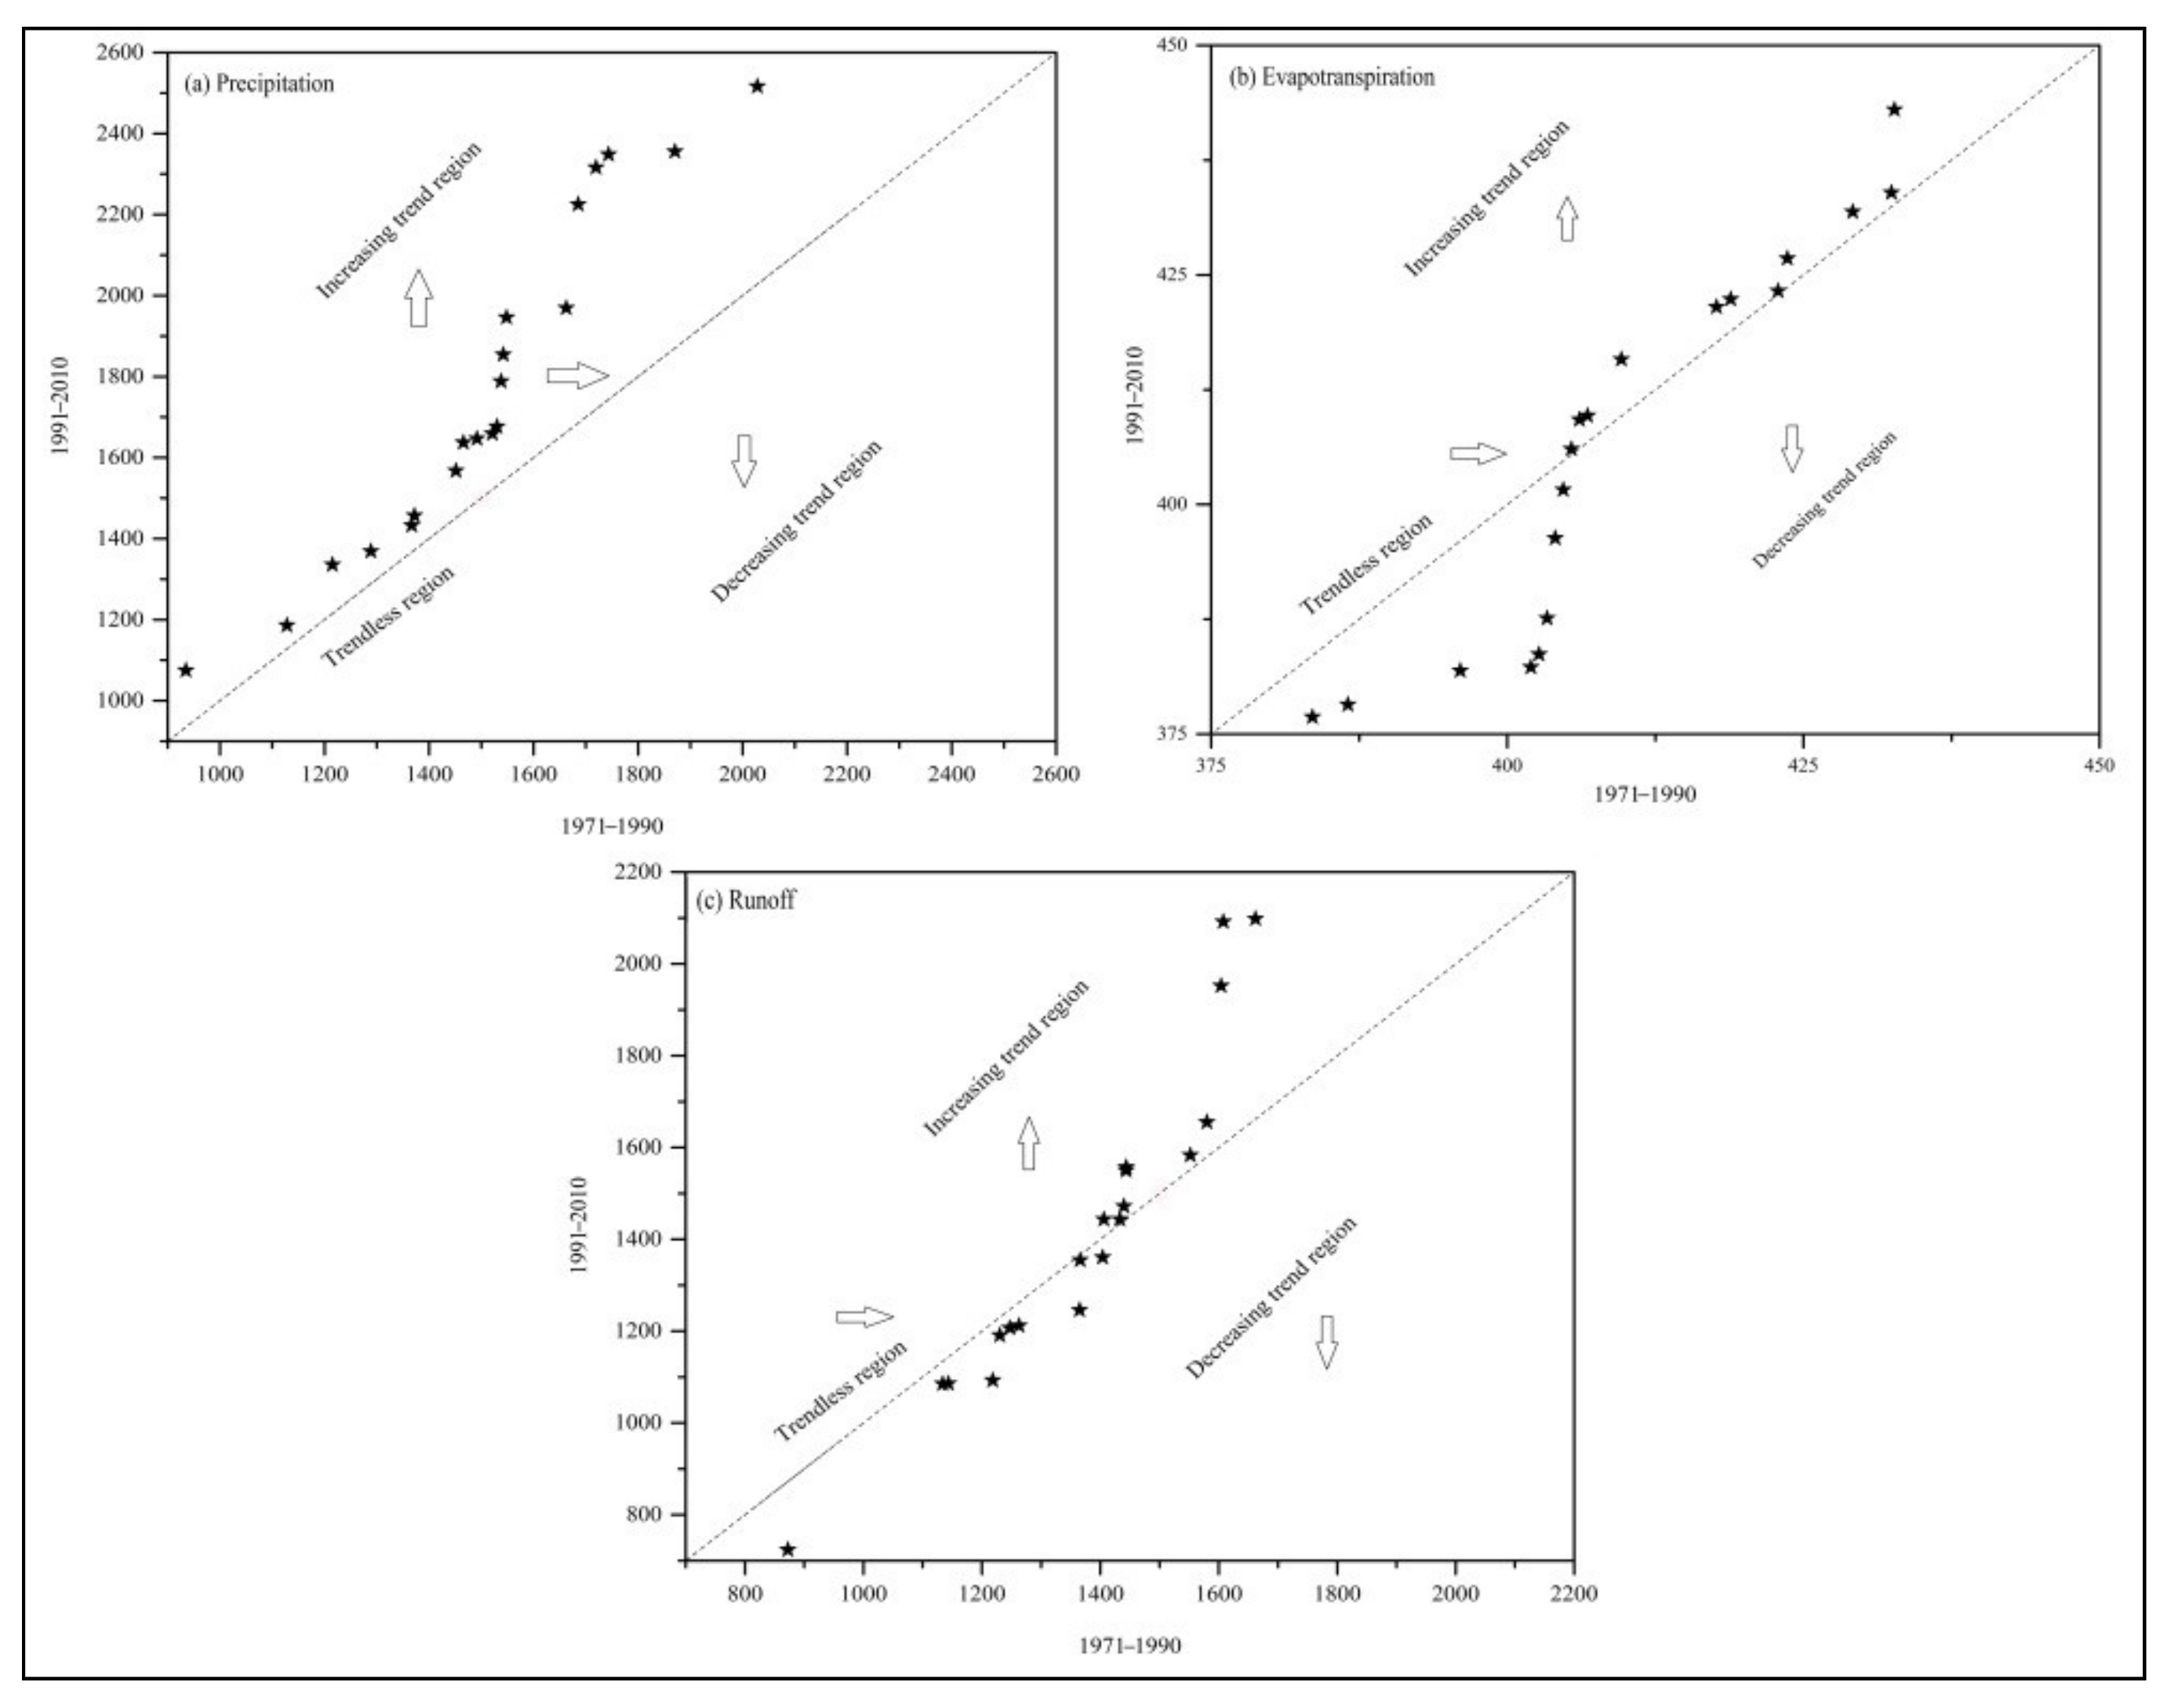
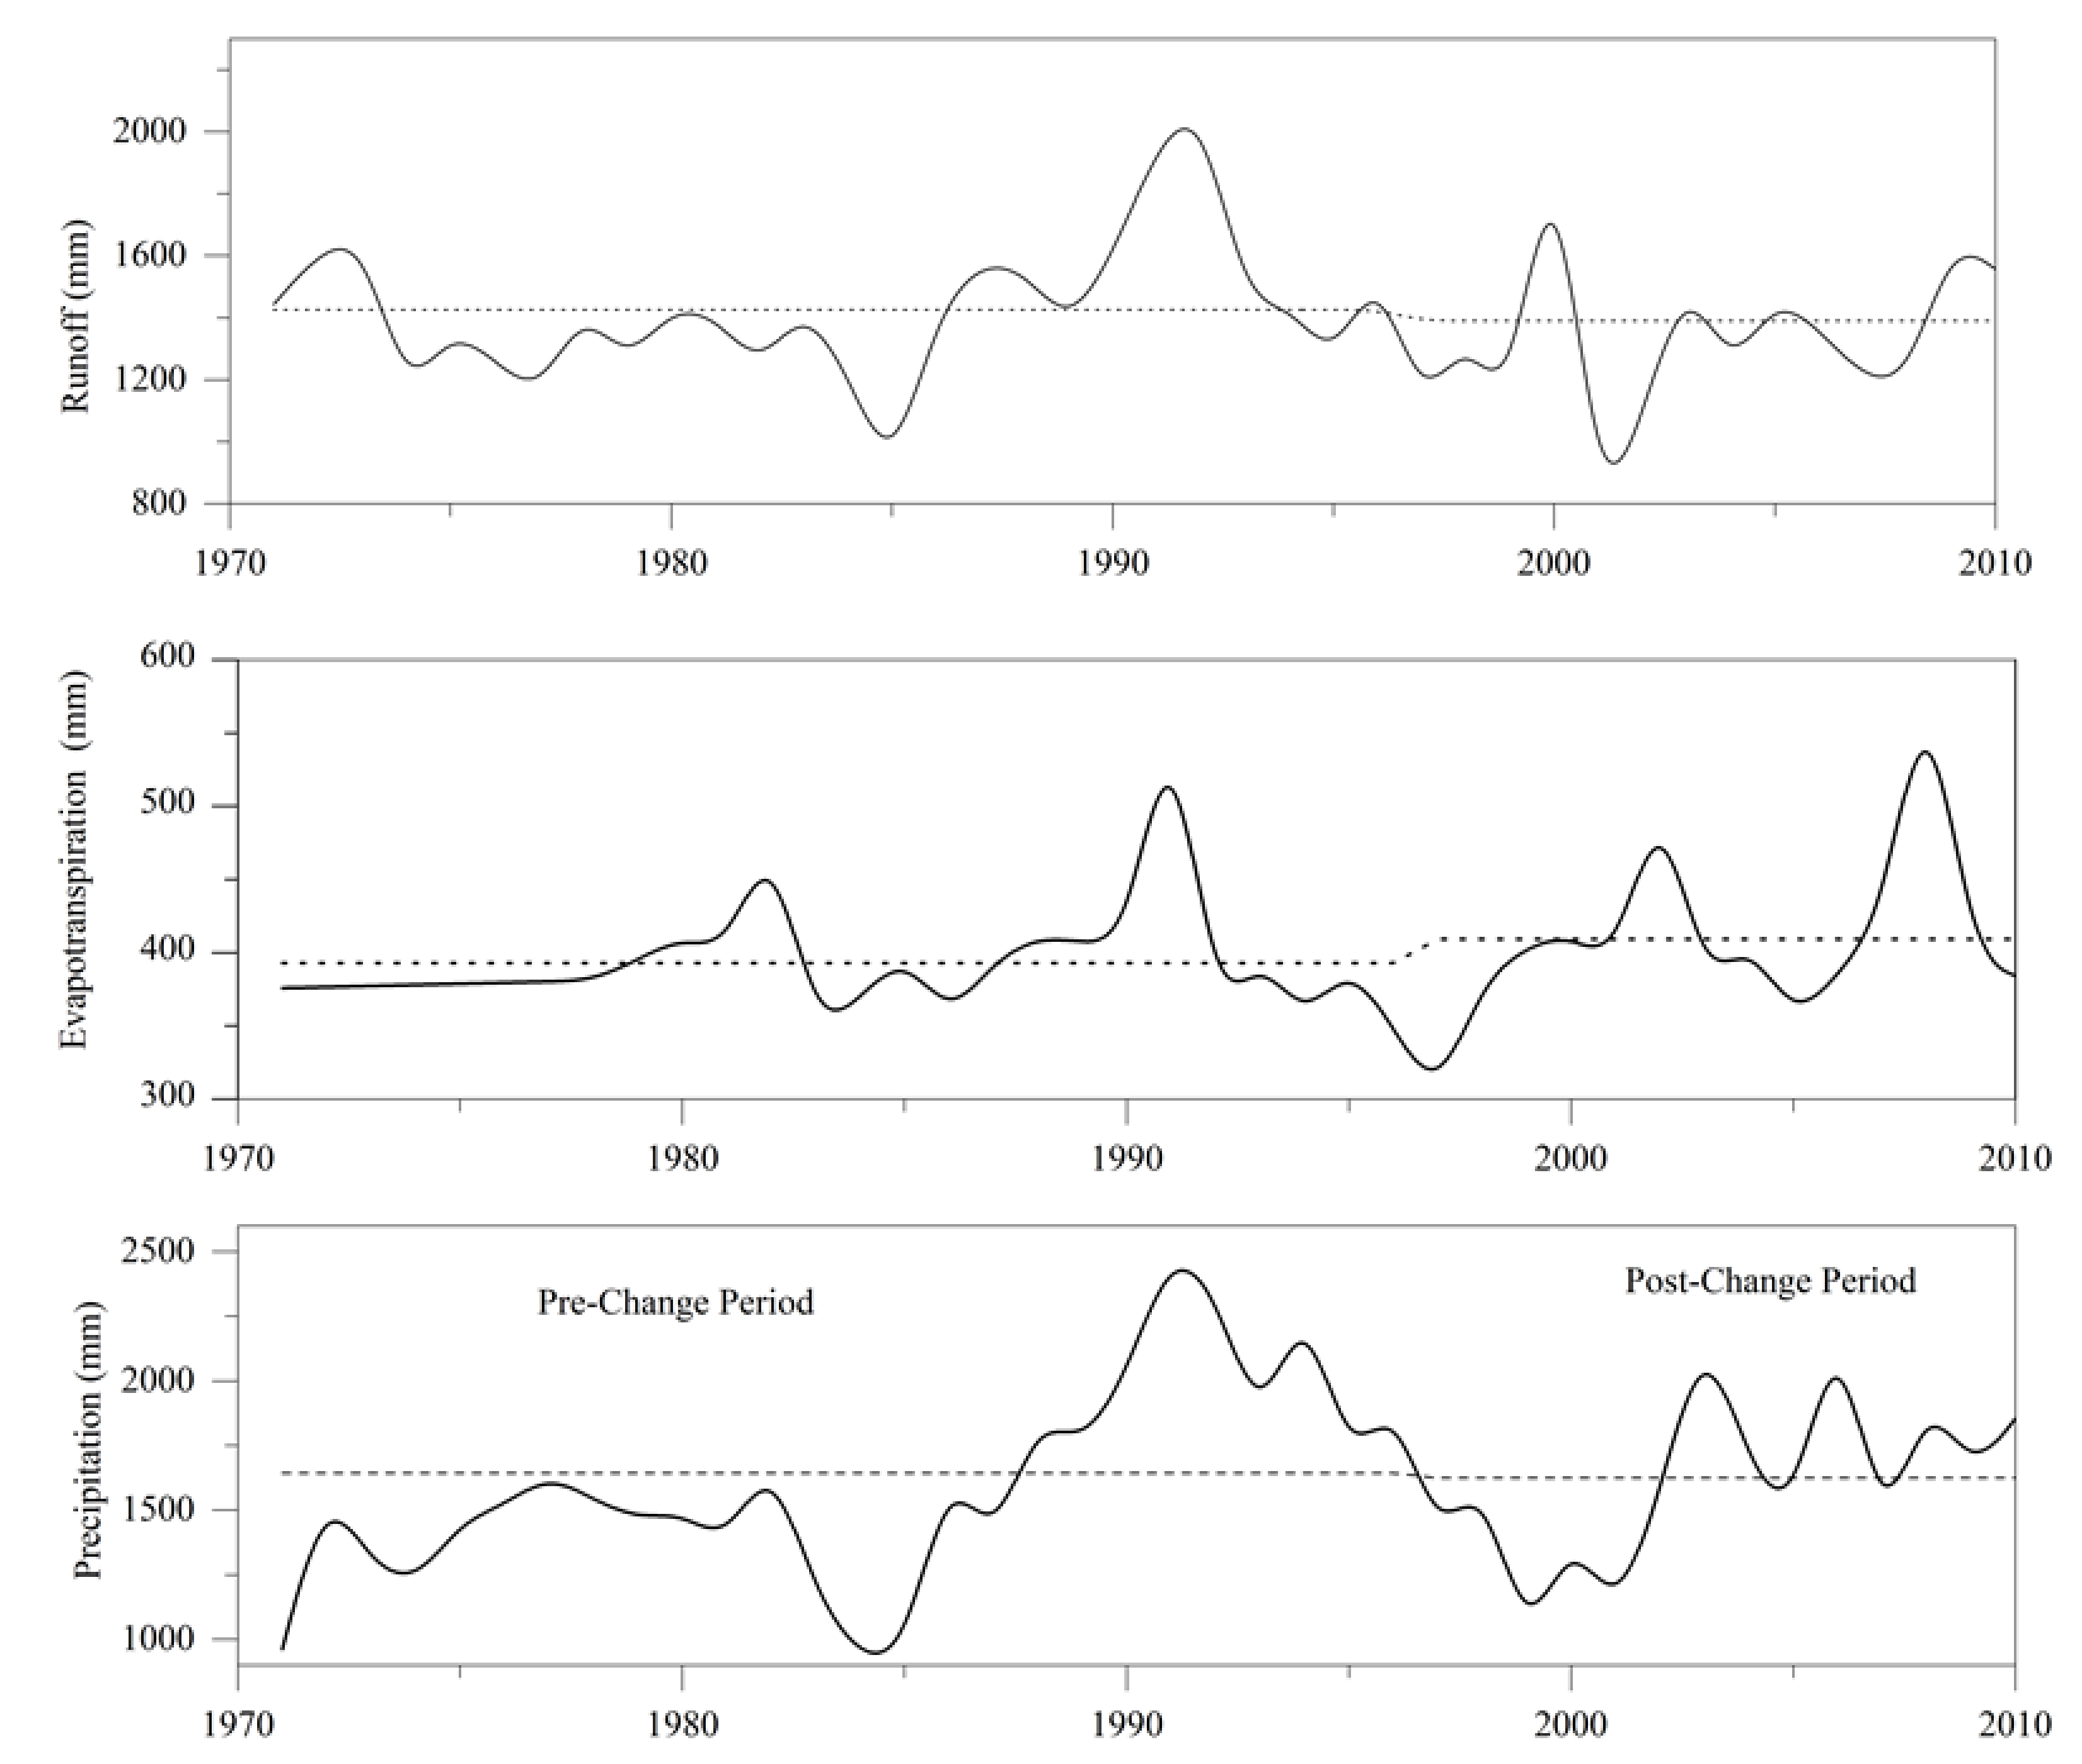
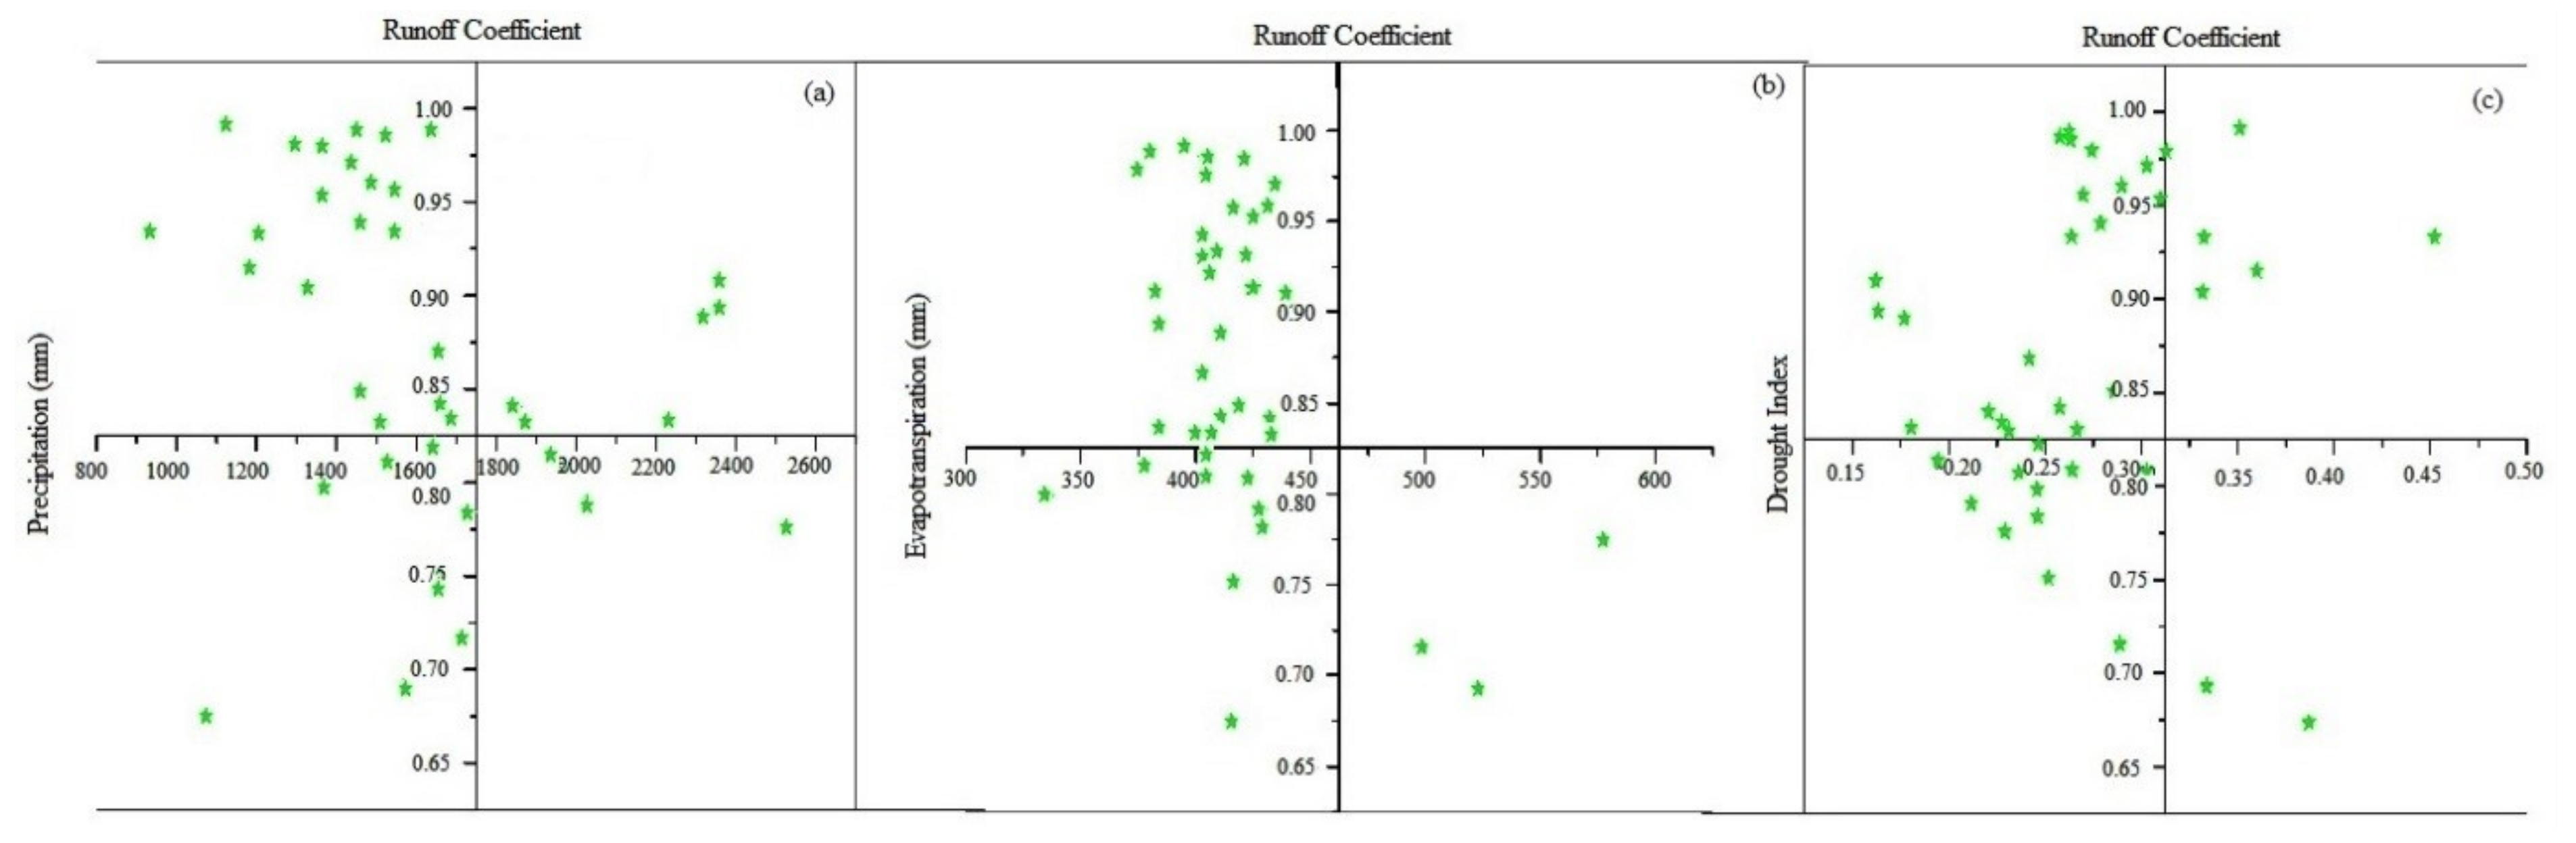
3.1. Trends in Hydro-Climatic Variables

The statistical indices explaining the annual variations in observed precipitation, evapotranspiration, and runoff (from 1971 to 2010) of the KRB are listed in Table 4. Table 4 shows the combined annual trend analysis of all the variables. It was observed that the coefficient of variance (Cv) of precipitation was higher than that of runoff and evapotranspiration whereas the Cv of evapotranspiration was found the lowest i.e., 0.12 as compared to precipitation (0.22) and runoff (0.21). Moreover, the ratio of precipitation to runoff was found smaller than the ratio of precipitation to evapotranspiration. Overall, the mean value of precipitation was found to be 14% higher than runoff whereas runoff was found to be 70% higher than evapotranspiration. The skewness of evapotranspiration was observed to be 74% higher than runoff while 72% greater than precipitation. The skewness of precipitation was found as 10% higher than runoff (Table 4).
The results of the MK test on the precipitation, evapotranspiration, and runoff time series are presented in Table 4, and are also illustrated in Supplementary Figure S1 (for the entire data record), and Figure S2 (for the pre- and post-change time-periods separately). Precipitation and evapotranspiration exhibited statically significantly increasing trends, whereas no statistically significant trends were observed in the runoff time series.
The results of the ITA supports the trend analyses conducted using the MK test, particularly for precipitation, where all data points are above the 1:1 line (Table 5, Figure 7).
The results of the recent trend analyses by Latif et al. [73] which was conducted over the Jhelum River Basin (JRB) also located in Northern Pakistan and extending into India, were found to be consistent with current study as they detected increasing trends in annual precipitation and evapotranspiration. Similarly, [74] examined the flow regime of the JRB and found trends similar to those in our study in the runoff of a few stations, whereas trends contrasting those of our study were identified at a few weather stations. Furthermore, [75] found an increase in the frequency of wet precipitation days from the northeast to the middle parts of the northern highlands of Pakistan. The trends in temperature and precipitation of our previous study i.e., [45] were found consistent with our current study but runoff in the upper part of the KRB was found to increase in comparison to the lower part (downstream) of the basin. Moreover, [3] also identified the lack of a trend in the runoff of the upper and middle stream of the Syr Darya River basin, and their results were found consistent with our current study.

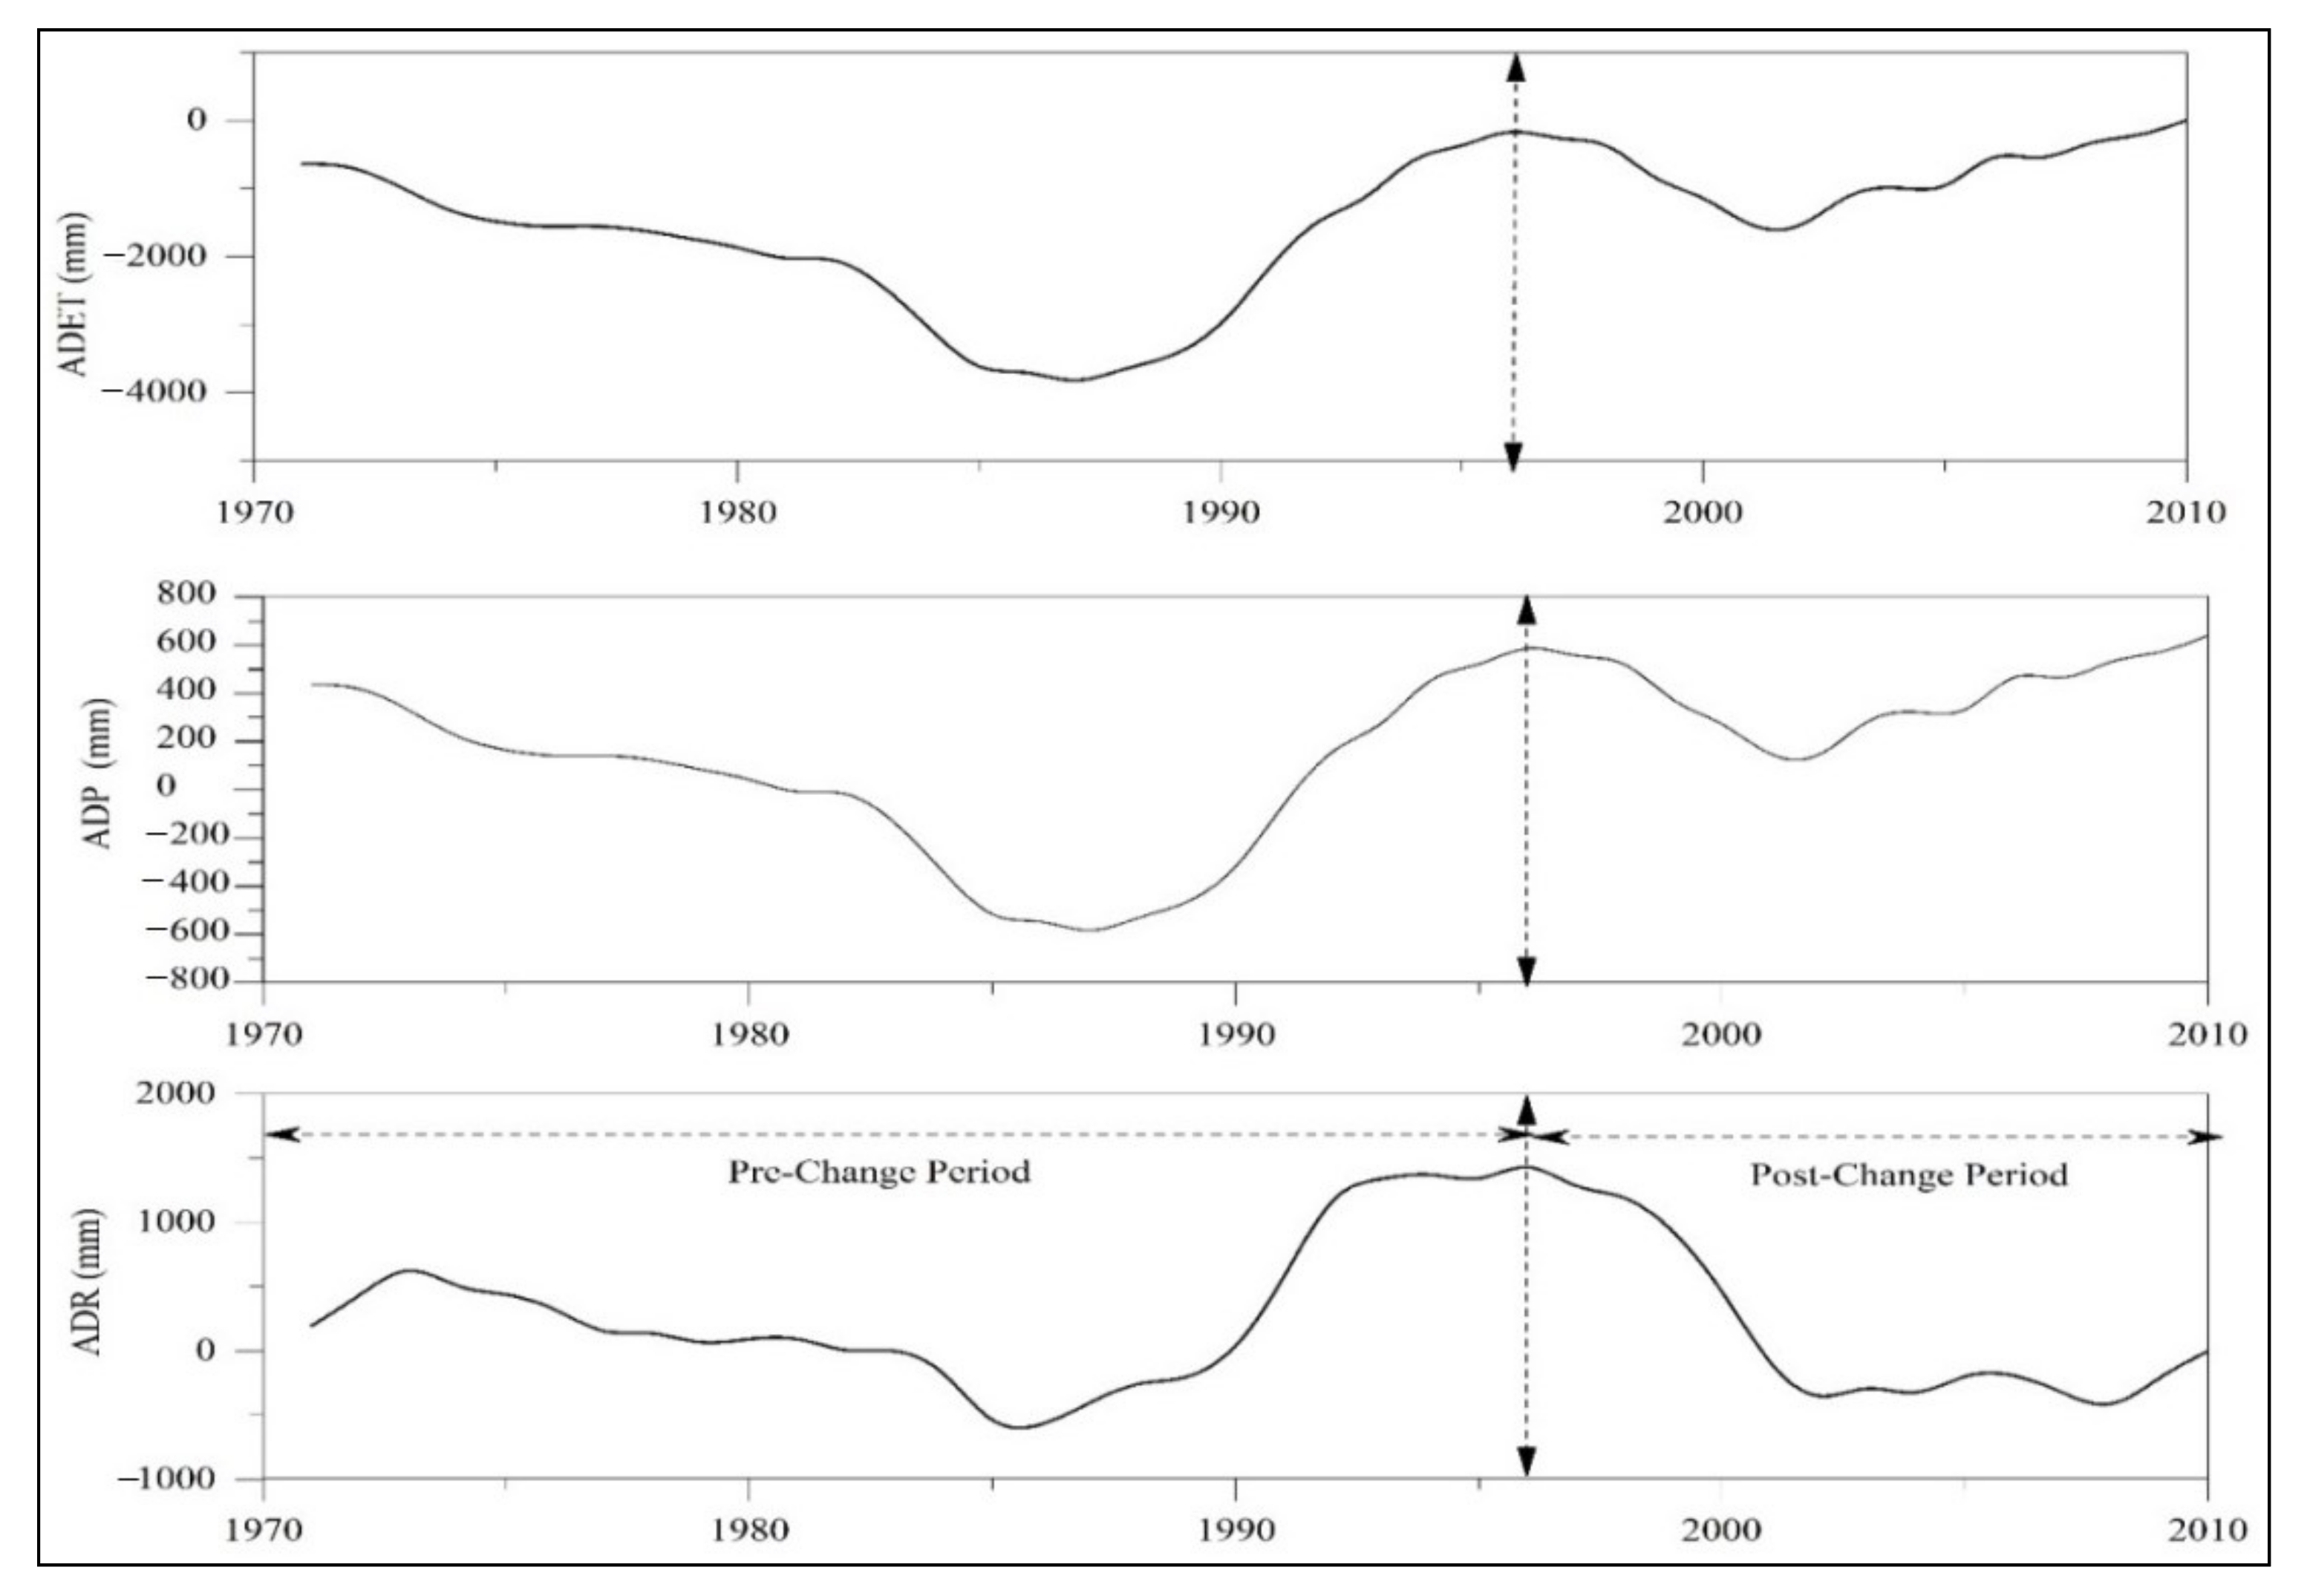
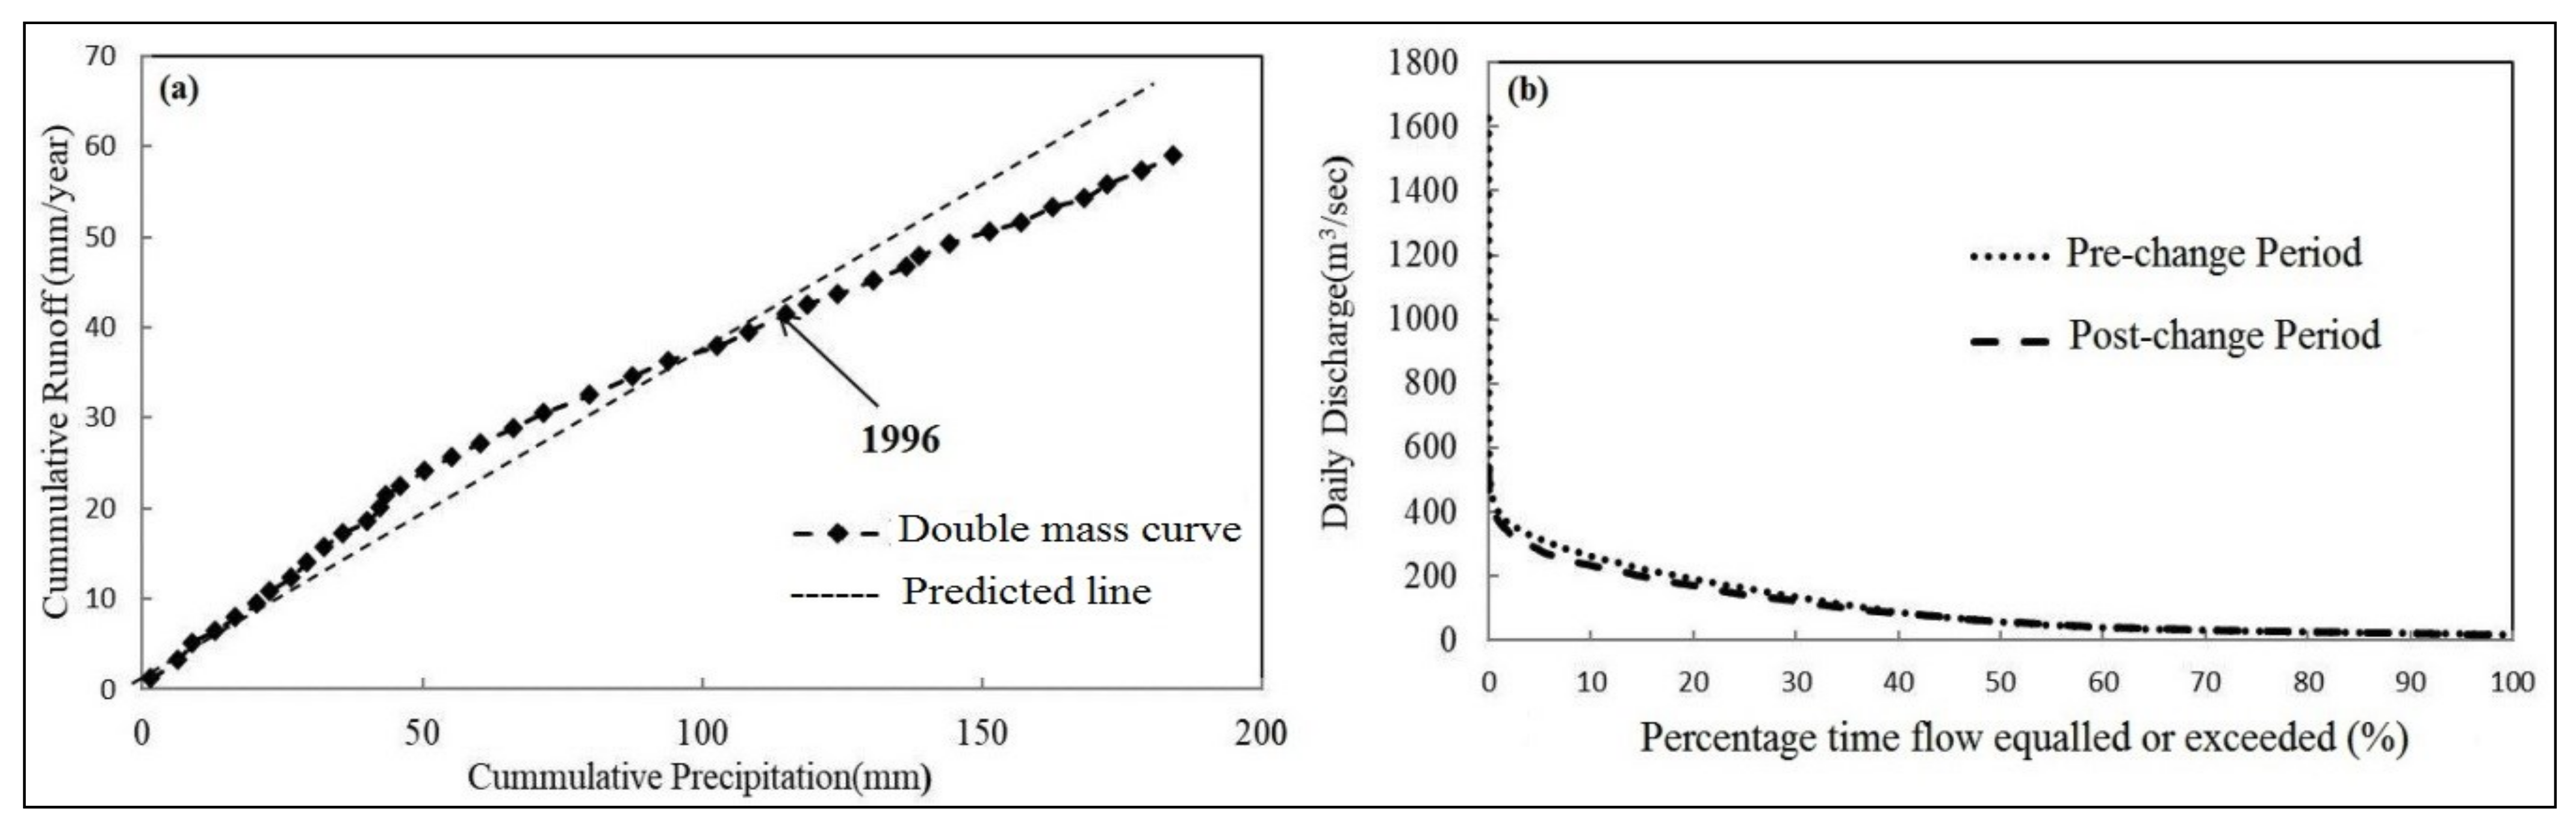
3.2. Abrupt Changes in the Hydrological Time Series

The abrupt change or change point in the annual precipitation, evapotranspiration, and runoff of the KRB is displayed in Figure 8. The accumulative difference curve and double mass curve methods were used to identify the abrupt change in the runoff. An abrupt change in all three-time series was identified in 1996 (Figure 8). A study conducted by [34] used the accumulative anomaly method to determine the abrupt change in the runoff of the Huangfuchuan River, China, and their results were found to be consistent. Moreover, a study performed by [76] also observed an abrupt change in the runoff of the Wei He River basin in the year (i.e., 1993) as similar to our study. A study conducted by [74] also determined the change point in streamflow which was consistent with our results.
Table 6 shows the smaller Cv of during the post-change period in comparison to the pre-change period. The Cv of evapotranspiration, for its part, is higher during the post change than in the pre-change period, while for runoff, it is also higher during the later period.
Regarding the pre-change period, the precipitation (−1%) and runoff (−2.59%) decreased whereas evapotranspiration (+3.25%) increased during the post-change period (Table 6, Figure 9). The ratio of Cv for precipitation to runoff was observed to be 20% higher in the post-change period whereas the ratio of Cv for evapotranspiration to runoff was 18% less during the post-change period in relation to the pre-change period.
The abrupt change was also determined by plotting the data of cumulative precipitation and cumulative runoff in double mass curve analysis (Figure 10). Figure 10a shows the deviation of the double mass curve from the linear relation.
The MK test for the pre (1971–1996) and post-change (1997–2010) periods for precipitation, evapotranspiration, and runoff are displayed in Figure S3 (Supplementary Material) and Table 7 From the results of the MK trend test and ITA method, one can see increasing trends in precipitation and runoff but a decreasing trend, and lacking statistical significance, in evapotranspiration during the pre-change period. After the change point, both the MK test and ITA show statistically significant increasing trend for runoff and an insignificant increasing trend for precipitation and no trend for evapotranspiration (Table 7). The status of evapotranspiration changed from decreasing trend (pre-change) to a trendless (post-change) period which showed that evapotranspiration has increased during the post-change period in comparison with the pre-change period.
Liang [77] investigated the trends in precipitation, temperature, and runoff time series upstream of the Minjiang River Basin, China and observed an increasing trend in precipitation for a similar period to that of our study. They also observed an increase in runoff during the post-change period. Another study conducted by Latif [74] also identified increasing trends in several hydrological stations of the Indus, Jhelum, and Kabul River basins. They observed decreasing trends in precipitation in recent decades as compared to the reference period, which is consistent with the trends of precipitation for the post-change period of our study. Moreover, Khattak [78] observed increasing trends in temperature and runoff but noted an inconsistent pattern for precipitation trend in UIB, Pakistan. Their precipitation and temperature innovative trends were found consistent, whereas runoff innovative trends were found conflicting with the findings of [45].

3.3. Runoff Response to Climate Change and Anthropogenic Activities using Different Methods

In the eco-hydrological framework, the variations in runoff are assessed by considering similar precipitation and evapotranspiration of the basin in different pairs of years. This framework was used to quantify the contribution of climate change and anthropogenic activities in response to variations in the runoff. In this analysis, the abrupt change was also observed in the year 1996 (Figure 11). Moreover, in this framework, Pex was found to decrease from 0.88 to 0.84 while Eex was found to decrease from 0.45 to 0.37 for pre and post change period as shown in Figure 11. The decrease in both excess energy and excess water implies that anthropogenic activities are pronounced in this region.
In the modeling approach, the SWAT model was successfully calibrated (1972–1981) and validated (1983–1996) on the KRB on a monthly time scale as shown in Figure 12 and Figure 13. Overall, the SWAT model simulated both low and high flows very well during both calibration and validation. Table 8 shows the results of the calibration and validation of the SWAT model, which confirm that the SWAT model can be used with confidence in simulating the streamflow of the KRB.
Moreover, the calibrated SWAT model was used to reconstruct natural flows for the post-change period without changing the calibrated parameters, however, only temperature and precipitation data were changed according to the period (Figure 14). Figure 14 depicts that the SWAT model simulated the streamflow of the post-change period as satisfactorily. The method of reconstructing natural runoff was applied to the SWAT model to find out the impacts of climate change and anthropogenic activities on the streamflow (Figure 14). The results obtained from the SWAT model suggest that the impacts of anthropogenic activities on streamflow variations of the KRB are evident as compared to climate change (Table 9).
The statistical model was developed for the baseline period (1971–1996) following Equation (20).
R R e f = 0.69 P + 0.81 E T 60.89
The statistical model also suggests that the anthropogenic activities are mainly responsible for streamflow variations in the KRB (Table 9).
Similarly, the climate elasticity model was calibrated for the reference period (1971–1996) as shown in Equation (21). For the development of the climate elasticity model, the model parameters were determined from the natural period. The climate elasticity model for the KRB is given by:
δ R i R ¯ = 0.53 δ P i P ¯ + 0.51 δ E T E T ¯
From the climate elasticity model one can see that anthropogenic activities played a major role in streamflow variations of the KRB during the post-change period as compared to climate change. A study conducted by [79] also investigated that the streamflow variations in the Soan River basin, Pakistan is mainly attributed to anthropogenic activities. The results of their study were found similar to our findings. Another study performed by [80] determined that the relative contribution of climate change and land-use change in streamflow variations in the Tarbela catchment was 39.3% and 60.7%, respectively. Similarly, [81] determined that the impacts of human activities on runoff variability of the Dongjiang River basin were obvious and their findings were found consistent with our findings of the current study. The study of [76] also identified human activities as a major factor for runoff variations of the upper Wei He River basin, China by using similar methods as we did. The results of several other studies such as [32,33,39,77] are also in agreement with the results of our study.

3.4. Discussion

The correlation between runoff coefficient and precipitation, evapotranspiration, and drought index in the KRB is shown in Figure 15. There could be a significant or non-significant correlation between the annual runoff coefficient and precipitation. The significant correlation depends on soil type and vegetation characteristics of the watershed area. Runoff also depends on infiltration which is indirectly influenced by the weather condition; geography, soil texture, and land cover [11]. In the current study, the mean annual data were used for correlation analysis. Figure 15a displayed that more than 50% points of the runoff coefficient vs. precipitation occurred in the second quadrant of the coordinate system, whereas few points were found in the first, third, and fourth quadrant, and this condition suggested the weak relationship between runoff coefficients versus precipitation. However, the scatter plot between runoff coefficient and evapotranspiration displayed a strong relationship as compared to runoff coefficient versus precipitation (Figure 15b). Moreover, the correlation between precipitation and runoff was found to be 0.90 whereas it was observed 0.1 for evapotranspiration and runoff for the study period. However, the precipitation was found to be negatively correlated with runoff coefficient and drought index whereas the evapotranspiration was found to be positively correlated with drought index (0.21) and negatively correlated with runoff coefficient (0.37). Furthermore, strong correlation (0.37) was observed between evapotranspiration and drought index during the post-change period, whereas a weak correlation was found during the pre-change period. A weak correlation was found between precipitation and drought index during the post-change period. Moreover, a negative correlation was observed between evapotranspiration and runoff coefficients during both pre-change (−0.46) and post-change (−0.26) periods (Figure 15) whereas precipitation was found to have a positive impact on runoff coefficient during the post-change period. A study performed by [11] determined the correlation of annual time series of streamflow, precipitation, and temperature. The coherency analysis of KRB was also found to be consistent during the pre-change period. However, the coherency analysis displayed a different behavior for the post-change period as compared to the pre-change period. The coherency analysis did not consider the other factors except precipitation and evapotranspiration. Moreover, the results of coherency of streamflow of Colombian Pacific Basins [10] were found consistent with the results of our study. It was also unveiled that the influence of climate was dominant on streamflow in this region.
Past studies [15,82,83] conducted in different parts of the world also explained that runoff is more sensitive to precipitation as compared to evapotranspiration. However, [84] identified that the coefficient for soil water content and maximum soil water holding capacity were key factors influencing the long-term hydrological response. Moreover, it was observed that under different climatic conditions, the impact of precipitation and evapotranspiration on hydrological response was varied [85], which further indicates the different mechanisms for runoff generation. However, the correlation analysis of runoff does not consider the geography, vegetation characteristics, soil type, and other characteristics of KRB. The correlation analysis only considers the relation between hydro-metrological variables [10,11].
Large variations have been observed in the land-cover types of the KRB since 1992 as shown in Figure 16. A large part of the basin had been transformed from natural forest/grassland into agricultural lands and residential areas(Figure 10). A study conducted by Ramírez [86] observed that forests usually evaporate more water than other types of plants (such as agricultural and annual crops), and a decrease in forest area is subjected to increased runoff of the basin. Naran and Kaghan are tourists’ spots in the KRB and these areas produce environmental impacts associated with travel, accommodation, and recreational activities. To minimize the environmental degradation associated with tourism and recreation it may require appropriate land-use zoning, regulation and surveillance of access and activities, direct physical protection of particular areas and education both on-site and elsewhere. In addition, it is important to provide incentives to encourage low-impact types of recreation, such as contemplative, naturalist, and wilderness travel activities, and discourage high-impact type recreation such as sports, social activities, motorcycles heavy vehicles, and accommodation involving building and engineering construction. Unmanaged recreational activities and increased encroachment in forest land were found to have an impact on runoff characteristics of the KRB. The population has also increased from 0.77 million (1981) to 1.15 million (1998) in the KRB. The current population of the basin has reached 1.6 million.
Moreover, several storage dams and small ponds have been built in the KRB in recent years. The different hydropower projects have been initiated under the United Nations (UN) goal of sustainable clean energy and the Paris agreement. Several hydropower projects have been started by the government of Khyber Pakhtunkhawa such as the Balakot project (190 MW), Kari-Muskhui (446 MW), Naran Dam (210 MW), Batakundi (65 MW), Laspur-Muri Gram (130 MW), Shushghai-Zhendoli (144 MW), Shogo Sin (132 MW), Torkum-Gudubar (409 MW) and Samshel Toren (260 MW) [87].

3.5. Comparison with Other River Basins

In the last fifty years, a number of studies have related abrupt changes in river runoff to climate change in different parts of the world [75,76] and anthropogenic activities [13]. Several researchers found that the watershed characteristics were the main driving factors that influenced the hydrological response [82]. Another study conducted by [88] determined the runoff characteristics in different environmental conditions of the United States. Moreover, [89] observed the impacts of climate change on the hydro-climatology of Lake Tana Basin, Ethiopia. Another study performed by [90] observed that climate change and anthropogenic activities are mainly responsible for influencing the runoff characteristics of the Tualatin River basin, Oregon. Similarly, [91] observed the remarkable changes in the hydrological response of the Swedish Rivers due to the impacts of anthropogenic activities and climate change. The grassland plains in Russia showed a greater delay in runoff due to watershed characteristics observed by [92].
Moreover, few Asian rivers are largely attributed to watershed characteristics, such as the Yellow River [39,93], Ganga River [94], Huifa River [32], Kofarnihon River [95], Bagmati River [2], and Pearl River [96], and the results of these studies were found consistent with our study. Another study conducted by [79] observed that just after the change point, reduction in Soan River runoff was due to climate change and land cover changes. Similarly, a study conducted by [80] on the Tarbela catchment found that watershed characteristics play a major role in changes in runoff and climate change relatively contributes less as compared to watershed characteristics (anthropogenic activities). Moreover, [97] observed that watershed characteristics were evident for the increased runoff in the Simly watershed. Under the different climatic zone, there is a need to plan watershed-scale water resources management to face global climate change and frequent extreme precipitation as well as land use degradation. The national self-regulation ability is not strong enough to obtain the key object of hydrologic protection and management for climate-sensitive areas.
This study examined the impact of climate change and anthropogenic activities on the hydrology of a river basin. It is necessary to determine the impact of individual anthropogenic activities on the hydrological response. This research also assumed that climate variability and anthropogenic activities are independent, which is not the case.

4. Conclusions

This study investigated the impacts of climate change and anthropogenic activities on the runoff characteristics of the KRB during the period 1971–2010 using empirical, statistical, and modeling techniques. Potential causes for the observed changes in streamflow were identified and, the following conclusions were drawn:
  • The MK trend test and the ITA technique revealed statistically significant increases in both precipitation and evapotranspiration over the study region but no trend in runoff during the period 1971 to 2010.
  • A change point analysis identified a change in the annual runoff time series in 1996. This abrupt change in 1996 was also observed using the double mass and flow duration curves
  • The time series was divided into two time-periods: 1971–1996 and 1997–2010. The MK test applied over those two time-period revealed statistically significant increasing tends in precipitation and runoff, and a decreasing trend in evapotranspiration, although lacking statistical significance during the pre-change period. During the post-change period, only an increasing trend in runoff was found to be statistically significant; no trend was seen in the evapotranspiration time series, while the increasing trend in precipitation was not found to be statistically significant.
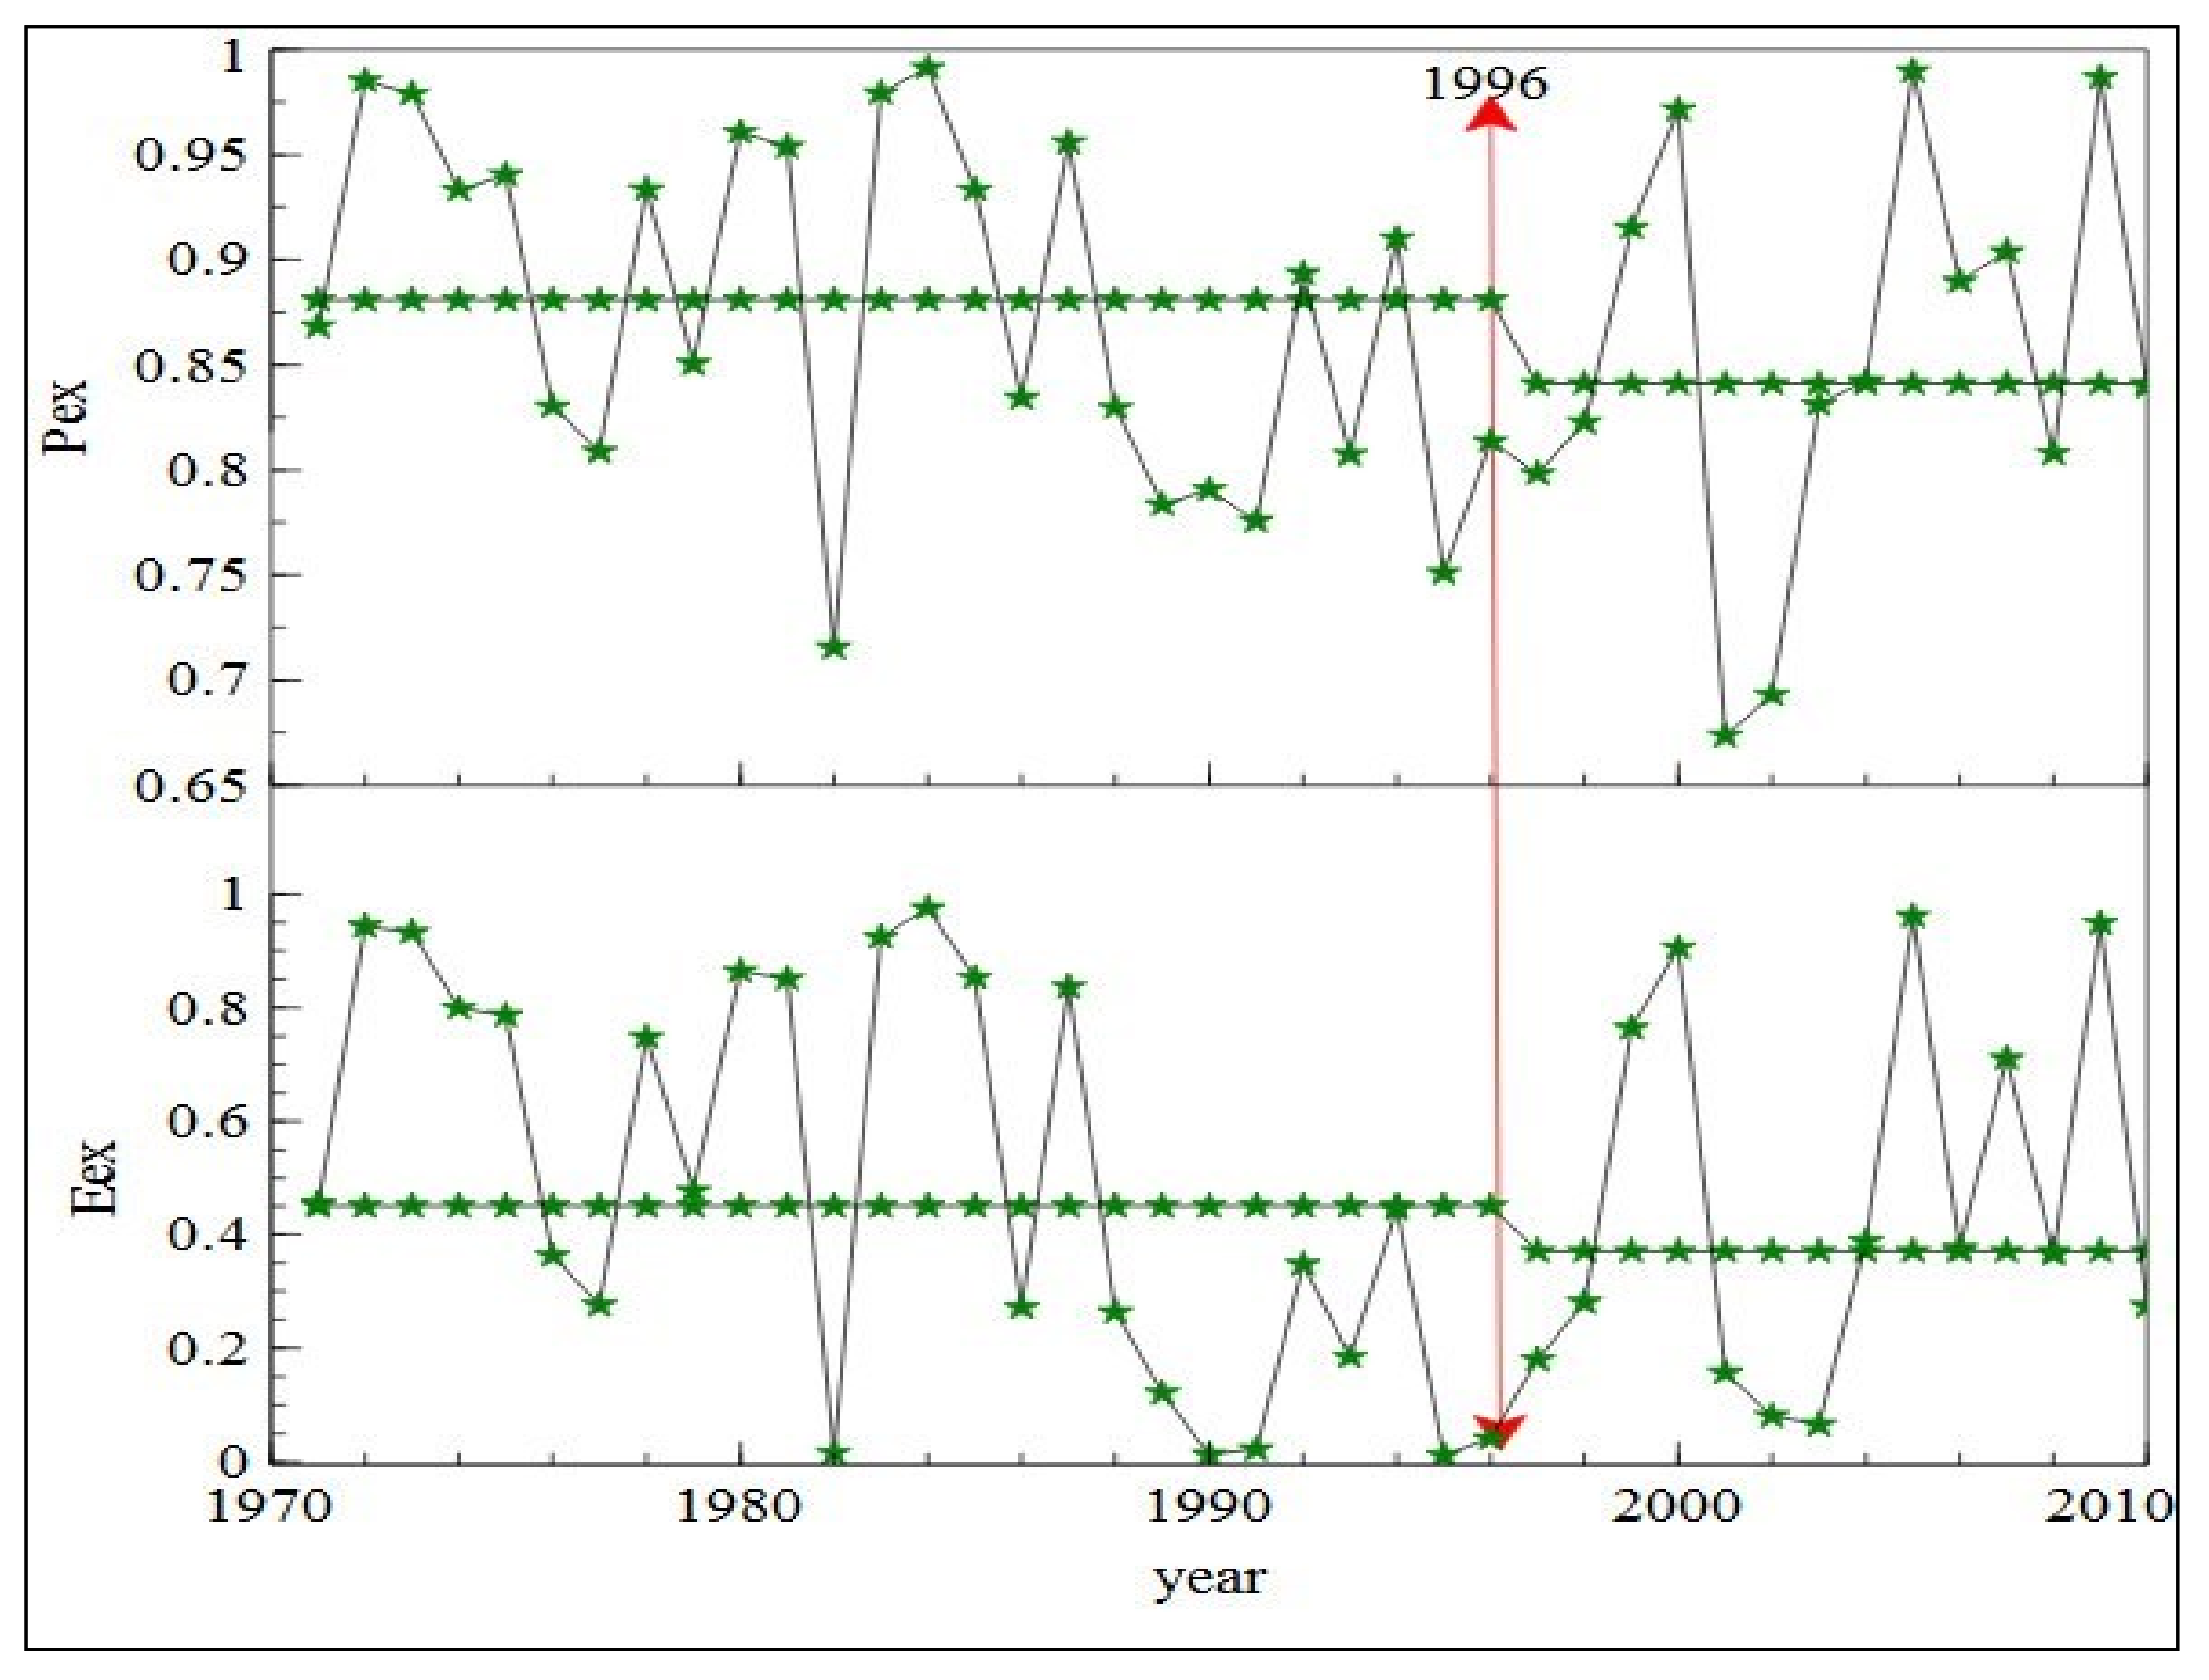
  • An eco-hydrological framework showed a decrease in both excess energy and excess water between two time periods, implying an evident contribution from anthropogenic activities to variations in runoff in the KRB.
  • A climate elasticity model quantified the relative contribution of climate change and anthropogenic activities (25% and 75% respectively) to the variability of streamflow in the KRB.
  • The statistical model developed in this paper estimated a 95% contribution from anthropogenic sources and a 5% contribution from climate change to streamflow variability in the KRB.
  • The method used to reconstruct natural runoff estimated a 16.1 m3/s (or 15.3%) reduction in the mean flow of the KRB during the post-change period in comparison to the pre-change period of which, −76% changes was calculated to be due to climate change and 176% to changes in anthropogenic activities over the catchment.
  • Overall, it is concluded role of anthropogenic activities was evident in terms of runoff variability in the KRB in comparison to climate change, especially since 1996.
  • This study quantified the impacts of climate change and anthropogenic activities on the streamflow of the KRB using the different techniques and identifies the areas that have experienced most change within the basin.
  • The results of this study improved our understanding of the main cause of streamflow variability in the KRB, which will help with the planning of water management strategies.

Supplementary Materials

The following are available online at https://www.mdpi.com/article/10.3390/w13223163/s1, Figure S1: MK trend analysis of Runoff (R), Precipitation (Pr), and Evapotranspiration (Et) for whole period (1971–2010); Figure S2: MK trend analysis of Precipitation (Pr), Evapotranspiration (Et), and Runoff (R) during pre-change (1971–1996) and post-change (1997–2010) periods; Figure S3: ITA analysis of precipitation (a,b), evapotranspiration (c,d), and runoff (e,f) during pre-change (1971–1996), and post-change (1997–2010) periods.

Author Contributions

Conceptualization and data analysis, M.S.; Hydrological Modeling and abstract, M.S. & M.A.; Introduction, M.S., A.S.G., M.Z. & M.I.K.; S.M., Methodology, M.S. & A.W.; Idea, supervision and funding, S.L. & M.S; Results, M.S. & M.A.; Discussion, M.A., M.S. &; S.L. Paper formatting and conclusion M.S., M.A. & A.S.G. All the authors contributed to the finalization of this manuscript. All authors have read and agreed to the published version of the manuscript.

Funding

This study is supported by the NSFC-ICIMOD joint project (Grant no. 41761144075), Yunnan University grant (2018M643541 and 209071) and Higher Education Commission (HEC) of Pakistan (HEC/STR/279).

Institutional Review Board Statement

Not applicable.

Informed Consent Statement

Not applicable.

Data Availability Statement

The data presented in this study is available on request from the corresponding author.

Acknowledgments

We are thankful to the Surface Water Hydrology Project of the Water and Power Development Authority (SWHP-WAPDA) and the Pakistan Meteorological Department for providing the required hydro-meteorological data to conduct this study. We are thankful to editor and associate editor, as well as reviewers for their valuable comments and suggestions, which have improved the final version of this manuscript.

Conflicts of Interest

The authors declare that there is no conflict of interest.

Abbreviations

KRBKunhar River Basin
SDGsSustainable Development Goals
ITAInnovative Trend Analysis
MKMann Kendall
KPKKhyber Pakhtunkhwa
DEMDigital Elevation Model
ICIMODInternational Center for Integrated Mountain Development
WAPDAWater and Power Development Authority
PMDPakistan Meteorological Department
CUSUMCombinations of the Sum Boxes
FDCFlow Duration Curve
PETPotential Evapotranspiration
ETEvapotranspiration
SWATSoil and Water Assessment Tool
HRUsHydrological Response Units
SCSSoil Conservation Service
CNCurve Number
SUFISequential Uncertainty Fitting
NSENash-Sutcliffe model efficiency
CvCoefficient of Variance
UNUnited Nations

References

  1. Roser, M. Human Development Index (HDI); Our World in Data: Oxford, UK, 2019. [Google Scholar]
  2. Lamichhane, S.; Shakya, N.M. Integrated Assessment of Climate Change and Land Use Change Impacts on Hydrology in the Kathmandu Valley Watershed, Central Nepal. Water 2019, 11, 2059. [Google Scholar] [CrossRef] [Green Version]
  3. Bissenbayeva, S.; Abuduwaili, J.; Saparova, A.; Ahmed, T. Long-term variations in runoff of the Syr Darya River Basin under climate change and human activities. J. Arid. Land 2021, 13, 56–70. [Google Scholar] [CrossRef]
  4. AghaKouchak, A.; Mirchi, A.; Madani, K.; di Baldassarre, G.; Nazemi, A.; Alborzi, A.; Anjileli, H.; Azarderakhsh, M.; Chiang, F.; Hassanzadeh, E.; et al. Anthropogenic Drought: Definition, Challenges, and Opportunities. Rev. Geophys. 2021, 59, e2019RG000683. [Google Scholar] [CrossRef]
  5. Dhaubanjar, S.; Lutz, A.F.; Gernaat, D.E.; Nepal, S.; Smolenaars, W.; Pradhananga, S.; Biemans, H.; Ludwig, F.; Shrestha, A.B.; Immerzeel, W.W. A systematic framework for the assessment of sustainable hydropower potential in a river basin—The case of the upper Indus. Sci. Total Environ. 2021, 786, 147142. [Google Scholar] [CrossRef] [PubMed]
  6. Wu, Y.; Huang, L.; Zhao, C.; Chen, M.; Ouyang, W. Integrating hydrological, landscape ecological, and economic assessment during hydropower exploitation in the upper Yangtze River. Sci. Total Environ. 2021, 767, 145496. [Google Scholar] [CrossRef] [PubMed]
  7. Liu, Q.; Niu, J.; Sivakumar, B.; Ding, R.; Li, S. Accessing future crop yield and crop water productivity over the Heihe River basin in northwest China under a changing climate. Geosci. Lett. 2021, 8, 2. [Google Scholar] [CrossRef]
  8. Pachauri, R.K.; Allen, M.R.; Barros, V.R.; Broome, J.; Cramer, W.; Christ, R.; van Ypserle, J.P. Climate Change: Synthesis Report. Contribution of Working Groups I, II and III to the Fifth Assessment Report of the Intergovernmental Panel on Climate Change; IPCC: Geneva, Switzerland, 2014; p. 151. [Google Scholar]
  9. Rahman, K.; da Silva, A.G.; Tejeda, E.M.; Gobiet, A.; Beniston, M.; Lehmann, A. An independent and combined effect analysis of land use and climate change in the upper Rhone River watershed, Switzerland. Appl. Geogr. 2015, 63, 264–272. [Google Scholar] [CrossRef]
  10. Canchala, T.; Cerón, W.L.; Francés, F.; Carvajal-Escobar, Y.; Andreoli, R.; Kayano, M.; Alfonso-Morales, W.; Caicedo-Bravo, E.; de Souza, R.F. Streamflow Variability in Colombian Pacific Basins and Their Teleconnections with Climate Indices. Water 2020, 12, 526. [Google Scholar] [CrossRef] [Green Version]
  11. Ghaderpour, E.; Vujadinovic, T.; Hassan, Q.K. Application of the Least-Squares Wavelet software in hydrology: Athabasca River Basin. J. Hydrol. Reg. Stud. 2021, 36, 100847. [Google Scholar] [CrossRef]
  12. Alifujiang, Y.; Abuduwaili, J.; Groll, M.; Issanova, G.; Maihemuti, B. Changes in intra-annual runoff and its response to climate variability and anthropogenic activity in the Lake Issyk-Kul Basin, Kyrgyzstan. Catena 2021, 198, 104974. [Google Scholar] [CrossRef]
  13. Jehanzaib, M.; Shah, S.A.; Kwon, H.-H.; Kim, T.-W. Investigating the influence of natural events and anthropogenic activities on hydrological drought in South Korea. Terr. Atmospheric Ocean. Sci. 2020, 31, 85–96. [Google Scholar] [CrossRef] [Green Version]
  14. Chung, E.-S.; Park, K.; Lee, K.S. The relative impacts of climate change and urbanization on the hydrological response of a Korean urban watershed. Hydrol. Process. 2011, 25, 544–560. [Google Scholar] [CrossRef]
  15. Saifullah, M.; Li, Z.; Li, Q.; Hashim, S.; Zaman, M. Quantifying the Hydrological Response to Water Conservation Measures and Climatic Variability in the Yihe River Basin, China. Outlook Agric. 2015, 44, 273–282. [Google Scholar] [CrossRef]
  16. Zaman, M.; Anjum, M.N.; Usman, M.; Ahmad, I.; Saifullah, M.; Yuan, S.; Liu, S. Enumerating the Effects of Climate Change on Water Resources Using GCM Scenarios at the Xin’anjiang Watershed, China. Water 2018, 10, 1296. [Google Scholar] [CrossRef] [Green Version]
  17. Wu, J.; Miao, C.; Zhang, X.; Yang, T.; Duan, Q. Detecting the quantitative hydrological response to changes in climate and human activities. Sci. Total Environ. 2017, 586, 328–337. [Google Scholar] [CrossRef]
  18. Magritskii, D.V. Anthropogenic impact on the runoff of Russian rivers emptying into the Arctic Ocean. Water Resour. 2008, 35, 1–14. [Google Scholar] [CrossRef]
  19. Yin, J.; Gentine, P.; Zhou, S.; Sullivan, S.C.; Wang, R.; Zhang, Y.; Guo, S. Large increase in global storm runoff extremes driven by climate and anthropogenic changes. Nat. Commun. 2018, 9, 4389. [Google Scholar] [CrossRef] [PubMed] [Green Version]
  20. Abbasa, N.; Wasimia, S.A.; Al-Ansari, N. Assessment of Climate Change Impact on Water Resources of Lesser Zab, Kurdistan, Iraq Using SWAT Model. Engineering 2016, 8, 697–715. [Google Scholar] [CrossRef] [Green Version]
  21. Ali, S.; Shah, S. Climate Change Impact on Flow Discharge of Kunhar River Catchment using Snowmelt Runoff Model. J. Basic Appl. Sci. 2015, 11, 184–192. [Google Scholar] [CrossRef] [Green Version]
  22. Mahmood, R.; Jia, S.; Babel, M.S. Potential Impacts of Climate Change on Water Resources in the Kunhar River Basin, Pakistan. Water 2016, 8, 23. [Google Scholar] [CrossRef] [Green Version]
  23. Hirabayashi, Y.; Mahendran, R.; Koirala, S.; Konoshima, L.; Yamazaki, D.; Watanabe, S.; Kim, H.; Kanae, S. Global flood risk under climate change. Nat. Clim. Chang. 2013, 3, 816–821. [Google Scholar] [CrossRef]
  24. Held, I.M.; Soden, B.J. Robust Responses of the Hydrological Cycle to Global Warming. J. Clim. 2006, 19, 5686–5699. [Google Scholar] [CrossRef]
  25. Akbar, H.; Gheewala, S.H. Impact of Climate and Land Use Changes on flowrate in the Kunhar River Basin, Pakistan, for the Period (1992–2014). Arab. J. Geosci. 2021, 14, 1–11. [Google Scholar] [CrossRef]
  26. El-Khoury, A.; Seidou, O.; Lapen, D.; Que, Z.; Mohammadian, A.; Sunohara, M.; Bahram, D. Combined impacts of future climate and land use changes on discharge, nitrogen and phosphorus loads for a Canadian river basin. J. Environ. Manag. 2015, 151, 76–86. [Google Scholar] [CrossRef] [PubMed] [Green Version]
  27. He, Y.; Wang, F.; Mu, X.; Yan, H.; Zhao, G. An Assessment of Human versus Climatic Impacts on Jing River Basin, Loess Plateau, China. Adv. Meteorol. 2015, 2015, 478739. [Google Scholar] [CrossRef]
  28. Mango, L.M.; Melesse, A.M.; McClain, M.E.; Gann, D.; Setegn, S.G. Land use and climate change impacts on the hydrology of the upper Mara River Basin, Kenya: Results of a modeling study to support better resource management. Hydrol. Earth Syst. Sci. 2011, 15, 2245–2258. [Google Scholar] [CrossRef] [Green Version]
  29. Neupane, R.P.; Kumar, S. Estimating the effects of potential climate and land use changes on hydrologic processes of a large agriculture dominated watershed. J. Hydrol. 2015, 529, 418–429. [Google Scholar] [CrossRef]
  30. Strasser, U.; Förster, K.; Formayer, H.; Hofmeister, F.; Marke, T.; Meißl, G.; Nadeem, I.; Stotten, R.; Schermer, M. Storylines of combined future land use and climate scenarios and their hydrological impacts in an Alpine catchment (Brixental/Austria). Sci. Total Environ. 2019, 657, 746–763. [Google Scholar] [CrossRef] [PubMed]
  31. Wang, W.; Shao, Q.; Yang, T.; Peng, S.; Xing, W.; Sun, F.; Luo, Y. Quantitative assessment of the impact of climate variability and human activities on runoff changes: A case study in four catchments of the Haihe River basin, China. Hydrol. Process. 2013, 27, 1158–1174. [Google Scholar] [CrossRef]
  32. Zhang, A.; Zhang, C.; Fu, G.; Wang, B.; Bao, Z.; Zheng, H. Assessments of Impacts of Climate Change and Human Activities on Runoff with SWAT for the Huifa River Basin, Northeast China. Water Resour. Manag. 2012, 26, 2199–2217. [Google Scholar] [CrossRef]
  33. Jiang, S.; Ren, L.; Yong, B.; Singh, V.P.; Yang, X.; Yuan, F. Quantifying the effects of climate variability and human activities on runoff from the Laohahe basin in northern China using three different methods. Hydrol. Process. 2011, 25, 2492–2505. [Google Scholar] [CrossRef]
  34. Wang, S.; Yan, Y.; Yan, M.; Zhao, X. Quantitative estimation of the impact of precipitation and human activities on runoff change of the Huangfuchuan River Basin. J. Geogr. Sci. 2012, 22, 906–918. [Google Scholar] [CrossRef]
  35. Sankarasubramanian, A.; Vogel, R.M.; Limbrunner, J.F. Climate elasticity of streamflow in the United States. Water Resour. Res. 2001, 37, 1771–1781. [Google Scholar] [CrossRef]
  36. Zhou, X.; Zhang, Y.; Yang, Y. Comparison of Two Approaches for Estimating Precipitation Elasticity of Streamflow in China’s Main River Basins. Adv. Meteorol. 2015, 2015, 924572. [Google Scholar] [CrossRef]
  37. Dey, P.; Mishra, A. Separating the impacts of climate change and human activities on streamflows: A review of methodologies and critical assumptions. J. Hydrol. 2017, 548, 278–290. [Google Scholar] [CrossRef]
  38. Krajewski, A.; Sikorska-Senoner, A.E.; Hejduk, L.; Banasik, K. An Attempt to Decompose the Impact of Land Use and Climate Change on Annual Runoff in a Small Agricultural Catchment. Water Resour. Manag. 2021, 35, 881–896. [Google Scholar] [CrossRef]
  39. Saifullah, M.; Li, Z.; Li, Q.; Zaman, M.; Hashim, S. Quantitative Estimation of the Impact of Precipitation and Land Surface Change on Hydrological Processes through Statistical Modeling. Adv. Meteorol. 2016, 2016, 6130179. [Google Scholar] [CrossRef] [Green Version]
  40. Wang, F.; Hessel, R.; Mu, X.; Maroulis, J.; Zhao, G.; Geissen, V.; Ritsema, C. Distinguishing the impacts of human activities and climate variability on runoff and sediment load change based on paired periods with similar weather conditions: A case in the Yan River, China. J. Hydrol. 2015, 527, 884–893. [Google Scholar] [CrossRef]
  41. De Scally, F.A. Relative importance of snow accumulation and monsoon rainfall data for estimating annual runoff, Jhelum basin, Pakistan. Hydrol. Sci. J. 1994, 39, 199–216. [Google Scholar] [CrossRef] [Green Version]
  42. Schickhoff, U. Himalayan Forest-Cover Changes in Historical Perspective: A Case Study in the Kaghan Valley, Northern Pakistan. Mt. Res. Dev. 1995, 15, 3–18. [Google Scholar] [CrossRef]
  43. Star Hydropower Limited. Environmental Impact Assessment of Patrind Hydropower Project; Star Hydropower Limited: Islamabad, Pakistan, 2010. [Google Scholar]
  44. Soomro, S.-E.-H.; Hu, C.; Jian, S.; Wu, Q.; Boota, M.W.; Soomro, M.H.A.A. Precipitation changes and their relationships with vegetation responses during 1982–2015 in Kunhar River basin, Pakistan. Water Supply 2021. [Google Scholar] [CrossRef]
  45. Saifullah, M.; Liu, S.; Tahir, A.A.; Zaman, M.; Ahmad, S.; Adnan, M.; Chen, D.; Ashraf, M.; Mehmood, A. Development of Threshold Levels and a Climate-Sensitivity Model of the Hydrological Regime of the High-Altitude Catchment of the Western Himalayas, Pakistan. Water 2019, 11, 1454. [Google Scholar] [CrossRef] [Green Version]
  46. Khan, M.A.; Stamm, J.; Haider, S. Simulating the Impact of Climate Change with Different Reservoir Operating Strategies on Sedimentation of the Mangla Reservoir, Northern Pakistan. Water 2020, 12, 2736. [Google Scholar] [CrossRef]
  47. Akbar, H.; Gheewala, S.H. Changes in hydroclimatic trends in the Kunhar River Watershed. J. Sustain. Energy Environ. 2020, 11, 31–41. [Google Scholar]
  48. Mahmood, R.; Babel, M.S. Evaluation of SDSM developed by annual and monthly sub-models for downscaling temperature and precipitation in the Jhelum basin, Pakistan and India. Theor. Appl. Clim. 2013, 113, 27–44. [Google Scholar] [CrossRef]
  49. USGS Terrain Data. Available online: https://lpdaac.usgs.gov/tools/data-pool/ (accessed on 3 February 2021).
  50. ICIMOD Data Archive. Available online: http://rds.icimod.org/Home/DataDetail?metadataId=28630 (accessed on 25 February 2021). [CrossRef]
  51. The Harmonized World Soil Database v 1.2. Available online: http://www.fao.org/soils-portal/data-hub/soil-maps-and-databases/harmonized-world-soil-database-v12/en/ (accessed on 25 December 2020).
  52. ERA5 Reanalysis Data. Available online: https://cds.climate.copernicus.eu (accessed on 3 February 2021).
  53. Mann, H.B. Nonparametric Tests Against Trend. Econometrica 1945, 13, 245–259. [Google Scholar] [CrossRef]
  54. Kendall, M. Rank Correlation Measures; Charles Griffin: London, UK, 1975; p. 15. [Google Scholar]
  55. Şen, Z. Innovative Trend Analysis Methodology. J. Hydrol. Eng. 2012, 17, 1042–1046. [Google Scholar] [CrossRef]
  56. Taylor, W.A. Change-Point Analysis: A Powerful New Tool for Detecting Changes; Variation: Libertyville, IL, USA, 2000; Available online: https://variation.com/wp-content/uploads/change-point-analyzer/change-point-analysis-a-powerful-new-tool-for-detecting-changes.pdf (accessed on 31 October 2021).
  57. Searcy, J.K.; Hardison, C.H.; Langein, W.B. Double-Mass Curves, with a Section Fitting Curves to Cyclic Data; US Geological Survey: Reston, VA, USA, 1960.
  58. Searcy, J.K. Flow-Duration Curves (No. 1542); US Government Printing Office: Boston, MA, USA, 1959.
  59. Tomer, M.D.; Schilling, K.E. A simple approach to distinguish land-use and climate-change effects on watershed hydrology. J. Hydrol. 2009, 376, 24–33. [Google Scholar] [CrossRef]
  60. Schaake, J.C. From climate to flow. In Climate Change and US Water Resources; Wiley-Interscience: Hoboken, NJ, USA, 1990; pp. 177–206. [Google Scholar]
  61. Fu, G.; Charles, S.P.; Chiew, F.H.S. A two-parameter climate elasticity of streamflow index to assess climate change effects on annual streamflow. Water Resour. Res. 2007, 43, 43. [Google Scholar] [CrossRef]
  62. Zheng, H.; Zhang, L.; Zhu, R.; Liu, C.; Sato, Y.; Fukushima, Y. Responses of streamflow to climate and land surface change in the headwaters of the Yellow River Basin. Water Resour. Res. 2009, 45, 45. [Google Scholar] [CrossRef]
  63. Babar, S.; Ramesh, H. Streamflow Response to Land Use–Land Cover Change over the Nethravathi River Basin, India. J. Hydrol. Eng. 2015, 20, 05015002. [Google Scholar] [CrossRef]
  64. Arnold, J.G.; Srinivasan, R.; Muttiah, R.S.; Williams, J.R. Large Area Hydrologic Modeling and Assessment Part I: Model Development. JAWRA J. Am. Water Resour. Assoc. 1998, 34, 73–89. [Google Scholar] [CrossRef]
  65. Neitsch, S.L. Soil and Water Assessment Tool; User’s Manual Version; Texas Water Resources Institute: College Station, TX, USA, 2005; p. 476. [Google Scholar]
  66. Abu-Allaban, M.; El-Naqa, A.; Jaber, M.; Hammouri, N. Water scarcity impact of climate change in semi-arid regions: A case study in Mujib basin, Jordan. Arab. J. Geosci. 2015, 8, 951–959. [Google Scholar] [CrossRef]
  67. Neitsch, S.L.; Arnold, J.G.; Kiniry, J.R.; Williams, J.R. Soil and Water Assessment Tool Theoretical Documentation Version 2009; Texas Water Resources Institute: College Station, TX, USA, 2011. [Google Scholar]
  68. Monteith, J.L. Evaporation and environment. In Symposia of the Society for Experimental Biology; Cambridge University Press: Cambridge, UK, 1965; Volume 19, pp. 205–234. [Google Scholar]
  69. Penman, H.L. Natural evaporation from open water, bare soil and grass. Proc. R. Soc. A 1948, 193, 120–145. [Google Scholar]
  70. Abbaspour, K.C. SWAT-Cup 2012. SWAT Calibration and Uncertainty Program—A User Manual; Eawag: Dübendorf, Switzerland, 2013. [Google Scholar]
  71. Moriasi, D.N.; Arnold, J.G.; van Liew, M.W.; Bingner, R.L.; Harmel, R.D.; Veith, T.L. Model evaluation guidelines for systematic quantification of accuracy in watershed simulations. Trans. ASABE 2007, 50, 885–900. [Google Scholar] [CrossRef]
  72. Nash, J.E.; Sutcliffe, J.V. River flow forecasting through conceptual models part I—A discussion of principles. J. Hydrol. 1970, 10, 282–290. [Google Scholar] [CrossRef]
  73. Azmat, M.; Liaqat, U.W.; Qamar, M.U.; Awan, U.K. Impacts of changing climate and snow cover on the flow regime of Jhelum River, Western Himalayas. Reg. Environ. Chang. 2017, 17, 813–825. [Google Scholar] [CrossRef]
  74. Latif, Y.; Ma, Y.; Ma, W. Climatic trends variability and concerning flow regime of Upper Indus Basin, Jehlum, and Kabul river basins Pakistan. Theor. Appl. Clim. 2021, 144, 447–468. [Google Scholar] [CrossRef]
  75. Zaman, M.; Ahmad, I.; Usman, M.; Saifullah, M.; Anjum, M.N.; Khan, M.I.; Qamar, M.U. Event-Based Time Distribution Patterns, Return Levels, and Their Trends of Extreme Precipitation across Indus Basin. Water 2020, 12, 3373. [Google Scholar] [CrossRef]
  76. Guo, Y.; Li, Z.; Amo-Boateng, M.; Deng, P.; Huang, P. Quantitative assessment of the impact of climate variability and human activities on runoff changes for the upper reaches of Weihe River. Stoch. Environ. Res. Risk Assess. 2014, 28, 333–346. [Google Scholar] [CrossRef]
  77. Liang, S.; Wang, W.; Zhang, D.; Li, Y.; Wang, G. Quantifying the Impacts of Climate Change and Human Activities on Runoff Variation: Case Study of the Upstream of Minjiang River, China. J. Hydrol. Eng. 2020, 25, 05020025. [Google Scholar] [CrossRef]
  78. Khattak, M.; Babel, M.; Sharif, M. Hydro-meteorological trends in the upper Indus River basin in Pakistan. Clim. Res. 2011, 46, 103–119. [Google Scholar] [CrossRef]
  79. Shahid, M.; Cong, Z.; Zhang, D. Understanding the impacts of climate change and human activities on streamflow: A case study of the Soan River basin, Pakistan. Theor. Appl. Clim. 2017, 134, 205–219. [Google Scholar] [CrossRef]
  80. Shaukat, R.S.; Khan, M.M.; Shahid, M.; Shoaib, M.; Khan, T.A.; Aslam, M.A. Quantitative Contribution of Climate Change and Land Use Change to Runoff in Tarbela Catchment, Pakistan. Pol. J. Environ. Stud. 2020, 29, 3295–3304. [Google Scholar] [CrossRef]
  81. Zhou, Y.; Lai, C.; Wang, Z.; Chen, X.; Zeng, Z.; Chen, J.; Bai, X. Quantitative Evaluation of the Impact of Climate Change and Human Activity on Runoff Change in the Dongjiang River Basin, China. Water 2018, 10, 571. [Google Scholar] [CrossRef] [Green Version]
  82. Gao, G.; Fu, B.; Wang, S.; Liang, W.; Jiang, X. Determining the hydrological responses to climate variability and land use/cover change in the Loess Plateau with the Budyko framework. Sci. Total Environ. 2016, 557–558, 331–342. [Google Scholar] [CrossRef]
  83. Zhou, X.; Zhang, Y.; Wang, Y.; Zhang, H.; Vaze, J.; Zhang, L.; Yang, Y.; Zhou, Y. Benchmarking global land surface models against the observed mean annual runoff from 150 large basins. J. Hydrol. 2012, 470–471, 269–279. [Google Scholar] [CrossRef]
  84. Ruggiu, D.; Viola, F. Linking Climate, Basin Morphology and Vegetation Characteristics to Fu’s Parameter in Data Poor Conditions. Water 2019, 11, 2333. [Google Scholar] [CrossRef] [Green Version]
  85. Yang, H.; Yang, D. Derivation of climate elasticity of runoff to assess the effects of climate change on annual runoff. Water Resour. Res. 2011, 47, 47. [Google Scholar] [CrossRef]
  86. Ramírez, J.A.; Hobbins, M.T.; Brown, T.C. Observational evidence of the complementary relationship in regional evaporation lends strong support for Bouchet’s hypothesis. Geophys. Res. Lett. 2005, 32, L15401. [Google Scholar] [CrossRef] [Green Version]
  87. Power, P. Hydro Power Resources of Pakistan; Annual Report of Private Power and Infrastructure Board, Islamabad; Government of Pakistan: Islamabad, Pakistan, 2011; pp. 1–2.
  88. Caracciolo, D.; Pumo, D.; Viola, F. Budyko’s Based Method for Annual Runoff Characterization across Different Climatic Areas: An Application to United States. Water Resour. Manag. 2018, 32, 3189–3202. [Google Scholar] [CrossRef]
  89. Setegn, S.G.; Rayner, D.; Melesse, A.; Dargahi, B.; Srinivasan, R. Impact of climate change on the hydroclimatology of Lake Tana Basin, Ethiopia. Water Resour. Res. 2011, 47, 47. [Google Scholar] [CrossRef]
  90. Praskievicz, S.; Chang, H. Impacts of Climate Change and Urban Development on Water Resources in the Tualatin River Basin, Oregon. Ann. Assoc. Am. Geogr. 2011, 101, 249–271. [Google Scholar] [CrossRef]
  91. Van der Velde, Y.; Vercauteren, N.; Jaramillo, F.; Dekker, S.C.; Destouni, G.; Lyon, S.W. Exploring hydroclimatic change disparity via the Budyko framework. Hydrol. Process. 2014, 28, 4110–4118. [Google Scholar] [CrossRef]
  92. Yasinskii, S.V.; Kashutina, E.A. Effect of regional climate variations and economic activity on changes in the hydrological regime of watersheds and small-river runoff. Water Resour. 2012, 39, 272–293. [Google Scholar] [CrossRef]
  93. Zheng, Y.; Huang, Y.; Zhou, S.; Wang, K.; Wang, G. Effect partition of climate and catchment changes on runoff variation at the headwater region of the Yellow River based on the Budyko complementary relationship. Sci. Total Environ. 2018, 643, 1166–1177. [Google Scholar] [CrossRef] [PubMed]
  94. Sharma, C.; Shukla, A.K.; Zhang, Y. Climate change detection and attribution in the Ganga-Brahmaputra-Meghna river basins. Geosci. Front. 2021, 12, 101186. [Google Scholar] [CrossRef]
  95. Gulahmadov, N.; Chen, Y.; Gulakhmadov, A.; Rakhimova, M.; Gulakhmadov, M. Quantifying the Relative Contribution of Climate Change and Anthropogenic Activities on Runoff Variations in the Central Part of Tajikistan in Central Asia. Land 2021, 10, 525. [Google Scholar] [CrossRef]
  96. Wu, C.; Ji, C.; Shi, B.; Wang, Y.; Gao, J.; Yang, Y.; Mu, J. The impact of climate change and human activities on streamflow and sediment load in the Pearl River basin. Int. J. Sediment Res. 2019, 34, 307–321. [Google Scholar] [CrossRef]
  97. Abbas, T.; Nabi, G.; Boota, M.W.; Faisal, M.; Azam, M.I.; Yaseen, M.; Hussain, F. Continuous hydrologic modeling of major flood hydrographs using semi-distributed model. Sci. Int. 2015, 27, 6231e7. [Google Scholar]
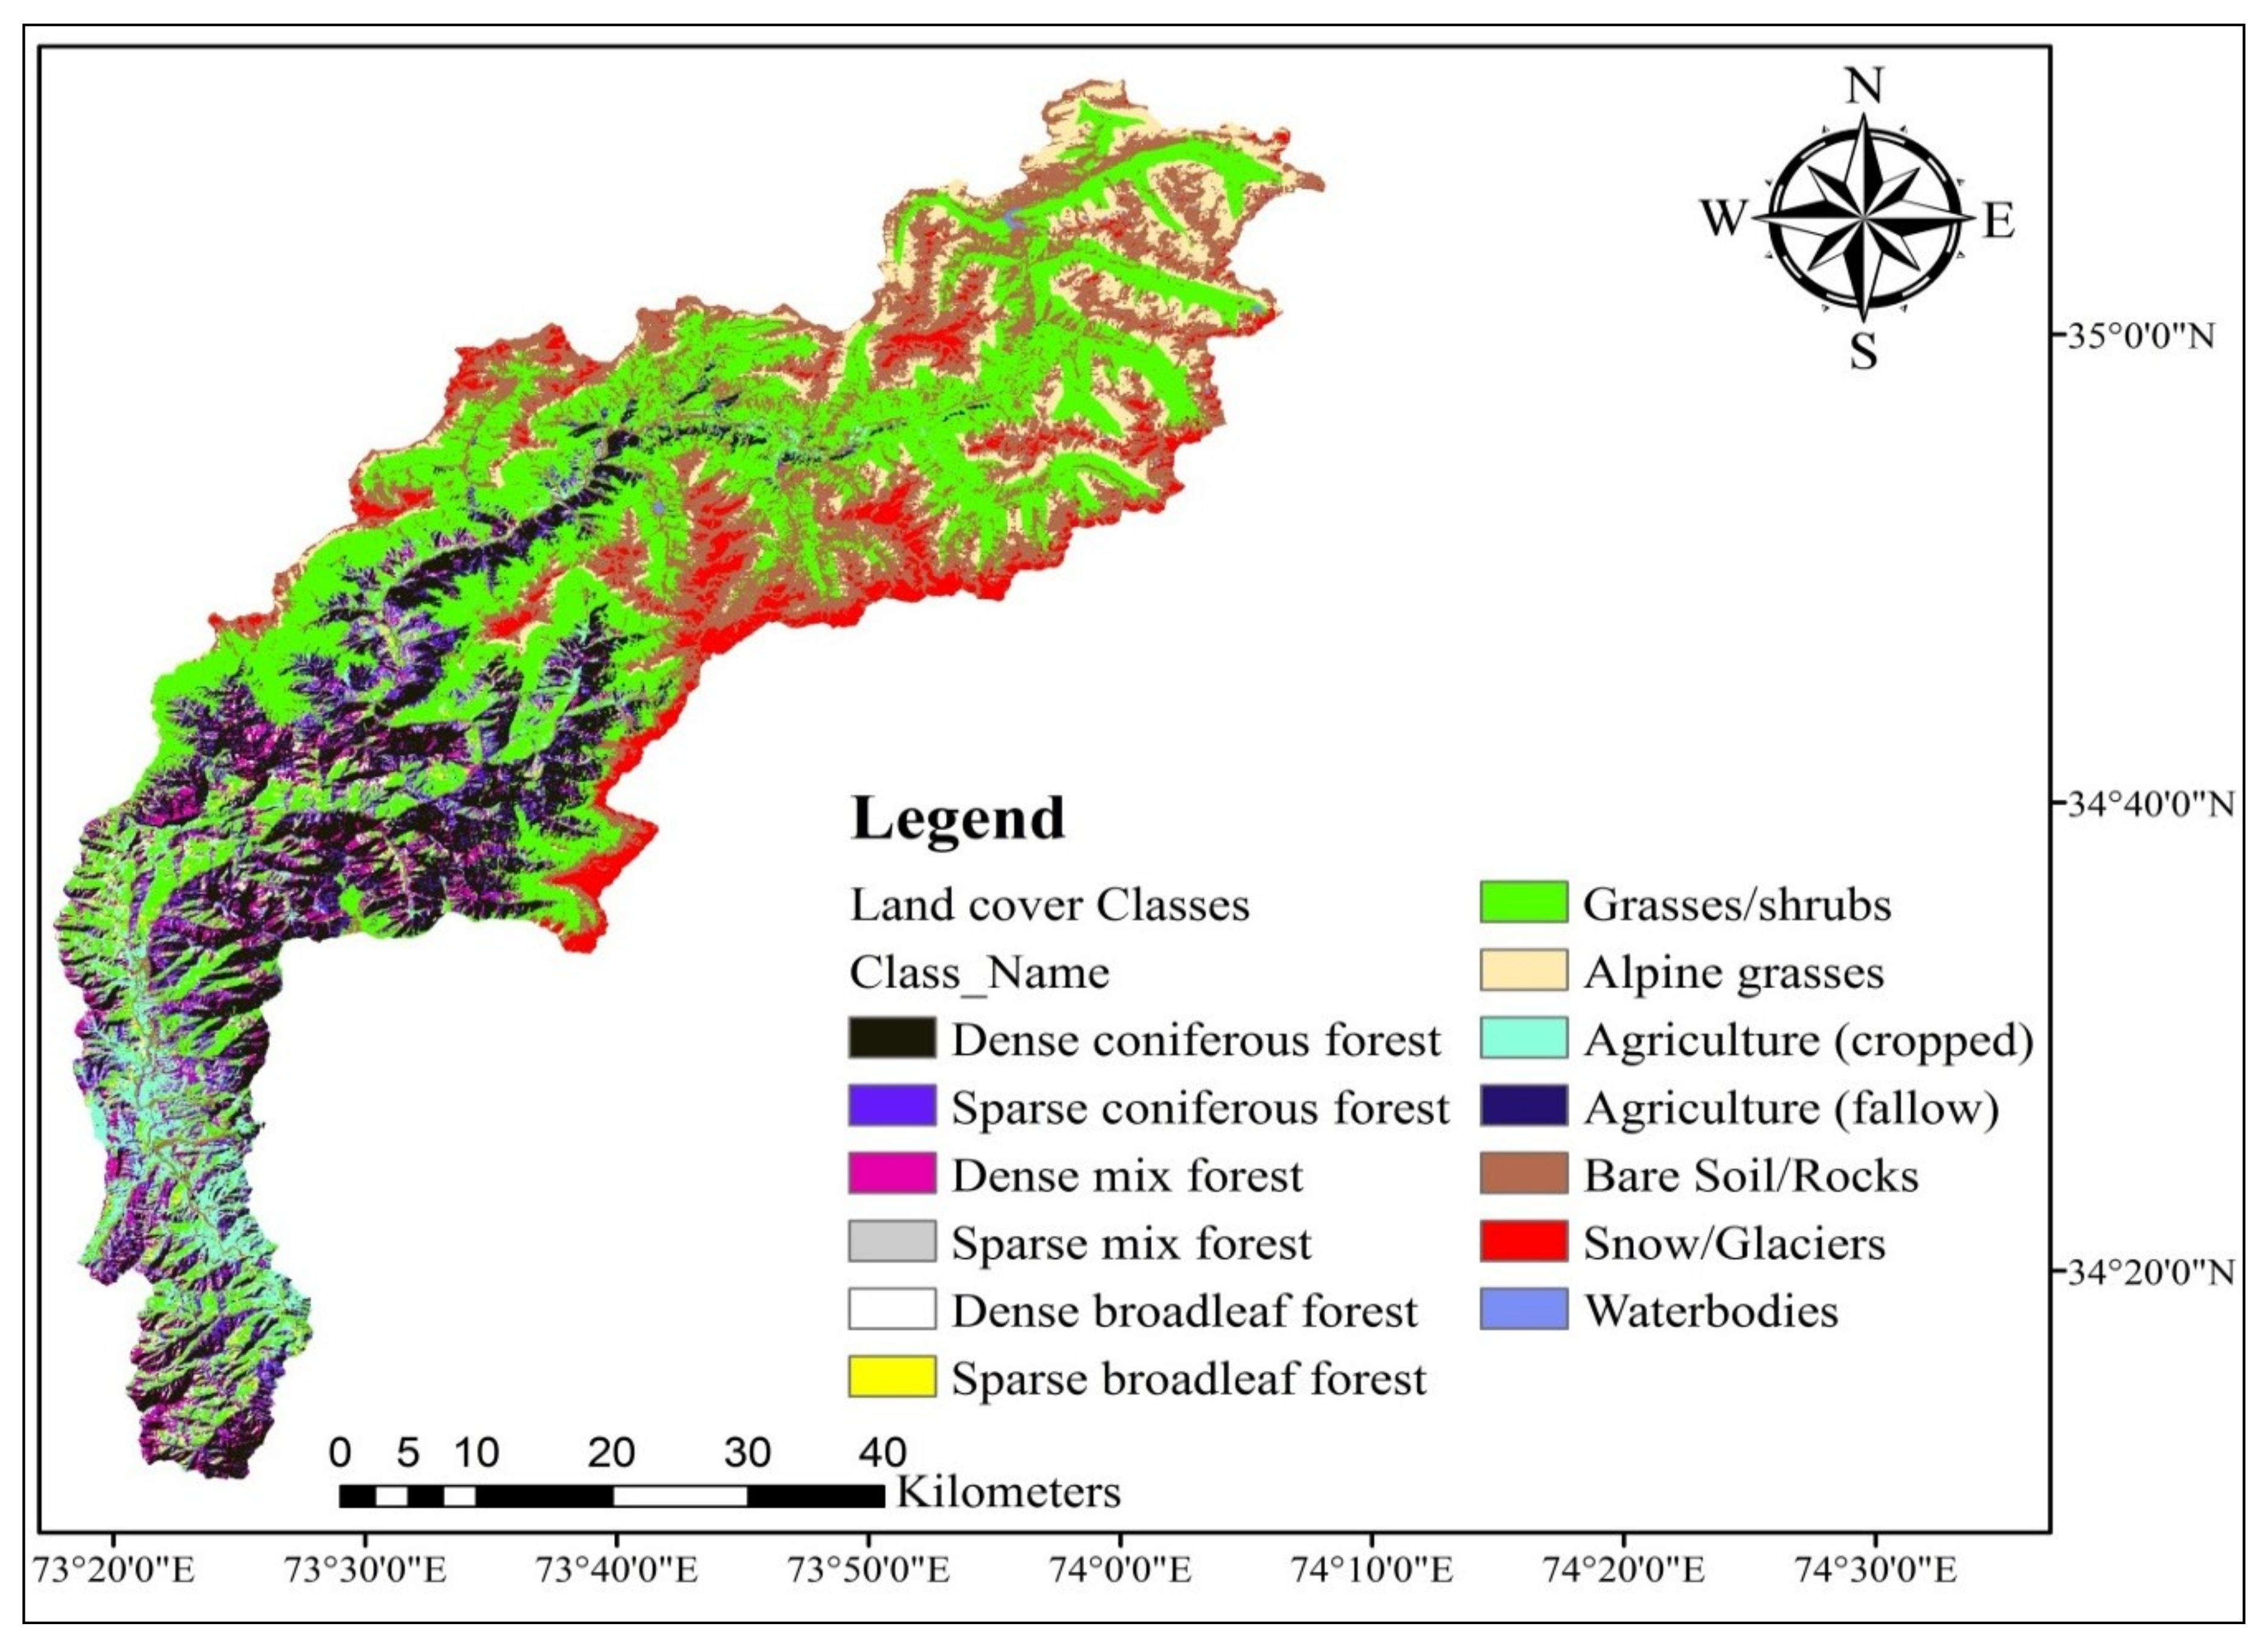
Figure 1. Geographical location of the KRB in Pakistan.
Water 13 03163 g001
Figure 2. Land-cover classes of the KRB.
Water 13 03163 g002
Figure 3. Interpretation of the ITA technique.
Water 13 03163 g003
Figure 4. Tomer Schilling framework.
Water 13 03163 g004
Figure 5. (a) Sub-basins; (b) Land-use classification; (c) Soil classification and (d) Slope classification of the KRB in the Arc SWAT model.
Water 13 03163 g005
Figure 6. Flowsheet diagram of the SWAT model.
Water 13 03163 g006
Figure 7. ITA of precipitation, evapotranspiration, and runoff time series of the KRB. (a) Precipitation; (b) Evapotranspiration; (c) Runoff.
Water 13 03163 g007
Figure 8. Change point analysis on the annual precipitation (ADP), evapotranspiration (ADET), and runoff (ADR) time series.
Water 13 03163 g008
Figure 9. Temporal variation in precipitation, evapotranspiration, and runoff over the KRB.
Water 13 03163 g009
Figure 10. The determination of abrupt change in a time series using (a) a double mass curve and; (b) a flow duration curve analysis.
Water 13 03163 g010
Figure 11. Eco-hydrological approach applied to the KRB.
Water 13 03163 g011
Figure 12. Model performance during the calibration stage.
Water 13 03163 g012
Figure 13. Model performance during the validation stage.
Water 13 03163 g013
Figure 14. The graph between observed and reconstructed flow using SWAT model for the post-change period.
Water 13 03163 g014
Figure 15. Scatter plots of (a) runoff coefficient vs. precipitation; (b) runoff coefficient vs. evapotranspiration; and (c) runoff coefficient vs. drought index.
Water 13 03163 g015
Figure 16. Land cover variations in KRB during the period 1992–2014.
Water 13 03163 g016
Table 1. Land-cover classes of the KRB.
IDClass NameArea (km2)Area (%)
1Dense coniferous forest359.913.70
2Sparse coniferous forest160.86.12
3Dense mix forest122.74.67
4Sparse mix forest61.62.35
5Dense broadleaf forest30.61.17
6Sparse broadleaf forest21.50.82
7Grasses/shrubs853.532.49
8Alpine grasses183.36.98
9Agriculture (cropped)114.24.35
10Agriculture (fallow)0.90.03
11Bare Soil/Rocks585.722.29
12Snow/Glaciers128.24.88
13Water bodies4.00.15
Table 2. List of hydro-meteorological data of the KRB.
StationLatitude (°)Longitude (°)Altitude (m)Period of RecordSource of Data
Hydrological stations
Naran34.973.6523621971–2010WAPDA
Gari Habibullah34.4073.388101971–2010WAPDA
Meteorological stations
Balakot34.5573.359951971–2010PMD
Muzaffarabad34.3773.487021971–2010PMD
Naran34.973.6524211971–2010PMD
Note: WAPDA refer to the Water and Power Development Authority and PMD to Pakistan Meteorological department.
Table 3. List of parameters used for calibrating of the SWAT model.
ParameterDescriptionAdjusted Value
r_CN2.mgtInitial SCS runoff curve number for moisture condition II−0.25
v__CH_N2.rteManning’s “n” for the main channel−0.01
r_SOL_AWC.solSoil available water capacity (mm H2O/mm soil)0.48
v__GWQMN.gwThreshold depth in the shallow aquifer for return flow (mm)1888
v__RCHRG_DP.gwFraction of root zone percolation that reaches the deep aquifer0.62
v_ALPHA_BF.gwBaseflow alpha-factor (days)0.034
v_GW_DELAY.gwGroundwater delay (days)71
v_SURLAG.bsnSurface Runoff lag coefficient4.47
v_SMFMN.bsnMinimum melt rate for snow during the year (occurs on winter solstice)
H2O/°C-day)
4.88
v_SMFMX.bsnMaximum melt rate for snow during the year (occurs on the summer solstice).
(mm H2O/°C-day)
11.20
v_SMTMP.bsnSnowmelt base temperature (°C)−2.81
v_SFTMP.bsnSnowfall temperature (°C)4.91
v__TIMP.bsnSnowpack temperature lag factor0.045
v_SNOCOVMX.bsnMinimum snow water content that corresponds to 100% snow cover192.17
v__PLAPS.subPrecipitation lapse rate (mm H2O/km)135.2
v_TLPAS.subTemperature lapse rate (°C/km)−6.4
v__ESCO.hruSoil evaporation compensation factor0.42
v__EPCO.hruPlant uptake consumption factor0.80
Note: where ‘v’ designates that the parameter value is replaced by a given value, whereas ‘r’ specifies that the parameter value is multiplied by (1 + a given value).
Table 4. Statistical indices for annual variations in precipitation, evapotranspiration, and runoff of the KRB.
Climatic Variables1971–2010
Mean (mm)Standard Deviation (mm)SkewnessCoefficient of Variance (CV)Ratio of (CV)
Precipitation16363650.6110.220.96
Evapotranspiration422482.150.121.85
Runoff14133020.550.21-
Table 5. Results of the MK trend test and ITA on the annual for the hydro-climatic time series of the KRB.
VariablesZ-ValueTrendITA
Precipitation1.74 +Sig. Increasing Water 13 03163 i001
Evapotranspiration1.67 +Sig. Increasing Water 13 03163 i002
Runoff1.36Non-significant Water 13 03163 i003
Note: ‘Sig.’ stands for statistically significant and‘+.’ Refers to the 0.1 level of significance.
Table 6. Descriptive statistics of the time period before and after the abrupt change in time series.
VariablesPre-Change (1971–1996)Post-Change (1997–2010)Relative Change
Mean (mm)CvRatio of CvMean
(mm)
CvRatio of Cvmm%
Precipitation 16430.230.8816240.221.10−19−1.0
Evapotranspiration 4170.102.064310.141.72143.25
Runoff 14260.20 13900.25 −36−2.59
Table 7. Results of the MK trend test and ITA on the hydro-climatic variables of the KRB during the pre and post-change periods.
Variables1971–19961997–2010
Z-ValueTrendITAZ-ValueTrendITA
Precipitation3.13 **Sig. Increasing Water 13 03163 i0041.53Non-significant Water 13 03163 i005
ETp1.06Non-significant Water 13 03163 i0060.88No-trend Water 13 03163 i007
Runoff2.07 *Sig. Increasing Water 13 03163 i0082.19 *Sig. Increasing Water 13 03163 i009
Note: ** refers to the 0.01 significance level and * to the 0.05 significance level.
Table 8. Statistical evaluation of the calibration and validation of the SWAT model on the KRB at a monthly time scale.
Statistical ParametersCalibrationValidation
R20.790.85
NSE0.780.84
PBIAS (%)−3.50.6
p-factor0.950.89
r-factor1.240.81
Table 9. Differentiating the impacts of climate change and anthropogenic activities on the runoff of the KRB using different methods.
Activity/MethodsEco-Hydrological ApproachStatistical ApproachClimate Elasticity ModelSWAT Model
Anthropogenic activitiesPex and Eex decreased95%75%176%
Climate change5%25%−76%
Publisher’s Note: MDPI stays neutral with regard to jurisdictional claims in published maps and institutional affiliations.

