Article

Unveiling Economic Co-Benefits of Virtual Water Trades: An Empirical Analysis on China’s JingJinJi Megalopolis

1
School of Environment and Energy, Peking University Shenzhen Graduate School, Shenzhen 518055, China
2
International College Beijing, China Agricultural University, Beijing 100083, China
3
Department of Environment Science and Engineering, Fudan University, Shanghai 200433, China
4
School of Foreign Languages, Shanxi Datong University, Datong 037009, China
5
College of Economics and Management, China Agricultural University, Beijing 100083, China
*
Author to whom correspondence should be addressed.
Water 2021, 13(21), 3140; https://doi.org/10.3390/w13213140
Submission received: 23 August 2021 / Revised: 3 November 2021 / Accepted: 5 November 2021 / Published: 8 November 2021
(This article belongs to the Section Water Use and Scarcity)

Abstract

:
The development of metropolitan cities inevitably relies on natural resources beyond their boundary through trade of materials and products, particularly within the same urban agglomeration. Meanwhile trade facilitates the optimization of resource allocations under scarcity, among cities and sectors, and therefore generates economic gains. This study constructs an economic evaluation model combining a Multi-Regional Input-Output model and a Data Envelopment Analysis (DEA) to quantify the economic impacts of virtual water trades among the 13 cities in the JingJinJi region (China national capital area), one of the most water-scarce regions in China. We found that the total virtual water trade among the 13 cities amounted to 927 million m3 in 2012, among which agricultural sectors contributed 90% while the industrial sector and service sector together made up the remaining 10%. While Beijing and Tianjin are the main virtual water importers, importing respectively 300.48 and 226.92 million m3 in 2012, Shijiazhuang was the largest virtual water exporter, exporting 173.29 million m3 virtual water in the same year. Due to their more advanced economic conditions, Beijing and Tianjin also have the highest shadow prices of water, at respectively 912.21 and 831.86 CNY per m3, compared to a range of 79.31 to 263.03 CNY per m3 in cities in Hebei. Virtual water flows from cities in Hebei to Beijing and Tianjin thus generate economic gains. It is estimated that virtual water trades in the JingJinJi region have generated a net economic gain of 403.62 billion CNY in 2012, particularly owing to trades of agricultural products from Shijiazhuang to Beijing and Tianjin.

1. Introduction

Water is not only essential to supporting human lives, but also critical to providing an indispensable input to different social economic sectors, including agriculture, industries, domestic, service, and the natural environment. The sustainable use and management of the finite water resources is therefore fundamental to realize the United Nation’s Sustainable Development Goals [1,2], which requires making wise and informed trade-off decisions among the various rising competing demands. The case of China and especially its water-scarce northern regions is a manifestation of such an emergent water crisis engendered by rapid social economic development. During the last couple of decades since its opening and reform policy, China has experienced unprecedented economic growth, elevating its per capita income by nearly 30-fold to 70,891 CNY (amounting to 10,276 USD) in 2019 [3]. Consequentially, water demands have also increased significantly and put increasing pressure on its finite water resources [4,5]. Such challenges are particularly pronounced in the JingJinJi (Beijing-Tianjin-Hebei) Urban Agglomeration where less than 0.7 percent of the national water resources are used to support 10 percent of the national GDP, 8 percent of the population and 6 percent of the crop production [3,6].
The JingJinJi region (referred to as JingJinJi region), where the national capital Beijing is located, includes 13 municipalities in total (i.e., Beijing, Tianjin, Shijiazhuang, Tangshan, Qinhuangdao, Handan, Xingtai, Baoding, Zhangjiakou, Chengde, Cangzhou, Langfang, and Hengshui). It is not only the political and cultural center of China, but also the economic engine of the northern regions. Since the national strategy of ‘JingJinJi coordinated development’ was put forward in 2014, the region has experienced rapid social economic development. However, the water resource limit has gradually become the bottleneck of further sustainable development, with increasing water degradation issues brought by heightened human activities [7]. In order to alleviate their deteriorating water pressures, cities in the JingJinJi region have been increasingly utilizing virtual water inflows from both within and outside of the region, especially Beijing [8]. According to Zhao et al. [9], Beijing and Tianjin are both virtual water net recipients while cities in Hebei are net virtual water exporters through exporting agricultural and manufactural products. Net virtual water imports account for 81 and 89 percent of the total water consumption in Beijing and Tianjin respectively [10].
Virtual water was a concept first developed by Tony Allan to quantify the freshwater resources that are consumed or transformed in order to produce certain amounts of commodities or services at their point of origin [11]. Hoekstra and his group later developed the concept of ‘water footprint’ to quantify the virtual water throughout the life cycle from the perspective of final consumption [12,13]. While virtual water imports, through embodiment in agricultural products [14], are also crucial for the final consumption, especially food and energy security, in arid regions, such as the Middle East [15,16], as well as China’s water-scarce northern regions, virtual water exports are exerting increasing water pressures in the cities where production activities are located and have generated negative externalities that are often not accounted for [17]. According to Cai et al. [18], water use efficiency improvement in virtual water exporting regions and water consumption structural changes in importing regions are the two main causes for changes in virtual water trades. As Wichelns pointed out [19], water endowment is rarely considered as a comparative advantage in forming trade patterns, in particular, water’s multiple values are not fully considered in its pricing systems. The economic impacts of virtual water trades are not well understood. While the economic development, water endowment and water use efficiency all vary substantially among the 13 cities in the JingJinJi region, with per capita water resource availability varying from 71 to 693 m3 and water use per GDP of ten thousand CNY varying from 14 to 135 m3 [20], when virtual water flows from less economically developed regions to more economically developed regions and the internal water resources in those more economically developed regions can be used for higher value-added purposes, virtual water flows could generate net economical gains, and vice versa.
In order to better understand the economic impacts of virtual water trades from a regional perspective and improve the coordinated development of the whole JingJinJi region, it is useful to introduce the concept of shadow price of water, which, despite its various definitions in the literature, essentially represents the marginal contribution or benefit of water to societal objectives under the optimal allocation of water among different competing demands [21,22,23]. Data Envelopment Analysis (DEA), developed by Charnes et al. [24], has been widely used to evaluate the allocation efficiency and total efficiency of resources [25,26,27,28]. DEA can be used to evaluate the water use efficiency of certain regions and therefore can be used to estimate the shadow price of water under the most optimal allocation scenario [29].
This study constructs an economic evaluation model based on the Input-Output model and DEA to evaluate the economic impacts of virtual water trades among the 13 cities in the JingJinJi region based on the shadow price of water. First, virtual water trades, both in terms of volume and sector structure, are mapped out using a Multi-Regional Input-Output model. A DEA is then conducted to evaluate the allocation efficiency of water resources and, based on which, the regional economic impacts of virtual water flows are quantified based on the shadow price of water. This work makes the following main contributions to the existing literature by:
i.
highlighting the overlooked economic impacts of increasing virtual water trades using the concept of water’s shadow prices;
ii.
establishing a novel framework linking the Multi-regional Input-Output model with Data Envelopment Analysis to evaluate the economic impacts, both co-benefits and trade-offs, of virtual water trades;
iii.
using China’s water-scarce but economically vibrant Jingjinji Metropolitan area as an example to apply such a framework and put forward policy recommendations. Relevant results can better reveal the potential economic value of virtual water trade for the JingJinJi region, and thus provide a scientific basis for relevant policy decisions.

2. Materials and Methods

2.1. Study Area

With a territorial area of 218,000 km2 and a total population of 113.1 million, the JingJinJi region, where the national capital Beijing is located, is not only the political center of China, but also an important growth engine in the eastern part and a strategic area for regional integrated development. The plan of the "Beijing-Tianjin-Hebei integration" was issued in 2014 with the aim of achieving synergistic development and complementary advantages among cities within this region. As a direct result, intra-region economic and social exchanges among cities have substantially increased, so to the embodied virtual water flows. In 2019, JingJinJi region achieved a regional GDP of 8458 billion CNY, with 4.5% for agricultural sector, 28.7% for industrial sector, and 66.8% for service sector (National Bureau of Statistics, 2020). At the same time, significant development disparity exists within this region among different cities, with per capita GDP amounting to 164,220 CNY in Beijing (Jing) and 90,371 CNY in Tianjin (Jin), in contrast to merely 46,348 CNY in Hebei (Ji), almost one fourth of that in Beijing.
Meanwhile, the JingJinJi region faces pressing resource-based water scarcity. In 2019, the total regional water resources amounted to 18.54 billion m3, with per capita water resource availability in Beijing, Tianjin and Hebei at 119.8, 85.1 and 192.7 m3 per capita respectively, which is only 5%, 4% and 9% of the national level (The Ministry of Water Resources of China, 2020). Water resource per capita in the JingJinJi region is the lowest in China, even lower than some countries in the Middle East and North Africa region. According to the UN definition, the JingJinJi region faces extreme water scarcity (water resource per capita lower than 500 m3). In short, the JingJinJi region supports 8% of the country’s population and 9% of the country’s total economic output with only 1% of the country’s water resources, demonstrating the acute water scarcity this region is facing.

2.2. Multi-Regional Input-Output (MRIO) Model

The Multi-Regional Input-Output (MRIO) model [30] is an extension of the Single-Region Input-Output model and is widely used to trace the embodied resources among inter-regional trade of commodities and services [31,32]. The MRIO table in 2012 with 13 cities in the JingJinJi region and 31 sectors was obtained from the 2012 Nested Hebei Cities-Chinese Province MRIO [33].
The MRIO model can be expressed by the following equation:
x = I A 1 y
where   x indicates the aggregate vector of output for all regions;   I is an identity matrix; A is the aggregate cross-regional direct requirement coefficient matrix; y refers to the aggregate cross-regional final consumption vector.
The virtual water export ( vwe ) and virtual water import ( vwi ) from region p to other regions can be calculated as follows:
vwi p = r p d q I A pp 1 er pq
where A pp is the technical coefficient of domestic intermediate inputs of region p ; er pq is the imports from region p to region q ; d indicates a vector of water withdrawal coefficients and consists of the direct water consumption intensity of each sector, which can be obtained from the Annual Statistic Report on Environment in China [34] and the China’s Provincial Water Resource Bulletins [35].

2.3. Data Envelopment Analysis

The definition of shadow price is derived from residual valuation [36], which is based on the assumption that all inputs are applied according to their market price. In other words, shadow price measures the maximum value of a limited resource at the optimal allocation condition. Data Envelopment Analysis (DEA) is a common method to measure the water use efficiency and can be employed to calculate the shadow price of virtual water.
DEA is a linear programming method based on the Pareto optimal principle [24,37,38]. It can be expressed as follows:
min θ ε e T S + e T S + ,   s . t . j = 1 n λ j x i j + S i = θ x i 0 j = 1 n λ j y j S + = y 0 j = 1 n λ j = 1 λ j 0 , j = 1 , 2 , 3 , , 30 S 0 , S + 0
where x i j is the input i of the j t h decision making unit; y refers to the output; λ is the Lagrange multiplier;   S + and S are respectively the output slack variable and input slack variable, which represents redundant inputs and insufficient output, respectively; ε indicates the non-Archimedean infinitesimal, which is a constant number ( ε = 10 6 ); θ is the efficiency of the decision unit ( 0 < θ < 1 ). When θ = 1 and S = S + = 0 , the decision-making unit is in an effective state, indicating that the water efficiency (economic benefit) has reached the optimal level.
Total population, total investment in fixed assets (namely capital) and total water consumption of the 13 cities are three inputs, and regional GDP is one desirable output. The data are collected from China Statistical Yearbook and Hebei Economic Yearbook [38,39].

2.4. Estimating Shadow Price

Based on our definition, the shadow price of virtual water can be calculated as the ratio between the net return from virtual water (i.e., the final consumption expenditure) and the total amount of water used (i.e., total water consumption) [40,41,42]. The formula is shown below:
S P =   θ × E C
where θ   is the water use efficiency of each region obtained from DEA (Equation 4); E refers to the regional GDP (CNY); C represents the total water consumption (m3). The ceiling value of the shadow price is E / C when θ = 1 .
Then, the economic values embodied in virtual water flows can be estimated as below:
E V W p q = S P q S P p × E p q
where E V W p q represents the potential economic value embodied in the virtual water flow from region p to   q ; S P q and S P p are the shadow price of water resources in region p to   q ; E p q refers to net flow of virtual water from region p to   q . Positive values of E V W indicate economic gains while negative values indicate economic losses.

2.5. Data Section

This work is focused on blue water, which includes surface and groundwater resources. Since there is increasing usage of reclaimed water and desalinated water in China’s water scarce north, future studies are recommended to include a variety of water sources.
The MRIO table in 2012 with 13 cities in the JingJinJi region (i.e., Beijing, Tianjin and 11 cities in Hebei province) and 31 sectors was obtained from the 2012 Nested Hebei Cities-Chinese Province MRIO [33]. A partial survey-based multiple-layer framework for MRIO table compilation of a Chinese province that distinguishes city-based regions was used in the previous study [33]. A nested Hebei-China city-level MRIO table was then compiled. Due to data limitation, this study adopted the same assumption as Zheng et al. [33], aggregating three energy-producing sectors, i.e. electricity, heating and water supply, and applying unified water intensity parameters for those three sectors. The water intensity differences of those three sectors are not expected to have significant impacts on the results in this study as they together only made up 4% of the total societal water consumption in 2012. However, future studies in greater detail are recommended upon necessary data becoming available.
The primary contribution of this work is to establish a methodological framework to evaluate virtual water trades’ impacts on economies using the concept of water’s shadow prices. This approach is applied in China’s water-scarce yet economically vibrant Jingjinji metropolitan region as an example, while the latest city-level input-output data in this region are from 2012.

3. Results

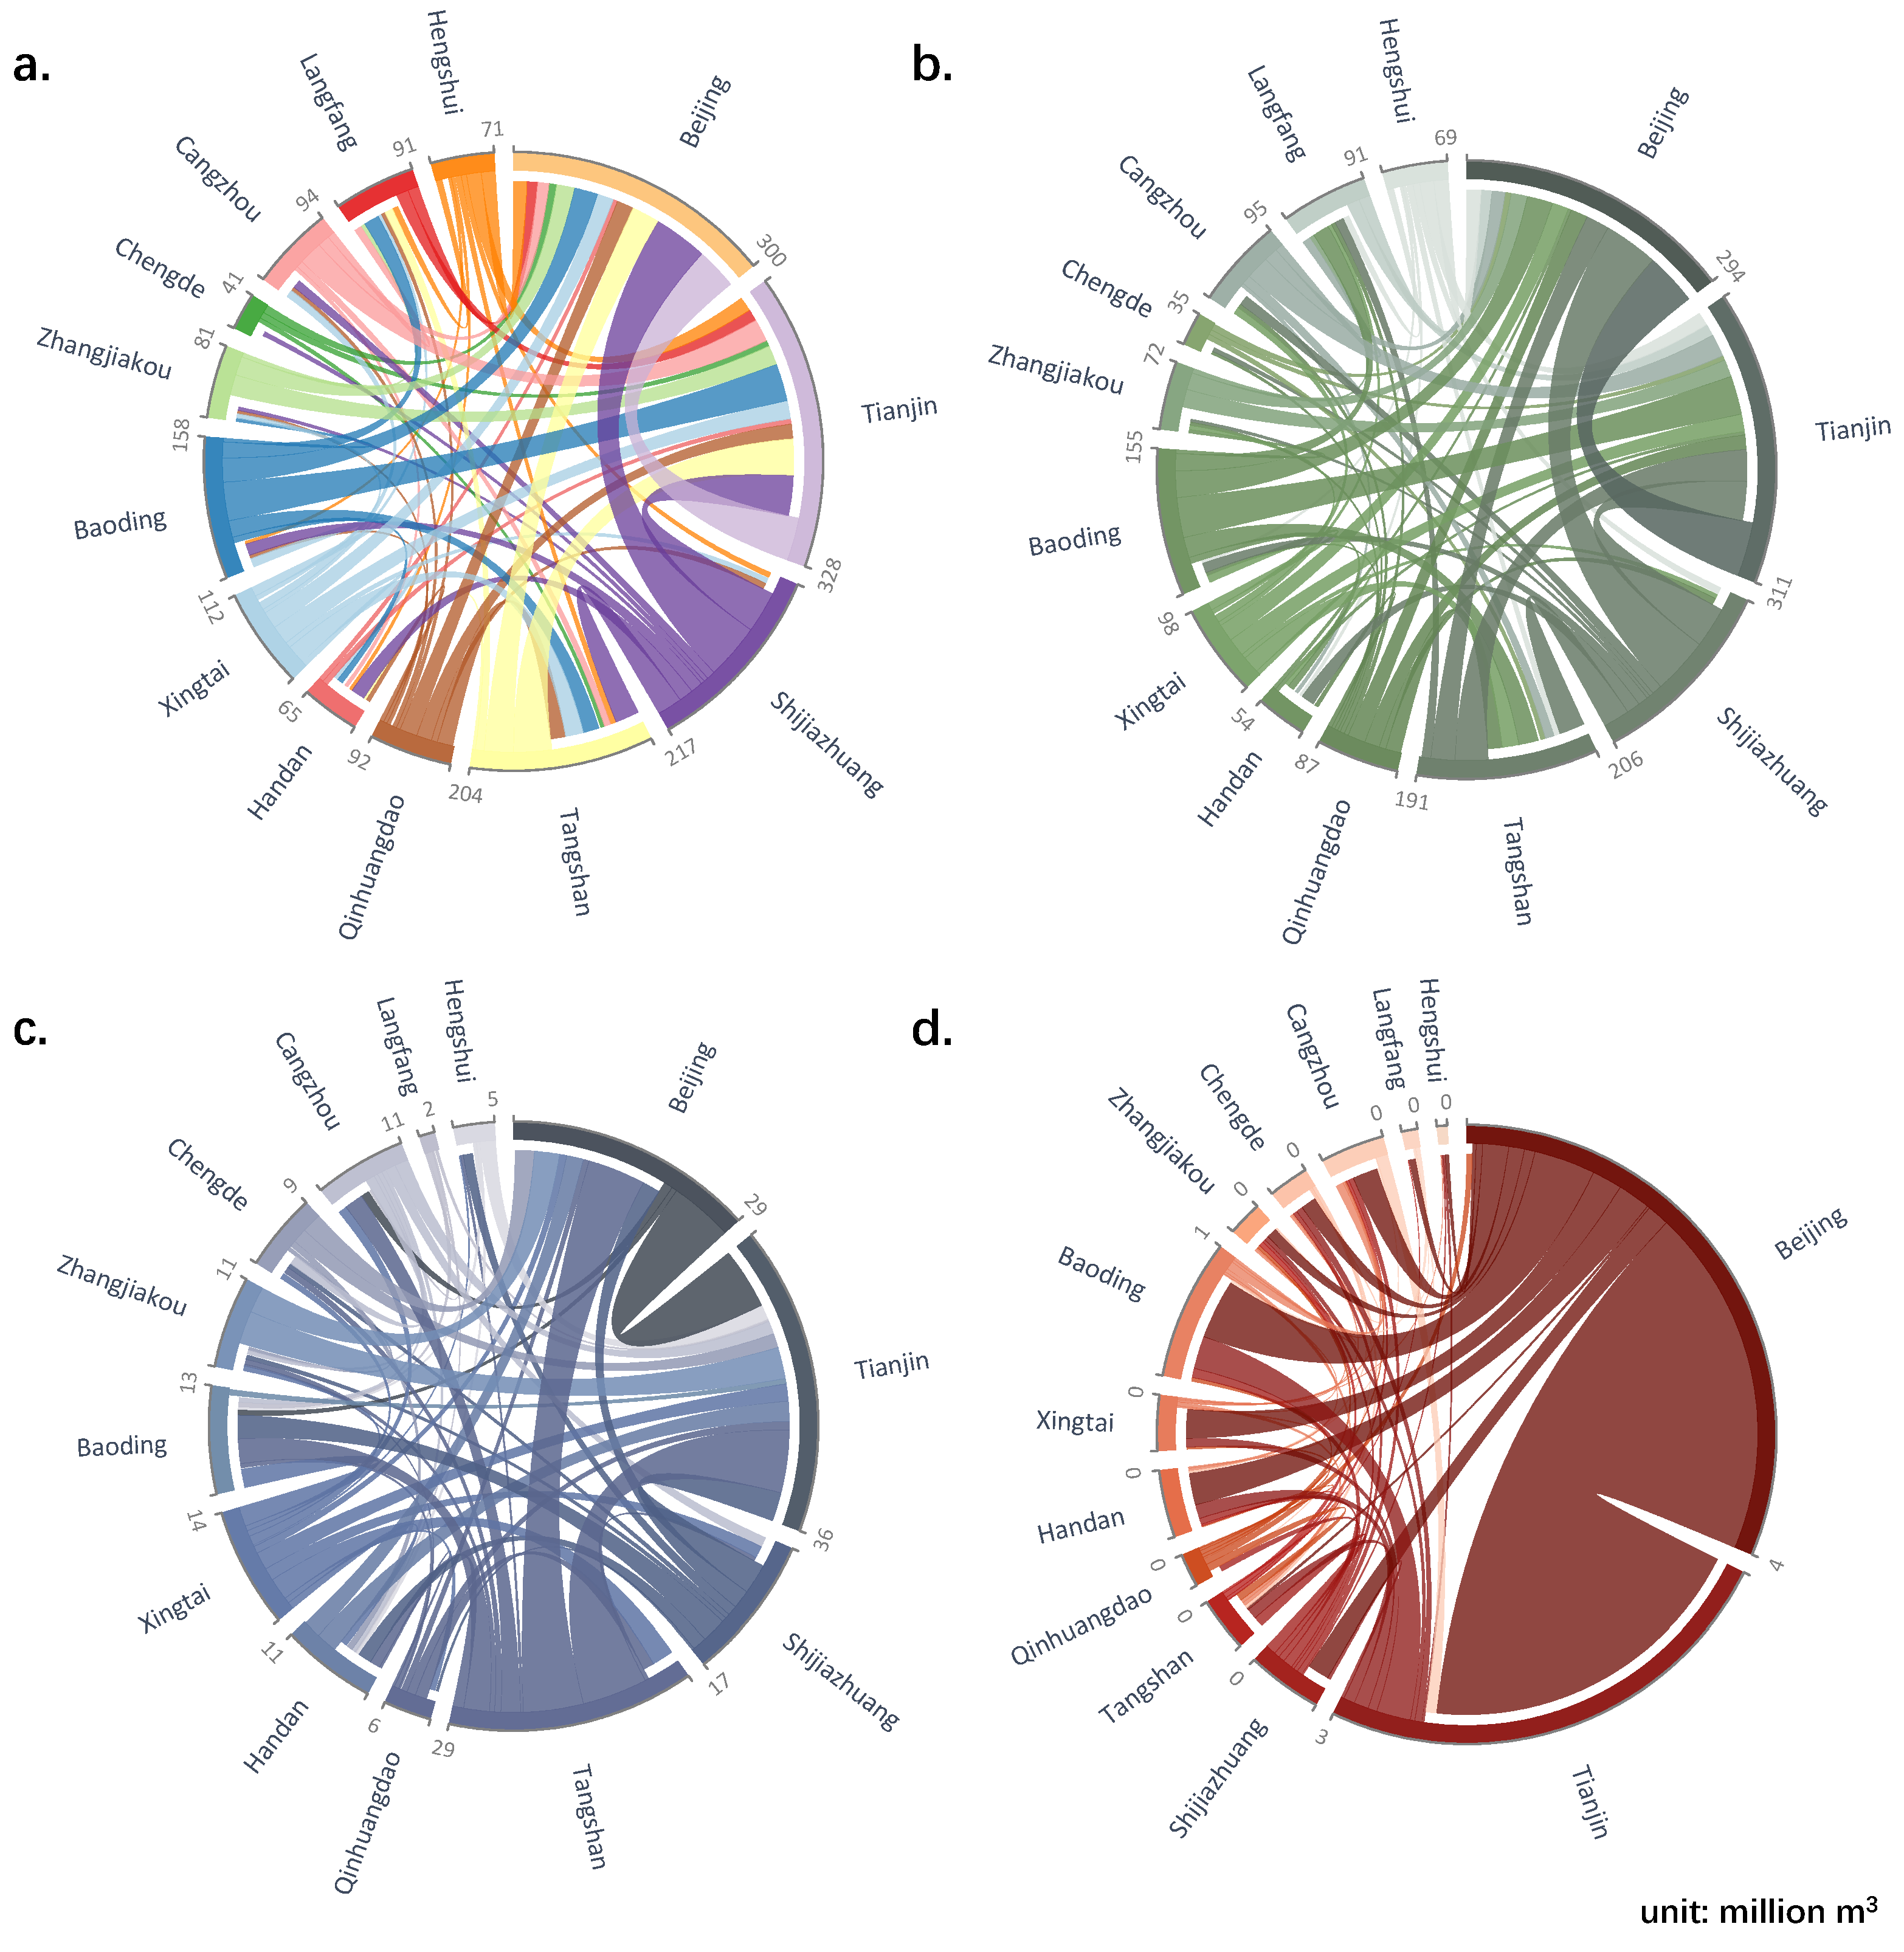
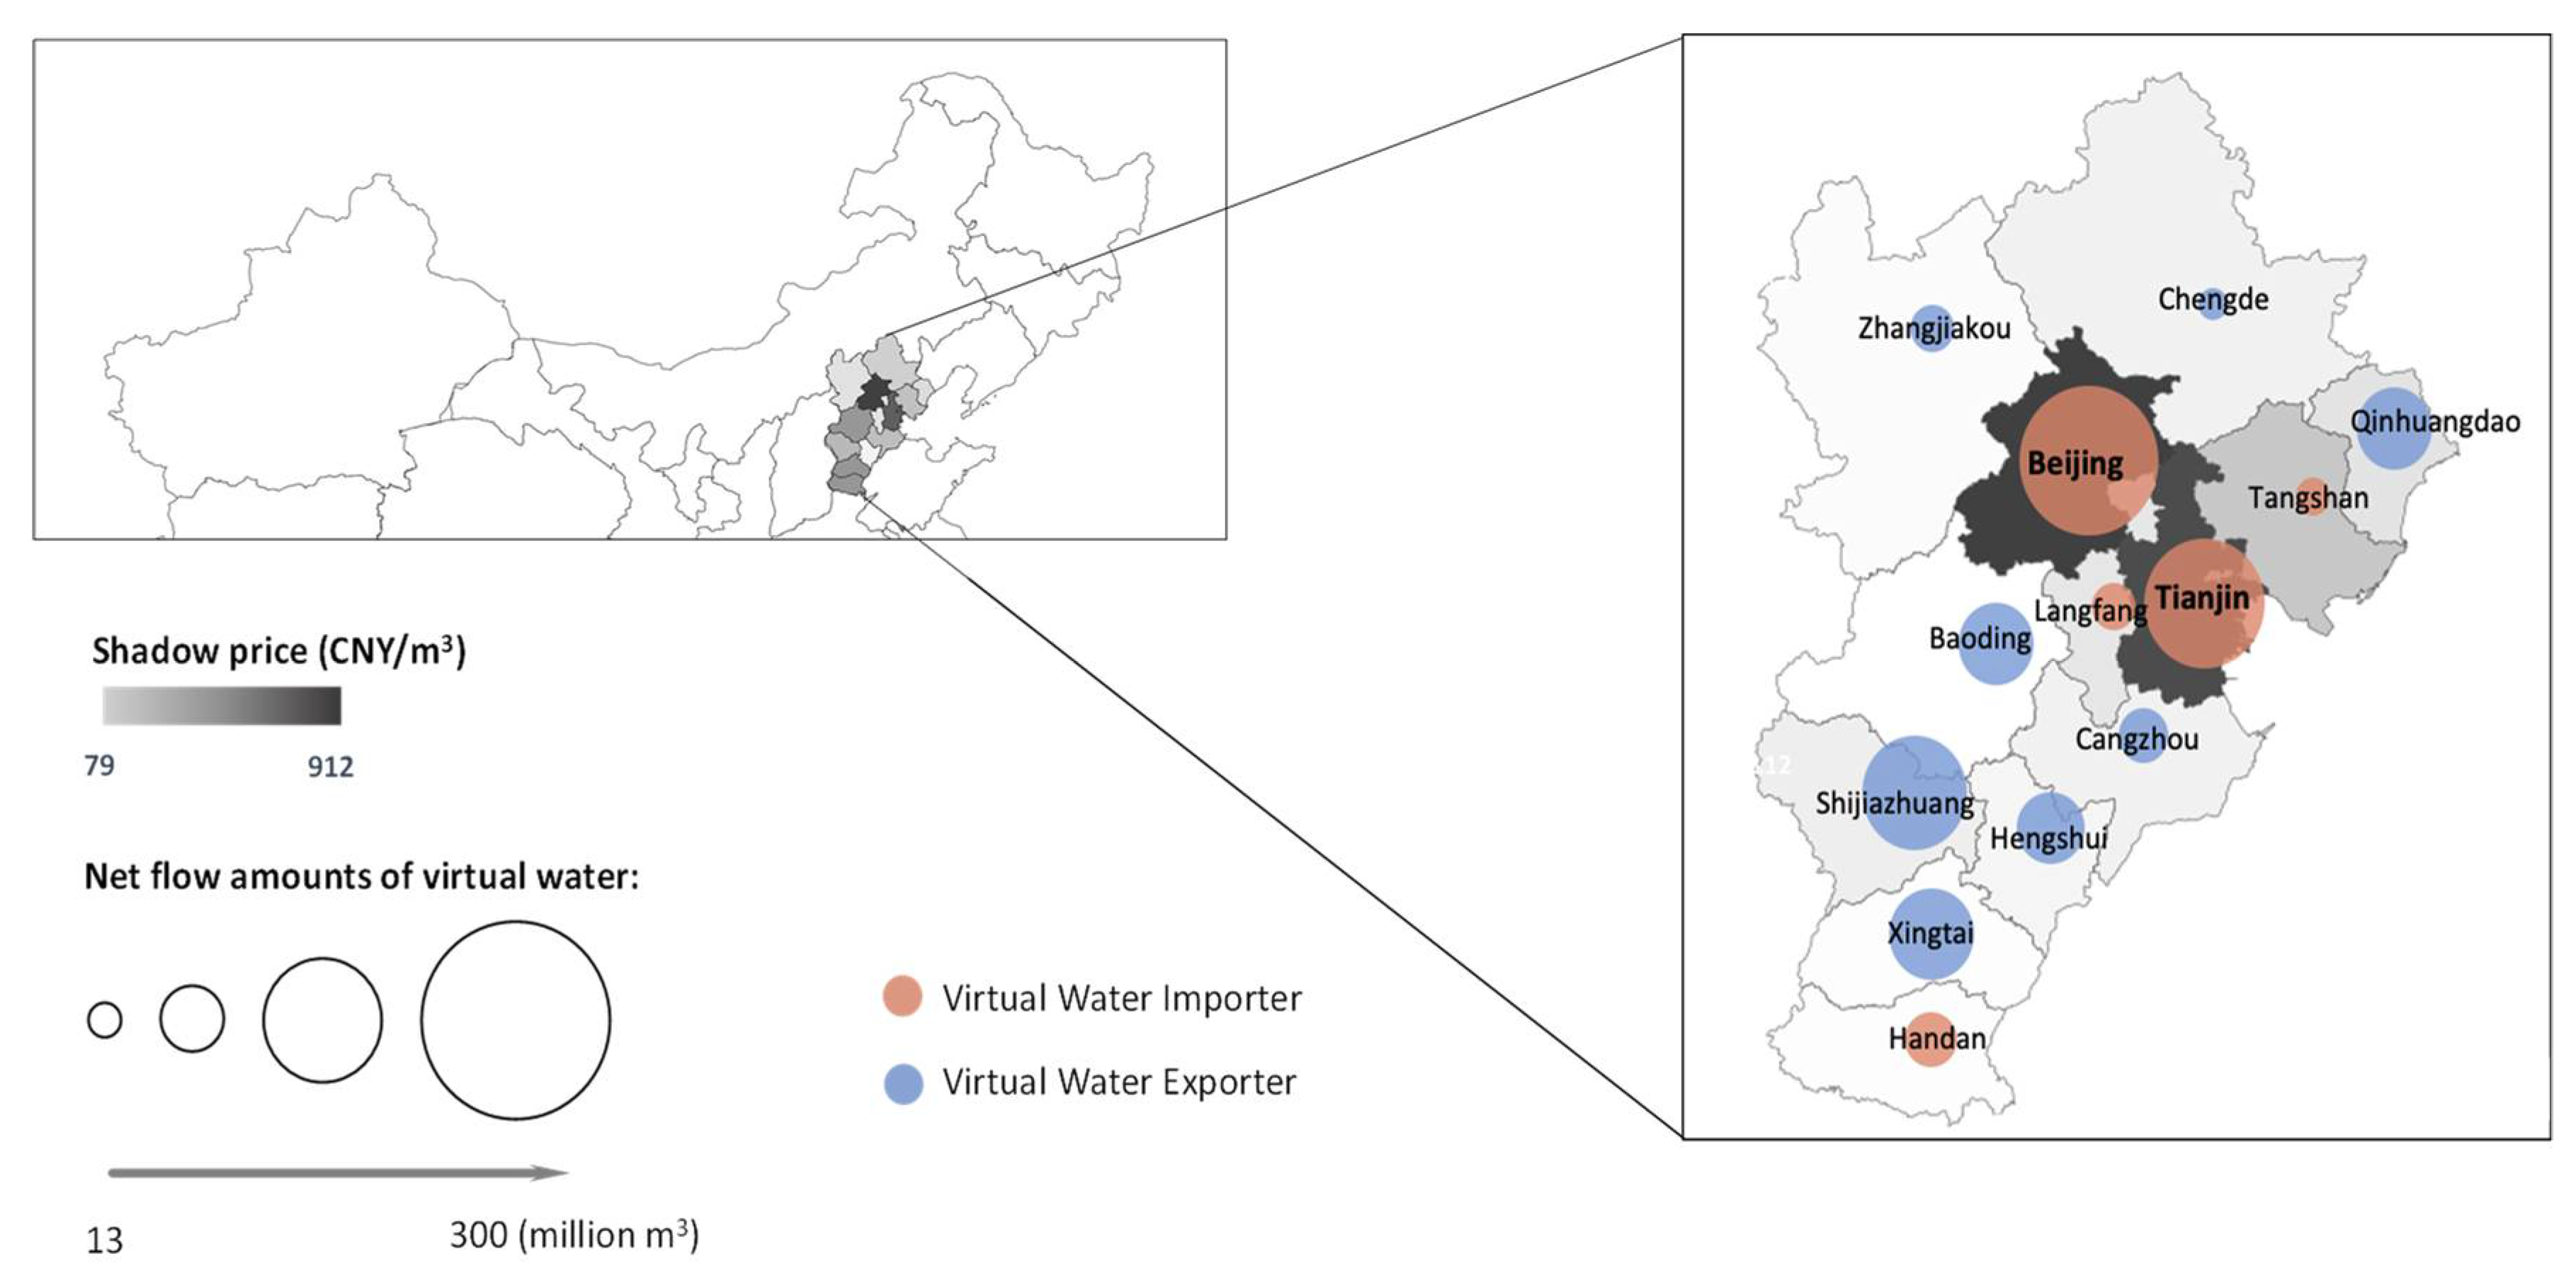
3.1. Net Virtual Water (VW) Flows within JingJinJi Region

Figure 1a demonstrates the virtual water flows among the 13 cities in the JingJinJi region. Among which, Beijing (300.48 million m3), Tianjin (226.92 million m3), Handan (41.05 million m3), Langfang (28.22 million m3), and Tangshan (18.12 million m3) are five net virtual water receivers, whereas Shijiazhuang was the largest virtual water exporter, exporting 173.29 million m3 virtual water in 2012. Figure 1b–d demonstrate respectively the virtual water flows of different sectors (Agriculture, Industry and Service) among the 13 cities. Shijiazhuang is also the largest agricultural virtual water exporter, exporting 163.11 million m3 embodied in agricultural products, whereas the largest two receivers were Beijing and Tianjin, importing 294.35 and 189.06 million m3 of agriculture-embodied virtual water. Tangshan was the largest virtual water exporter in terms of industrial sector, exporting 20.46 million m3. On the other hand, Tianjin was the largest virtual water receiver in the industrial sector (36.04 million m3) but has exported 0.20 million m3 in service sectors. Beijing contributed the most service-embodied virtual water (3.68 million m3).
The total virtual water flows among the 13 cities in the JingJinJi region amounted to 927 million m3 in 2012, among which agricultural sectors occupied 90 percent (879.32 million m3) while the industrial sector (96.61 million m3) and service sector (5.21 million m3) together made up 10 percent, which is unsurprising given the high water intensity of agricultural products.

3.2. Heterogeneity of Water Shadow Price among Cities

Being the largest virtual water importer, Beijing and Tianjin imported respectively 300.48 and 226.92 million m3 of virtual water from cities in Hebei as shown in Figure 2. At the same time, water resources in Beijing and Tianjin have the highest shadow prices at 912.21 and 831.86 CNY per m3, due to its much more developed social-economic conditions. Water’s shadow price in cities in Hebei ranges from 79.31 CNY per m3 in Baoding to 263.03 CNY per m3 in Tangshan. Although Handan has a low shadow price (86.30 CNY per m3) for water, it still imported over 41.05 million m3 of virtual water through trades in 2012, indicating inefficient virtual water flows.

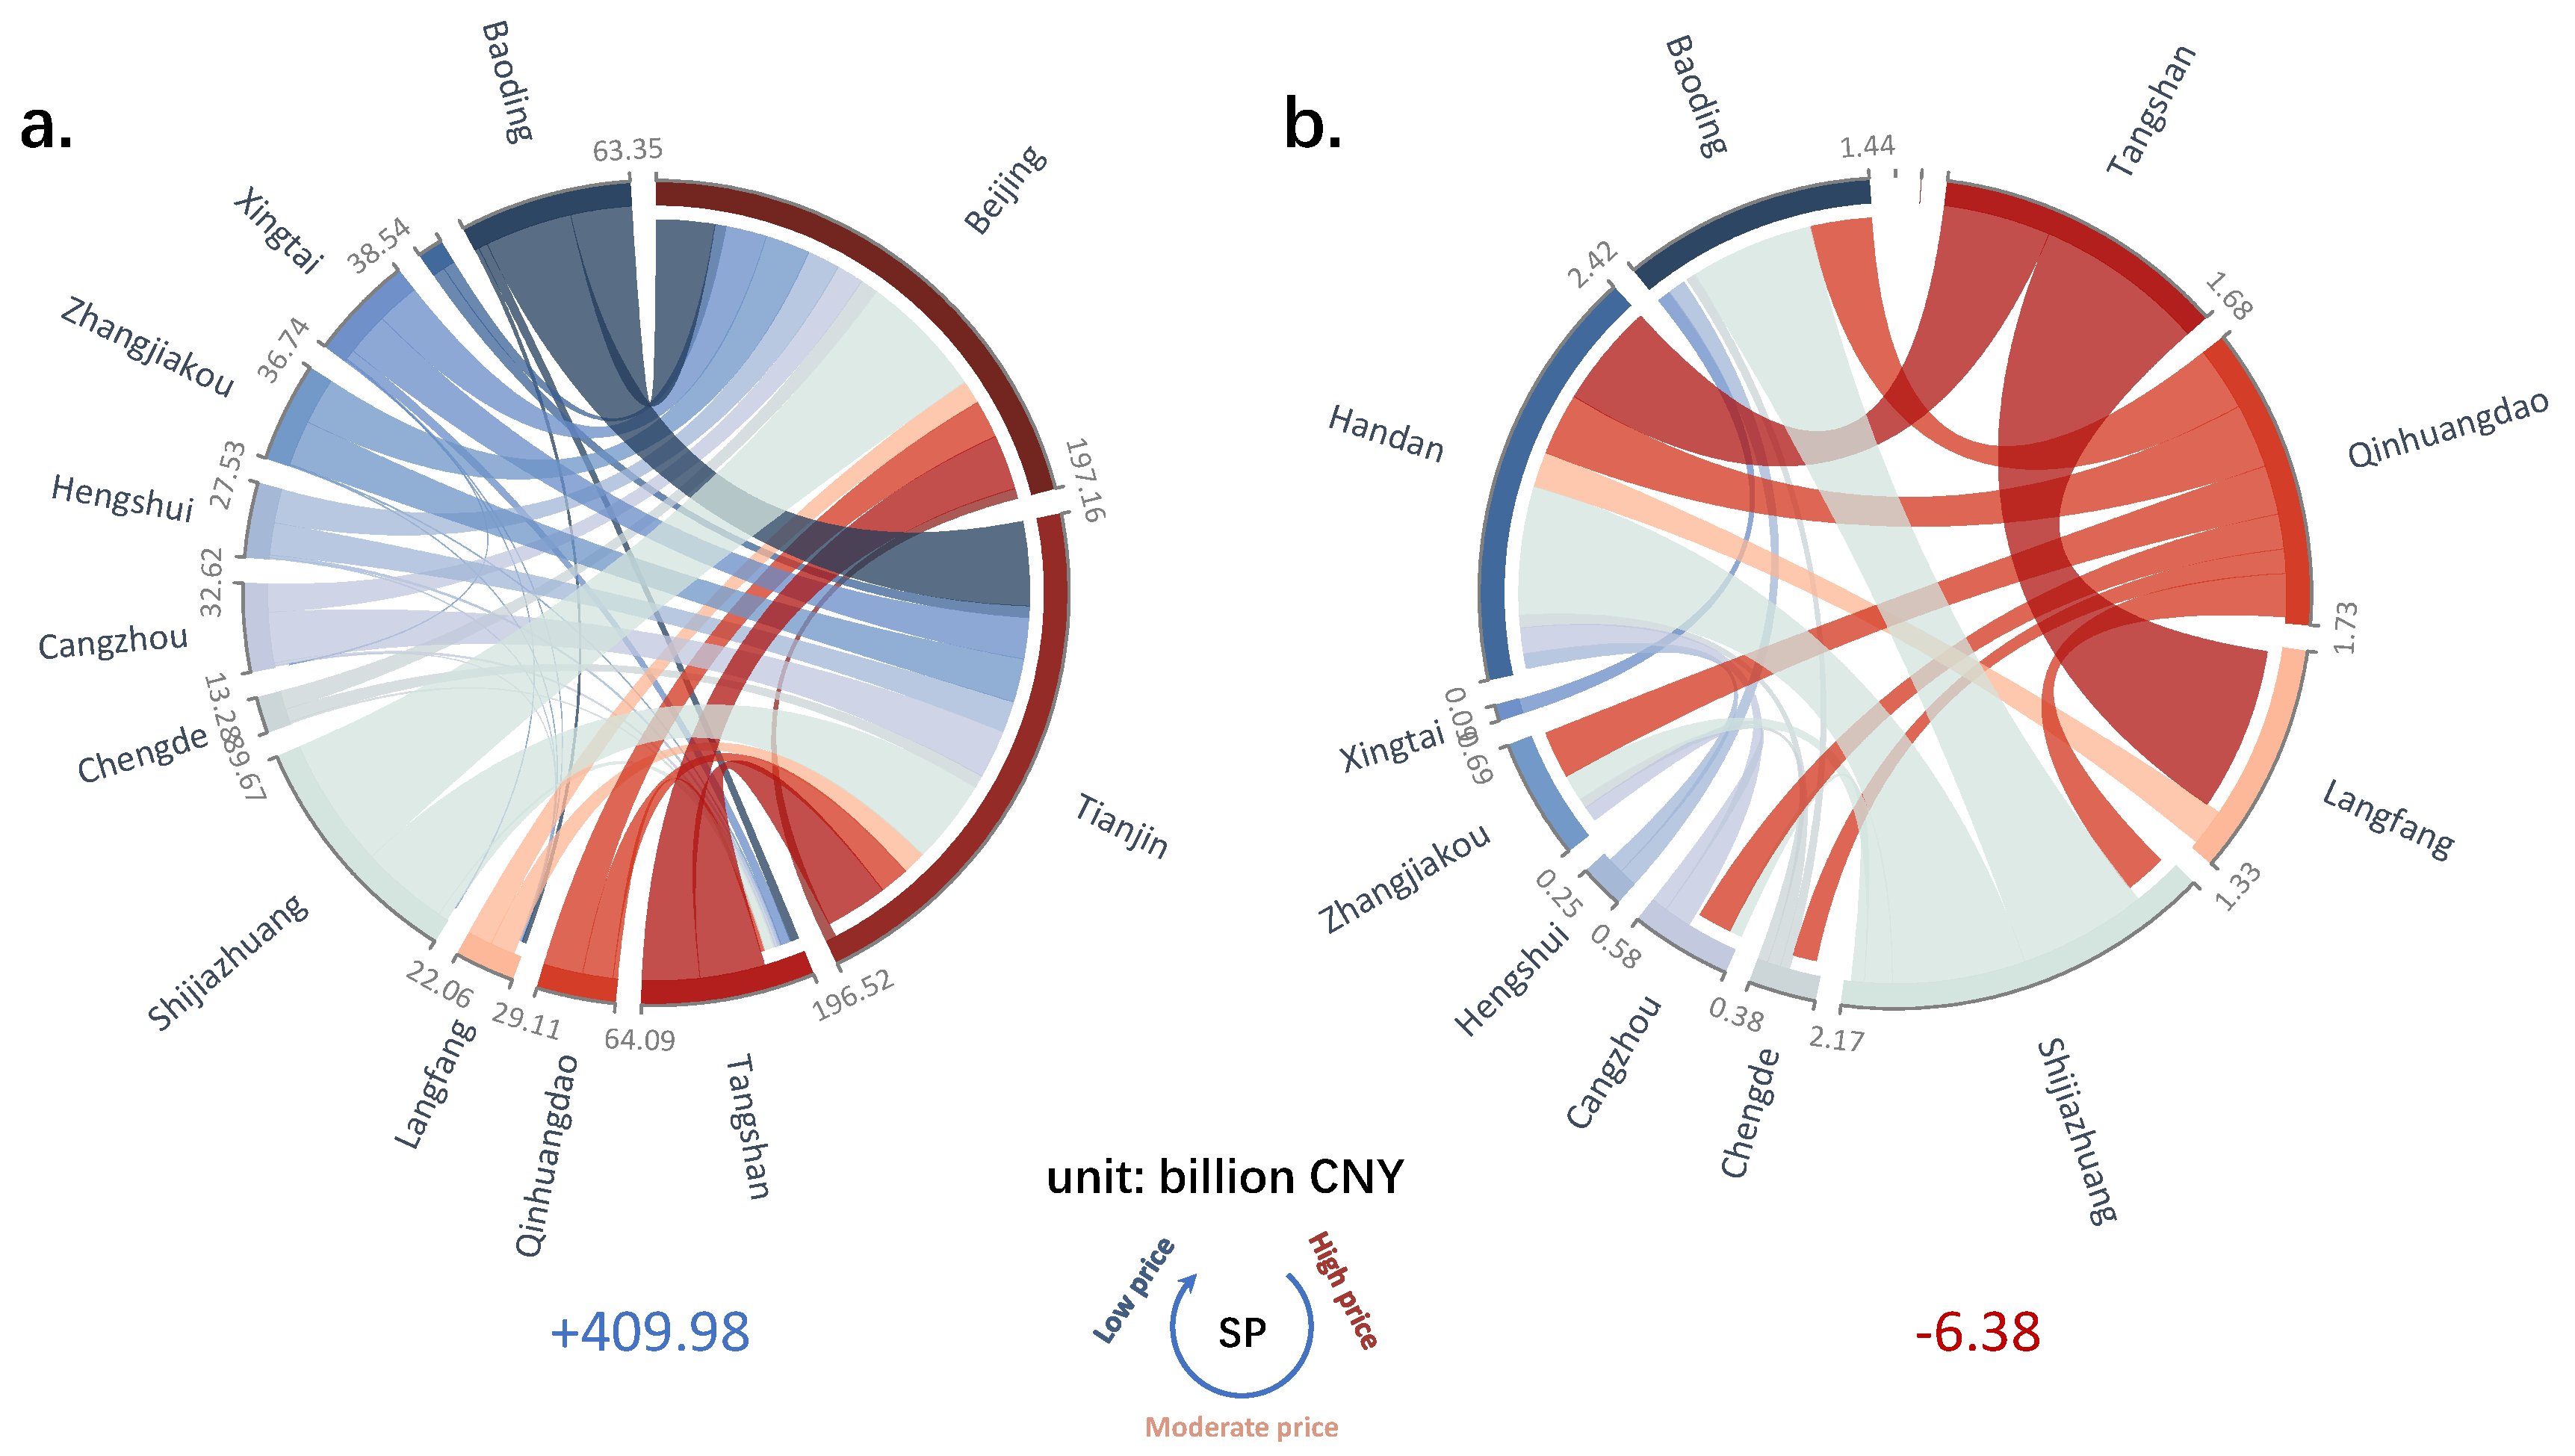
3.3. Potential Economic Benefits Induced by Intercity Virtual Water Flow

In total, 78 virtual water flows have been identified with 50, from cities with low water shadow price to cities with high water shadow price, generating economic gains and 28 generating economic losses as shown in Figure 3. In total, virtual water flows in the JingJinJi region have generated net economic gains of 403.62 billion CNY. The majority of the economic gains come from virtual water flows into Beijing and Tianjin, where the water’s shadow prices are significantly higher due to its high opportunity cost in the much more developed economic systems. Economic gains were primarily generated from virtual water flows to Beijing (197.16 billion CNY), accounting for 48 percent of the total economic gains (409.98 billion CNY). The top three economically beneficial virtual water flows are from Shijiazhuang to Beijing, from Shijiazhuang to Tianjin, and from Baoding to Tianjin, generating 51.06, 34.37 and 34.24 billion CNY economic gains respectively. In contrast, virtual water flows from cities with high water shadow price, such as Tangshan, to cities with relatively low water shadow price have incurred total economic losses of 6.38 billion CNY in 2012. For example, virtual water flows to Handan have incurred economic losses or 2.42 billion CNY, which is to say, in terms of water resource allocation, it is more economically viable for Handan to produce those services with internal water resources than to import services from other cities that consume their limited water resources that have relatively high shadow prices.

4. Discussion

4.1. Shadow Price of Water

Shadow price is often viewed as the ‘real’ or ‘true’ economic value of water, which represents the economic value that can be produced with one marginal unit of water input, under the optimal allocation of resources. It is therefore unsurprising that shadow prices of water in Beijing and Tianjin are much higher than that in other cities in the region since the high value-added service sectors are primarily located within these two cities while the relatively water-intensive but low value-added agricultural sectors are located in the other cities. Therefore, virtual water flows from the other 11 cities to Beijing and Tianjin are able to (i) save Beijing and Tianjin’s internal water resources for higher value-added activities; (ii) generate economic benefits in the virtual water exporting cities, and (iii) generate overall economic gains on the regional level. However, it should be noted that the determination of shadow prices is often difficult and static, not being able to reflect the changing social-economic contexts. With increasing water demands but finite water resources and thus increasing water scarcity levels, shadow water prices in those virtual water exporting cities are also growing and should be considered.

4.2. Considering Economic Impacts of Virtual Water Trades

Since water tariffs are often lower than the shadow prices of water, indicating water is not allocated at the economically optimal level, virtual flows of water may also incur economic losses and are therefore not economically viable, such as exporting virtual water from Shijiazhuang to Handan. Therefore, it would be more economic viable for Handan to consume agricultural products grown with local water resources than to import agricultural products from Shijiazhuang. Although it is understandable that the price of water is often not a key consideration nor determining factor in inter-city trades, government may consider increasing water tariffs to be as close as possible to water’s shadow prices to reflect the scarcity of water. Future economic sector layout should also consider the availability of water as an important determinant. However, it should be noted that the determination of water’s shadow price is often data demanding and evidence-driven, which is often lacking, especially in less developed regions. The calculation of shadow price also embeds many methodological uncertainties and therefore the application of shadow price in policy formulation should be made with caution.

4.3. Water’s Multiple Values beyond Economic Values

Even shadow price does not reflect the multiple values of water well beyond its economic uses, including environmental and cultural values for example. While Beijing and Tianjin’s continuous economic growth and social development will inevitably generate increasing water footprints beyond their administrative boundaries, the virtual water exporters in this region, i.e., the other 11 cities, are also facing different levels of water scarcity. Deteriorating water scarcity imposes increasing pressures on the environment, ecosystems, and cultural traditions, as well as inhabitants’ well beings that rely on water. However, those externalities are not reflected in the shadow price accounting, which does not mention the exiting water tariffs. Without considering those externalities, increasing virtual water trades create environmental and social injustice associated with water. It is therefore important to either include water’s multiple values into future economic analysis or to facilitate different types of compensation schemes, through fiscal transfer, technological cooperation, talent exchange and so on, to provide compensation from those virtual water importing cities to the exporting ones to compensate for the environmental and social losses that are not accounted for in the market prices.

5. Conclusions

This study constructs an economic evaluation model combining a multi-region Input-Output model and DEA to evaluate the economic impacts of virtual water trades among the 13 cities in the JingJinJi region. A Multi-Regional Input-Output model is first used to quantify the virtual water trades, both inflows and outflows, among the 13 cities within the JingJinJi region. It was found that the total virtual water trades among the 13 cities amounted to 927 million m3 in 2012, among which agricultural sectors occupied 90 percent while the industrial sector and service sector together made up the remaining 10 percent. While Beijing and Tianjin are the main virtual water importers, importing respectively 300.48 and 226.92 million m3 in 2012, Shijiazhuang was the largest virtual water exporter, exporting 173.29 million m3 virtual water in the same year. A DEA was then conducted to evaluate the allocation efficiency of water resources in order to estimate the shadow prices of water in the 13 cities. As the largest virtual water importers, Beijing and Tianjin have the highest shadow prices at 912.21 and 831.86 CNY per m3. It is estimated that, in 2012, virtual water trades in the JingJinJi region generated net economic gains of 403.62 billion CNY.

Author Contributions

Conceptualization, L.C.; methodology, S.L.; software, S.L.; formal analysis, A.H.; investigation, X.L.; writing—original draft preparation, X.L.; writing—review and editing, Y.D. and L.C.; visualization, A.H. and L.C.; supervision, L.C. All authors have read and agreed to the published version of the manuscript.

Funding

This work was supported by Beijing Natural Science Foundation (9204027).

Institutional Review Board Statement

Not applicable.

Informed Consent Statement

Not applicable.

Data Availability Statement

The data presented in this study are available on request from the corresponding author.

Conflicts of Interest

The authors declare no conflict of interest.

References

  1. United Nations Development Programme. Human Development Report 2006 beyond Scarcity: Power, Poverty and the Global Water Crisis; United Nations: New York, NY, USA, 2006. [Google Scholar]
  2. Berger, M.; Campos, J.; Carolli, M.; Dantas, I.; Forin, S.; Kosatica, E.; Kramer, A.; Mikosch, N.; Nouri, H.; Schlattmann, A.; et al. Advancing the Water Footprint into an Instrument to Support Achieving the SDGs—Recommendations from the “Water as a Global Resources” Research Initiative (GRoW). Water Resour. Manag. 2021, 35, 1291–1298. [Google Scholar] [CrossRef]
  3. National Bureau of Statistics of China. Statistical Yearbook of China; National Bureau of Statistics of China: Beijing, China, 2020.
  4. Goes, B.J.M.; Howarth, S.E.; Wardlaw, R.B.; Hancock, I.R.; Parajuli, U.N. Integrated Water Resources Management in an Insecure River Basin: A Case Study of Helmand River Basin, Afghanistan. Int. J. Water Resour. Dev. 2016, 32, 3–25. [Google Scholar] [CrossRef]
  5. Wang, H.; Mei, C.; Liu, J.; Shao, W. A New Strategy for Integrated Urban Water Management in China: Sponge City. Sci. China Technol. Sci. 2018, 61, 317–329. [Google Scholar] [CrossRef]
  6. The Ministry of Water Resources of China. Water Resources Bulletin; The Ministry of Water Resources of China: Beijing, China, 2018.
  7. Huang, Z.; Liu, J.; Mei, C.; Wang, H.; Shao, W.; Li, Z. Analysis of Driving Forces of Water Demand in Jing-Jin-Ji District in Recent Years Based on Water Demand Field Theory. Sci. China Technol. Sci. 2020, 63, 2593. [Google Scholar] [CrossRef]
  8. Ye, Q.; Li, Y.; Zhuo, L.; Zhang, W.; Xiong, W.; Wang, C.; Wang, P. Optimal allocation of physical water resources integrated with virtual water trade in water scarce regions: A case study for Beijing, China. Water Res. 2018, 129, 264–276. [Google Scholar] [CrossRef] [PubMed]
  9. Zhao, D.; Tang, Y.; Liu, J.; Tillotson, M.R. Water Footprint of Jing-Jin-Ji Urban Agglomeration in China. J. Clean. Prod. 2017, 167, 919–928. [Google Scholar] [CrossRef]
  10. Zhang, C.; Anadon, L.D. A multi-regional input-output analysis of domestic virtual water trade and provincial water footprint in China. Ecol. Econ. 2014, 100, 159–172. [Google Scholar]
  11. Allan, J.A. Policy Responses to the Closure of Water Resources: Regional and Global Issue, in Water Policy: Allocation and Management in Practice; Howsam, P., Carter, R.C., Eds.; Chapman and Hall: London, UK, 1996; pp. 3–12. [Google Scholar]
  12. Hoekstra, A.; Hung, P. Virtual Water Trade: A Quantification of Virtual Water Flows between Nations in Relation to International Crop Trade Value of Water Research; Report Series No. 11; UNESCO-IHE Institute for Water Education: Delft, The Netherlands, 2002. [Google Scholar]
  13. Hoekstra, A.Y.; Chapagain, A.K. Water footprints of nations: Water use by people as a function of their consumption pattern. Water Resour. Manag. 2007, 21, 35–48. [Google Scholar] [CrossRef]
  14. Sojamo, S.; Keulertz, M.; Warner, J.; Allan, J. A Virtual Water Hegemony: The Role of Agribusiness in Global Water Governance. Water Int. 2012, 37, 169–182. [Google Scholar] [CrossRef]
  15. Keulertz, M.; Sowers, J.; Woertz, E.; Mohtar, R. The Water-Energy-Food Nexus in Arid Regions: The Politics of Problemsheds. In Oxford Handbook of Water Politics and Policy; Conca, K., Weinthal, E., Eds.; Oxford University Press: Oxford, UK, 2016. [Google Scholar]
  16. Hussein, H.; Greco, F. How will the COVID-19 pandemic impact food security and virtual water "trade"? Future Food J. Food Agric. Society 2020, 8, 1–2. [Google Scholar]
  17. Zhao, X.; Liu, J.; Liu, Q.; Tillotson, M.R.; Guan, D.; Hubacek, K. Physical and virtual water transfers for regional water stress alleviation in China. Proc. Natl. Acad. Sci. USA 2015, 112, 1031–1035. [Google Scholar] [CrossRef] [PubMed] [Green Version]
  18. Cai, B.; Zhang, W.; Hubacek, K.; Feng, K.; Li, Z.; Liu, Y.; Liu, Y. Drivers of virtual water flows on regional water scarcity in China. J. Clean. Prod. 2019, 207, 1112–1122. [Google Scholar] [CrossRef]
  19. Wichelns, D. The Policy Relevance of Virtual Water can be Enhanced by Considering Comparative Advantages. Agric. Water Manag. 2004, 66, 49–63. [Google Scholar] [CrossRef]
  20. Statistical Yearbook of China. 2018. Available online: http://www.stats.gov.cn/tjsj/ndsj/2018/indexch.htm (accessed on 22 January 2021).
  21. He, J.; Chen, X.; Shi, Y.; Li, A. Dynamic Computable General Equilibrium Model and Sensitivity Analysis for Shadow Price of Water Resource in China. Water Resour. Manag. 2007, 21, 1517–1533. [Google Scholar] [CrossRef]
  22. Liu, X.; Chen, X.; Wang, S. Evaluating and Predicting Shadow Prices of Water Resources in China and its Nine Major River Basins. Water Resour. Manag. 2009, 23, 1467–1478. [Google Scholar] [CrossRef]
  23. Bierkens, M.F.P.; Reinhard, S.; de Bruijn, J.A.; Veninga, W.; Wada, Y. The Shadow Price of Irrigation Water in Major Groundwater-Depleting Countries. Water Resour. Res. 2019, 55, 4266–4287. [Google Scholar] [CrossRef] [Green Version]
  24. Charnes, A.; Cooper, W.W.; Rhodes, E. Measuring the Efficiency of Decision-making Units. Eur. J. Operat. Res. 1978, 2, 429–444. [Google Scholar] [CrossRef]
  25. Garcia, A.F.; Shively, E.G. How might Shadow Price Restrictions Reduce Technical Efficiency? Evidence from a Restricted DEA Analysis of Coffee Farms in Vietnam. J. Agric. Econ. 2011, 62, 47–58. [Google Scholar]
  26. Paradi, J.C.; Fai, K.T. The Examination of Pseudo-Allocative and Pseudo-overall Efficiencies in DEA using Shadow Prices. J. Product. Anal. 2012, 37, 115–123. [Google Scholar] [CrossRef]
  27. Liu, K.-D.; Yang, G.-L.; Yang, D.-G. Investigating Industrial Water-use Efficiency in Mainland China: An Improved SBM-DEA Model. J. Environ. Manag. 2020, 270, 110859. [Google Scholar] [CrossRef] [PubMed]
  28. Lu, W.; Liu, W.; Hou, M.; Deng, Y.; Deng, Y.; Zhou, B.; Zhao, K. Spatial–Temporal Evolution Characteristics and Influencing Factors of Agricultural Water use Efficiency in Northwest China—Based on a Super-DEA Model and a Spatial Panel Econometric Model. Water 2021, 13, 632. [Google Scholar] [CrossRef]
  29. Førsund, F.R. Economic Interpretations of DEA. Socio-Econ. Plan. Sci. 2018, 61, 9–15. [Google Scholar] [CrossRef]
  30. Leontief, W.W. Structure of American Economy, 1919–1929: An Empirical Application of Equilibrium Analysis; Harvard University Press: Cambridge, MA, USA, 1941. [Google Scholar]
  31. Liu, A.; Han, A.; Chai, L. Life Cycle Blue and Grey Water in the Supply Chain of China’s Apparel Manufacturing. Processes 2021, 9, 1212. [Google Scholar] [CrossRef]
  32. Chai, L.; Han, Z.; Liang, Y.; Su, Y.; Huang, G. Understanding the Blue Water Footprint of Households in China from a Perspective of Consumption Expenditure. J. Clean. Prod. 2020, 262, 121321. [Google Scholar] [CrossRef]
  33. Zheng, H.; Meng, J.; Mi, Z.; Song, M.; Shan, Y.; Ou, J.; Guan, D. Linking city-level input–output Table to Urban Energy Footprint: Construction Framework and Application. J. Ind. Ecol. 2019, 23, 781–795. [Google Scholar] [CrossRef]
  34. Ministry of Ecology and Environment of China. Annual Statistic Report on Environment in China; Ministry of Ecology and Environment of China: Beijing, China, 2013.
  35. The Ministry of Water Resources of China. Water Resources Bulletin; The Ministry of Water Resources of China: Beijing, China, 2013.
  36. Colby, B.G. Estimating the Value of Water in Alternative Uses; Easter, W.K., Renwick, E.M., Eds.; Routledge: Abingdon, UK, 2004. [Google Scholar]
  37. Kao, C. Efficiency Decomposition in Network Data Envelopment Analysis: A Relational Model. Eur. J. Oper. Res. 2009, 192, 949–962. [Google Scholar] [CrossRef]
  38. National Bureau of Statistics of China. Statistical Yearbook of China; National Bureau of Statistics of China: Beijing, China, 2013.
  39. Hebei Provincial Bureau of Statistics. Hebei Economic Yearbook; Hebei Provincial Bureau of Statistics: Shijiazhuang, China, 2013.
  40. Hellegers, P.; Davidson, B. Determining the Disaggregated Economic Value of Irrigation Water in the Musi Sub-Basin in India. Agric. Water Manag. 2010, 97, 933–938. [Google Scholar] [CrossRef]
  41. Berbel, J.; Mesa-Jurado, M.A.; Pistón, J.M. Value of Irrigation Water in Guadalquivir Basin (Spain) by Residual Value Method. Water Resour. Manag. 2011, 25, 1565–1579. [Google Scholar] [CrossRef]
  42. Wang, W.; Xie, H.; Zhang, N.; Xiang, D. Sustainable Water use and Water Shadow Price in China’s Urban Industry. Resour. Conserv. Recycl. 2018, 128, 489–498. [Google Scholar] [CrossRef]
Figure 1. Net virtual water flows in JingJinJi region. (a) Net virtual water flows among different cities; (b) net virtual water flows of the agricultural sector; (c) net virtual water flows of the industrial sector; (d) net virtual water flows of the service sector.
Water 13 03140 g001
Figure 2. The net virtual water imports and water shadow prices of JingJinJi region. The background color indicates the shadow prices of JingJinJi region, and a darker color shows a higher shadow price. The bubbles indicate the net virtual water flows, and the red color refers to a net import while the bule color refers to a net export.
Water 13 03140 g002
Figure 3. Virtual water flows with net economic gains (a) and net economic losses (b). The order of the provinces is clockwise, starting from Beijing, according to shadow price (from high to low). A red color indicates a high shadow price while a blue color indicates a low shadow price.
Water 13 03140 g003
Publisher’s Note: MDPI stays neutral with regard to jurisdictional claims in published maps and institutional affiliations.

