Article

Effects of Dynamical Change in Water Level on Local Scouring around Bridge Piers Based on In-Situ Experiments

1
Graduate School of Engineering, Kagawa University, 2217-20 Hayashi-cho, Takamatsu 761-0396, Kagawa, Japan
2
Faculty of Engineering and Design, Kagawa University, 2217-20 Hayashi-cho, Takamatsu 761-0396, Kagawa, Japan
*
Author to whom correspondence should be addressed.
Water 2021, 13(21), 3015; https://doi.org/10.3390/w13213015
Submission received: 25 September 2021 / Revised: 21 October 2021 / Accepted: 25 October 2021 / Published: 27 October 2021
(This article belongs to the Section Water Erosion and Sediment Transport)

Abstract

:
To evaluate the stability of bridge piers affected by the local scouring, the existing formulas for estimating the maximum local scour depth have been developed based on the results of experiments conducted under a constant water level. However, the applicability of these formulas to the cases where the water level rises and falls, such as a water level change in a real river, is not clear. In this study, water flow experiments were conducted on cylindrical and oval bridge pier models to investigate the effect of iterated water level change on the progression of local scour around piers. Results of experiments with cylindrical and oval pier showed that the local scour depth and length increased by an iterated action of the water level change; however, these values converged after the number of iterated actions reached a certain time. The local scour length at upstream of the bridge pier was approximately 1.8 times larger than the theoretical value, which was calculated through the local scour depth and angle of repose in water. The local scour length is an important parameter for defining the streambed protection zone, which is one of the measures against local scour, and we showed that the streambed protection zone needs to be defined more widely.

1. Introduction

Recently, damage to bridge piers due to local scouring and the resulting bridge failures have become frequent in several parts of Japan, as one of the most severe heavy rain disasters [1]. Local scouring damage is caused by local erosion of the ground around the bridge piers due to the swelling of the river during heavy rains, which causes sediment to flow out and, eventually, leads to the tilting or sinking of the bridge piers. This damage can disrupt the transportation network and affect the daily lives of people in several ways. In particular, traditional piers with shallow embedded depths and direct foundations are often damaged by local scouring. Thus, it is necessary to monitor the stability and soundness of the piers foundation affected by local scouring.
The progression of the local scouring around bridge piers is influenced by various hydraulic factors such as the shape of the pier, average flow velocity of the river, and riverbed material, as well as topographical and geological factors. Previously, several researchers have quantitatively evaluated the influences of the aforementioned factors on the progression of the local scouring around bridge piers [2,3,4,5,6,7,8,9,10], and a prediction equation for the maximum local scour depth was proposed and used for the maintenance of pier foundations against local scouring. For example, Lauresen [2] and Trapore [3] proposed the formula for evaluating maximum scour depth using river water level and pier width based on the experimental results. And, in recent years, Cehng et al. [8] proposed the pier hydraulic radius as an index that evaluated the maximum local scour depth, based on the observation results of dimensional fluctuations of the horseshoe vortex formed upstream of the pier. They showed that the index is effective in quantifying the combined effect of pier width and river water level on local scouring during low and high flow conditions in which the ratio of water level to pier width (h/b) is less than 1 or more than 1. Most of these studies were conducted by continuously maintaining the water level until the local scouring pits and surrounding areas reached an equilibrium state under a fixed water level. On the other hand, it can be easily imagined that the river water level fluctuates throughout the year depending on the rainfall situation in an actual river. In other words, the water level of a river iteratively rises and falls depending on rainfall conditions, and the water level history of the river is considered as an important factor affecting the progress of local scouring around bridge piers. There are some studies focusing on live-bed scour [11,12], however, only few studies considered the water level history of rivers that is affected by the iterative rise and fall of river levels. Therefore, to develop a rational disaster prevention plan, it is necessary to quantitatively evaluate the effect of the river water level history on the progression of local scouring around bridge piers to assess the risk of resulting damage to existing structures.
In this study, water flow experiments were conducted using cylindrical and oval bridge pier models to reproduce the water level history by iteratively raising and lowering the water flow rate to evaluate its effect on the progression of local scouring. The remainder of this paper is structured as follows. Section 1 presents experimental conditions and cases. Section 2 presents an effect of dynamical change in water level on the local scouring progress and maximum local scour depth. Section 3 presents an effect of dynamical change in water level and pier shape on the local scour length. Section 4 presents an effect of dynamical change in water level on the cross-section of the local scour hole. The final section presents conclusions.

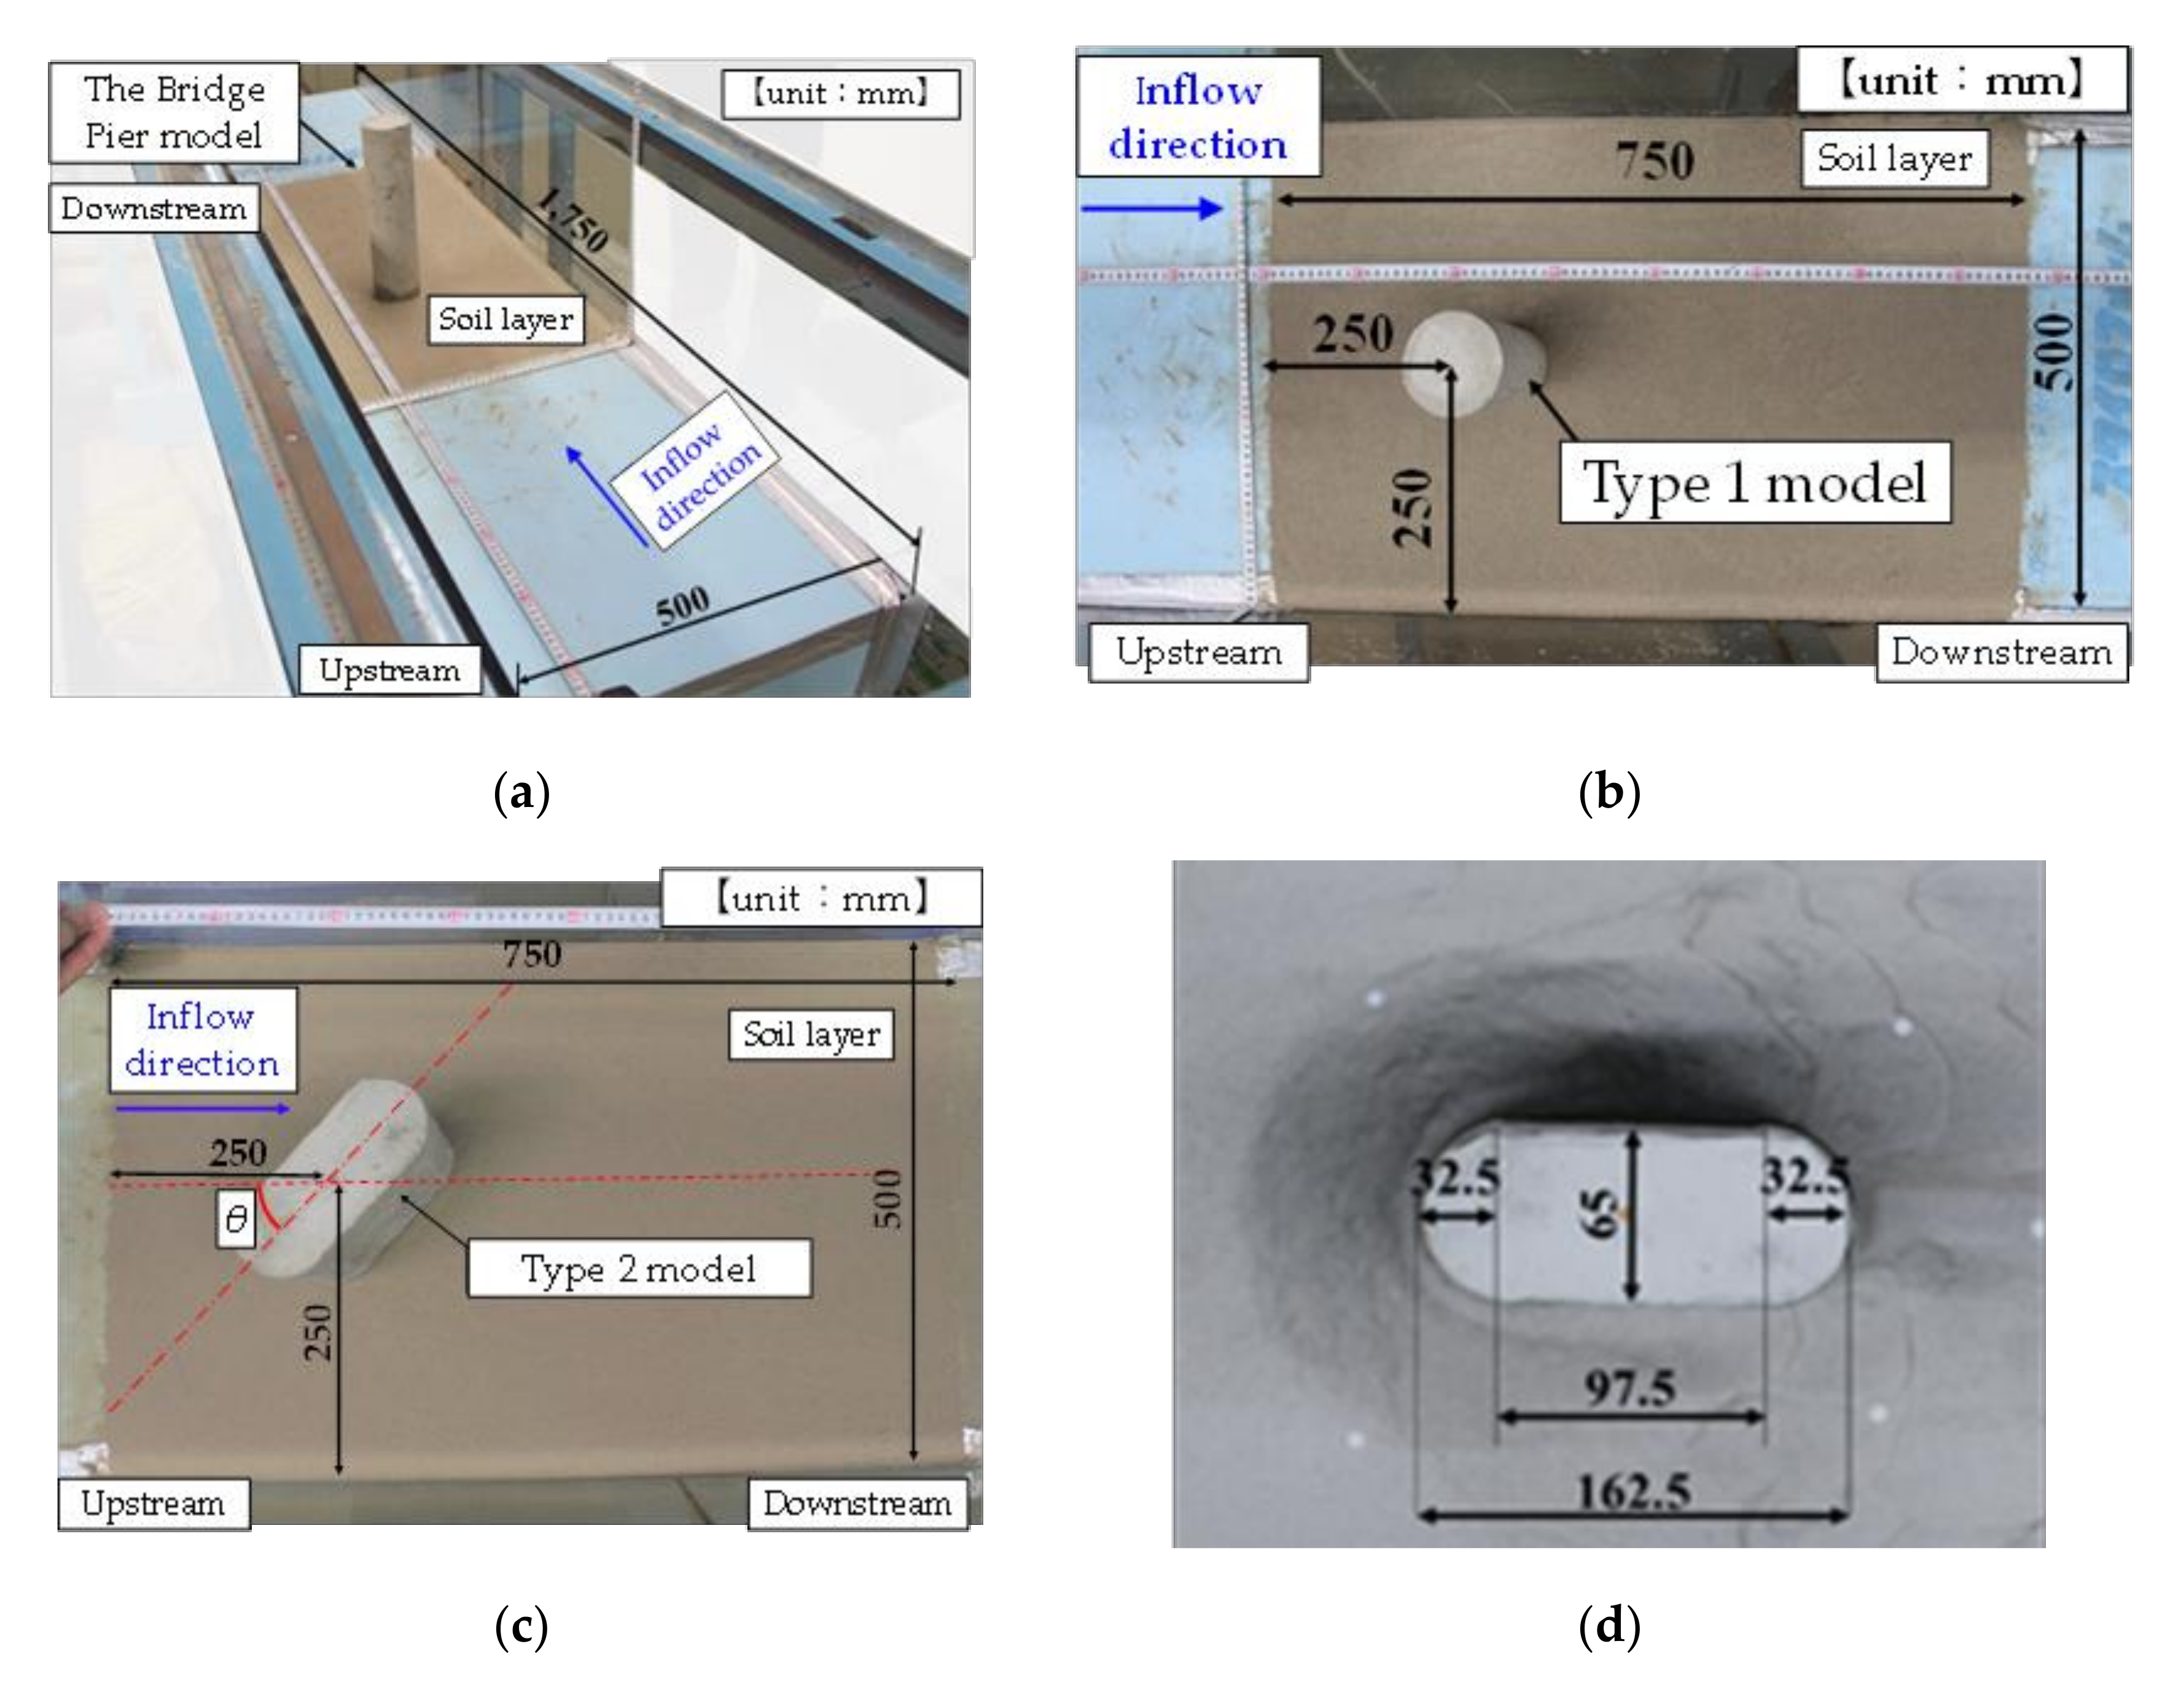
2. Experimental Setup

2.1. Experimental Conditions

Figure 1 presents an overview of the experiment. In this study, an open channel with a width and length of 500 mm and 15,500 mm, respectively, was employed. An experimental channel with a length of 1750 mm, located at 12,000 mm from open channel inlet, was constructed. The channel was raised by 180 mm using a 150 mm-high H-shaped steel and 30 mm-thick extruded polystyrene foam insulation. Further, a soil layer 500 mm wide × 750 mm long × 180 mm deep was prepared in the center of the channel. The soil layer was compacted by spreading No. 7 silica sand which D50 is 0.11 mm. The channel slope of the open channel was set as 0.00125. A cylindrical specimen with dimensions 65 mm diameter × 450 mm height (Type 1) and a round nose and tail rectangular specimen with a height of 450 mm (Type 2) were fabricated using mortar, assuming a scale of 1/40 of the actual structure. In Japanese Railway Bridges, piers with the same shape as Type 2, with a round nose and tail, are often constructed. As Type 2, used in this experiment, is the shape of the bottom of the pier on the railway bridge damaged by the heavy rainfall in July 2018 in Japan, its dimensions are assumed at a scale of approximately 1/40.
The bridge pier models were placed at the center of the channel width at a point 250 mm downstream from the upstream of the soil layer. Type 2 was placed in the center of the soil layer by rotating it with respect to the flow center of the river to study the local scouring behavior when the river channel flows into the bridge pier at an angle.

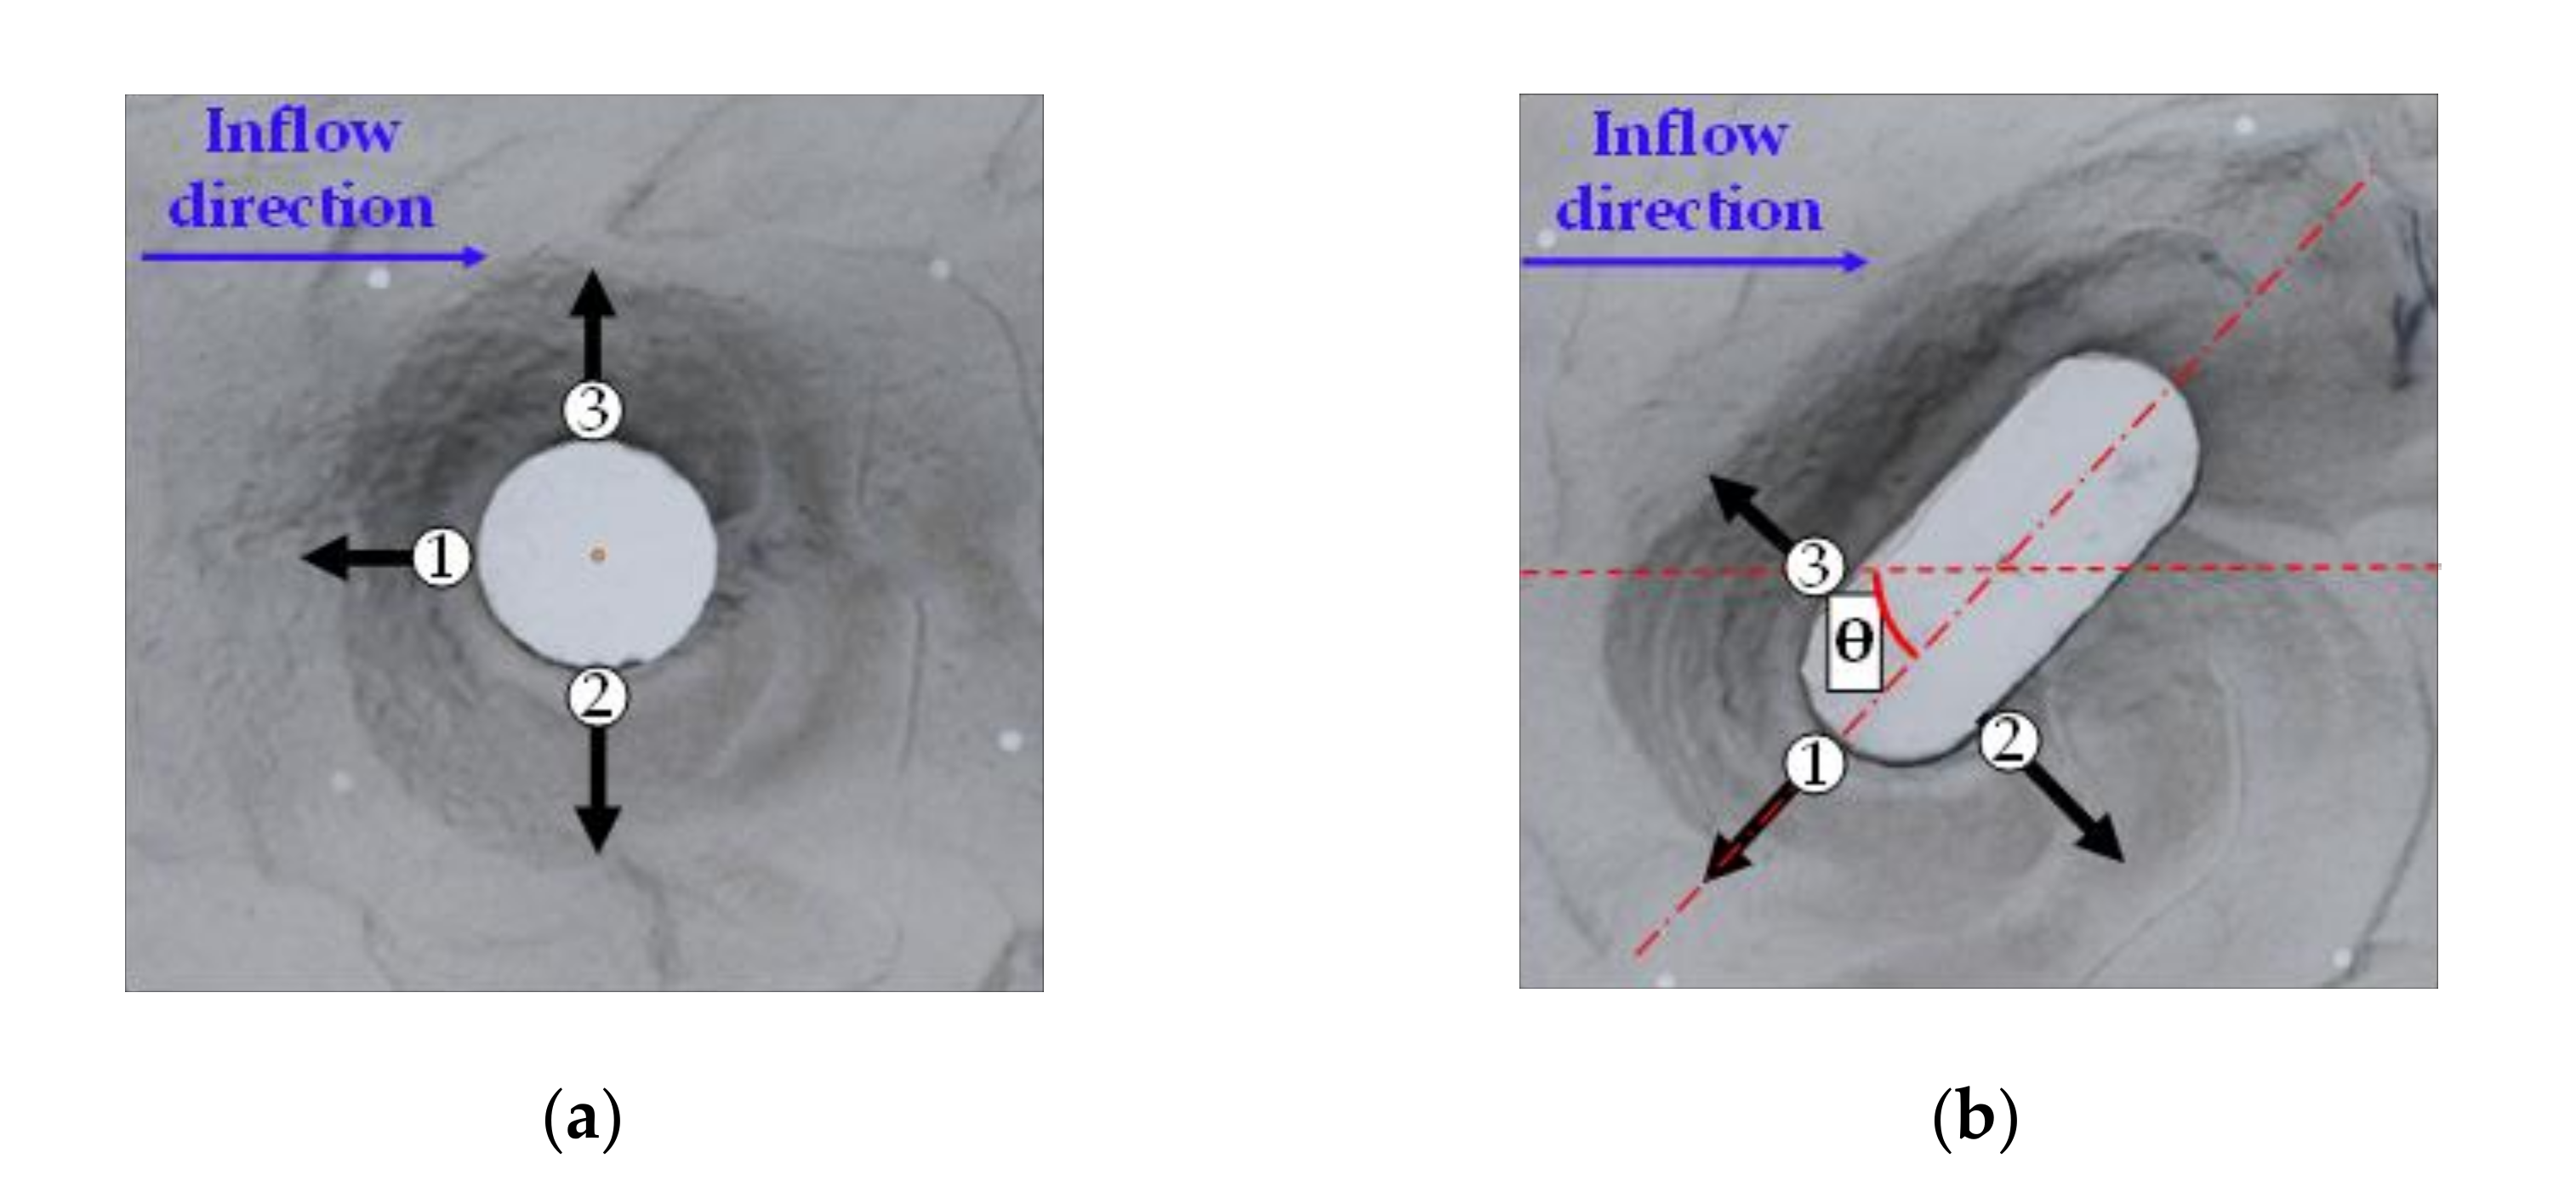
2.2. Experimental Cases

In total, 13 experimental cases were considered as a fundamental study to understand an effect of iterated water level on the progress of local scouring. Of these, seven (Cases 1–7) used Type 1 model and the remaining (Cases 8–13) employed Type 2 model. Water levels in Cases 1–2 and Cases 3–13 were set as 0.03 and 0.075 m, respectively. Cases 1, 3, 4, 8, 10, and 12 were set as the basic cases without iterated rise and fall of the water level. In Cases 2, 5, 6, 7, 9, 11, and 13, the cumulative targeted water level duration was set to 600 s and 1800 s, respectively. In Cases 2, 5, 6, 7, 9, 11, and 13, the water level history was reproduced by iteratively raising and lowering the water level 10 times. Only in Case 7 was the target water level set as 0.125 m for the fifth and tenth water levels to analyze the effect of the water level fluctuations on the local scouring. Details of these cases are presented in Table 1.
The water flow rate was set as 0.004 m3/s, and the target water level was achieved by changing the height of the weir installed downstream of the open channel. After reaching the targeted water level, water was allowed to flow for the duration t of the particular water level, and then drained to measure the shape of the local scouring around the bridge pier model.
To analyze the progress of the local scouring and flow of water around the bridge pier model, videos were recorded during the water level experiment. In general, stereo-photogrammetric systems [10] or 3D laser scanners [13,14] are often used to acquire 3D data of the shape of the soil surface. In this study, the shape of the soil surface after the water flow was obtained by creating three-dimensional data from the obtained images. Multiple images were captured by a digital camera to obtain more than 70% overlap between the images during analysis. The accuracy of the generated 3D data was approximately 2 mm less than that of the results measured by the laser displacement meter. Therefore, the proposed method served the purpose of qualitatively determining the extent of the local scour depth around the bridge piers or the shape of the local scour holes.

3. Effect of Water Level History on the Local Scouring around Bridge Pier

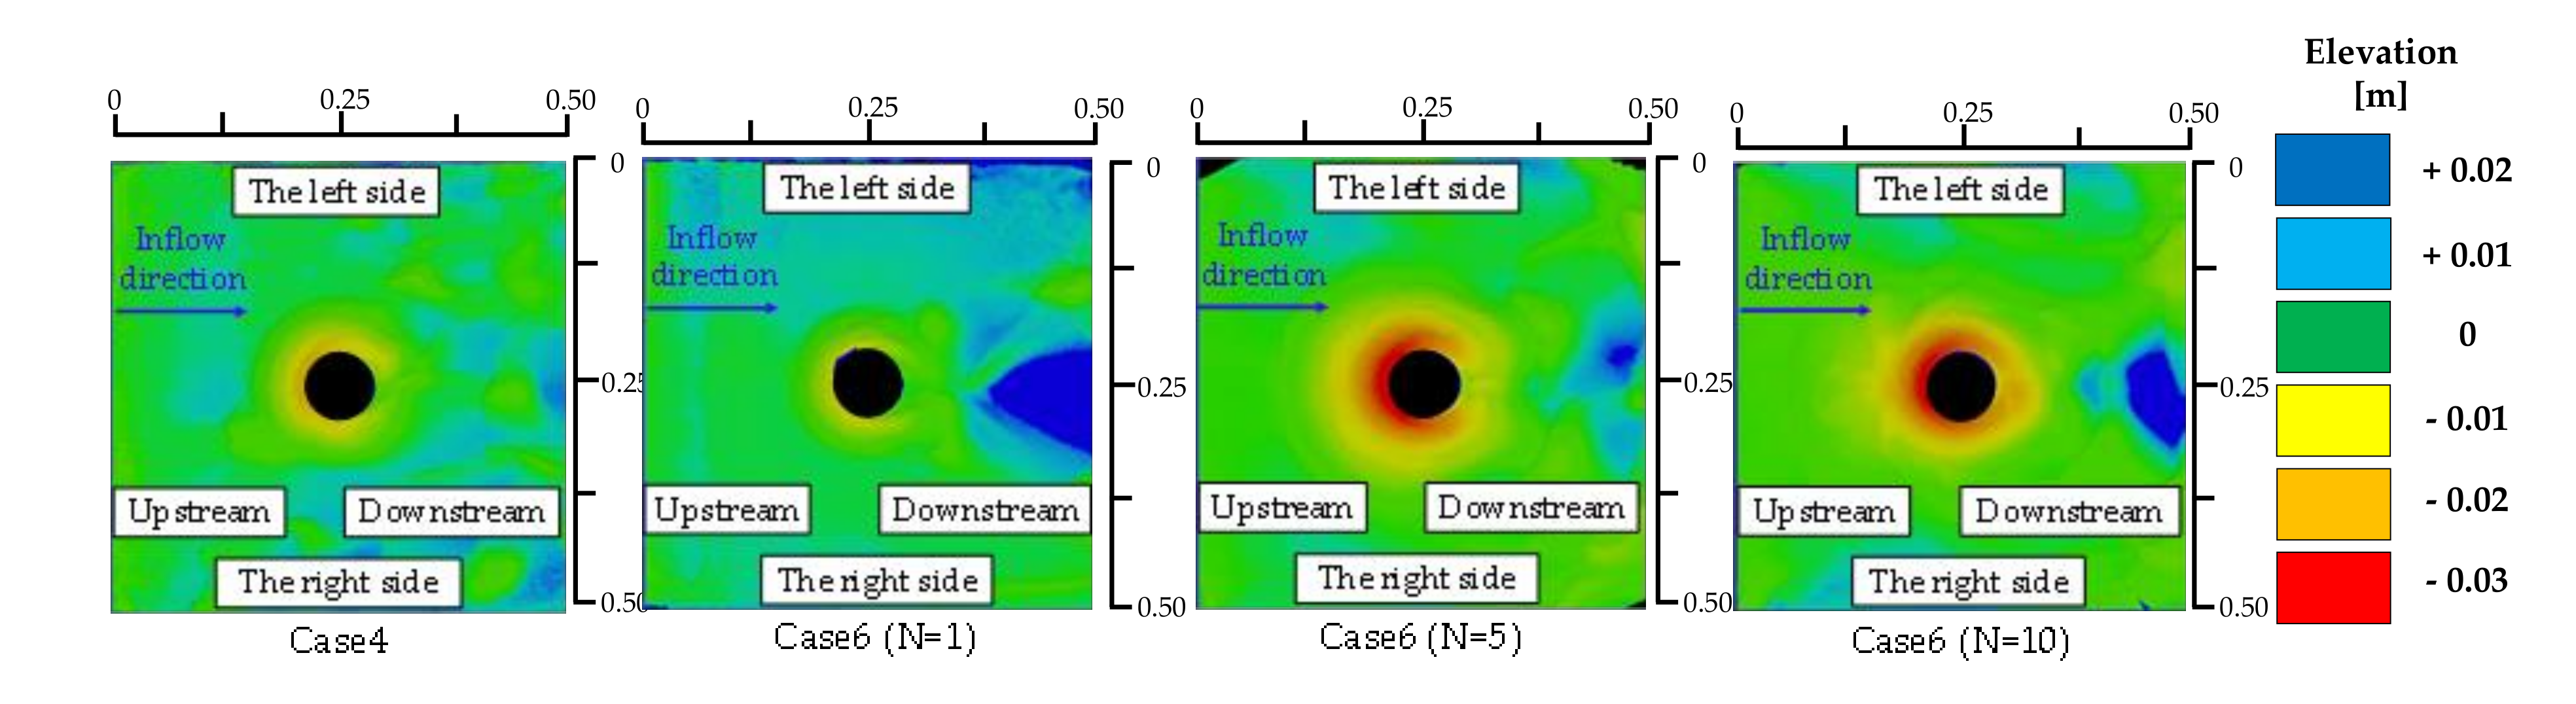
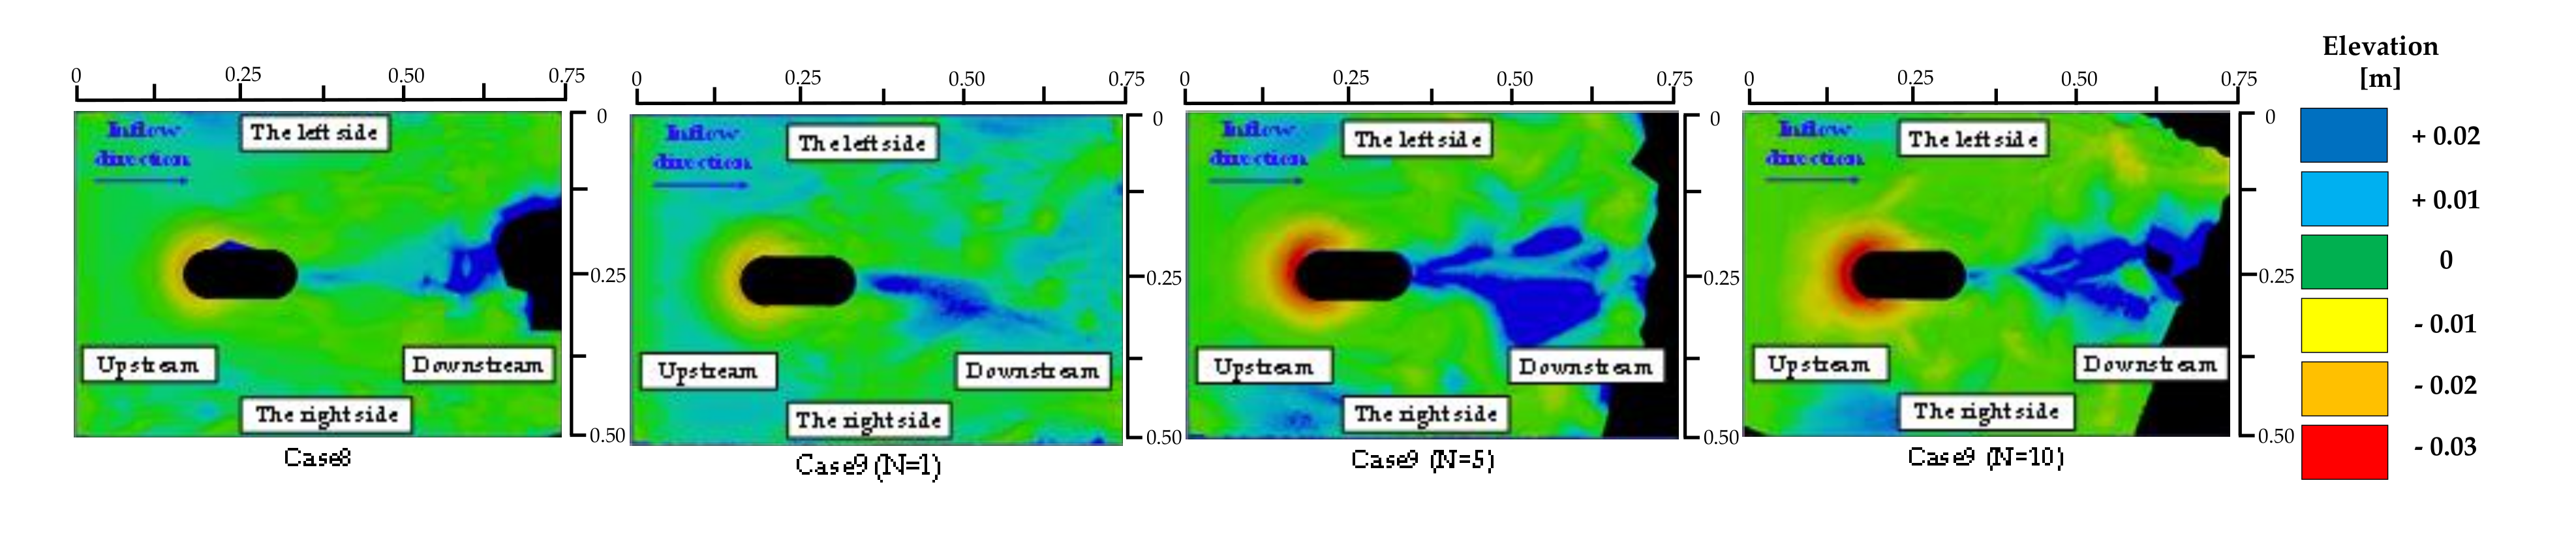
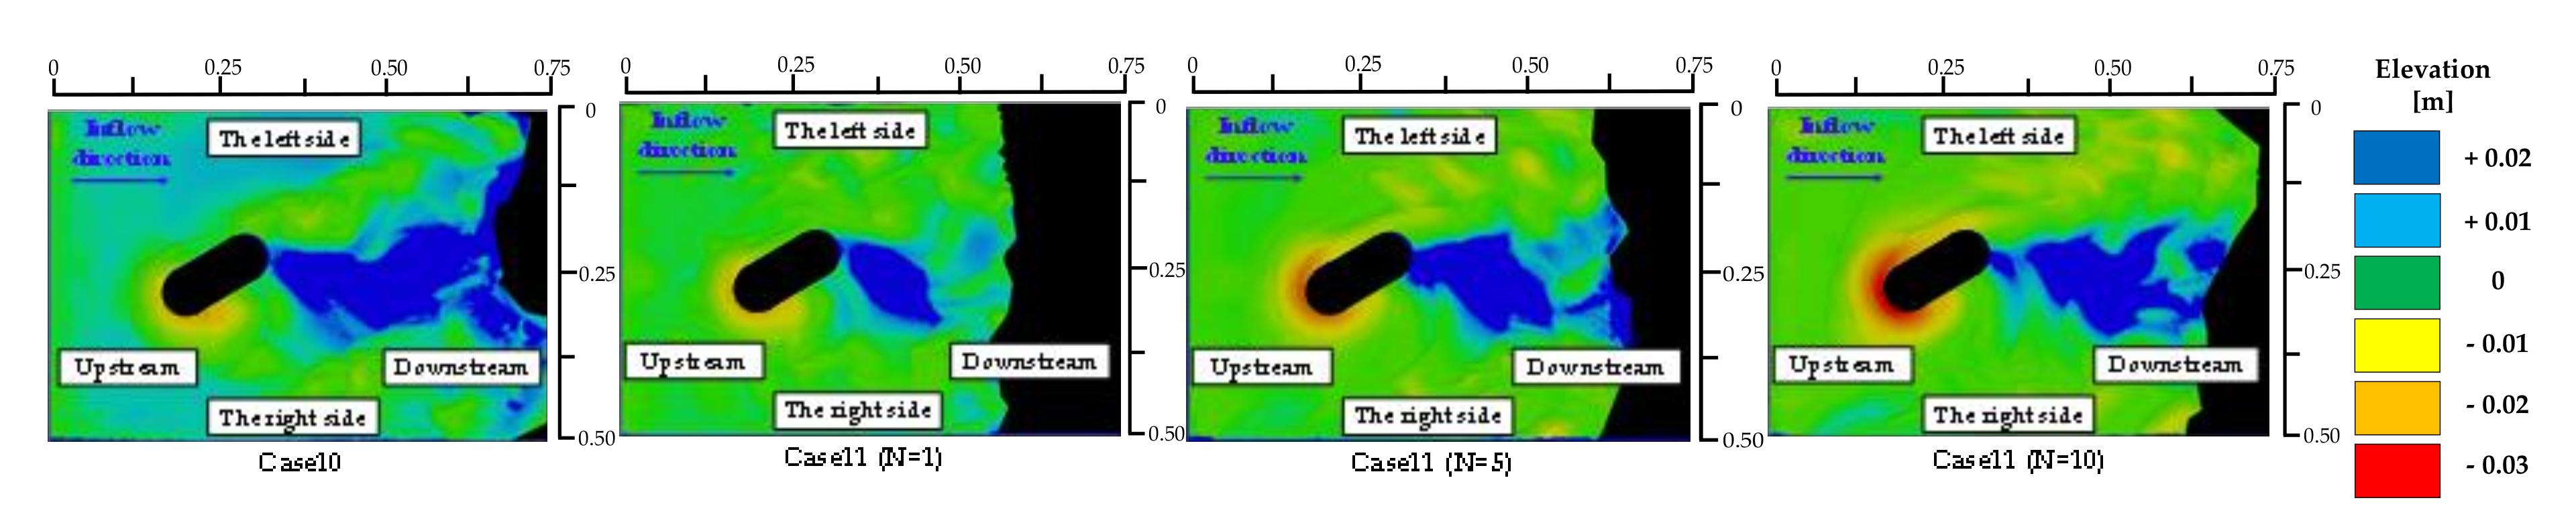
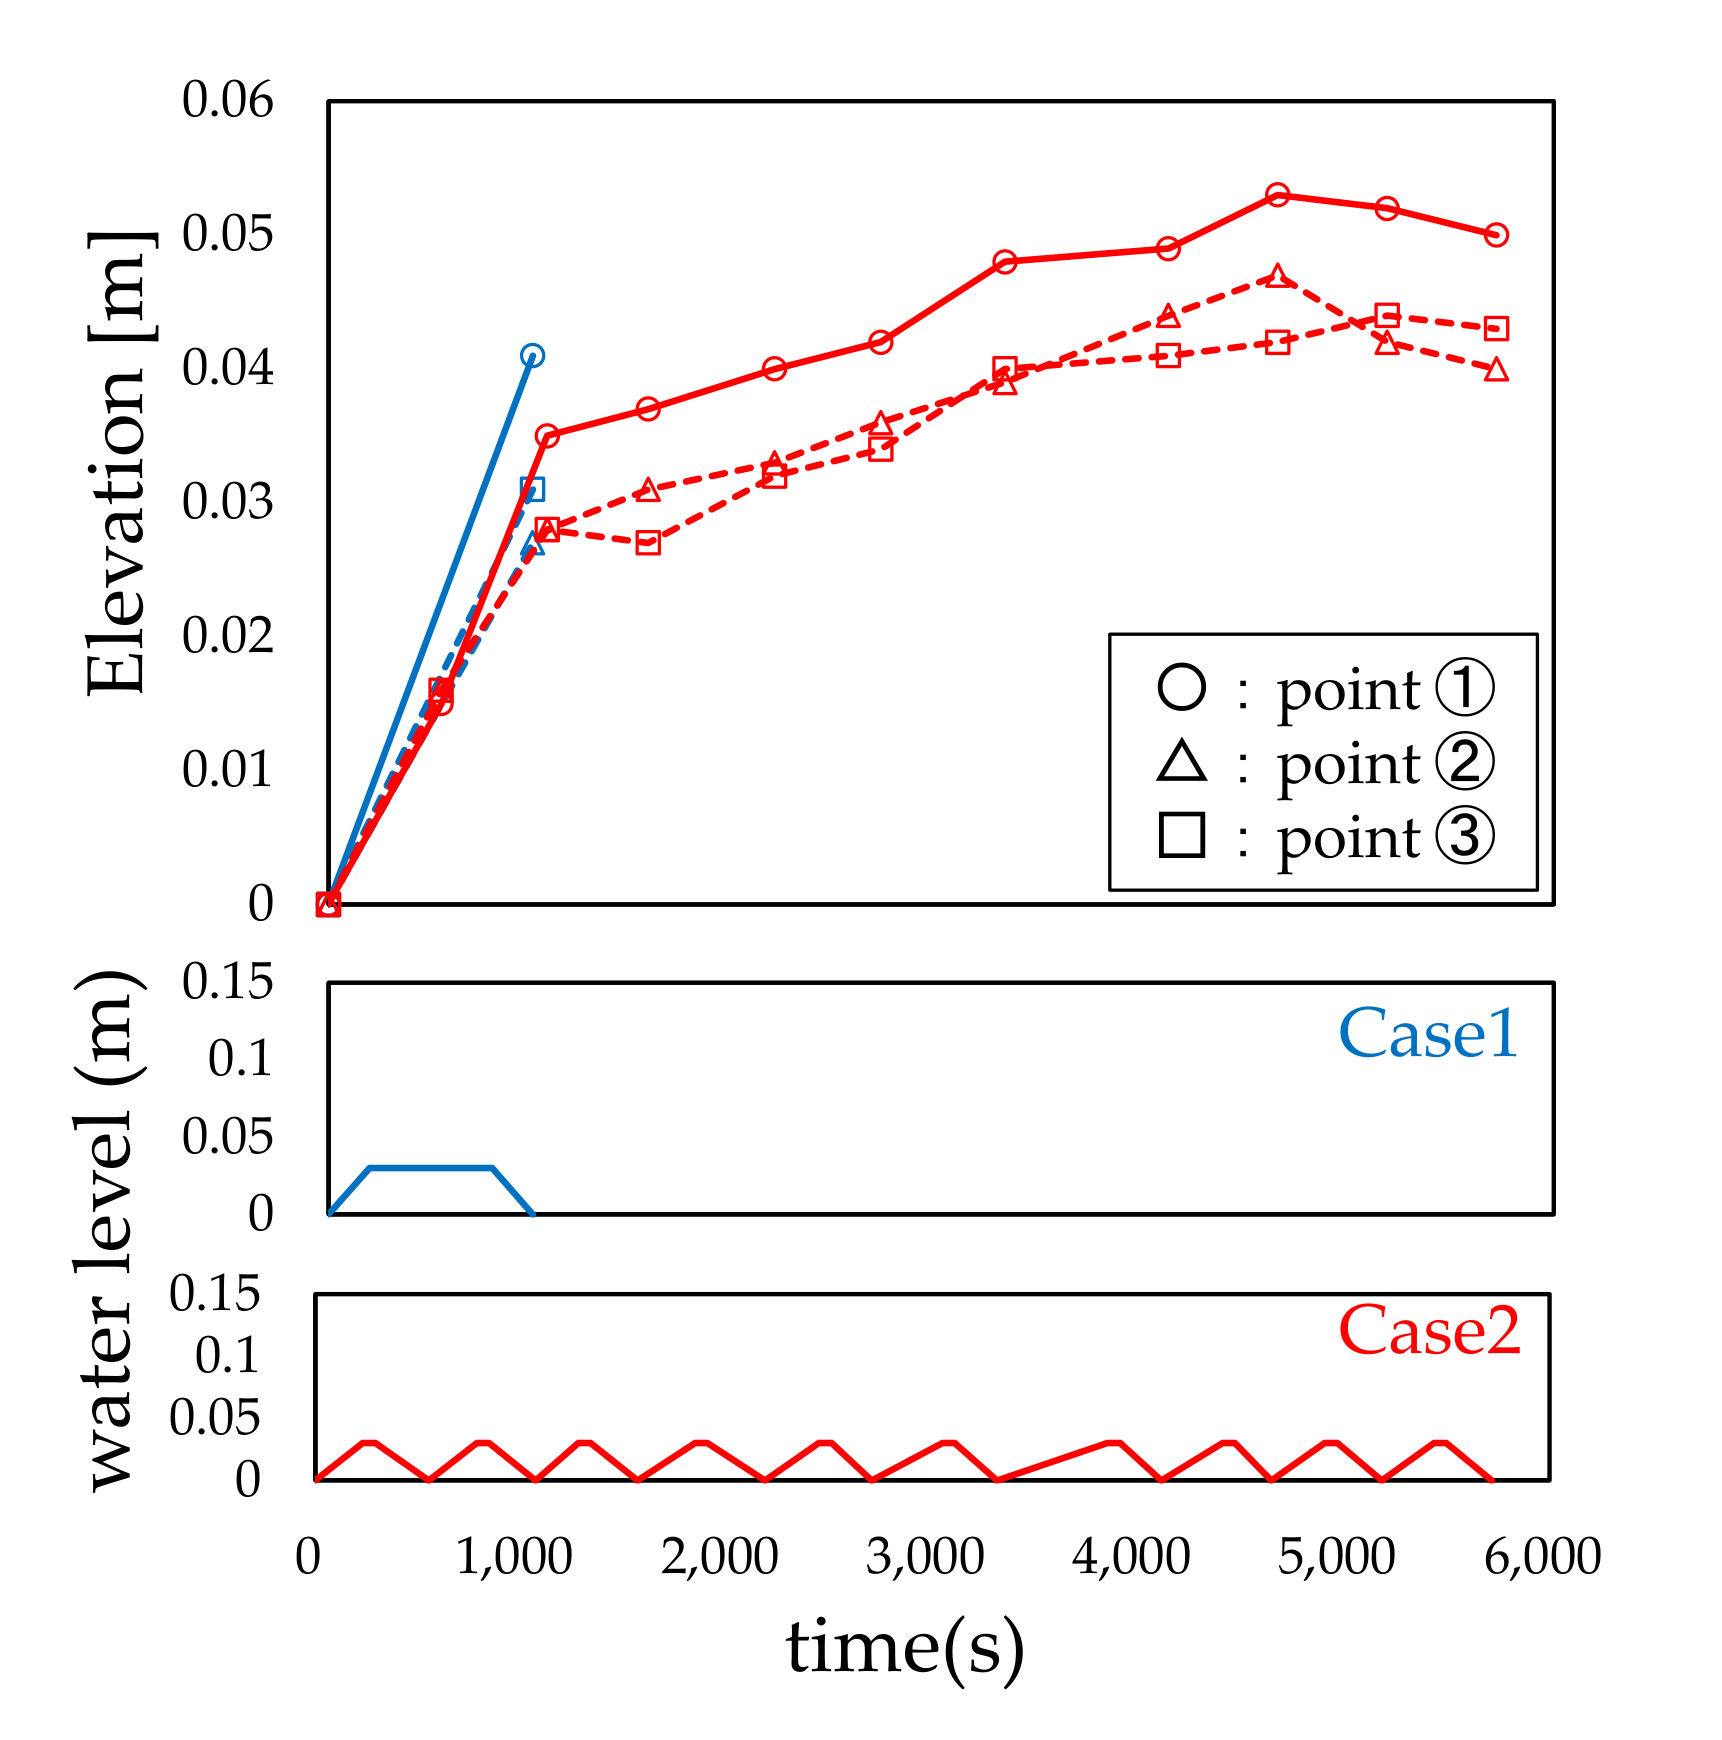
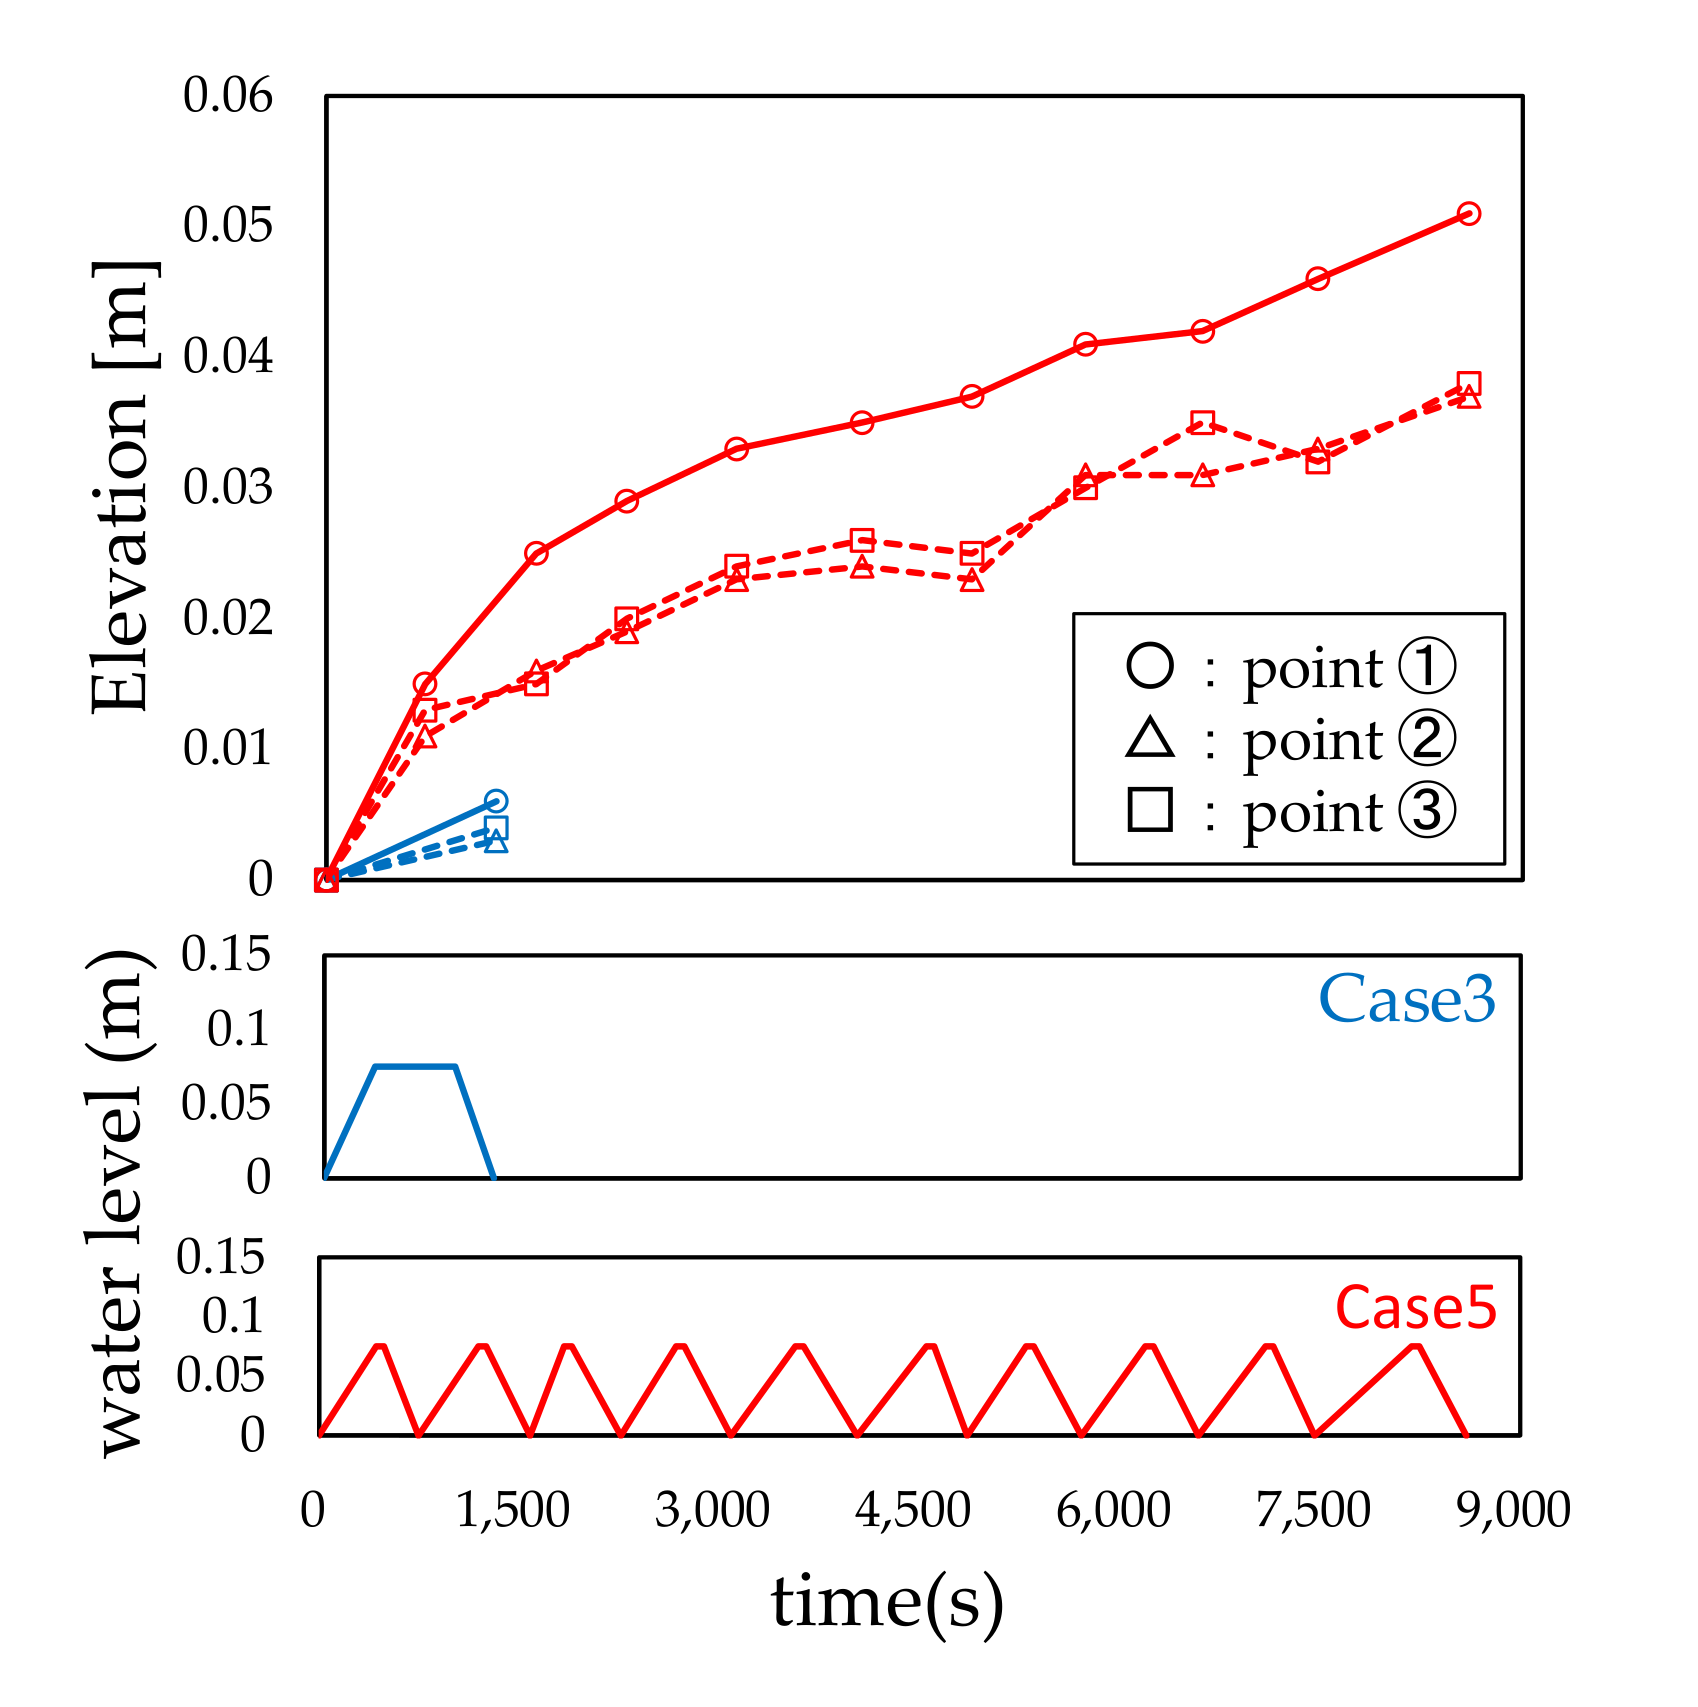
3.1. Progression of the Local Scour Area

Figure 2, Figure 3, Figure 4 and Figure 5 show the distribution of the local scour depths after the water penetration test. Incidentally, black areas in pictures are the pier model or elevation data areas that could not be obtained. In each case, a formation of ripple was observed downstream of the pier model, however, no ripples were observed near the upstream of the pier model, indicating that the effect of ripples on the formation of local scour holes was small. Figure 2 shows the distribution of local scour depths at the first, fifth, and tenth cycle of water penetration in Cases 4 and 6, where the water level was iteratively raised and lowered. Figure 3, Figure 4 and Figure 5 show the distribution of local scour depths for Cases 8 to 13, where Cases 9, 11, and 13 are representative of the distribution of local scour depths for the first, fifth, and tenth cycle of water flow. The contour map of the cylindrical and oval specimens show areas of 500 mm × 500 mm and 500 mm × 750 mm from the top of the soil layer, respectively. The contour plot of the local scour depth is shown in yellow to red as a negative value for the area where the ground height is low and in blue as a positive value for the area where the ground height is high, using the height of the soil layer as the reference plane.
In Case 4, the formation of a local scour hole of an inverted cone and sedimentation zone were observed upstream and downstream of Type 1 model, respectively, as shown in Figure 2. It was consistent with the formation reported in previous studies [10,15]. In addition, we observed that the local scouring process started from the diagonal upstream and progressed to the surrounding area along the wall of Type 1 model to form a local scouring hole, similar to that in the experiment conducted by Umeda et al. [10]. As shown in Figure 2, the local scour depth distribution in Case 6 shows that the range of the local scour hole upstream of the bridge pier model increases as the water level rises and falls iteratively.
The formation process of the local scour hole in the first iteration for Case 6 was similar to that in Case 4, which was the basic case without the rise and fall of the water level. From the second iteration, it was observed that the local scouring progressed, particularly at the beginning of the water level rise or end of the water level fall near the completion of drainage, when the water level was below approximately 0.020 m. After reaching the target water level, the local scouring progressed gradually. In Case 8, as shown in Figure 3, a local scour hole of an inverted cone and a sedimentation zone were formed upstream and downstream of Type 2 model, respectively. It was observed that the front cylindrical part of Type 2 model followed the distribution of local scour depth similar to the contour map of Case 4 using Type 1 model. Similarly, the local scour depth distribution in Case 9 was similar to that in Case 6, and the range of local scour holes upstream of the bridge pier model increased because of the iterated rise and fall of the water level.
For Cases 10 and 11, as shown in Figure 4, local scour holes were formed on the right side of the upstream (hereinafter referred to as the right side) and the left side of the downstream (hereinafter referred to as the left side) of the bridge pier model. In addition, a sedimentation zone with the same width as that of the water flow obstruction was observed downstream of the bridge pier model. This could be due to the placement of Type 2 model at an angle of θ = 30° with the water flow direction, which resulted in a wider deposition area in the perpendicular direction of the open channel compared to the circular specimen or the oval specimen with an angle of θ = 0° with the water flow direction. Case 11 shows that the local scour hole formed upstream of Type 2 model expanded as the water level iteratively rose and fell, and the local scour area extended to the left side downstream of Type 2 model. In addition, the local scour depth contours of Cases 12 and 13, as shown in Figure 5, show that the upstream local scour shape was formed on both right and left sides downstream of Type 2 model. Moreover, a sedimentation zone with the same width as that of the water flow obstruction was formed downstream of the bridge pier model, indicating that the sedimentation zone was extensive, similar to that in Cases 10 and 11. Further, in Case 13, the range of the local scour hole formed upstream of the bridge pier model increased as the water level rose and fell iteratively, and the local scouring extended downstream of the oval specimen more widely than that when θ = 30° at the left side. This tendency was similar to that of the experiments previously conducted by the authors and other researchers [16,17,18].

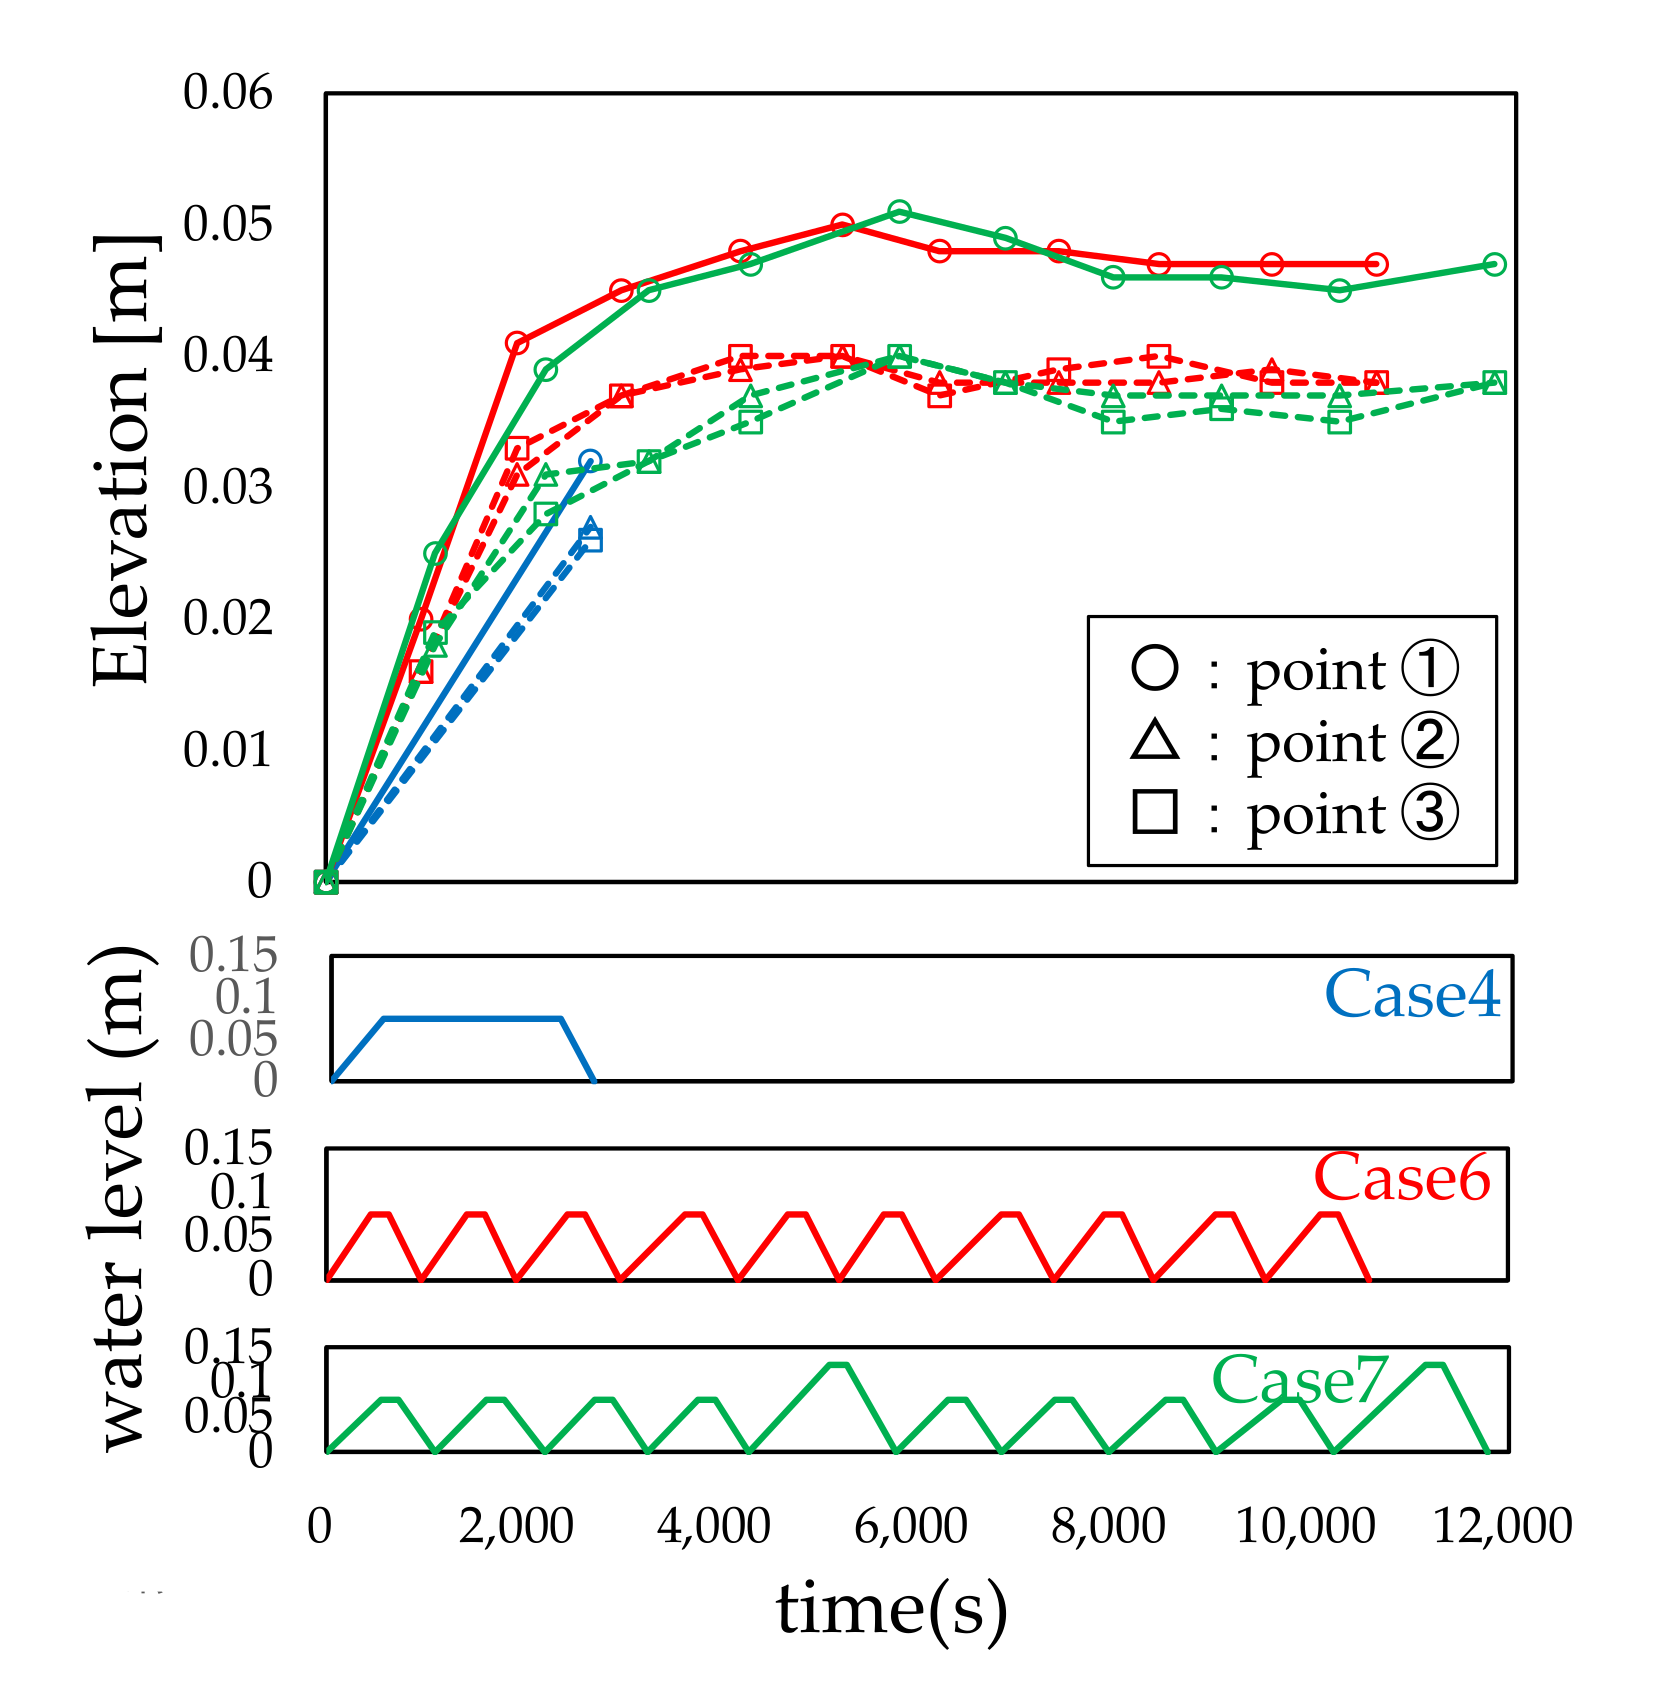
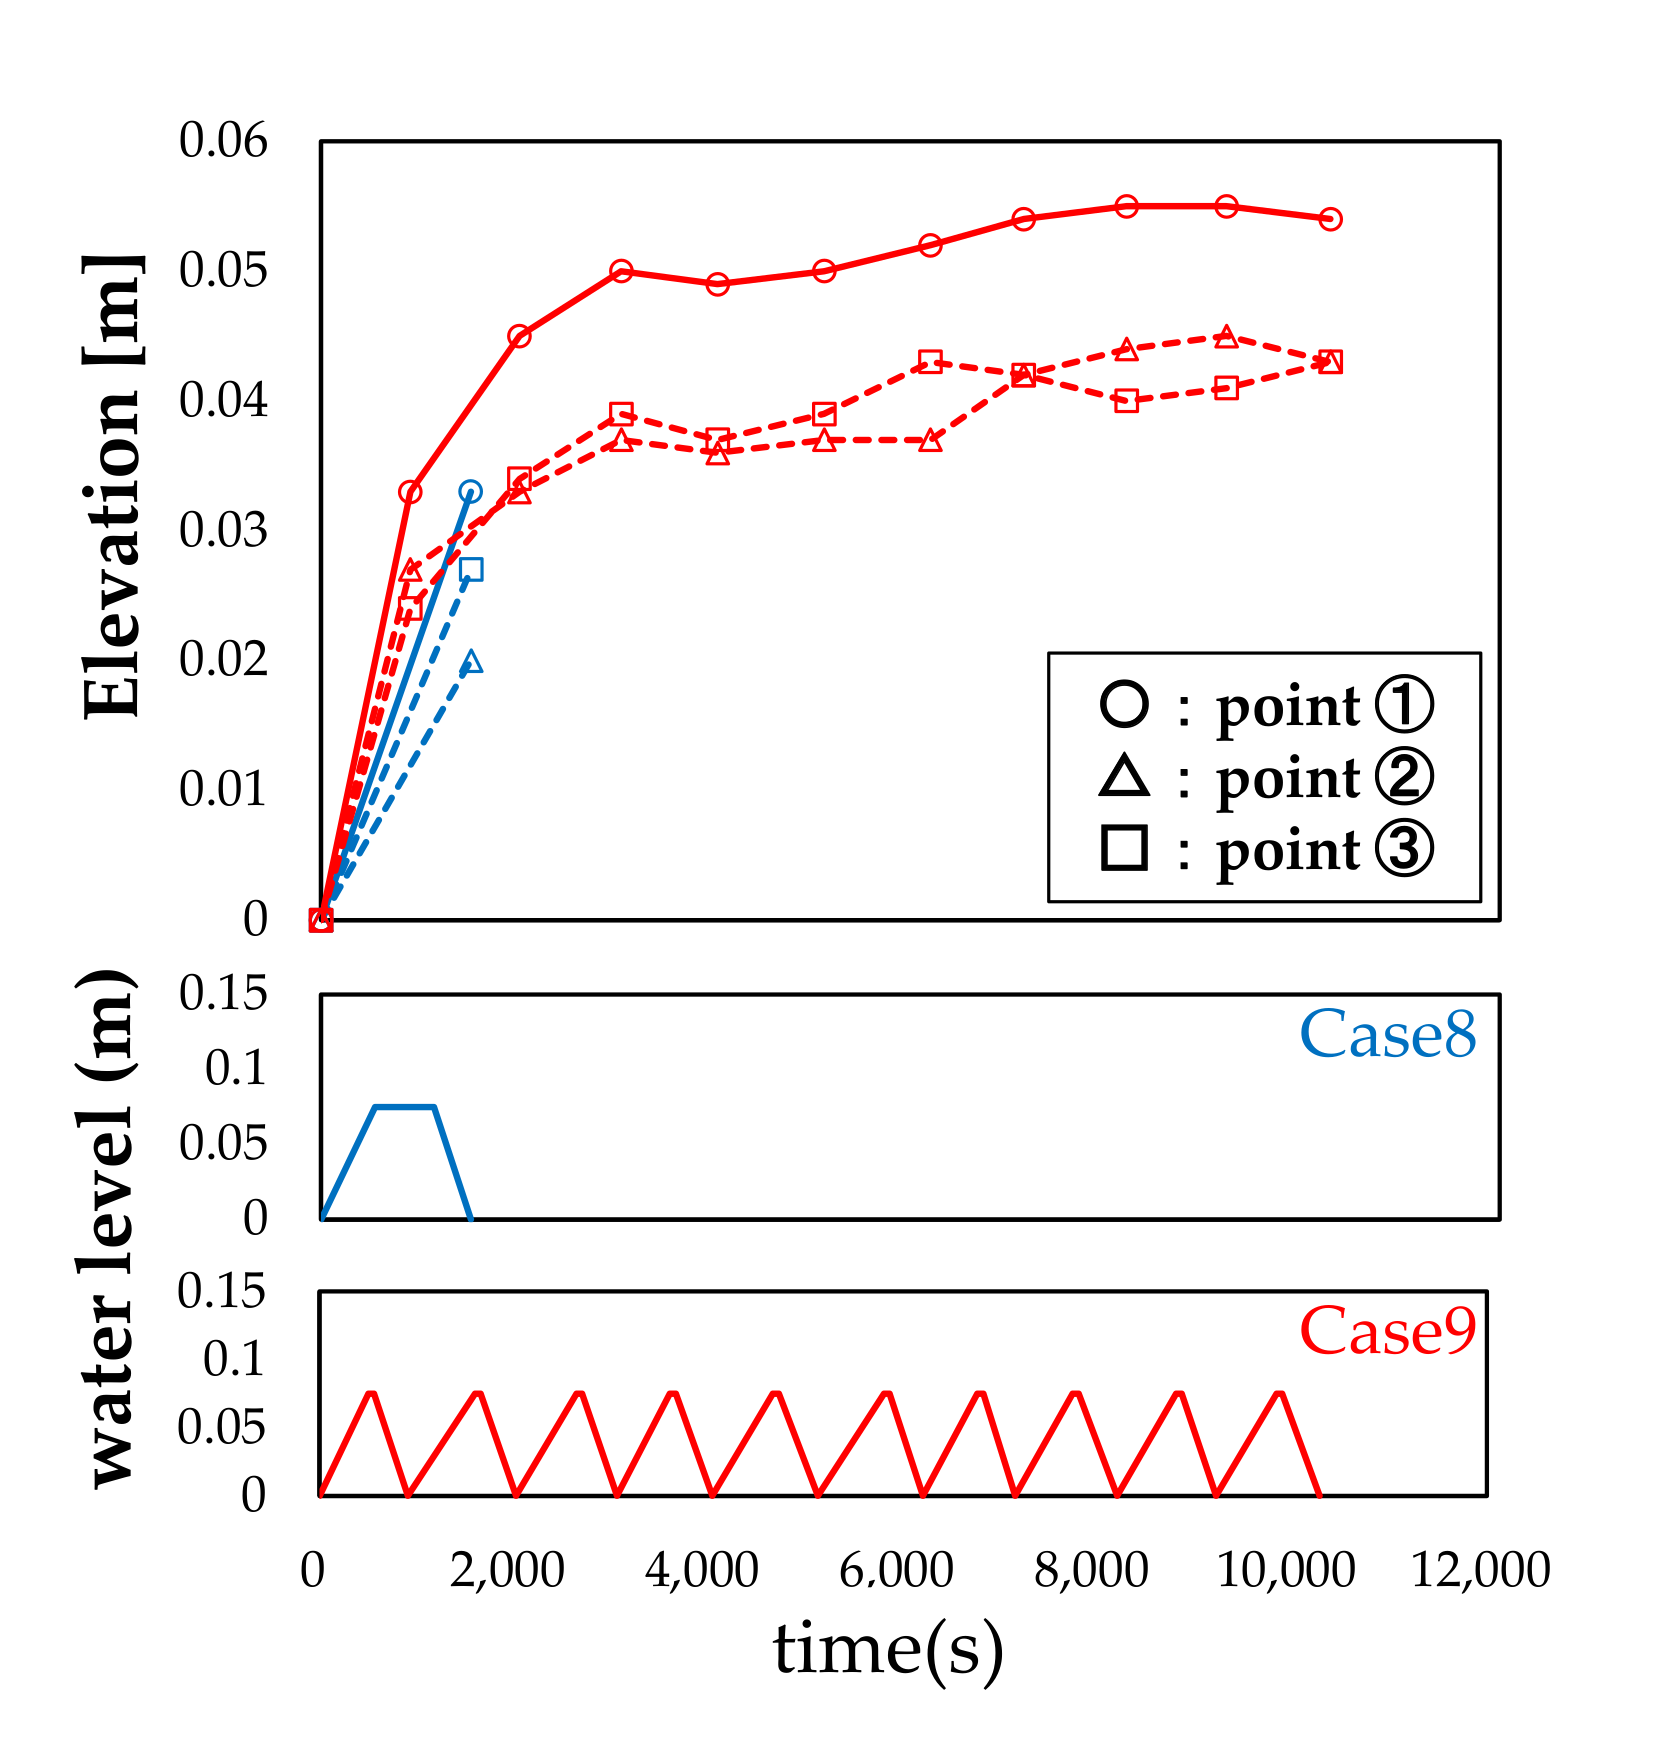
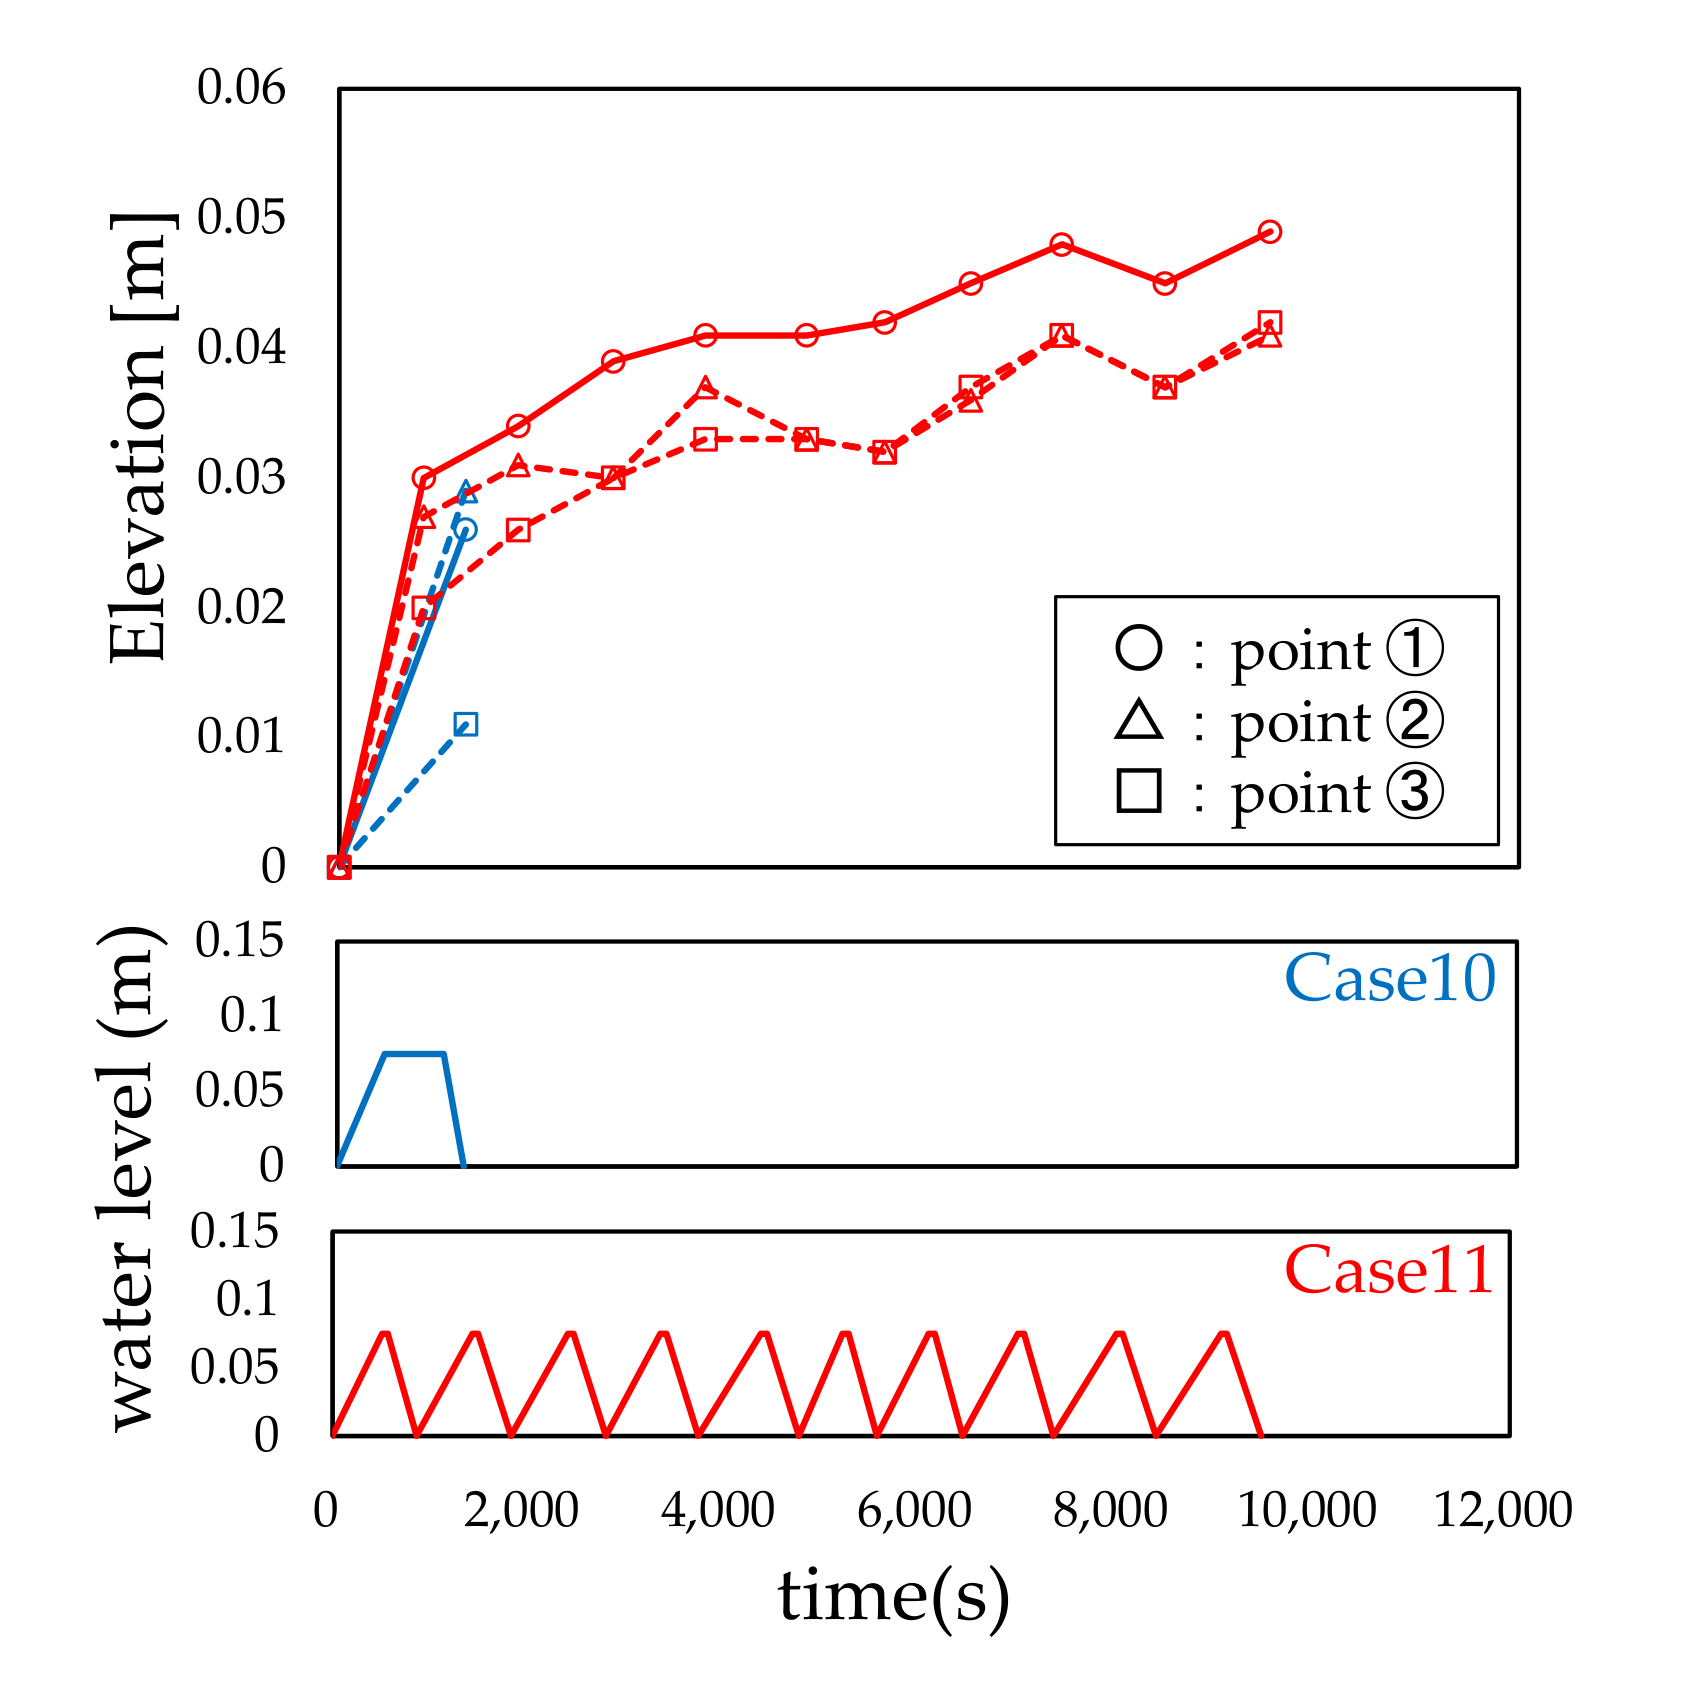
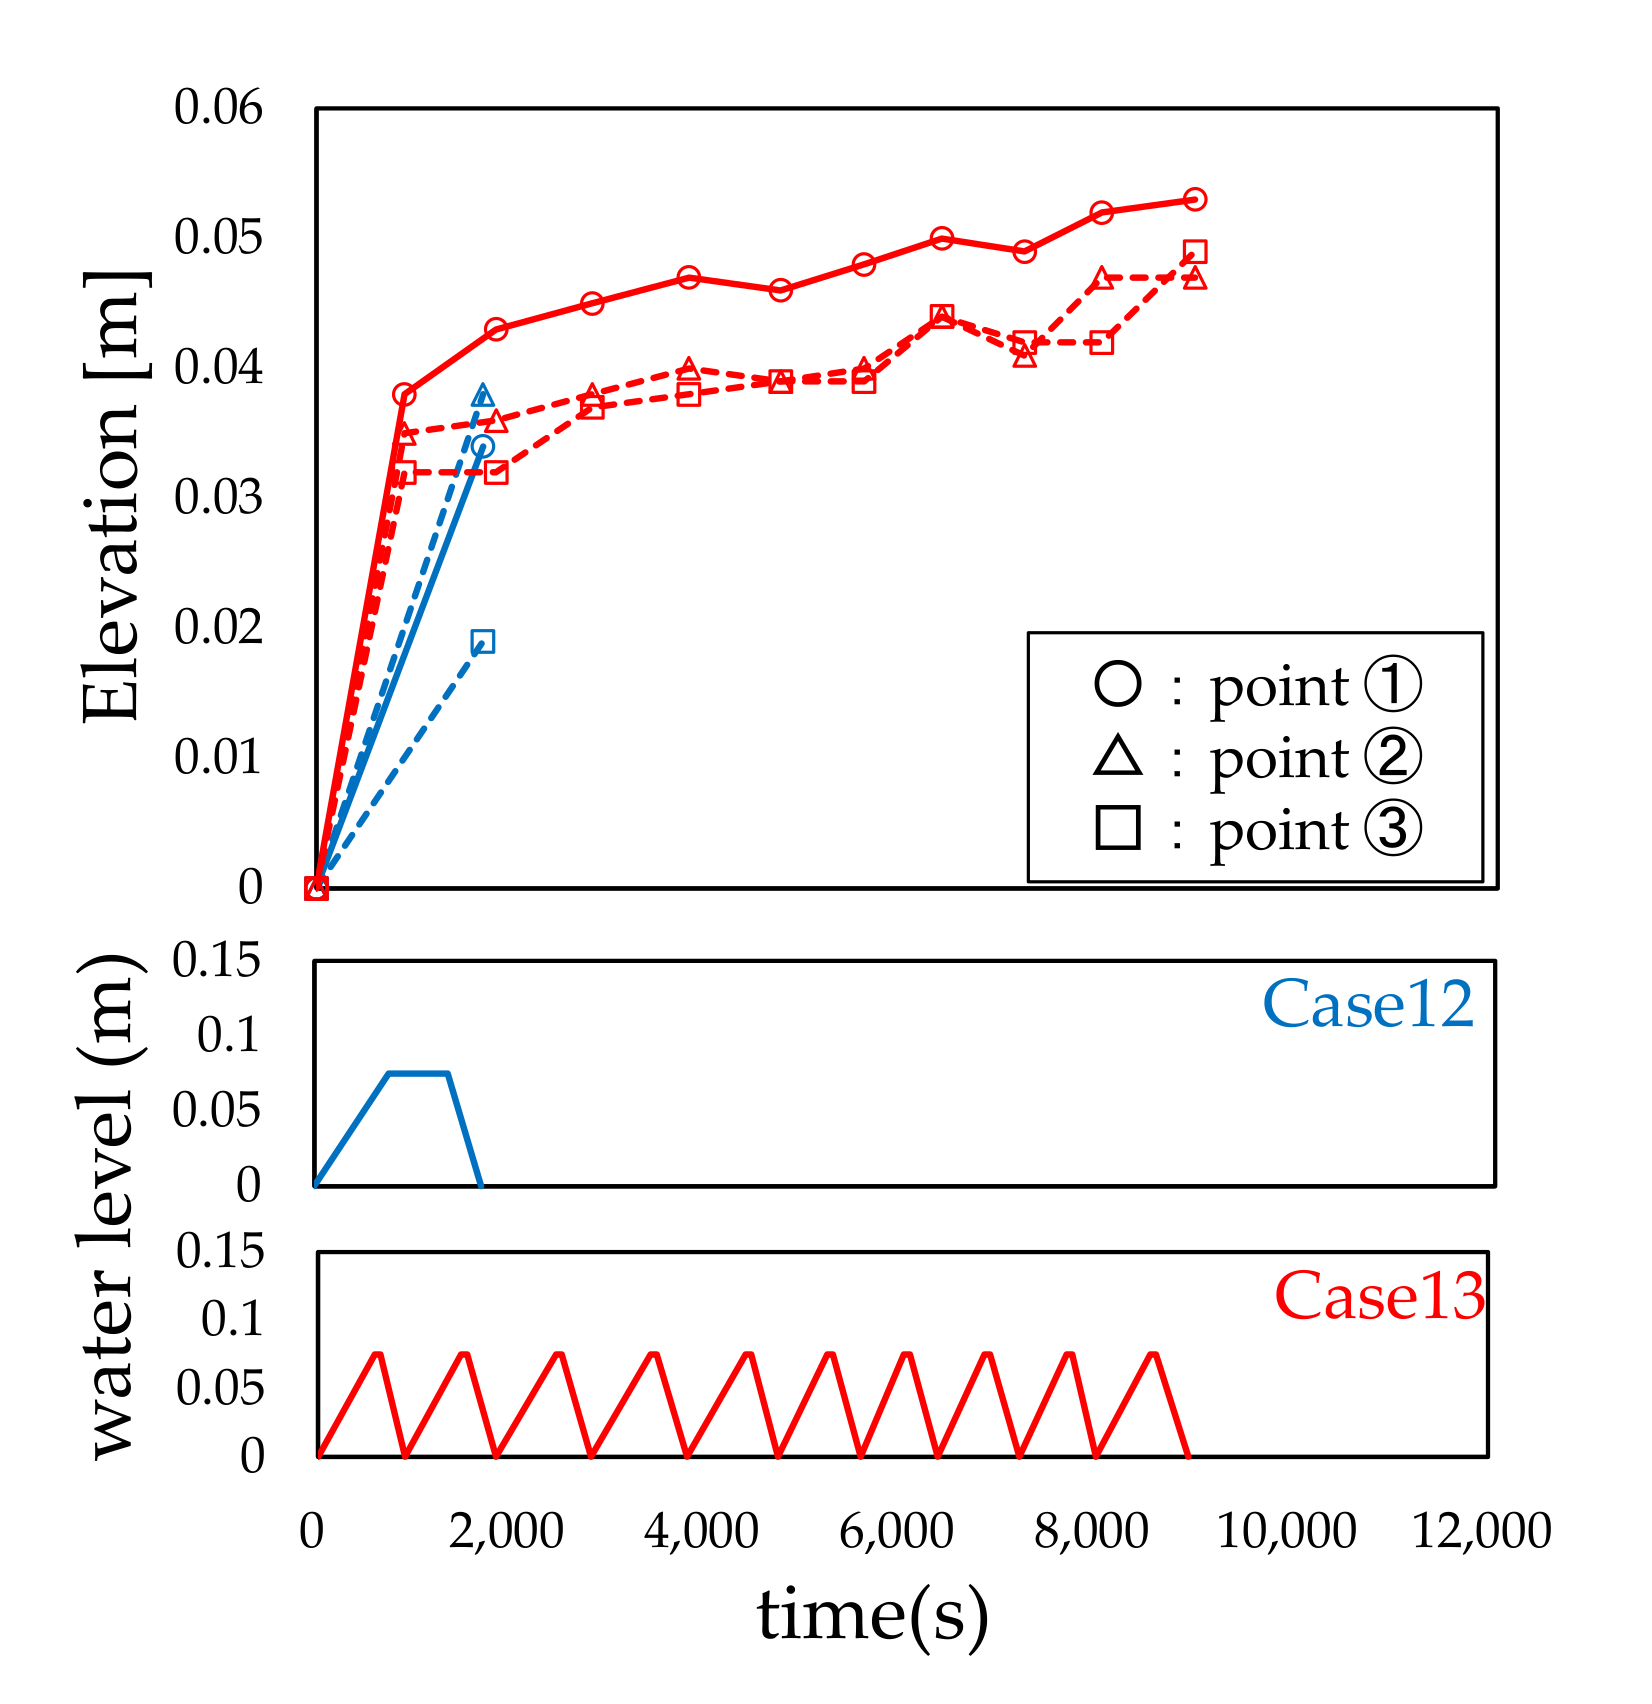
3.2. Influence of Water Level History and Pier Shape on Local Scour Depth

Figure 6 shows the measurement locations of the local scour depth and length. In the case of Type 1 model, measurement point 1 was located 35 mm upstream in the water flow direction, point 2 was located 35 mm to the right, and point 3 was located 35 mm to the left, based on the center of Type 1 model. For Type 2 model, the center of the semi cylindrical part upstream was used as the reference point. Moreover, point 1 was located 35 mm upstream in the direction of the pier axis while points 2 and 3 were located 35 mm to the left and right, respectively, in the direction perpendicular to the pier axis.
Figure 7, Figure 8, Figure 9, Figure 10, Figure 11 and Figure 12 show the relationship between the water level history and local scour depth. From these figures, it can be observed that the local scour depth increases as the water level rises and falls iteratively, and that the increase tends to converge after the third or fourth water flow. The local scour depth of each measuring point tended to be the largest at measuring point 1 in all cases. The local scour depth at point 1 was approximately 1.2 times larger than that at points 2 and 3. The local scour depths were 1 to 1.5 times the width of the bridge piers. These experimental results are consistent with those of previous studies [2,3,15,19,20,21]. For Cases 1 and 2, the local scour depths, shown in Figure 7, were similar to the values calculated through the model proposed by Tarapore [3]; the calculated local scour depth was 43.5 mm when the water flow rate was 0.03 m.
Figure 8 and Figure 9 show that the local scour depth increased rapidly up to the third or fourth water flow and then converged, even when the duration of water flow was different, and the local scour depth at the time of convergence was generally the same. Therefore, the effect of continuous water flow time on the local scour depth was considered to be smaller. Under the conditions of these experiments, the critical friction velocity was 0.013 m/s, and the friction velocity reached the critical velocity when the water level was approximately 0.015 m. Therefore, the effect of the duration of water flow was significantly reduced because the conditions were such that the local scour with continuous sediment motion and clear water was iterated.
Figure 7, Figure 8 and Figure 9 show that the local scour depth increased with the repetition of the water level, and the convergence tendency was similar in all cases, although the water level was different in each case, and the local scour depth at the tenth cycle was almost the same. Therefore, it can be concluded that the effect of the change in the target water level on the local scour depth was slight, and the water level history caused by the iterated rise and fall of the water level affected the local scour depth.
From the experimental results shown in Figure 9 and Figure 10, it is evident that the trend of increase and convergence of the local scour depth in Case 9 and the local scour depth at the tenth cycle of water penetration were similar to the trend in Cases 6 and 7. The local scour depths upstream of the pier models of Type 1 and Type 2 were similar. In contrast, Figure 2 and Figure 3 show that local scour depths downstream of the pier models were different. In the case of Type 1 model, a local scour hole was formed downstream of the pier model; however, for Type 2 model, local scour holes were not formed. This is because the horseshoe-shaped eddies do not affect the downstream of the pier model for the Type 2 model due to the long length of the pier model in relation to the river direction.
The results of Cases 8, 10, and 12, where the water level did not rise and fall iteratively, show that the local scour depth at measuring point 1 was the largest in Case 8, while at point 2, it was the largest in Cases 10 and 12. This result was similar to that of a previous study [20]. From the experimental results of Cases 9, 11, and 13, where the water level rose and fell iteratively, it was observed that the local scour depth increased to the maximum at measuring point 1 when θ was 0°, 30°, or 45°. However, the maximum local scour depth was the same as that of Type 1 model in all cases. Further, the location of maximum local scour depth changed from point 2 to the vicinity of point 1 when the water level history was iterated. In general, when θ was specified, the local scour holes were formed at the vicinity of point 2, followed by point 3 and point 1 [17]. When the water level did not rise and fall iteratively, the maximum local scour depth was observed in the vicinity of point 2; however, the position of the maximum local scour depth shifted to point 1 owing to the rise and fall of the water level. This was probably due to the inflow of water from upstream into the scour hole that occurred when the water level rose or fell.

3.3. Summary of This Section

The results of all the experiments showed that the local scour depth increased with the repetition of the water level history; however, the increase converged after the third repetition, and the local scour depth at upstream of the pier model was the deepest.
The local scour depth at the tenth cycle was almost the same even when the duration of the water flow and target water level were changed. This is because local scouring is progressing especially under the condition that the water flow level is relatively low when the water level rises or falls, there is no change even if the water flow level is changed. In the case of the oval specimen with θ, the maximum local scour depth was the same as that of the cylindrical specimen, although the observed position of the maximum local scour depth changed from point 2 to point 1 when the water level history was iterated.

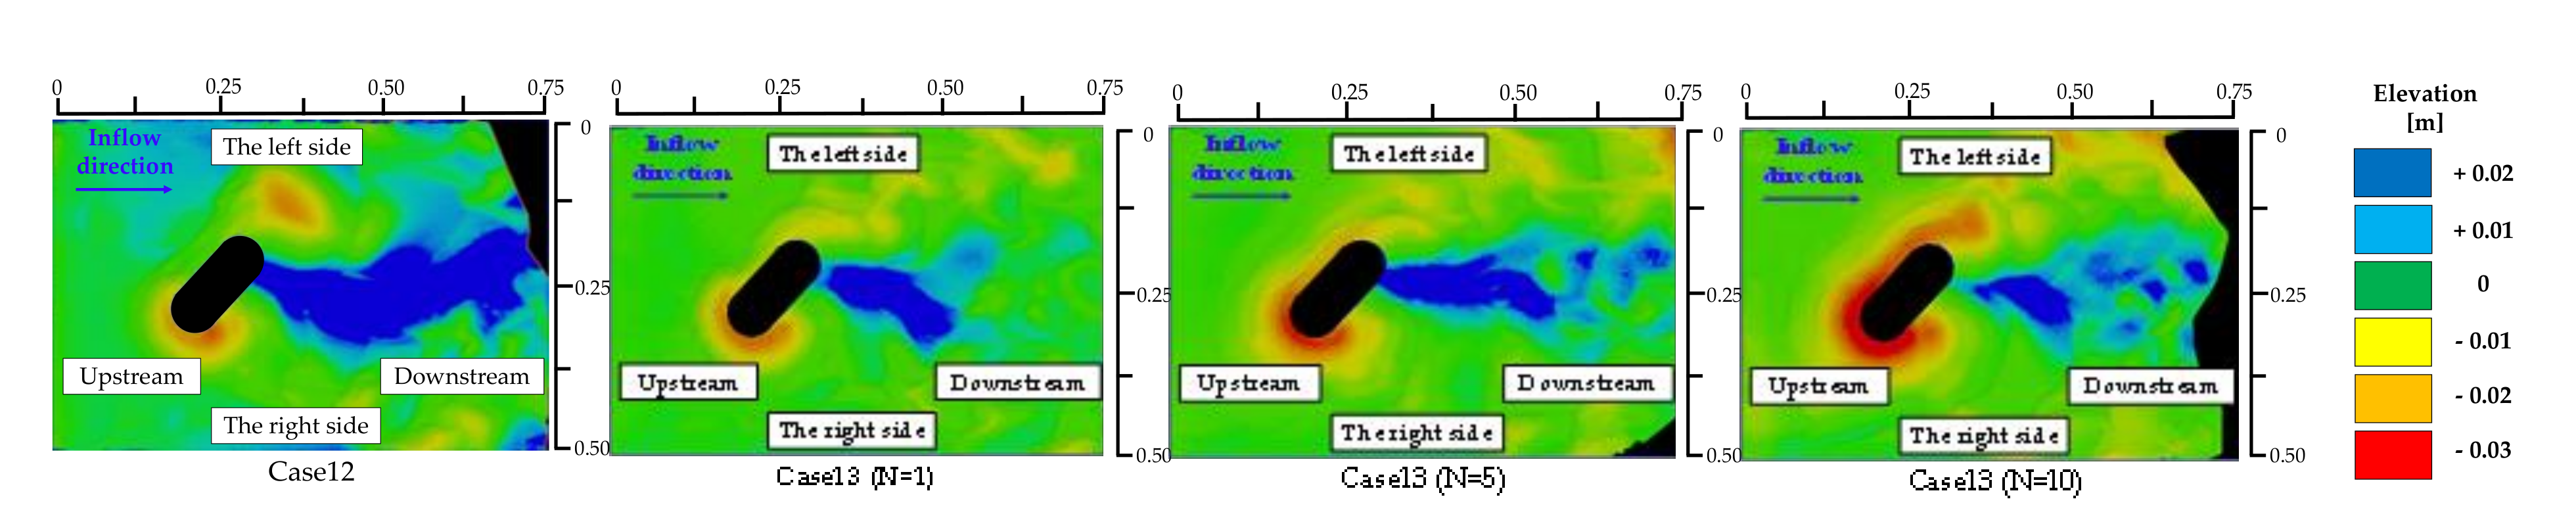
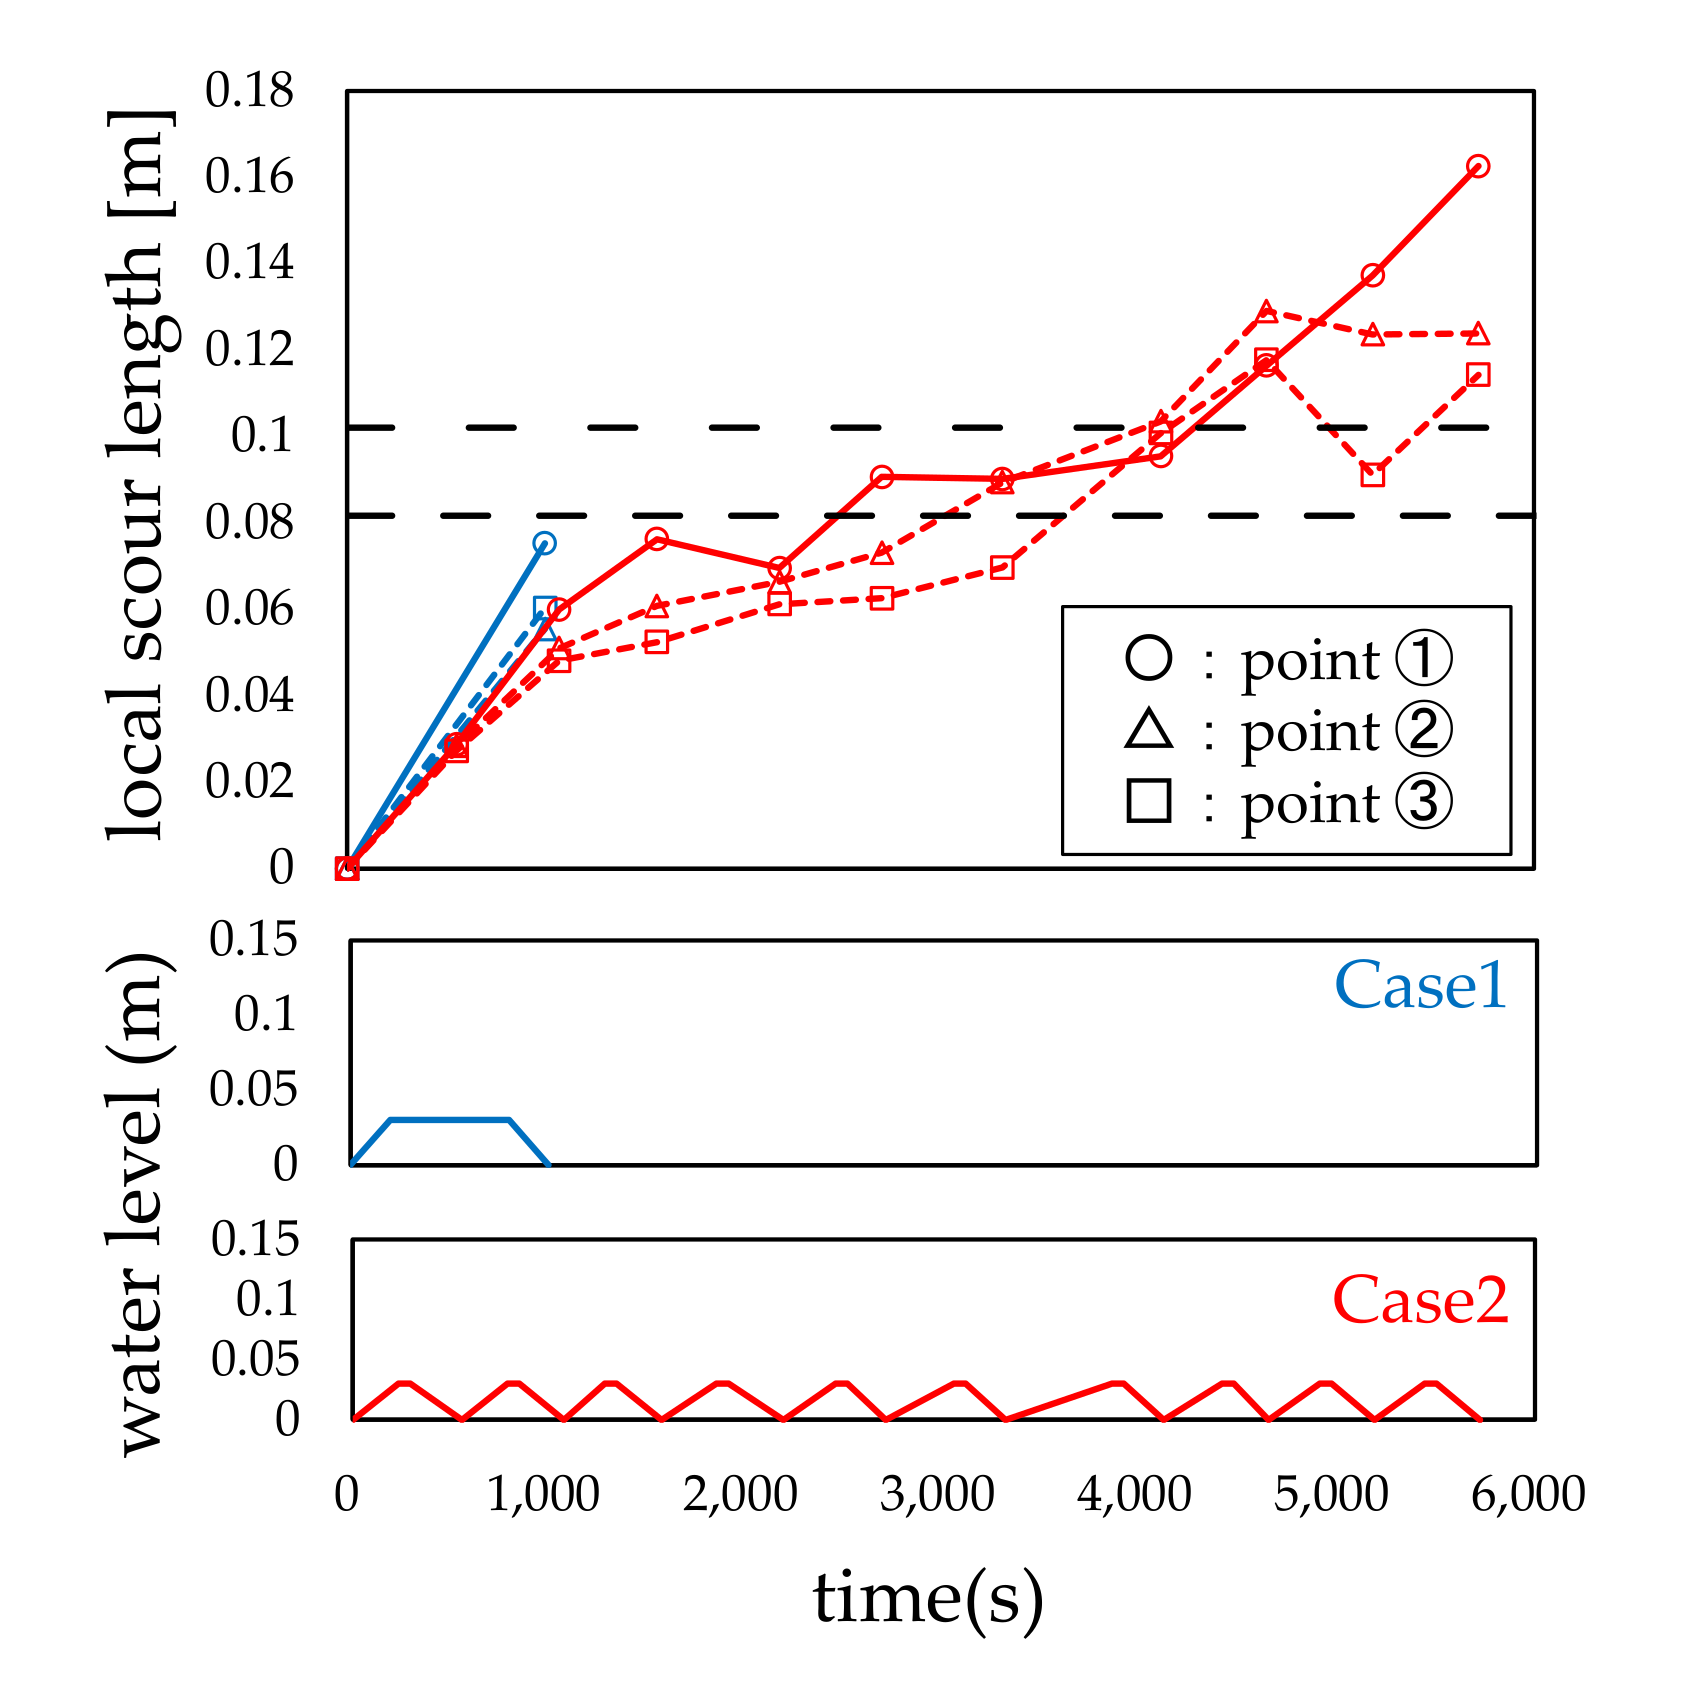
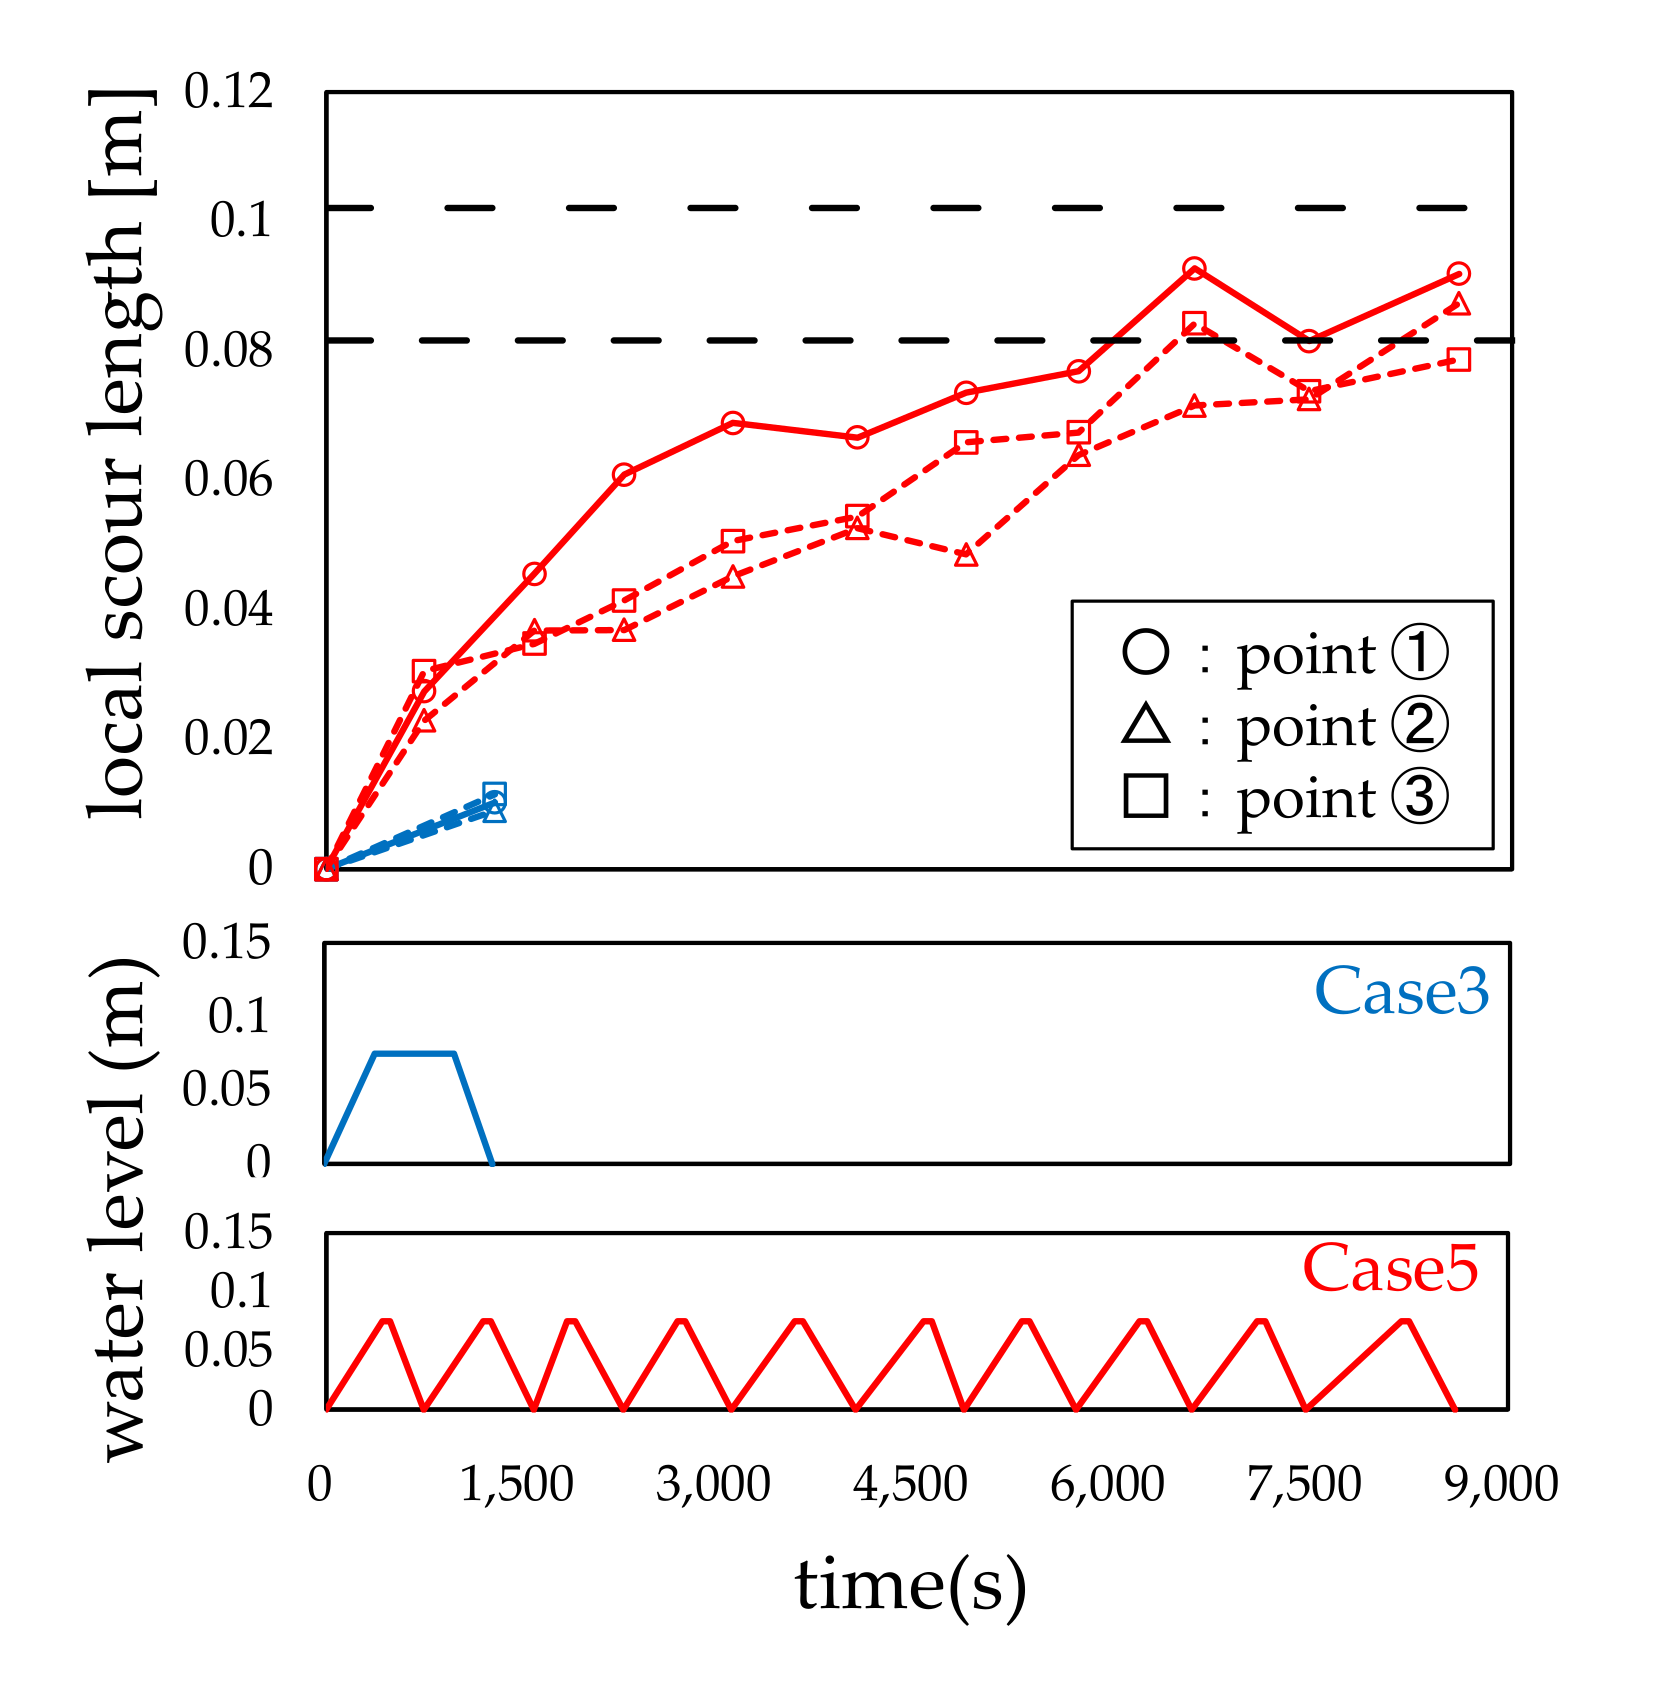
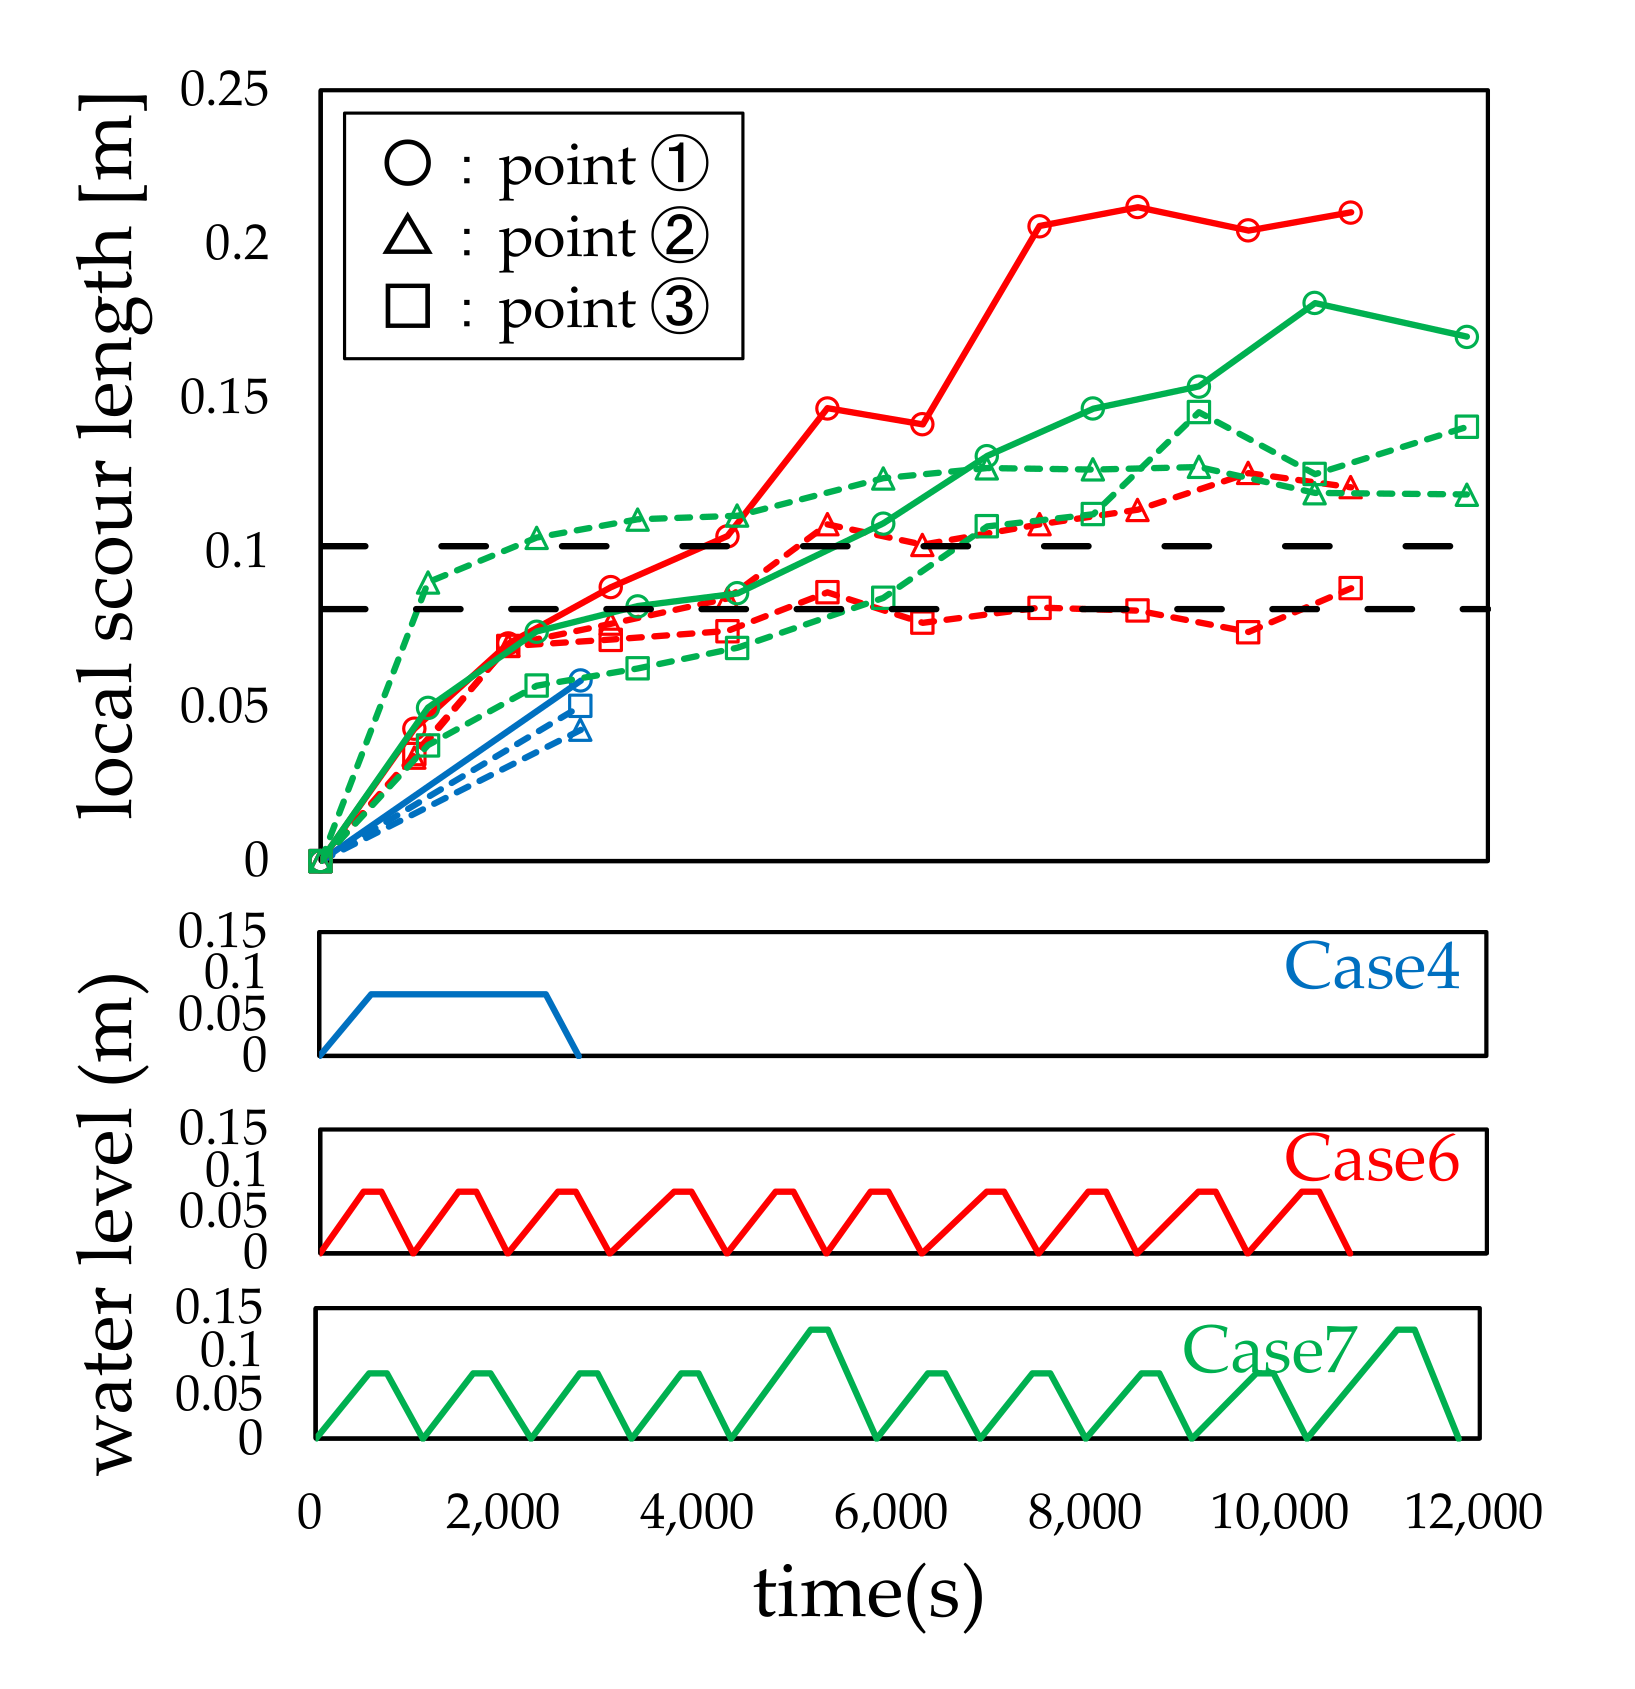
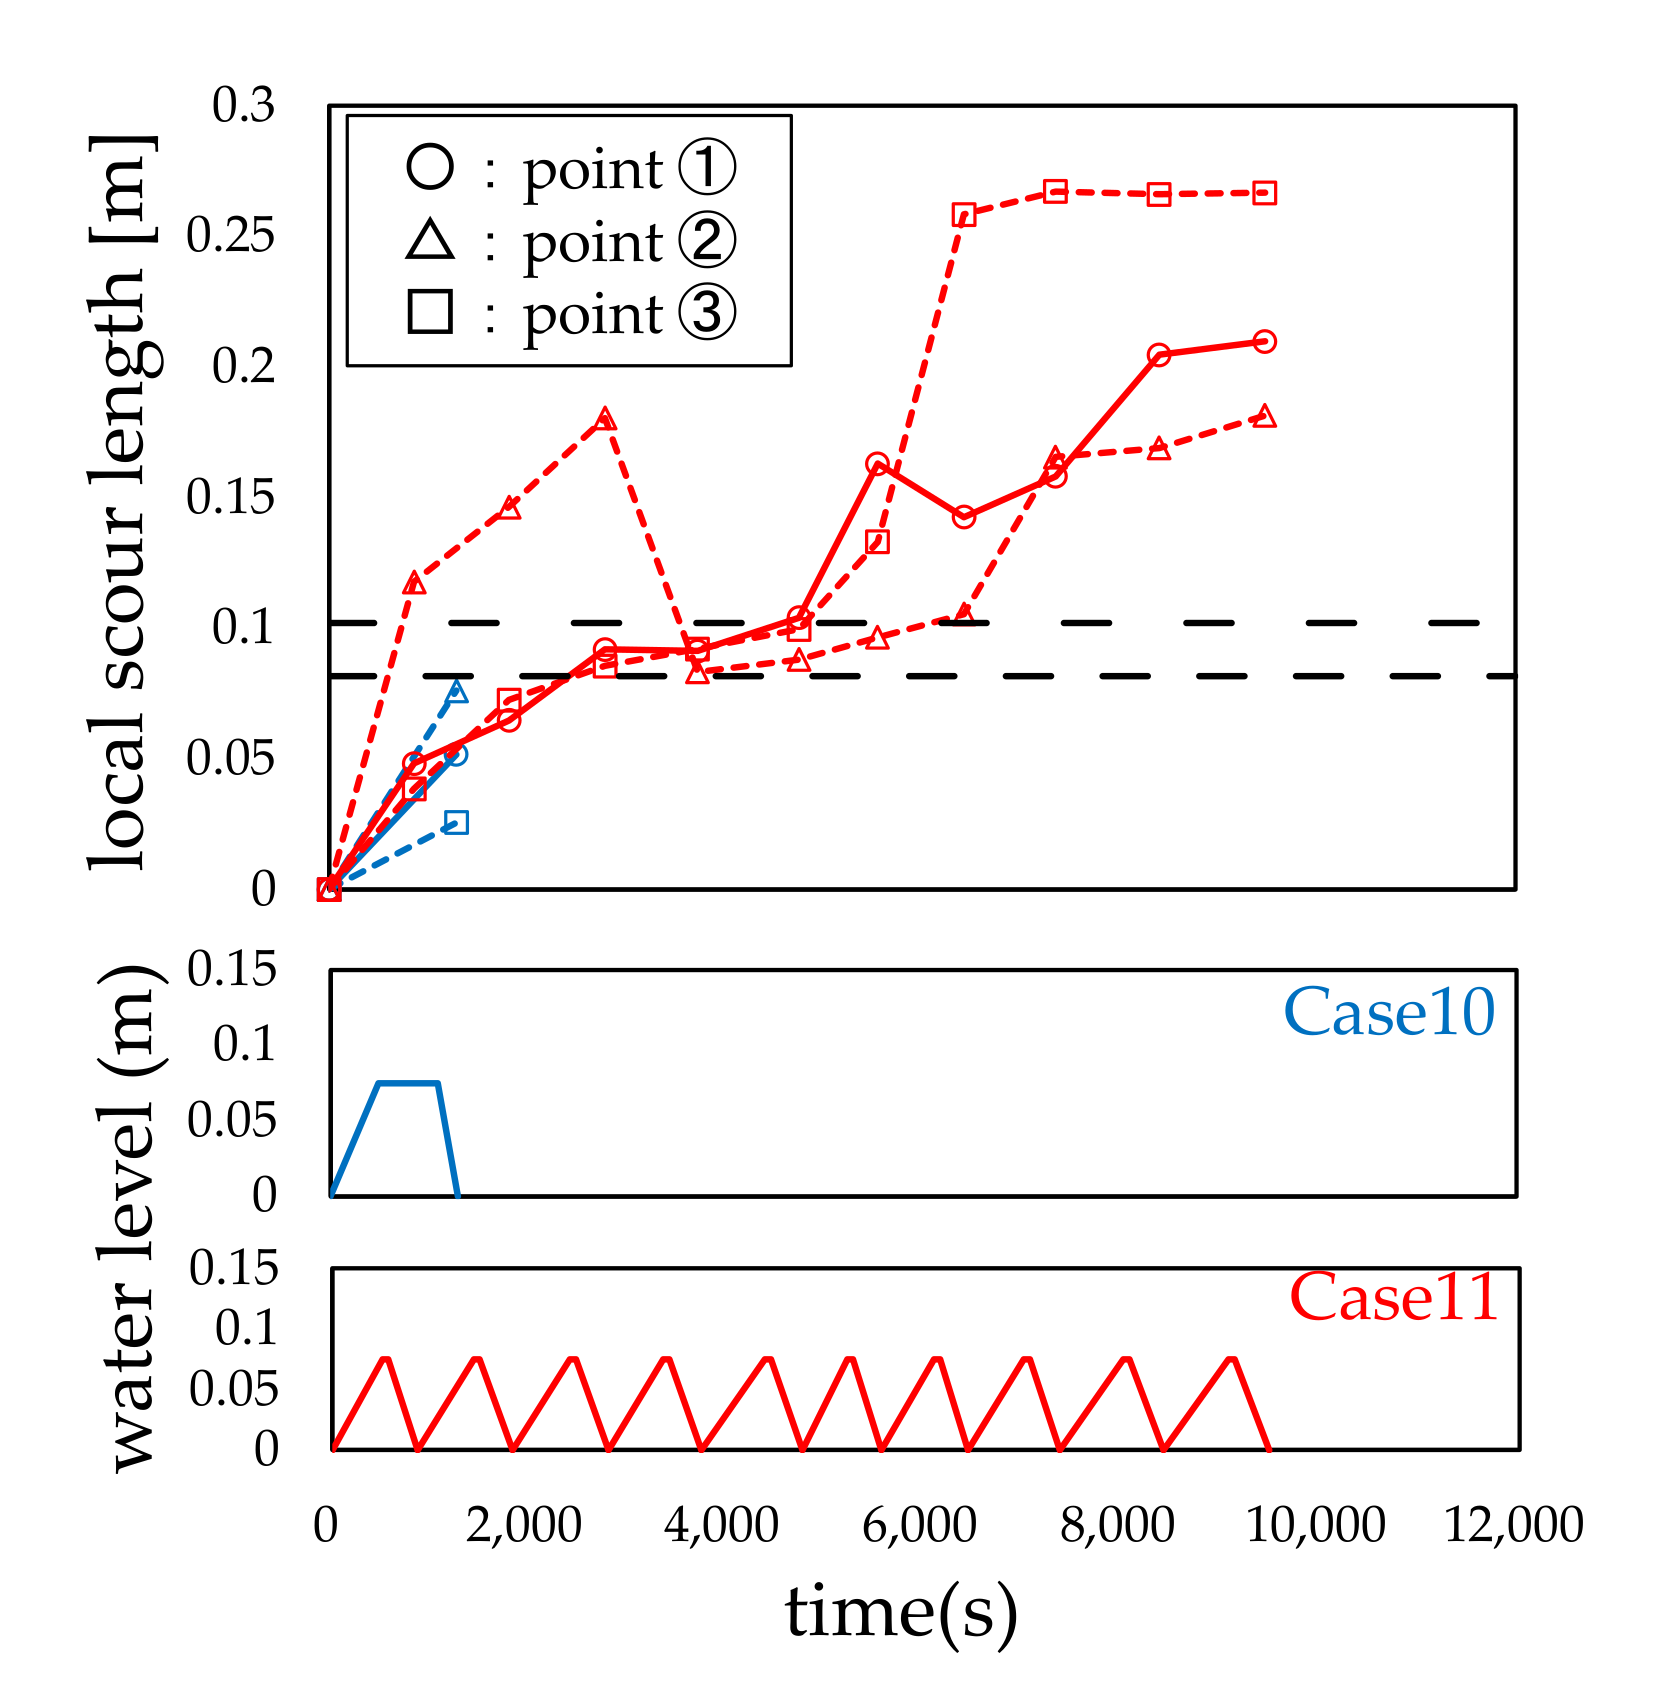
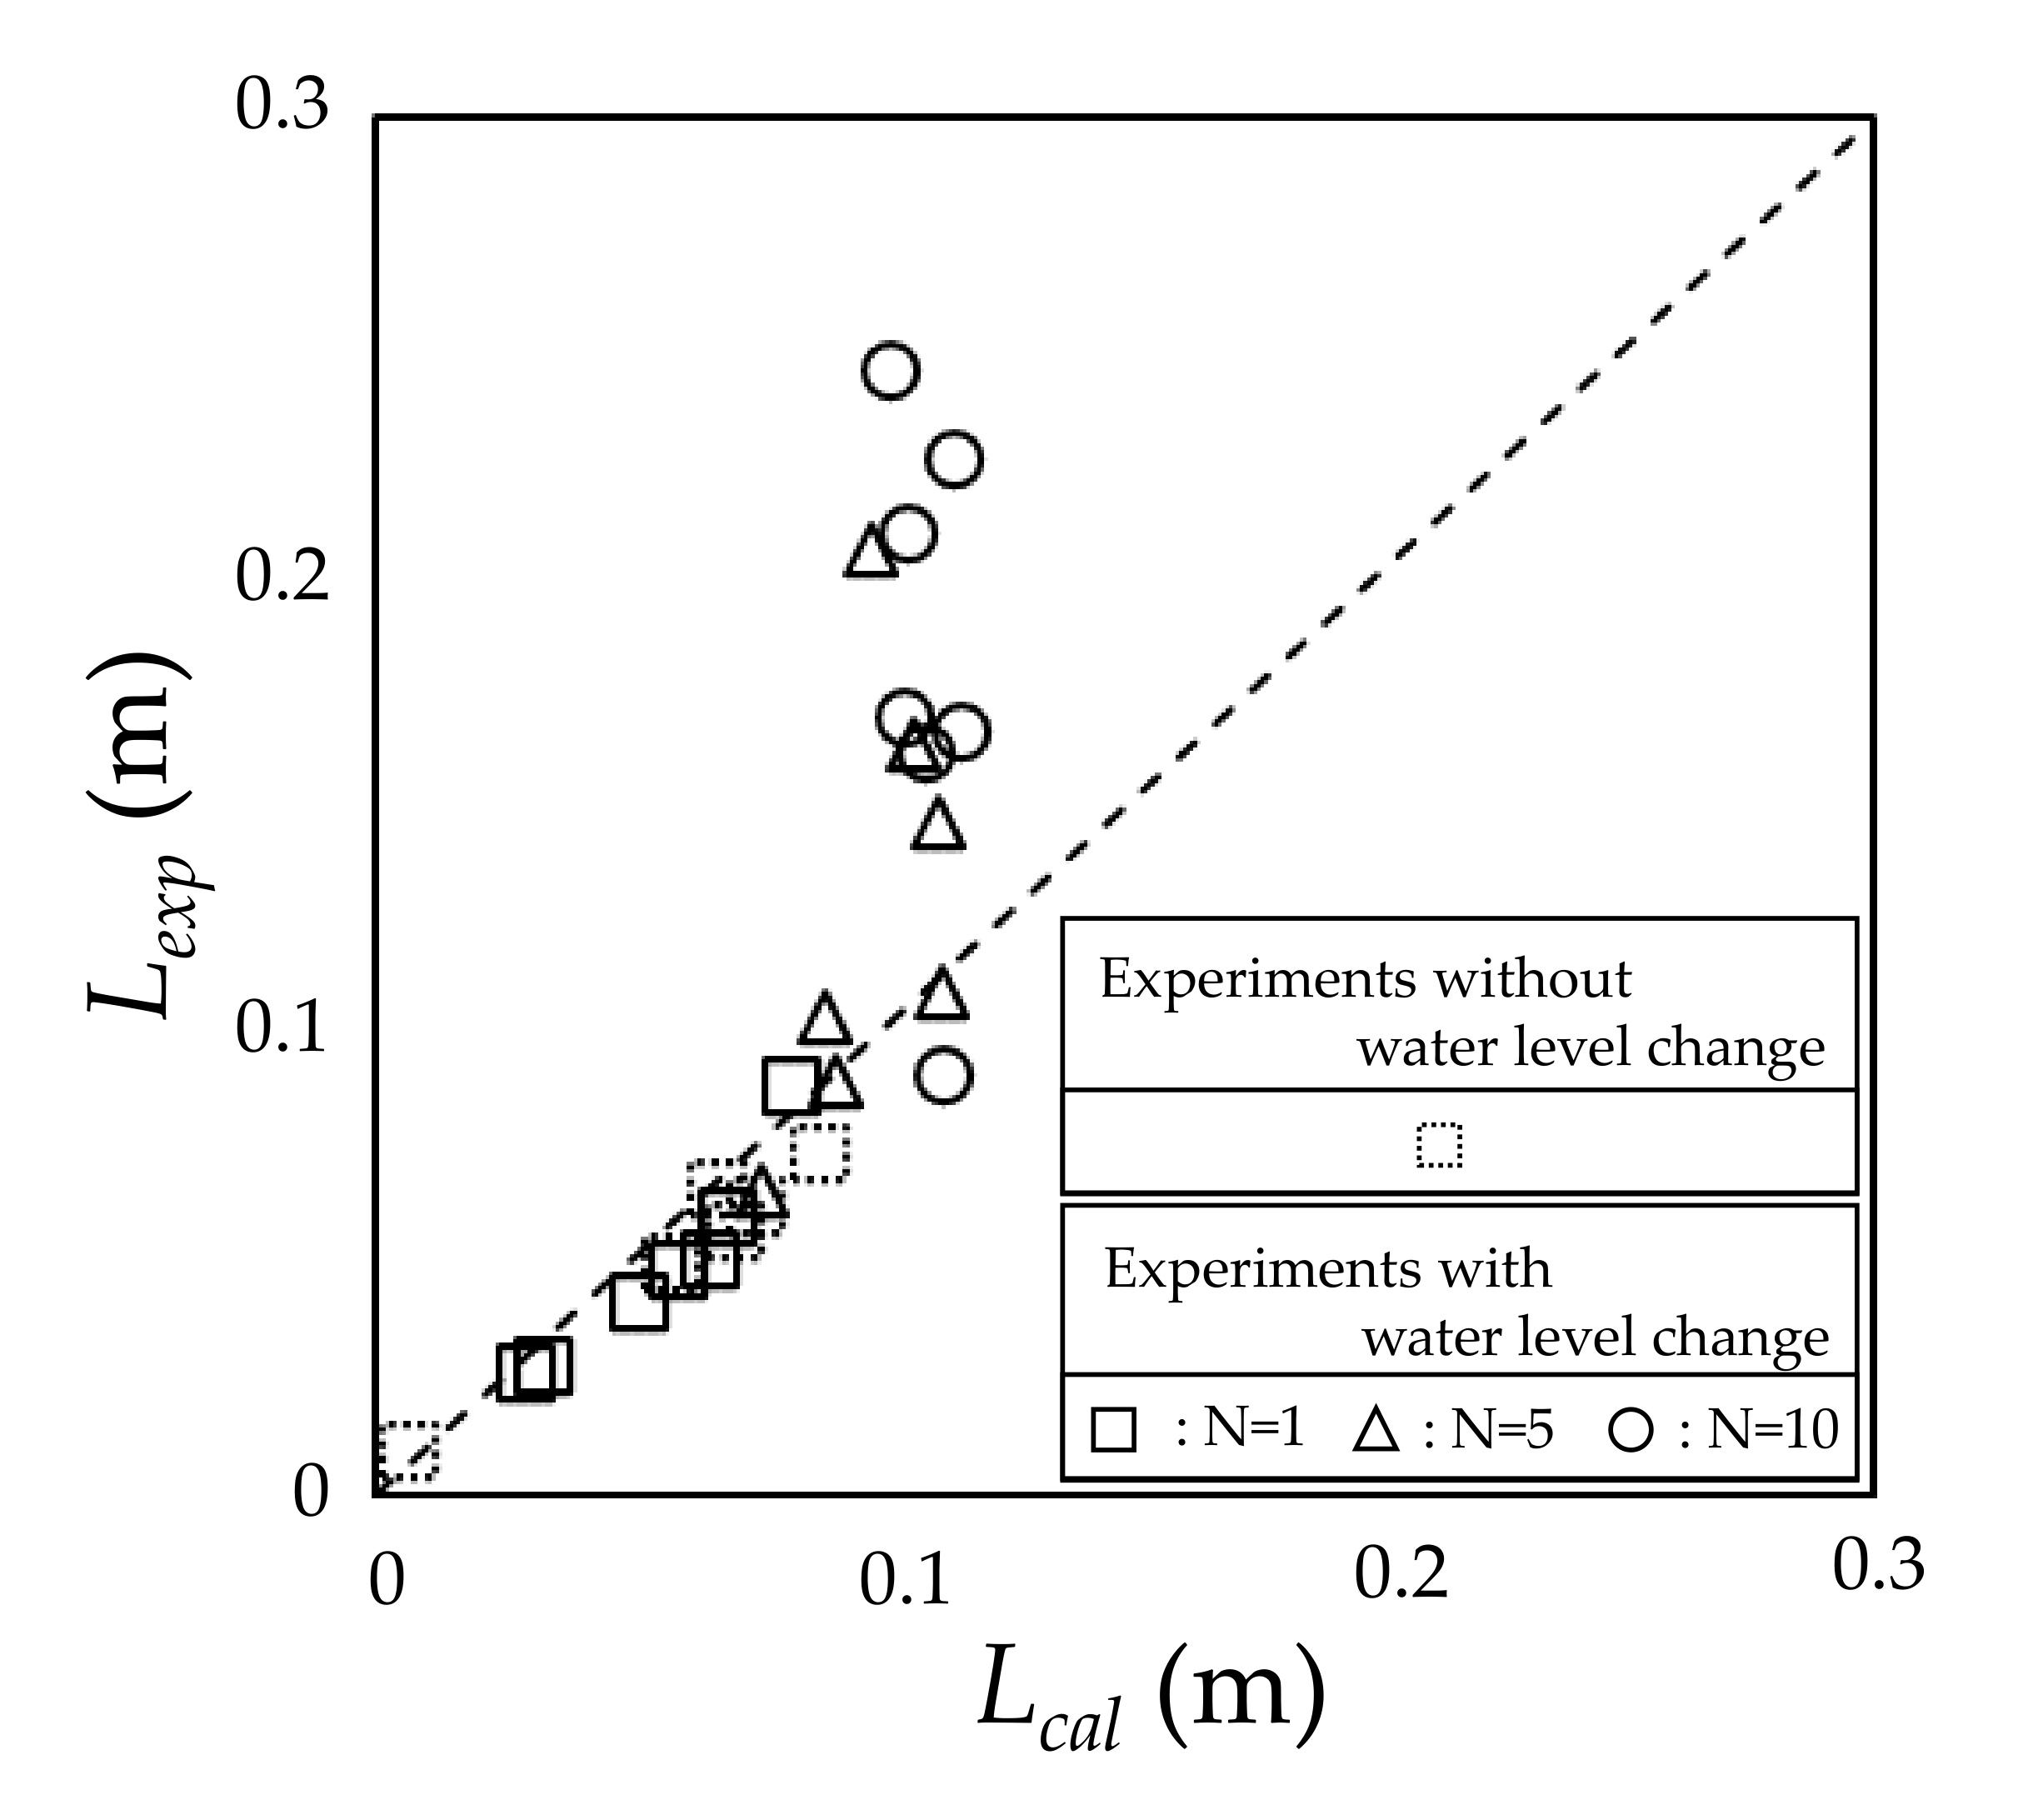
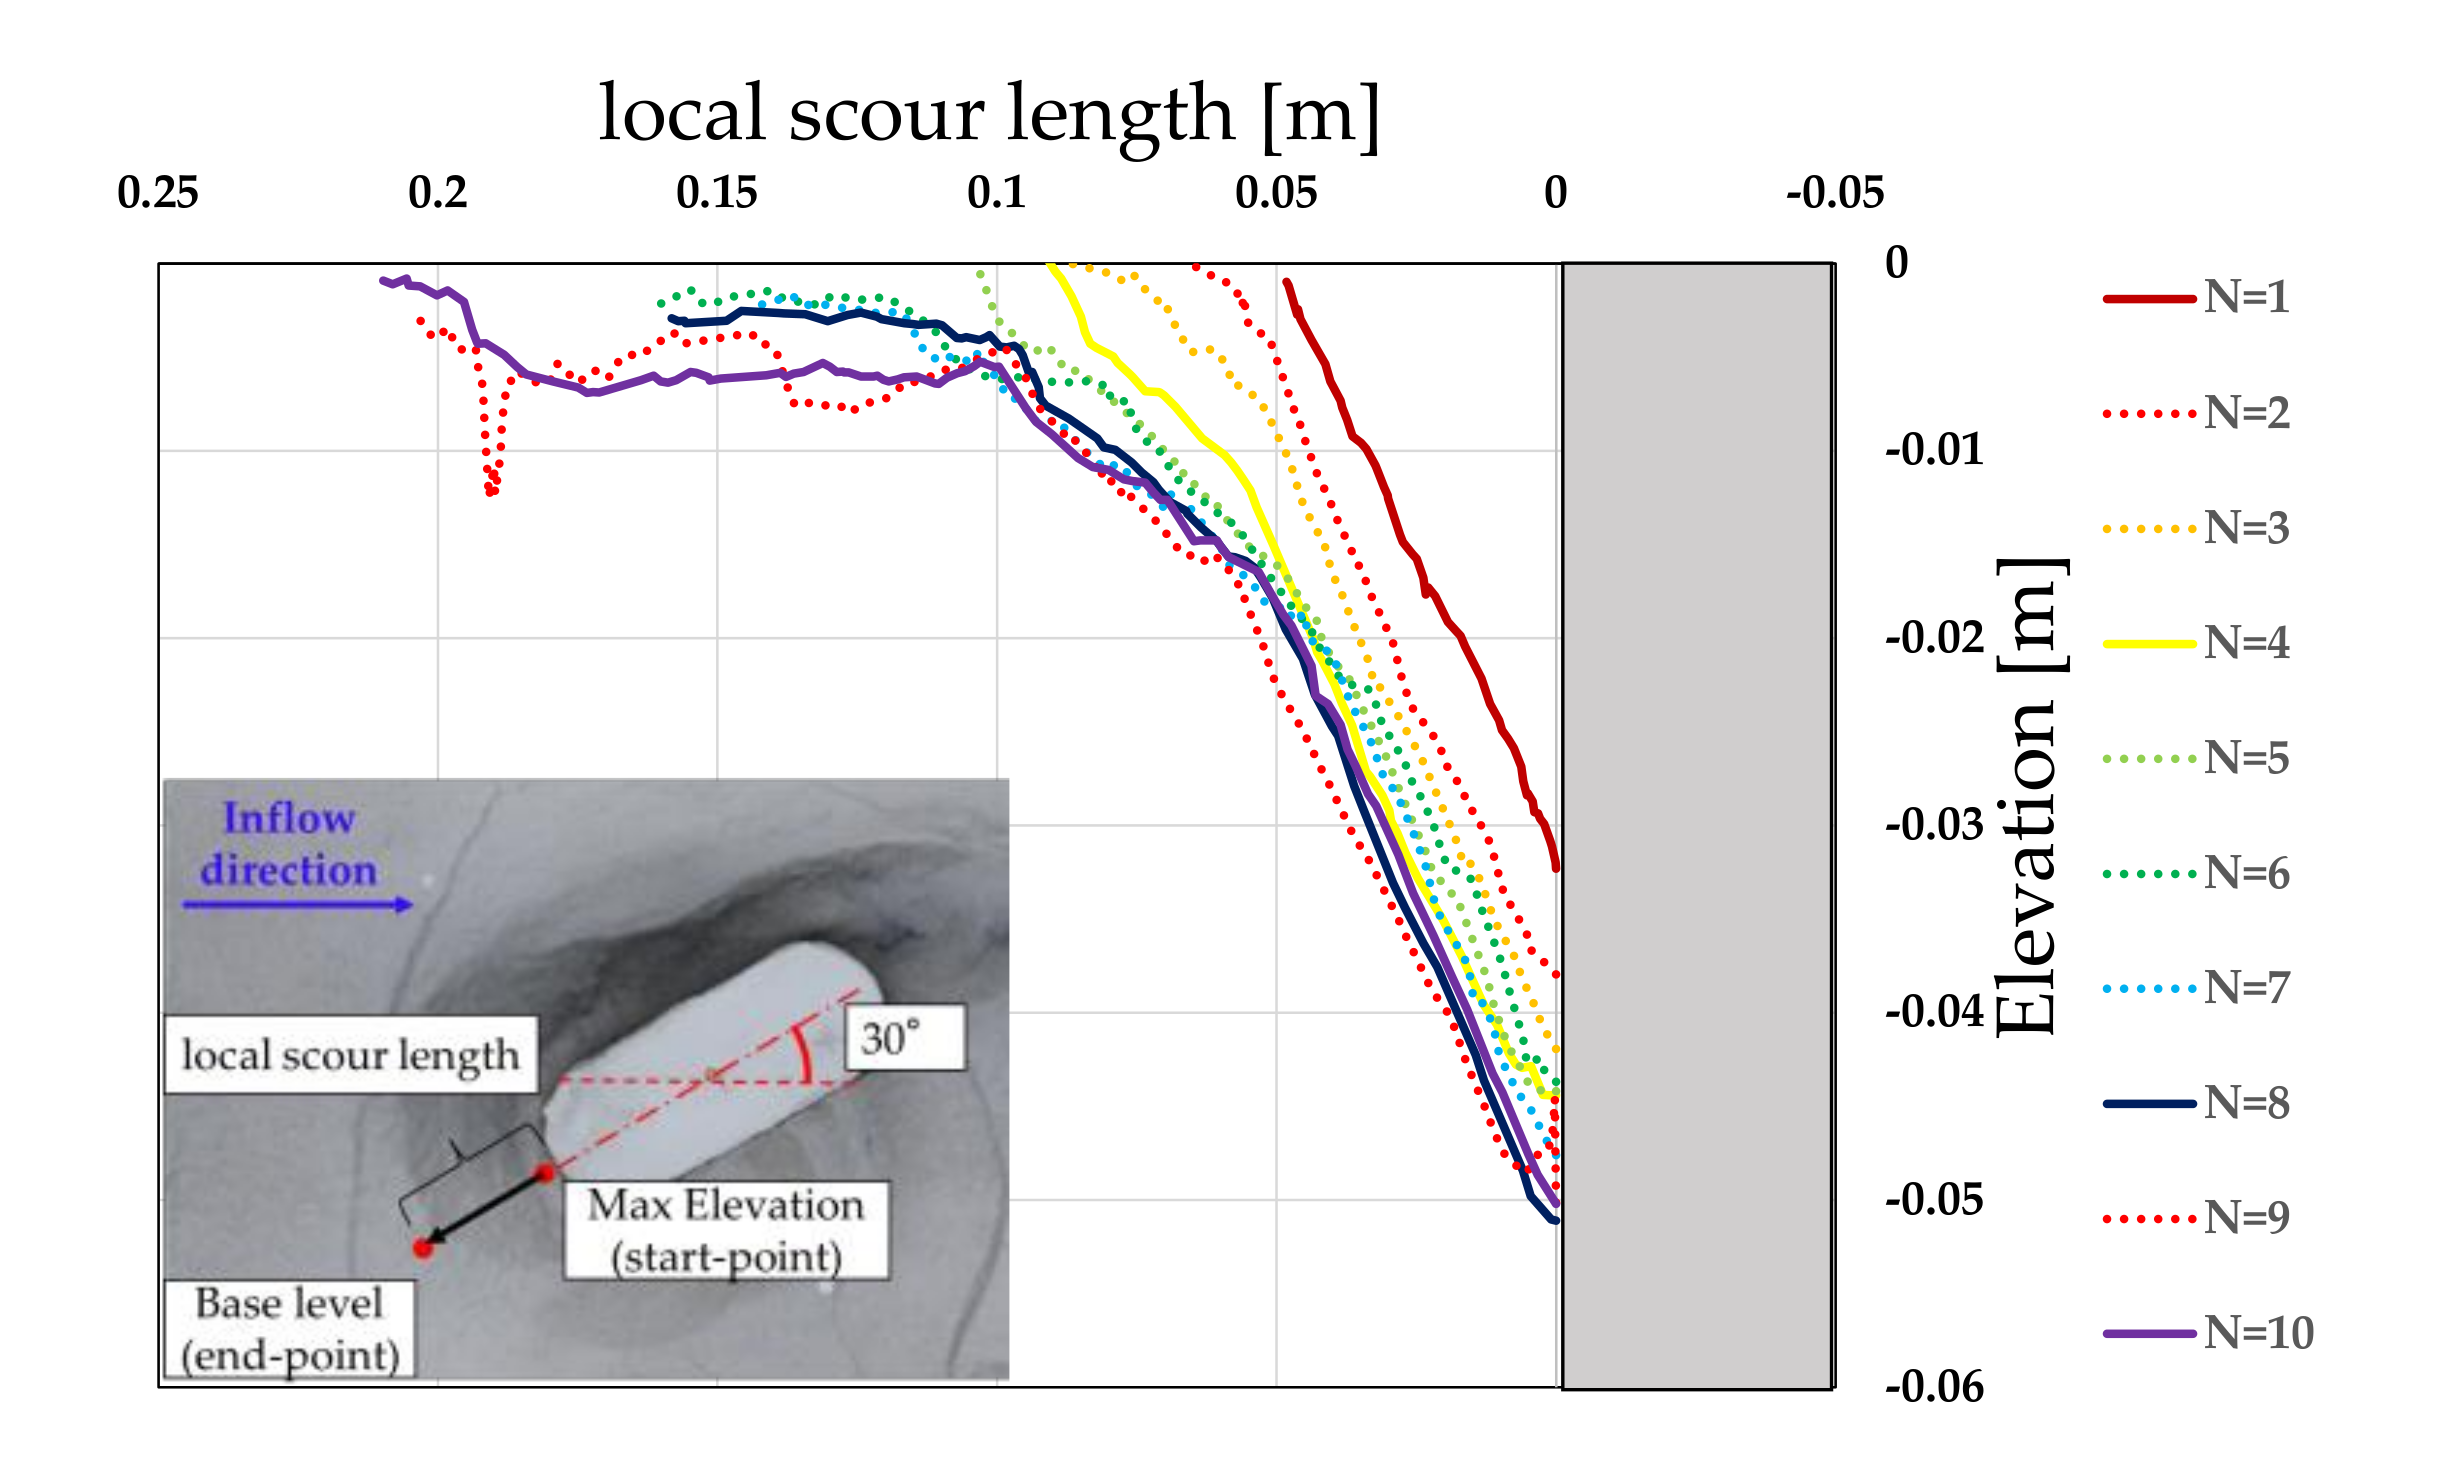
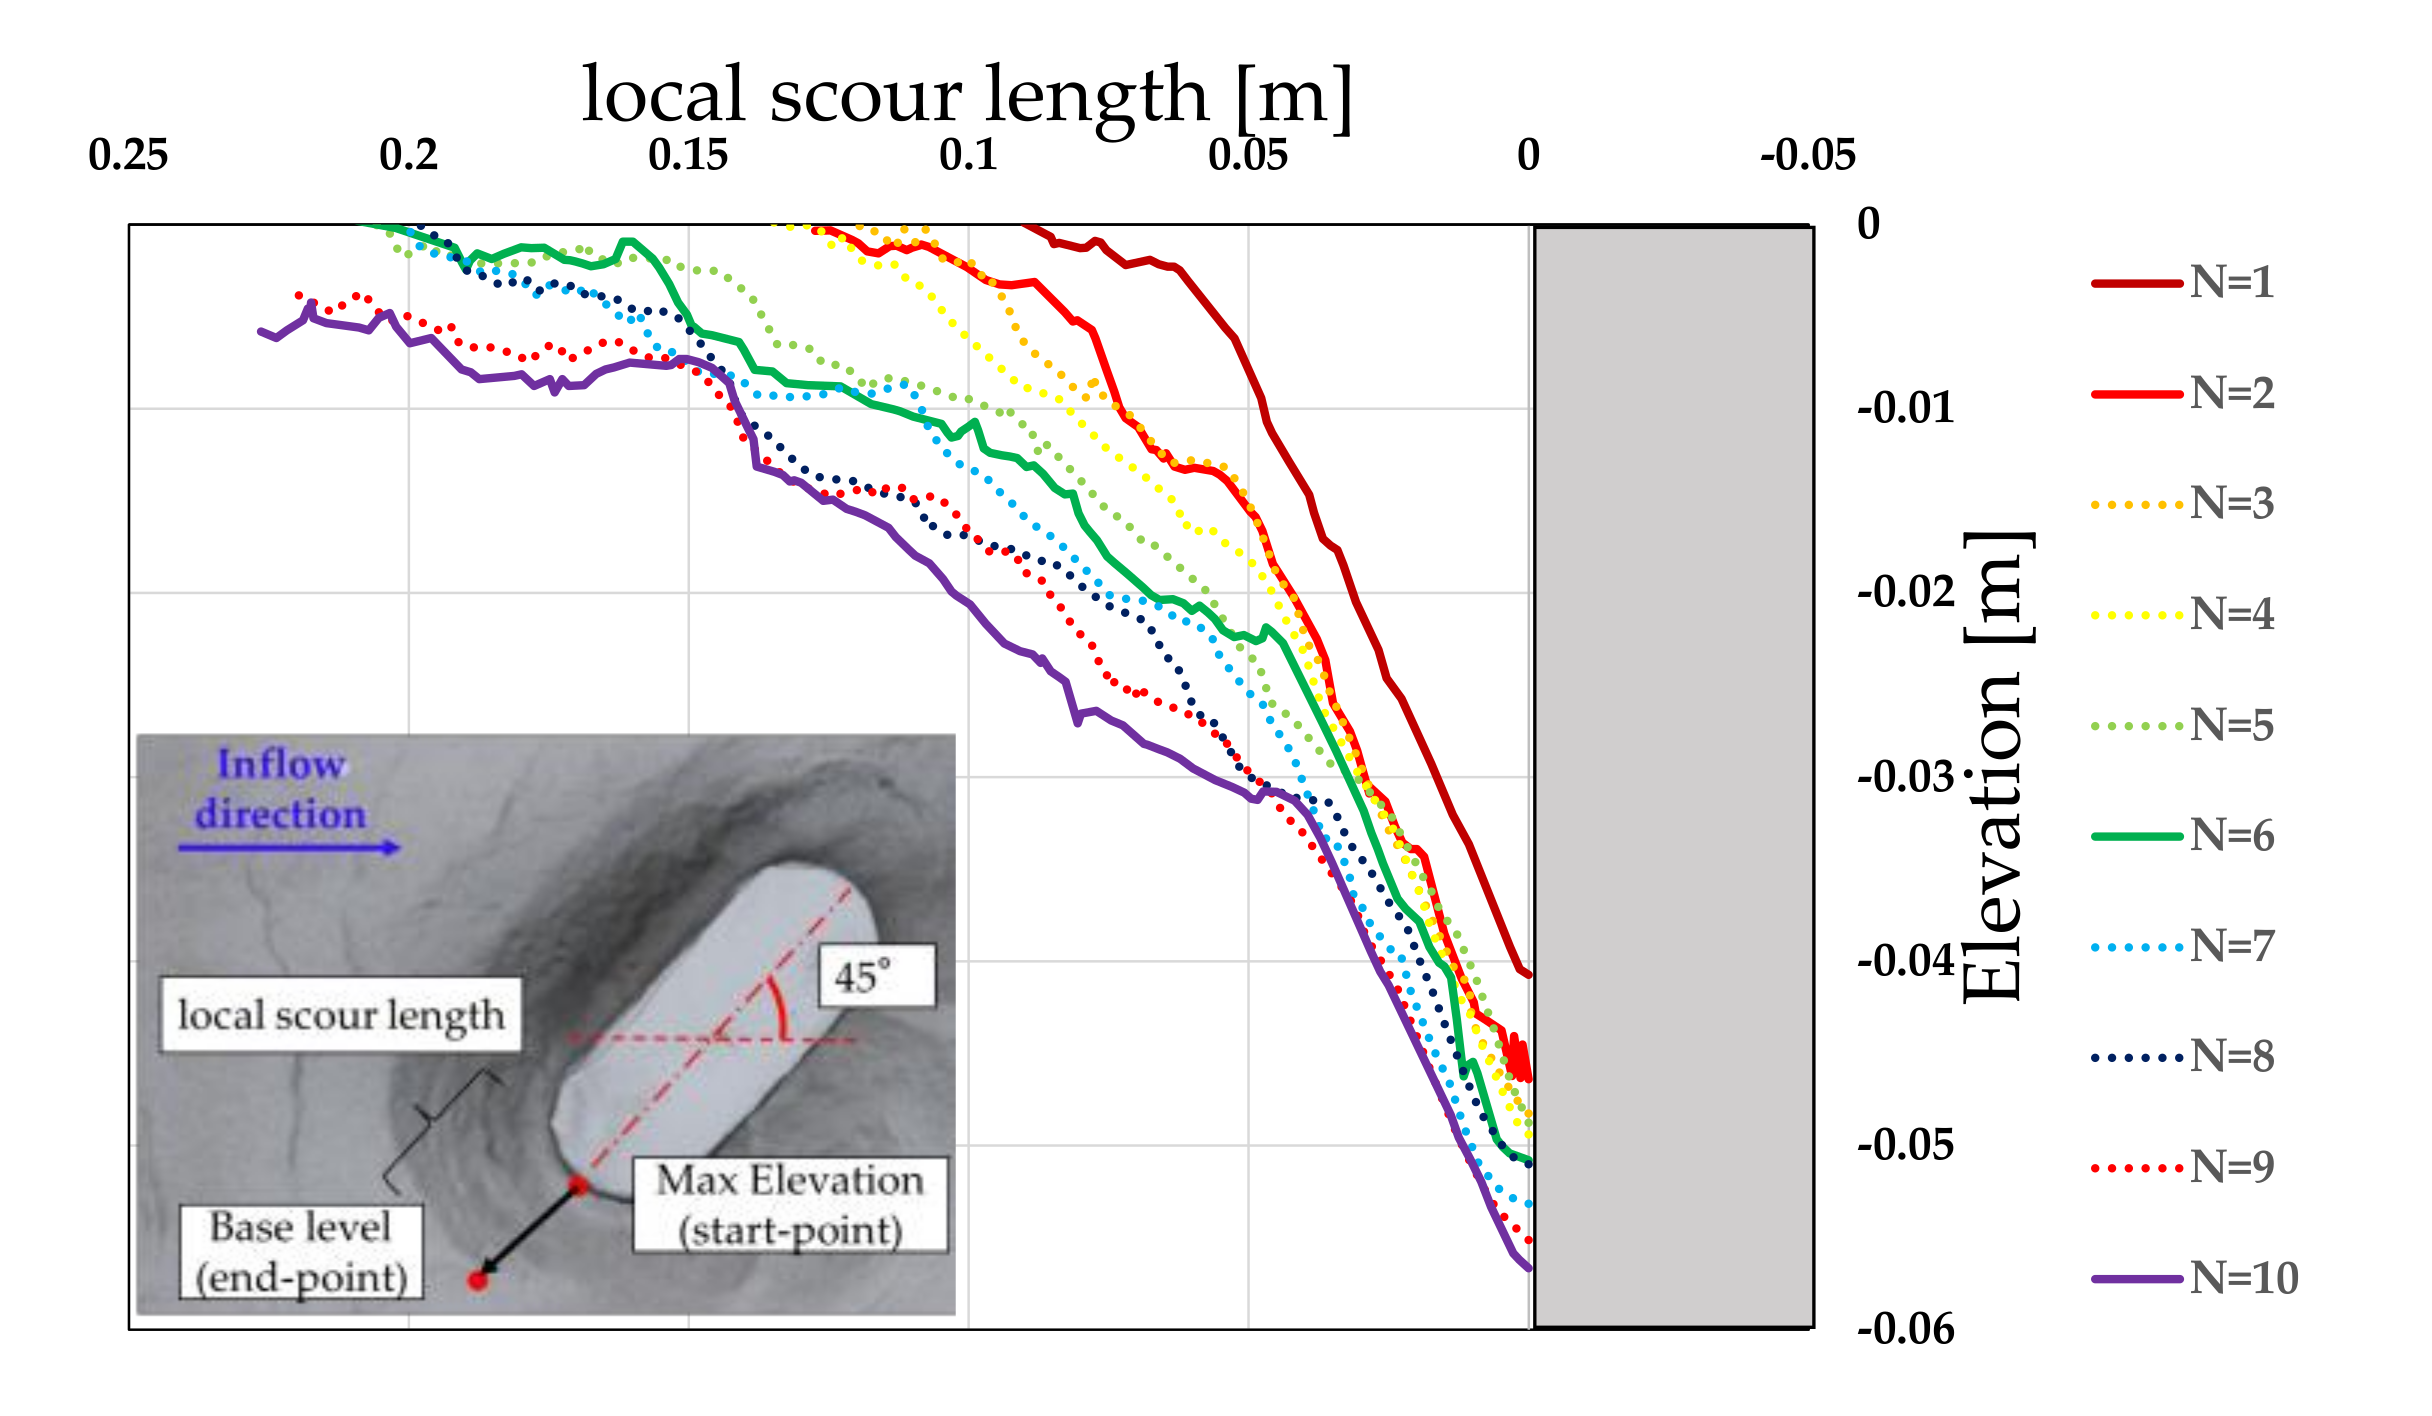
4. Effect of Water Level History and Pier Shape on Local Scour Length

Figure 13, Figure 14, Figure 15, Figure 16, Figure 17 and Figure 18 show the changes in the local scour length obtained from the experiment. The local scour extension shown in the figures is the distance from the starting point of the pier model to the point where the ground level reaches the surface of the soil layer in the measurement direction. When the height of the ground does not reach the surface of the soil layer due to erosion, the distance to the maximum value is defined as the local scour extension.
Generally, the slope of a local scour hole is formed at an angle similar to the angle of repose of the riverbed material in water [15,21]. If the distance from the edge of the pier to the outer edge of the scour hole is defined as the local scour extension Lcal, it can be expressed by the following equation [22]:
L c a l = Z tan Φ
where Z is the maximum scour depth and Φ is the angle of repose of the riverbed material.
In this study, the angle of repose in water of silica sand No. 7 was determined to analyze the effect of iterated water level history on local scour extension, and the value obtained by Equation (1) was compared with the value measured in the experiment. The angle of repose in water was determined through water immersion repose test, referring to the Sand Castle method proposed by Vaughan [23,24] and Uesaka et al. [25]. The test was iterated three times, and the average value of Φ = 26.1° was used as the angle of repose in water. From Figure 7, Figure 8, Figure 9, Figure 10, Figure 11 and Figure 12, the local scour depths at the end of the experiment were generally in the range of 40 to 50 mm, therefore the local scour extensions at Z = 40 and 50 mm and Φ = 26.1° are shown as single and double dashed lines in Figure 13, Figure 14, Figure 15, Figure 16, Figure 17 and Figure 18.
From these figures, it can be seen that the local scour length increases with the repetition of rise and fall in water level; however, it tends to converge after the seventh or eighth repetition. In most cases, the largest local scour extension was observed at point 1. In case of Type 1 model, as shown in Figure 13, Figure 14 and Figure 15, the local scour extension at points 2 and 3, which are perpendicular to the water flow, is similar to the local scour extension at Z = 50 mm and Φ = 26.1°, which was calculated from the local scour depth and angle of repose in water. In contrast, it was observed that the local scour length at point 1 was 1.1 to 1.8 times larger than that at points 2 and 3, and larger than that at Z = 50 mm, Φ = 26.1°.
Considering the experimental results of Case 8, as shown in Figure 16, it is evident that the trend of the local scour length is similar to that of Type 1 model shown in Figure 13, Figure 14 and Figure 15. When θ was set to 30° and 45°, the local scour extension at measuring point 3 was the largest, which was contrary to the other experimental results.
Figure 19 shows the relationship between the calculated value of Lcal obtained by Equation (1) using Φ = 26.1° and the experimental value of Lexp. Figure 19 shows the results for point 1, which was considered to be the most affected by the water level history, and the representative results for the first, fifth, and tenth cycle are shown for the cases with iterated water level history. Figure 19 shows that the Lcal and Lexp values are generally the same for the case where the water level does not rise and fall iteratively and for the first repetition. This indicates that the slope of the local scour hole and straight line connecting the start and end points of the local scour length were approximately equal to the angle of repose in water. In addition, Figure 19 shows that Lexp is larger than Lcal at the end of fifth and tenth repetitions. This indicates that the angle of the straight line connecting the start point and the end point of the local scour length is smaller than the angle of repose underwater at the end fifth and tenth repetitions.
From the aforementioned results, it can be observed that the local scour length increases with the repetition of the water level change for Type 1 and Type 2 models installed at θ = 0° with the river flow center. However, the increase tends to converge after the seventh or eighth repetition. In the case of θ = 0° for the Type 1 and Type 2 models, the local scour length at measuring point 2 and length at measuring point 1 was approximately 1.5 times longer than that calculated by Equation (1). The local scour length of the Type 2 model with an angle to the river flow center increased to the largest at measuring point 3, and was also larger than the local scour length calculated by Equation (1) for measuring point 1 and 2.
In other words, the local scour length may increase with the repetition of the water level history of the river, which can be obtained from Φ and the maximum local scour depth.

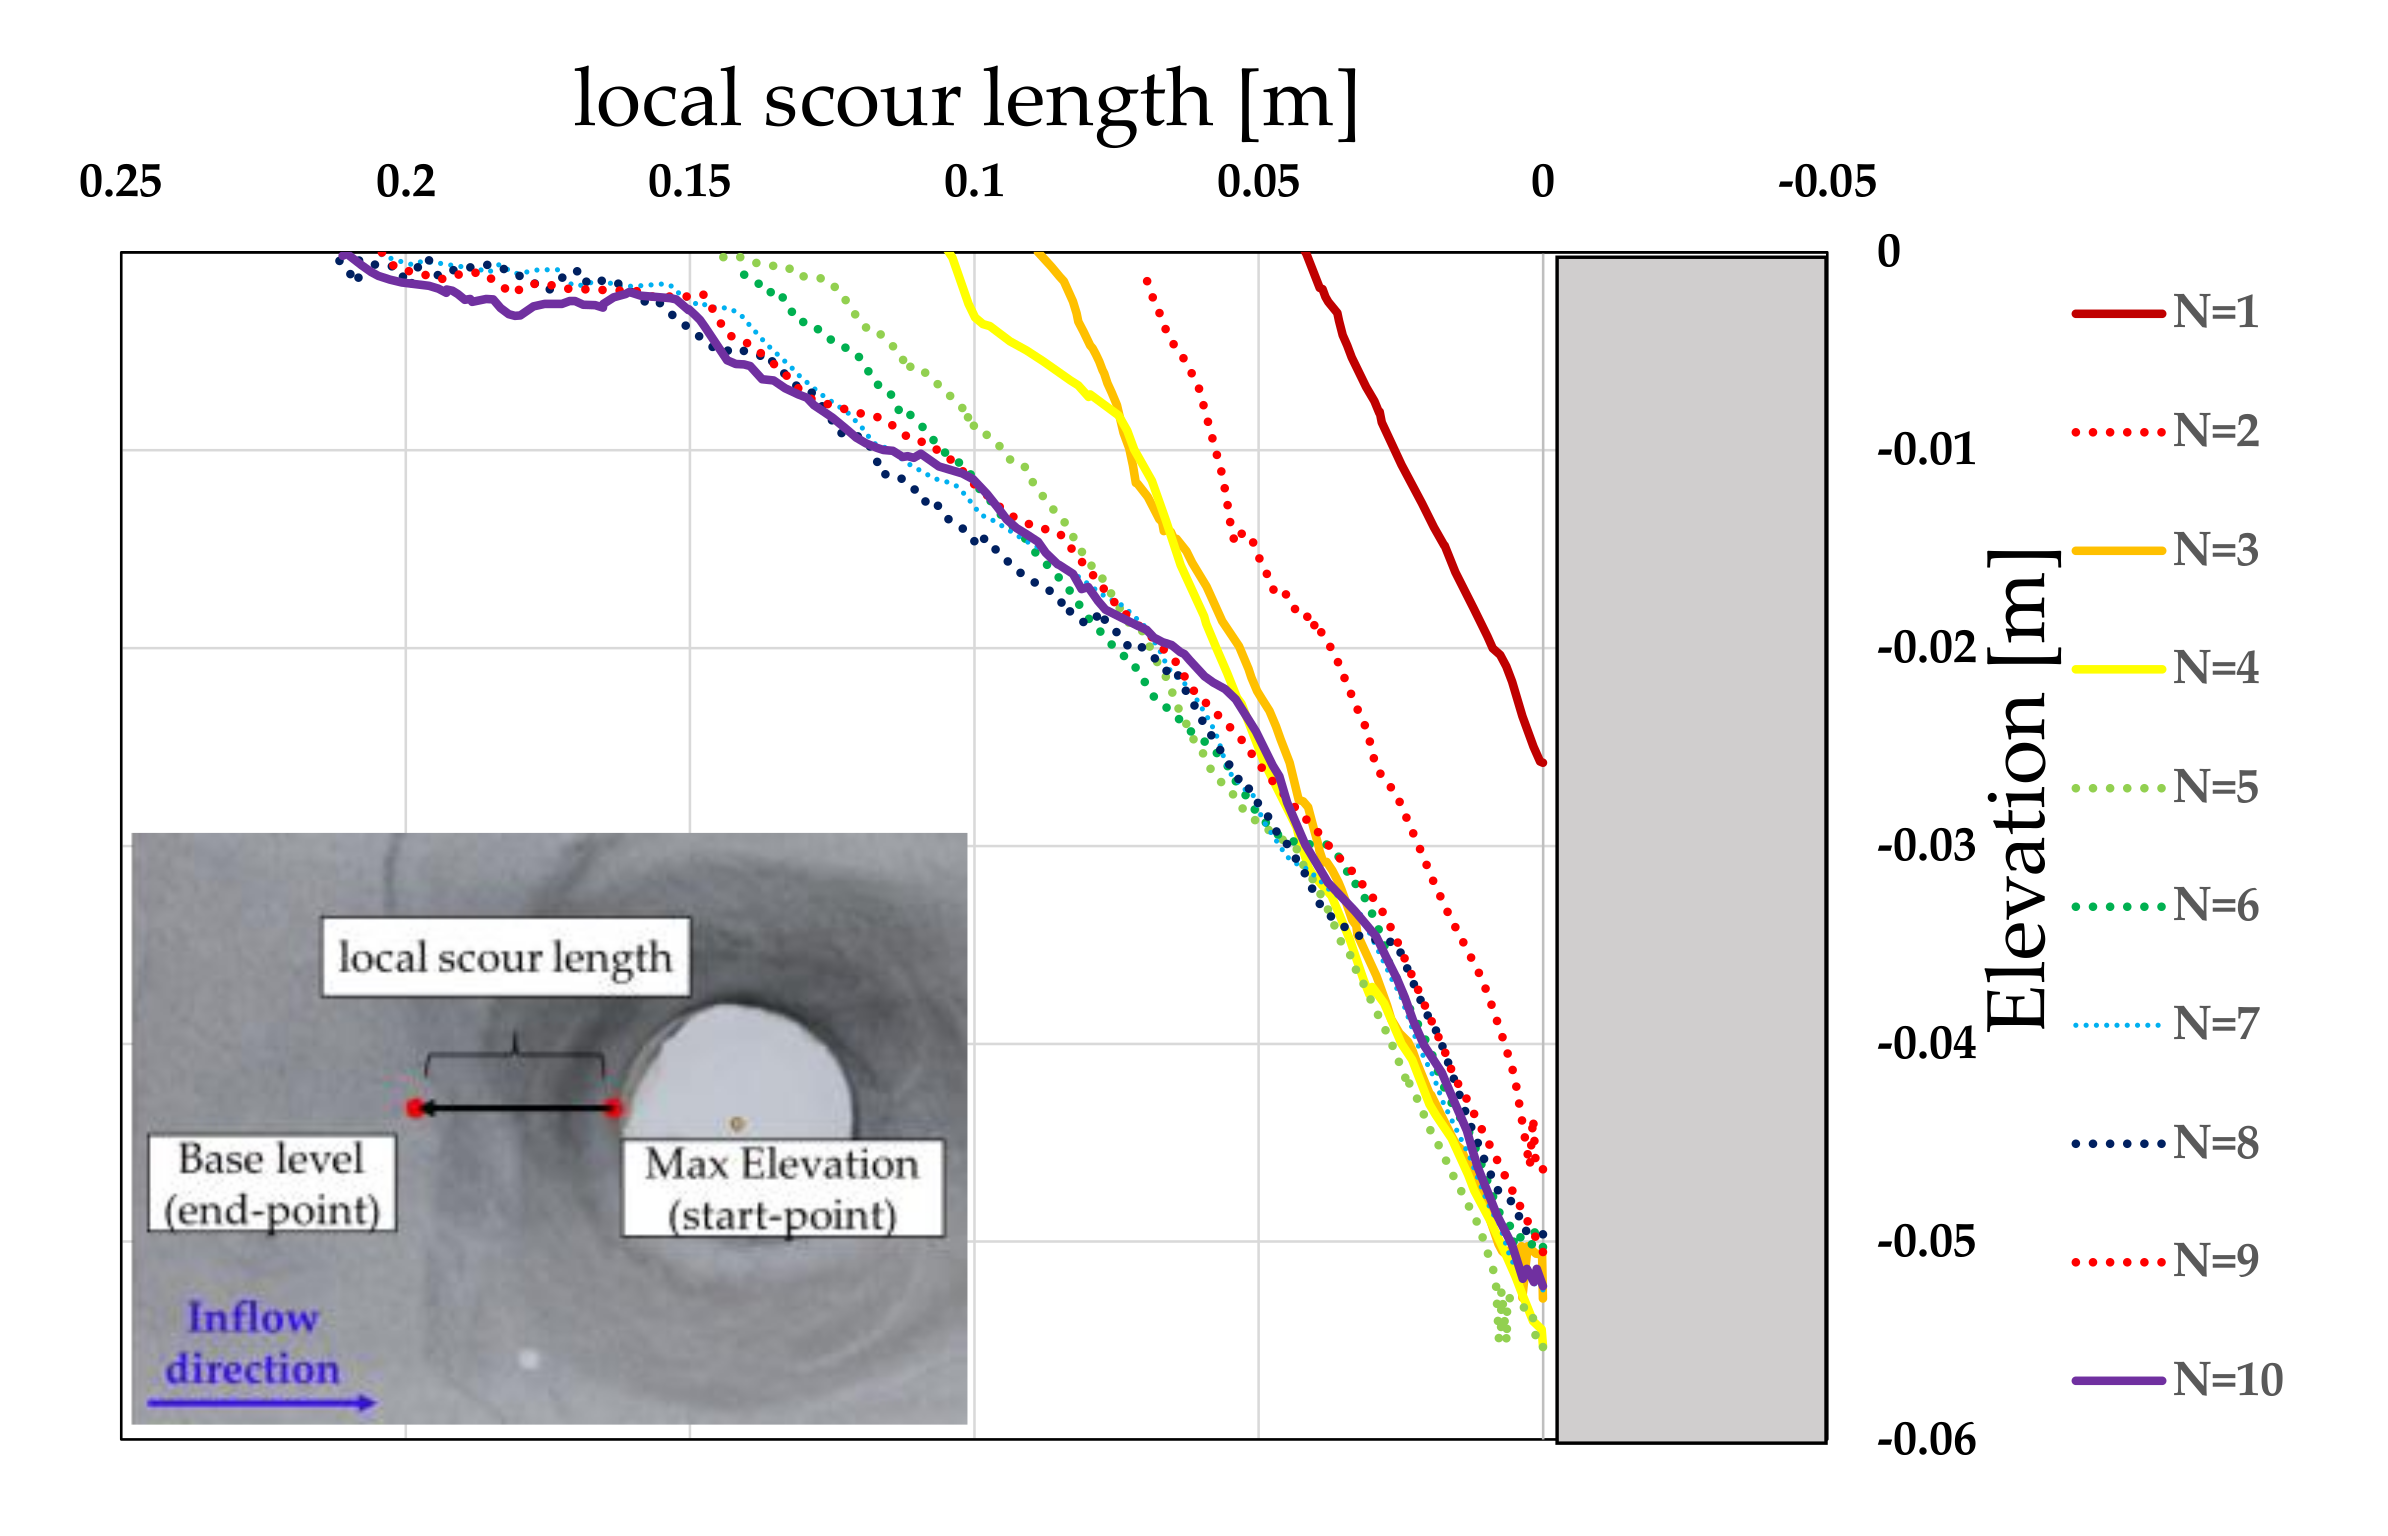
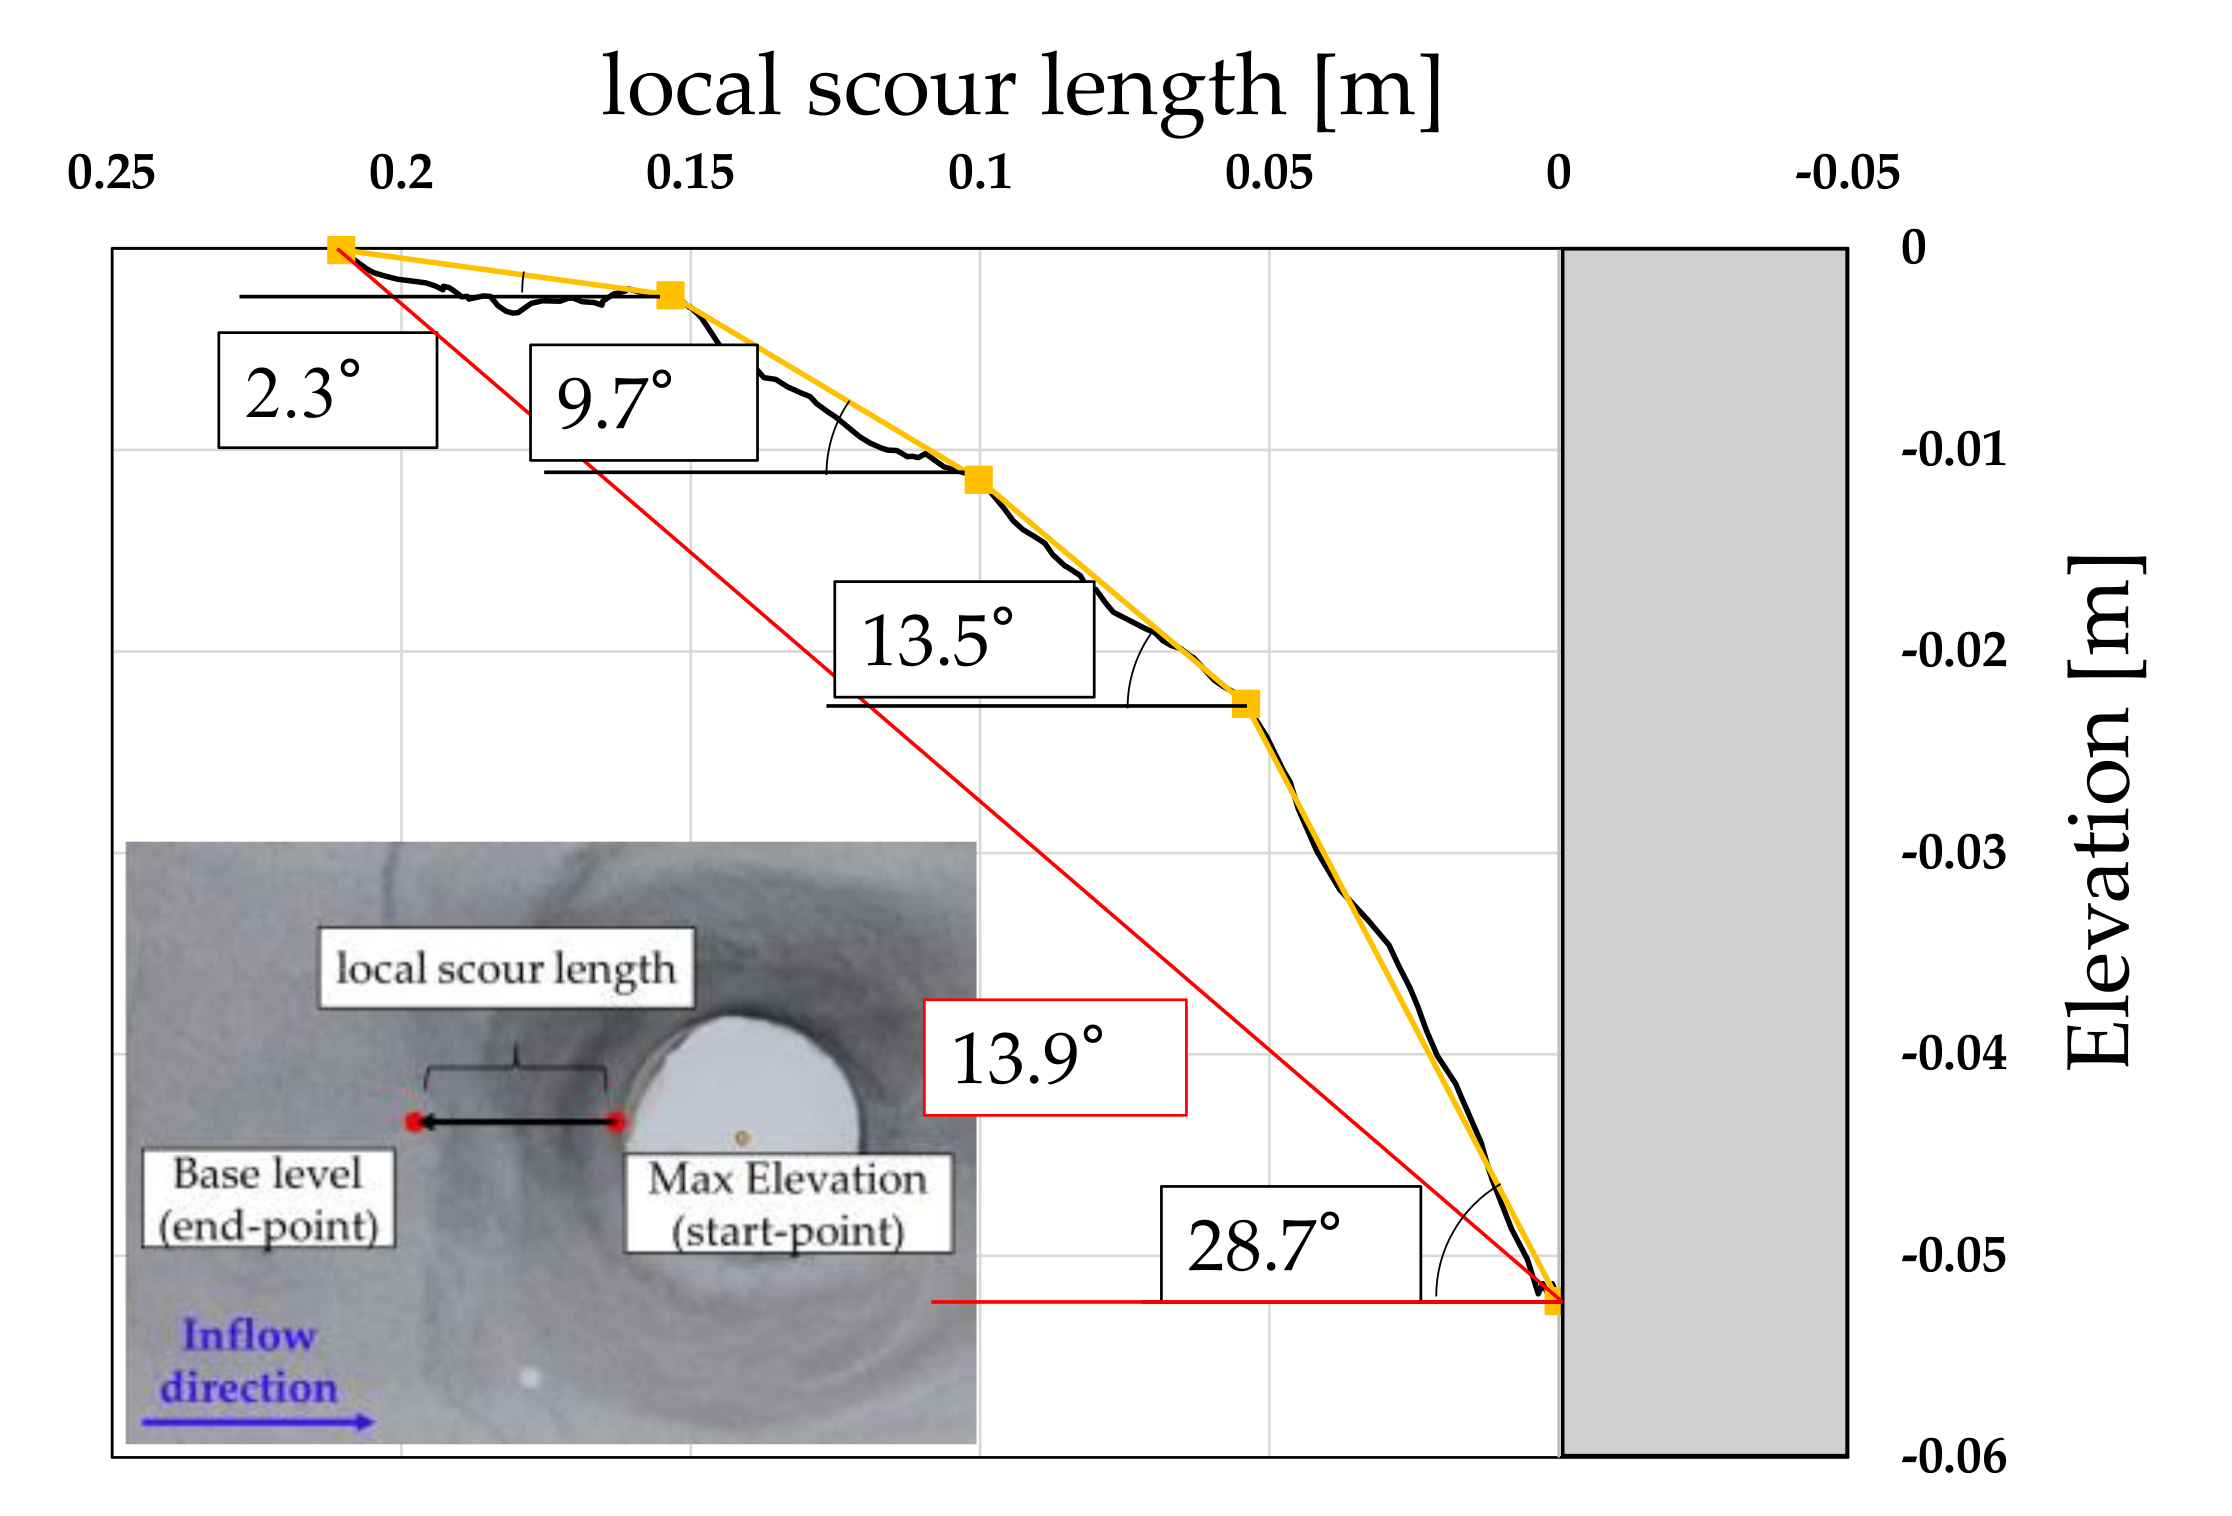
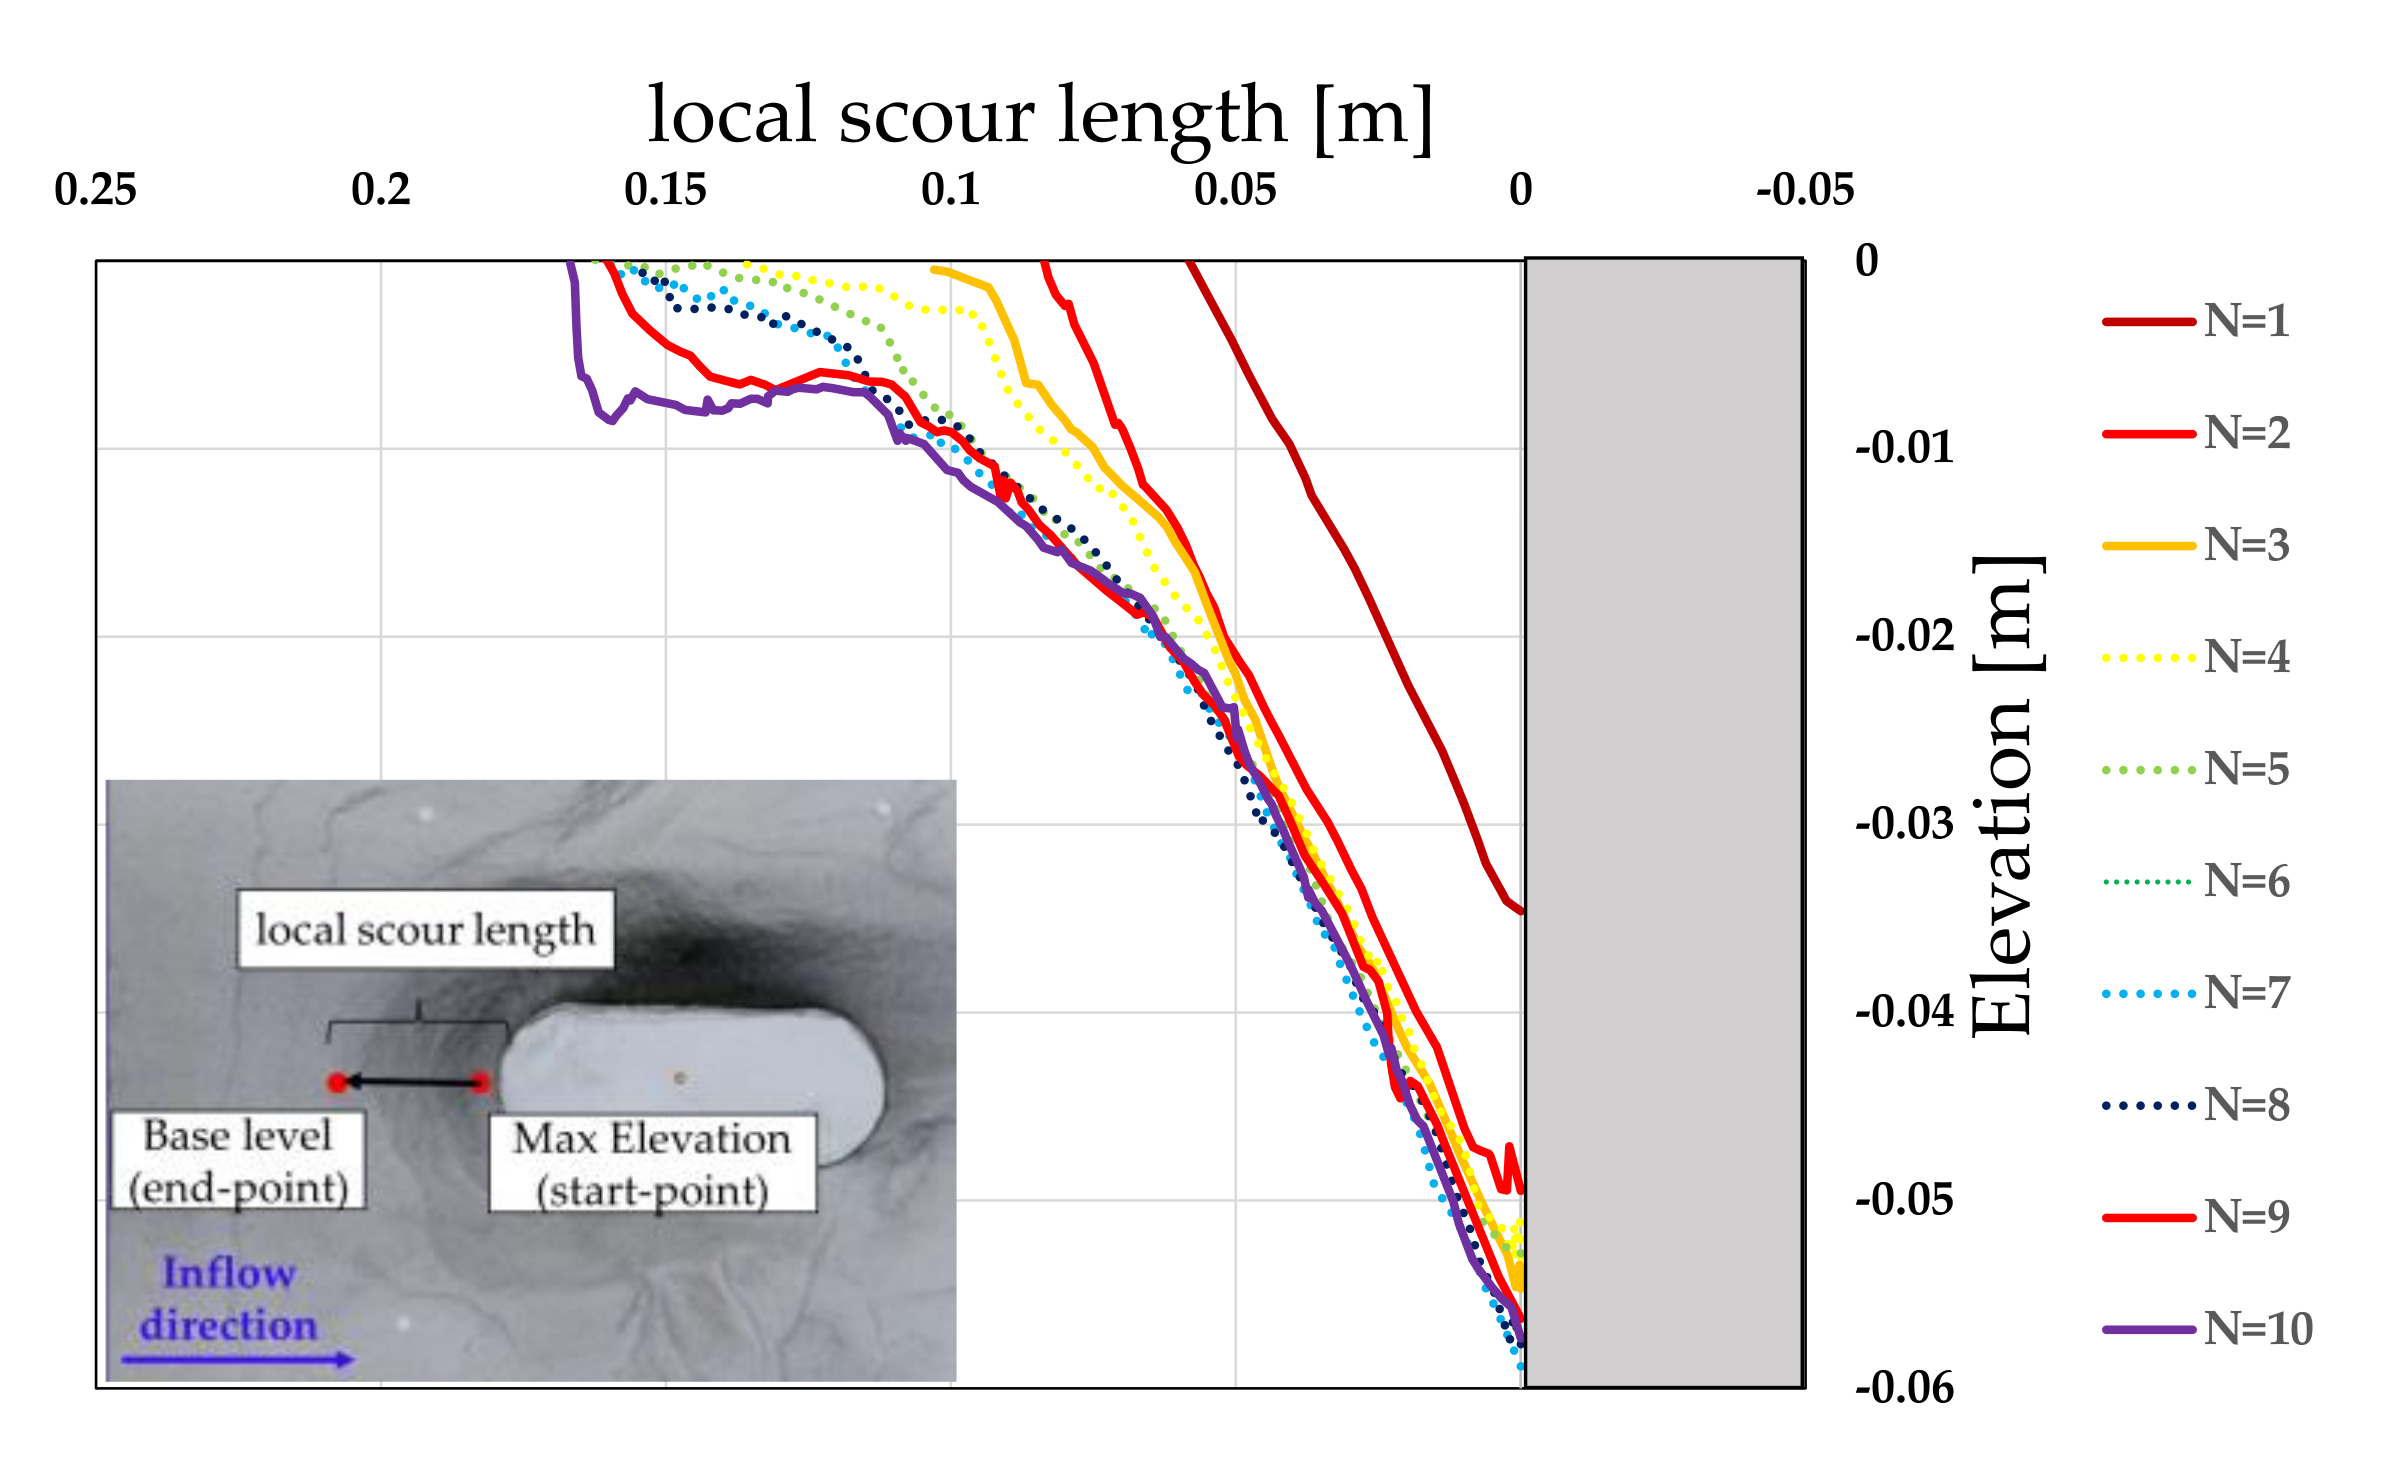
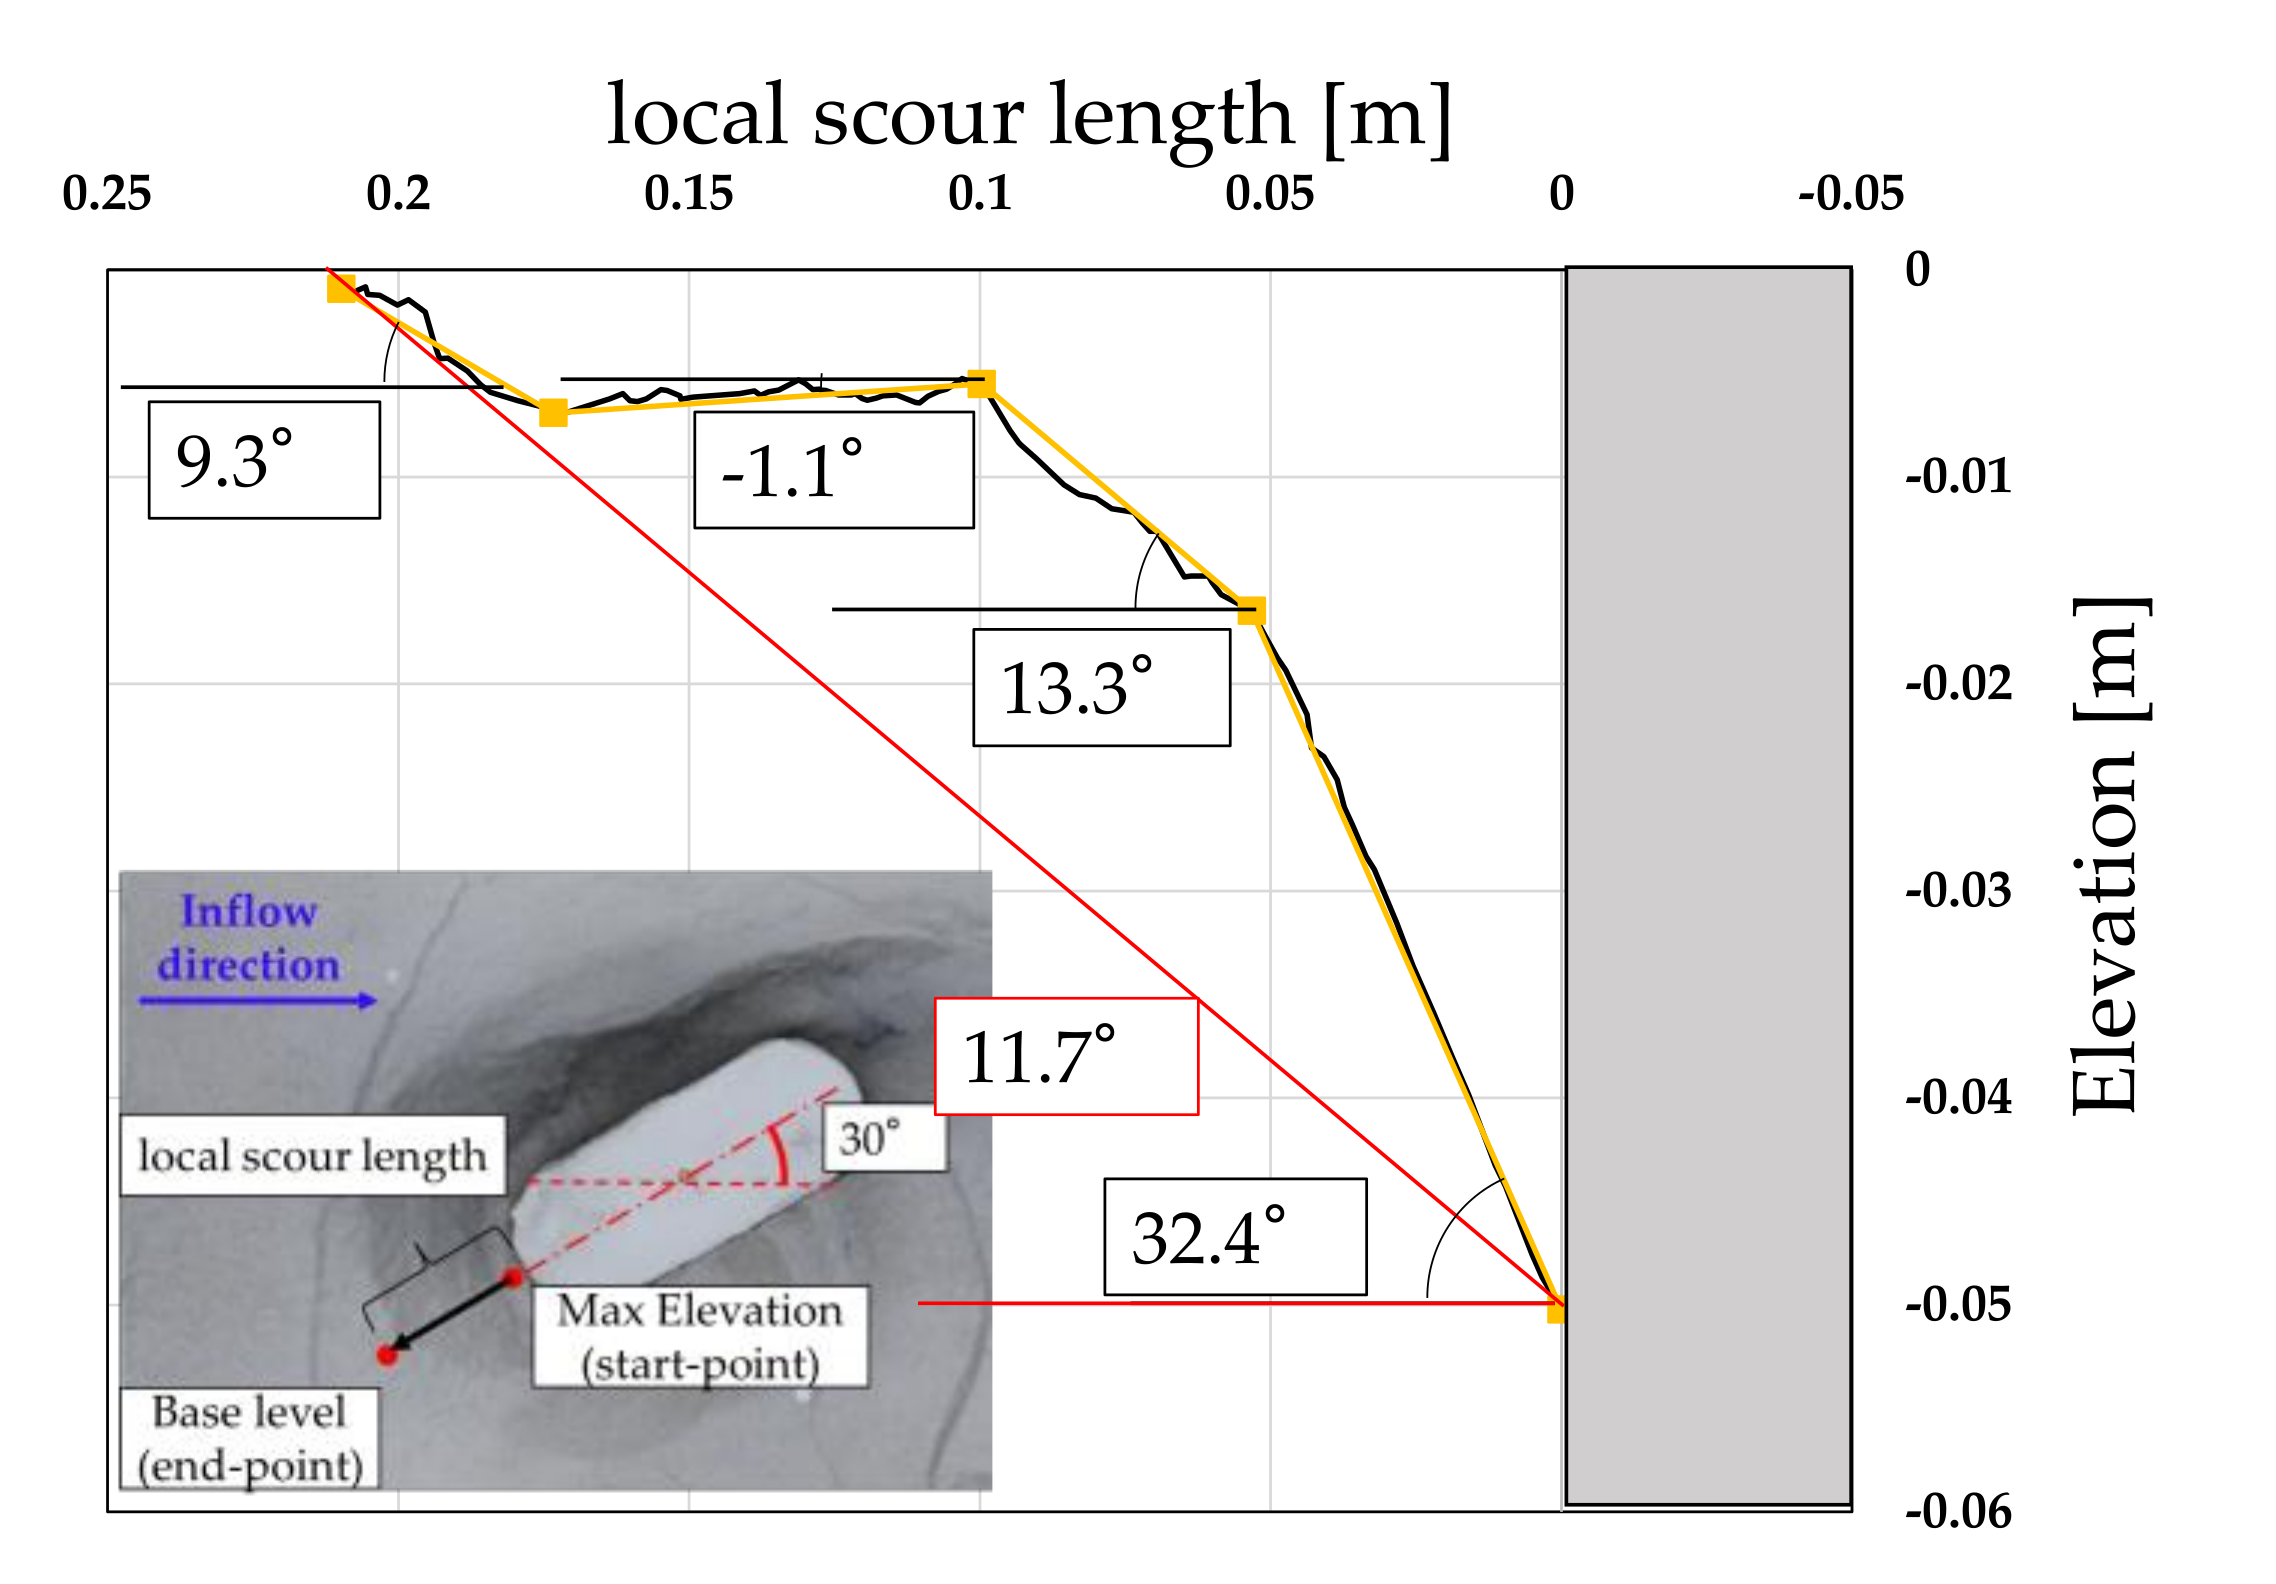
5. Effect of Water Level History on the Cross-Section of Local Scour Hole

5.1. Type 1 Model

Figure 20 shows the evolution of the cross-sectional shape of the local scour hole upstream of the pier model in Case 6. It can be observed that the shape of the local scour hole increases as an inverted cone from the first to third repetition for Type 1 model. The results were consistent with the previous studies [3,26]. From the fourth to sixth repetition, the erosion of the surface layer progressed as if the upper part of the local scour hole, which had developed as an inverted cone by the third repetition, was removed. Furthermore, from the seventh to the tenth repetition, in addition to the local scour hole formed by the sixth repetition, the surface of the soil layer was further eroded. Figure 21 shows a detailed view of the upstream scour cross-section of Case 6 at the end of the tenth iteration. The broken line in this figure shows an approximation of the actual local scour hole at a point where the angle changes significantly. It can be seen that the initial slope angle of the local scour hole changed to 28.7°, 13.5°, 9.7°, and 2.3° with increasing local scour. The slope near the maximum scour depth was approximately the same as the angle of repose in water. The slope angle at the top of the local scour hole was smaller than the angle of repose in water, and the angle decreased as the slope moved upward. The red line in Figure 21 shows a straight line connecting the beginning and end of the local scour extension having an angle of 13.9°. The local scour length can be calculated from Equation (1) using the angle of repose of the riverbed material in water, Φ. However, Figure 21 shows that when the local scour length was calculated through Equation (1) under the condition that the water level iteratively rises and falls in Case 6, the angle of the straight line connecting the start and end points of the local scour length, 13.9°, was used instead of the angle of repose in water (26.1°). Further, the actual local scour extension in Case 6 was approximately twice as long as the local scour extension calculated using the angle of repose in water. The same tendency was observed in Cases 2 and 7, where the water level history was iterated using Type 1 model.
In summary, when the local scouring progresses under the condition of iterated rise and fall of the water level for Type 1 model, a deep zone of the local scour hole, which has a slope gradient similar to the repose angle in water, is formed as an inverted cone affected by downflow due to the horseshoe-shaped eddies around the bridge piers, as reported in previous studies, until the maximum local scour depth reaches the equilibrium state [27,28,29]. After the maximum scouring depth reaches the equilibrium state, the top soil layer in the local scour hole, which has a slope gradient smaller than the repose angle in water, is scoured away by the scouring force of the water flowing into the local scour hole, and the erosion phenomenon progresses. The slope of the local scouring hole has an angle close to the underwater angle of repose of the riverbed material; however, the slope eroded by the scouring force has an angle smaller than the underwater angle of repose. The slope of the local scour hole eroded by the scouring force is smaller than the angle of repose in the water.

5.2. Type 2 Model

The local scour cross-section of Type 2 model is shown in Figure 22, Figure 23 and Figure 24, and the transition of the cross-sectional shape of the local scour hole upstream of the pier axis in Cases 9, 11 and 13 is shown in Figure 24.
From Figure 22, it can be observed that the local scour shape of Type 2 model with θ = 0° increases as an inverted cone between the first and third repetitions; this trend is similar to that of the cylindrical specimen. After the fourth repetition, the upper part of the slope of the reverse conical local scour formed by the third repetition was eroded. In other words, until the maximum local scour depth reaches the equilibrium state, the horseshoe-shaped eddies form an inverted conical local scour hole; after the maximum scour depth reaches the equilibrium state, the erosion proceeds by the local scouring of the upper part of the local scour hole by the scouring force. This tendency was similar to that of Type 1 model, and it was concluded that the upstream scour hole of Type 2 model exhibited the same shape as that of Type 1 model when θ = 0°. The maximum local scour depth increased from the fourth cycle, and the upper part of the local scour hole was eroded by the scouring force. The maximum local scour depth increases from the fourth time onward, and the upper part of the local scour hole is also eroded by the scouring force. After the seventh till tenth cycle, the area between 0.1 and 0.2 m of the local scour was eroded in a layered manner. Figure 24 shows that the local scour hole is formed as an inverted cone in the first iteration of Type 2 model with θ = 45°; however, the upper part of the slope of the local scour hole is eroded in a layered manner. From the second to fourth repetition, the local scour hole as an inverted cone near the maximum local scour depth became larger, and the upper part of the slope of the local scour hole was eroded. After the fifth repetition, the maximum local scouring depth increased, and the upper slope of the local scouring hole became smaller than the angle of the previously scoured slope, and the erosion progressed gradually.
Figure 25 shows a representative detailed view of the local scour section at the end of 10 iterations for Case 13, where the broken line indicates the approximation of the actual local scour hole at the point where the angle changes significantly. It was observed that the slope angle of the scour hole changed from the beginning of the scour extension to 32.4°, 13.3°, −1.1°, and 9.3°. The slope angle near the maximum scour depth was approximately the same as the angle of repose in water. The angle at the top of the local scour hole was smaller than the angle of repose in water, and the angle decreased approaching the top of the local scour hole. Contrasting to the local scour cross-sections of the cylindrical specimen and the oval specimen with θ = 0°, it was evident that shallow shelf-like local scour holes were formed near the soil base. The red line in the figure is a straight line connecting the start and end points of the local scour extension having an angle of 11.7°, which was 2.4 times longer than the scour extension calculated using the angle of repose in water.
These results indicate that the upstream local scour cross-sectional shape of the Type 2 model placed at an angle to the water flow direction formed an inverted cone around the maximum local scour depth due to the effect of horseshoe-shaped eddies when the water flow was iterated. In addition, the upper part of the local scouring hole was eroded by the water flowing into the local scouring hole when the water level rose or fell, and the local scouring progressed with the formation of different local scouring shapes in the upper and lower parts of the local scouring hole. These different local scour shapes progressed simultaneously, and the slope angle of the local scour hole with an inverted cone became close to the angle of repose of the riverbed material in water, while the scoured slope angle at the top of the local scour hole was smaller than the angle of repose in water. In contrast to the upstream local scour cross-section of Type 1 model and Type 2 model having θ = 0° with the water flow direction when the water level iteratively rose and fell, the local scour cross-section of the oval specimen that had an angle with the water flow direction was eroded by the scouring force at the top of the local scour hole even before the maximum scour depth reached the equilibrium state. Figure 26 shows the results for Cases 2 and 3.
Figure 26 shows the angle of the straight line connecting the start and end points of the local scour length at the end of 10 repetitions in Cases 2, 5, 6, 7, 9, 11, and 13. In most cases, the angle was smaller than the angle of repose in water. This indicates that the slope of the local scour hole gradually decreased and the local scouring length increased owing to the erosion of the upper part of the soil layer in the local scour hole, which used to be an inverted cone, by the iterated rise and fall of the water level. The average angle of the line connecting the start and end points of the local scour length in Cases 2, 6, 7, 9, 11, and 13 was 15.4°. However, the result of Case 5 is excluded, this is because the weir operation downstream of the open channel in Case 5 caused a temporary backflow during the water flow, and the local scouring progressed more slowly than in other experiments. The angle was approximately 40% less than the underwater angle of repose of 26.1° obtained from the measurement test, and the length was approximately 1.8 times longer than the local scour length Lcal obtained from the same maximum local scour depth.
In other words, the slope angle of the local scour hole upstream of the bridge piers became less than the angle of repose in water, and the local scour length was approximately 1.8 times longer than the value obtained from the angle of repose in water and maximum local scour depth of the riverbed material, and tended to increase when the water level history of the river was iterated.

6. Conclusions

To analyze the effect of iterated water level history on the progression of local scouring, this study investigated the effect of iterated rise and fall of the water level on the progression of local scouring using cylindrical and round nose and tail rectangular bridge pier models. The results obtained were as follows:
  • The experiments of cylindrical and round nose and tail rectangular piers confirmed that the increase converged as the number of iterated actions increased.
  • In the case of cylindrical and round nose and tail rectangular piers, where the piers were not at an angle with the river flow center, the local scour hole upstream of the piers increased as an inverted cone with iterated water level history until the maximum scour depth reached the equilibrium state. After reaching the equilibrium state, the top of the slope of the local scour hole was eroded by the scouring force, and a scour hole was formed.
  • In the case of round nose and tail rectangular piers where the piers and river flow center were at an angle, the upper slope of the local scour hole was simultaneously eroded by the inflow water into the local scour hole when the water level rose or fell, forming a different local scour shape between the upper and lower parts of the local scour hole.
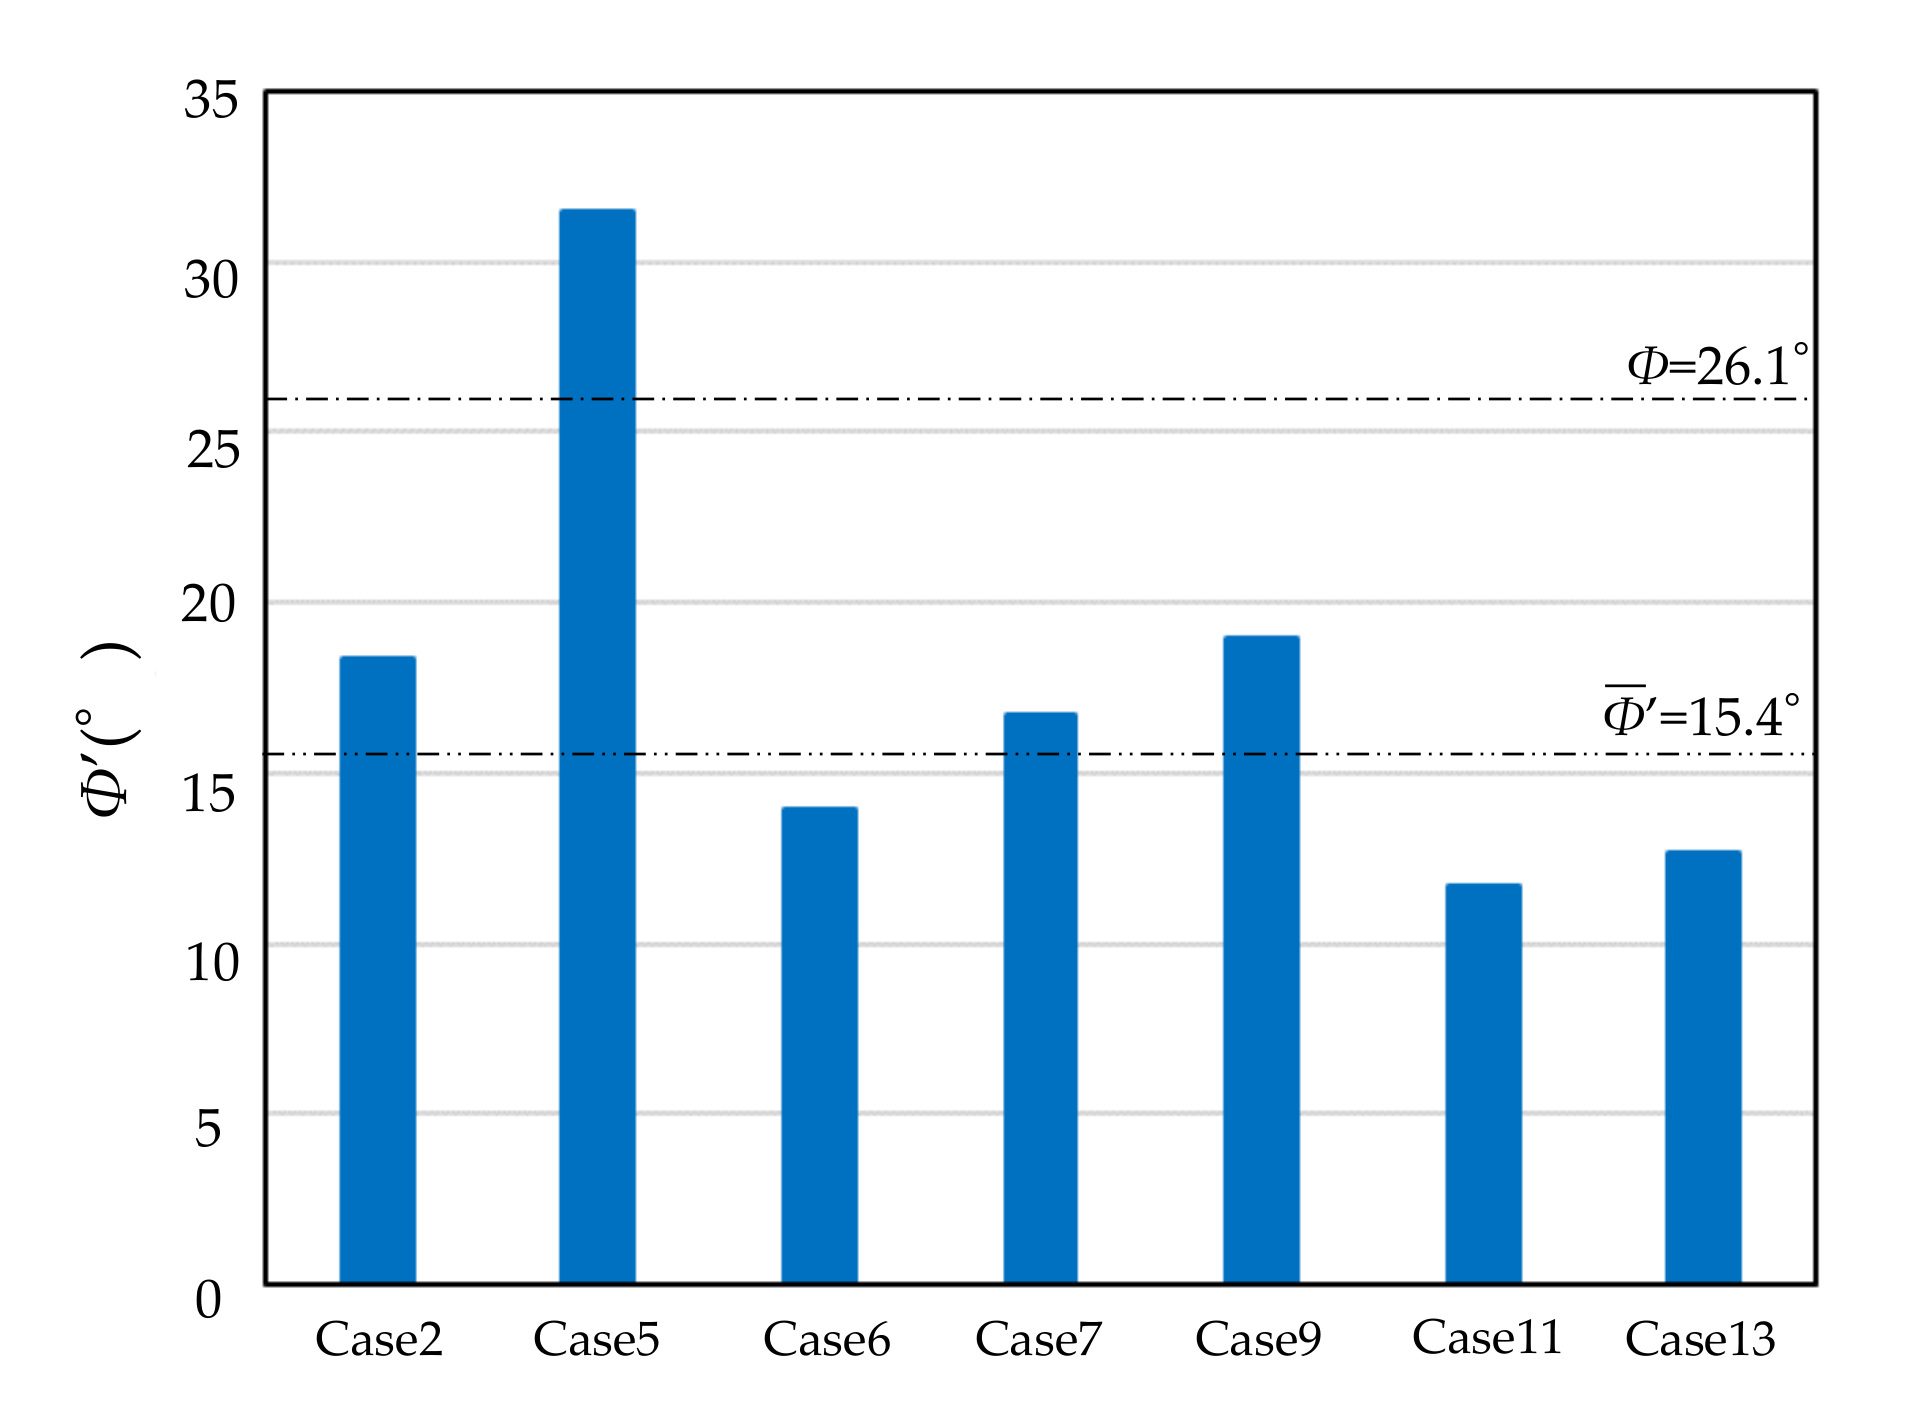
  • The slope of the local scour hole formed upstream of the bridge pier model became less than the angle of repose in water, and the local scour length was 1.8 times longer than the theoretical local scour length calculated from the local scour depth and angle of repose in water of the riverbed material.
In this study, we performed a fundamental study to understand effects of iterated water level on the progress of local scouring. In the maintenance practice for disaster prevention due to local scouring, it is important to develop an equation for evaluating time-varying local scour depth and local scour length, which are considered effects of iterated water level. This development will be a subject of future study.

Author Contributions

Conceptualization, S.K. and T.K.; methodology, T.K.; software, S.K.; validation, S.O., Y.K. and M.I.; formal analysis, H.Y.; investigation, T.M.; resources, T.K.; data curation, S.K.; writing—original draft preparation, S.K.; writing—review and editing, S.O.; visualization, T.K.; supervision, H.Y.; project administration, S.O.; funding acquisition, S.O. All authors have read and agreed to the published version of the manuscript.

Funding

This research was funded by SIP “Strengthening National Resilience (Disaster Prevention Mitigation). Implementation of Earthquake Risk Assessment in IDR4M and Verification of Strengthening Decision-Making Support” (Representative: Yoshiyuki Kaneda).

Institutional Review Board Statement

Not applicable.

Informed Consent Statement

Not applicable.

Data Availability Statement

The data presented in this study is available on request from the corresponding author.

Conflicts of Interest

The authors declare no conflict of interest.

References

  1. Kadono, T.; Kikuchi, Y.; Irie, M. Recovery Planning and Evaluation of Bridge Piers Inclined by Scouring. In Proceedings of the Shikoku Branch of Japan Society of Civil Engineers, Natural Disaster Forum 2019, Takamatsu, Japan, 19 December 2019; pp. 19–24. [Google Scholar]
  2. Emmett, M.L. An analysis of relief bridge scour. J. Hydraul. Div. 1963, 89, 93–118. [Google Scholar]
  3. Tarapore, Z.S. A Theoretical and Experimental Determination of the Erosion Pattern Caused by Obstructions in an Alluvial Channel with Particular Reference to Vertical Circular Cylindrical Piers. Ph.D. Thesis, University of Minnesota, Minneapolis, MN, USA, 1962; p. 161. [Google Scholar]
  4. Gradowozyk, M.H.; Maggiolo, O.J.; Folguera, H.C. Localized Scour in Erodible-bed Channels. J. Hydraul. Res. 1968, 6, 289–326. [Google Scholar] [CrossRef]
  5. Shen, H.W.; Schceider, V.R.; Karaki, S. Local Scour around Bridge Piers. Proc. ASCE 1969, 95, 1914–1938. [Google Scholar]
  6. Melville, B.W.; Raudkivi, A.J. Effects of foundation geometry on bridge pier scour. J. Hydraul. Eng. 1996, 122, 203–209. [Google Scholar] [CrossRef]
  7. Roulund, A.; Sumer, B.M.; Fredsøe, J.; Michelsen, J. Numerical and experimental investigation of flow and scour around a circular pile. J. Fluid Mech. 2005, 534, 351–401. [Google Scholar] [CrossRef]
  8. Cheng, N.S.; Wei, N. Scaling of scour depth at bridge pier base on characteristic dimension of large-scale vortex. Water 2019, 11, 2458. [Google Scholar] [CrossRef] [Green Version]
  9. Manes, C.; Brocchini, M. Local around structures and the phenomenology of turbulence. J. Fluid Mech. 2015, 779, 309–324. [Google Scholar] [CrossRef]
  10. Umeda, S.; Yamazaki, T.; Masatoshi, Y. Effects of foundation location on scour process around a cylindrical bridge pier. Ann. J. Hydraul. Eng. 2010, 54, 835–840. [Google Scholar]
  11. Richardson, E.V.; Davis, S.R. Evaluating Scour at Bridges; Federal Highway Administration, Office of Bridge Technology (National Highway Institute): Washington, DC, USA, 2001.
  12. Briaud, J.L.; Chen, H.C.; Li, Y.; Nurtjahyo, P. SRICOS-EFA Method for Complex Piers in Fine-Grained Soils. J. Geotech. Geoenviron. Eng. 2004, 130, 1180–1191. [Google Scholar] [CrossRef]
  13. Ali, T.; Roberto, G.; Francesco, C. Evaluation of Flow-Altering Countermeasures against Bridge Pier Scour. J. Hydraul. Eng. ASCE 2012, 138, 297–305. [Google Scholar] [CrossRef]
  14. Gaudio, R.; Tafarojnoruz, A.; Calomino, F. Combined flow-altering conutermeasures against bridge pier scour. J. Hydraul. Res. 2012, 50, 35–43. [Google Scholar] [CrossRef]
  15. Fukuoka, S.; Miyagawa, T.; Tobiishi, M. Measurements of Flow and Bed Geometry around a Cylindrical Pier and Calculation of Its Fluid Forces. Ann. J. Hydraul. Eng. 1997, 41, 729–734. [Google Scholar] [CrossRef] [Green Version]
  16. Kadono, T.; Okazaki, S.; Kabeyama, Y.; Matsui, T. Effect of Angle between Pier and Center of River Flow in Local Scouring around the Bridge Pier. Water 2020, 12, 3192. [Google Scholar] [CrossRef]
  17. Briaud, J.L.; Chen, H.C.; Li, Y.; Nurtjahyo, P.; Wang, J. Complex Pier Scour and Contraction Scour in Cohesive Soils; National Cooperative Highway Research Program; Transportation Research Board National Research Council: Washington, DC, USA, 2003. [Google Scholar] [CrossRef] [Green Version]
  18. Michiue, M.; Hinokidan, O. Calculation of 2-dimensional bed evolution around spur-dike. Ann. J. Hydraul. Eng. 1992, 36, 61–66. [Google Scholar] [CrossRef] [Green Version]
  19. Utami, T. Study on the Mechanism of Flow Around Bridge Piers and Scour Prevention Methods. Ph.D. Thesis, Kyoto University, Kyoto, Japan, 1975. [Google Scholar] [CrossRef]
  20. Tamai, S.; Nakao, S. Experimental Studies on the Local Scour around Cylindrical Bridge Pier. Res. Rep. Kôchi Univ. Nat. Sci. 1988, 37, 161–172. [Google Scholar]
  21. Mitzutani, H.; Najagawa, H.; Kawaike, K.; Baba, Y.; Zhang, H. Local Scour and Sediment Sorting Around a Spur Dyke. Kyoto Univ. Res. Inf. Repos. B 2011, 54, 525–528. [Google Scholar]
  22. Railway Technical Research Institute in JAPAN. Maintenance Standard (Railway Structure Edition, Foundation Structure and Retaining Structure); Railway Technical Research Institute in JAPAN: Tokyo, Japan, 2007; pp. 165–171. [Google Scholar]
  23. Vaughan, P.R. Design of filters for the protection of vracked dam cores against internal erosion. In Preprint 3420 Presented to ASCE Convention; American Society of Civil Engineers: Chicago, IL, USA, 1978. [Google Scholar]
  24. Vaughan, P.R.; Soares, H.F. Design of filters for clay cores of dams. J. Geotech. Eng. Div. ASCE 1982, 108, GT1. [Google Scholar]
  25. Uesaka, T.; Yaguchi, Y. Experimental Study on Identification of Filter Cohesion. J. Jpn. Soc. Dam Eng. 2001, 11, 55–66. [Google Scholar]
  26. Tarapore, Z.S.; Arthut, T. Scour Around Bridge Piers and Abutments. Ph.D. Thesis, University of Minnesota, Minneapolis, MN, USA, 1962. [Google Scholar]
  27. Nakagawa, H.; Suzuki, K. Study on the Estimation of Scour Depth Around Bridge Piers. Kyoto Univ. Disaster Prev. Res. Inst. Annu. Rep. B 1974, 17, 725–751. [Google Scholar]
  28. Igarashi, T.; Nishida, K. Basic Study on Scour around Bridge Piers and Its Prevention. Trans. Jpn. Soc. Mech. Eng. B 1992, 58, 1990–1996. [Google Scholar] [CrossRef] [Green Version]
  29. Igarashi, T.; Tutui, T.; Iigatani, T. Clear Water Scour around Bridge Piers. Trans. Jpn. Soc. Mech. Eng. B 1994, 60, 3352–3358. [Google Scholar] [CrossRef] [Green Version]
Figure 1. Experiment setup: (a) Entire open channel; (b) Detailed view of the soil layer using a Type 1 model; (c) Detailed view of the soil layer using a Type 2 model. The specimen is rotated by θ with respect to the river flow center; and (d) Dimensions of Type 2.
Water 13 03015 g001
Figure 2. Local scour depth after the experiment for Cases 4 and 6. (H1 = 0.075 m, T = 1800 s).
Water 13 03015 g002
Figure 3. Local scour depth after the experiment for Cases 8 and 9. (θ = 0°, H1 = 0.075 m, T = 600 s).
Water 13 03015 g003
Figure 4. Local scour depth after the experiment for Cases 10 and 11. (θ = 30°, H1 = 0.075 m, T = 600 s).
Water 13 03015 g004
Figure 5. Local scour depth after the experiment for Cases 12 and 13. (θ = 45°, H1 = 0.075 m, T = 600 s).
Water 13 03015 g005
Figure 6. Measurement locations of local scour depth and extension for (a) Type 1 model and (b) Type 2 model.
Water 13 03015 g006
Figure 7. Local scour depth of Cases 1 and 2.
Water 13 03015 g007
Figure 8. Local scour depth of Cases 3 and 5.
Water 13 03015 g008
Figure 9. Local scour depth of Cases 4, 6 and 7.
Water 13 03015 g009
Figure 10. Local scour depth of Cases 8 and 9.
Water 13 03015 g010
Figure 11. Local scour depth of Cases 10 and 11.
Water 13 03015 g011
Figure 12. Local scour depth of Cases 12 and 13.
Water 13 03015 g012
Figure 13. Local scour length of Cases 1 and 2.
Water 13 03015 g013
Figure 14. Local scour length of Cases 3 and 5.
Water 13 03015 g014
Figure 15. Local scour length of Cases 4, 6 and 7.
Water 13 03015 g015
Figure 16. Local scour length of Cases 8 and 9.
Water 13 03015 g016
Figure 17. Local scour length of Cases 10 and 11.
Water 13 03015 g017
Figure 18. Local scour length of Cases 12 and 13.
Water 13 03015 g018
Figure 19. Relationship between calculated Lcal and experimental values Lexp: Experiments without water level change are Case 1, 3, 4, 8, 10 and 12, Experiments with water level change are Case 2, 5, 6, 7, 9, 11 and 13.
Water 13 03015 g019
Figure 20. Cross-sectional view of local scour hole in Case 6 (point 1).
Water 13 03015 g020
Figure 21. Slope angle of the local scour hole in Case 6 (N = 10: point 1).
Water 13 03015 g021
Figure 22. Cross section of local scour hole in Case 9 (point 1).
Water 13 03015 g022
Figure 23. Cross-sectional view of local scour hole in Case 11 (point 1).
Water 13 03015 g023
Figure 24. Cross-sectional view of a local scour hole in Case 13 (point 1).
Water 13 03015 g024
Figure 25. Cross-sectional view of local scour hole in Case 11 (N = 10: point 1).
Water 13 03015 g025
Figure 26. Slope angle of local scour hole (N = 10, point1).
Water 13 03015 g026
Table 1. List of experimental cases.
CasePier Shapeθ
(Degree)
H1
[H2]
(m)
Nt
(s)
T
(s)
V1
[V2]
(m/s)
L
(m)
Re1
[Re2]
Fr1
[Fr2]
Case 1Type1-0.0316006000.2670.06511,4040.334
Case 2Type1-0.0310606000.2670.06511,4040.334
Case 3Type1-0.07516006000.1070.06545610.134
Case 4Type1-0.0751180018000.1070.06545610.134
Case 5Type1-0.07510606000.1070.06545610.134
Case 6Type1-0.07510180018000.1070.06545610.134
Case 7Type1-0.075
[0.125]
1018018000.107
[0.064]
0.0654561
[2737]
0.134
[0.080]
Case 8Type200.07516006000.1070.162511,4040.084
Case 9Type200.07510606000.1070.162511,4040.084
Case 10Type2300.07516006000.1070.162511,4040.084
Case 11Type2300.07510606000.1070.162511,4040.084
Case 12Type2450.07516006000.1070.162511,4040.084
Case 13Type2450.07510606000.1070.162511,4040.084
Where, θ: rotation angle of the bridge pier model relative to the river flow center, H1: target water level, H2: target water level (Case 7: 5th and 10th times), N: number of iterations, t: target water level duration, T: cumulative target water level duration, V1: flow velocity at H1, V2: flow velocity at H2, L: characteristic length, Re1: reynolds number at H1, Re2: reynolds number at H2, Fr1: fluid number at H1, Fr2: fluid number at H2.
Publisher’s Note: MDPI stays neutral with regard to jurisdictional claims in published maps and institutional affiliations.

