
A Revised Approach to Flood Damage Estimation in Flood Risk Maps and Flood Risk Management Plans, Poland


Department of Geoengineering and Water Management, Faculty of Environmental and Power Engineering, Politechnika Krakowska, Warszawska 24, 31-155 Kraków, Poland
Water 2021, 13(19), 2713; https://doi.org/10.3390/w13192713
Submission received: 1 September 2021
/
Revised: 25 September 2021
/
Accepted: 27 September 2021
/
Published: 30 September 2021
(This article belongs to the Special Issue Assessment and Management of Flood Risk in Urban Areas)
Abstract
:This article describes the determination of asset values in residential and industrial areas in Poland that can be used in the preparation of flood hazard and risk maps (FRMs) and flood risk management plans (FRMPs). In the Floods Directive’s first cycle of implementation (2010–2015), German indicators of asset value were adapted to Polish conditions. This approach was used due to the lack of national statistics necessary to determine the value of property. In this study, the asset values in residential and industrial areas were prepared on the basis of the nationwide household wealth survey conducted in 2016 by the Narodowy Bank Polski (the central bank of Poland) and other data available from Statistics Poland. The proposed approach enables the determination of asset values based on real, validated data. The obtained indicators result in higher and more realistic values of the assets of households (buildings with contents) and the assets of companies (fixed assets and stocks) operating in both residential and industrial areas. The proposed approach, as an extension in relation to the first planning cycle, has been implemented in the second cycle of FRMP preparation in Poland.
1. Introduction
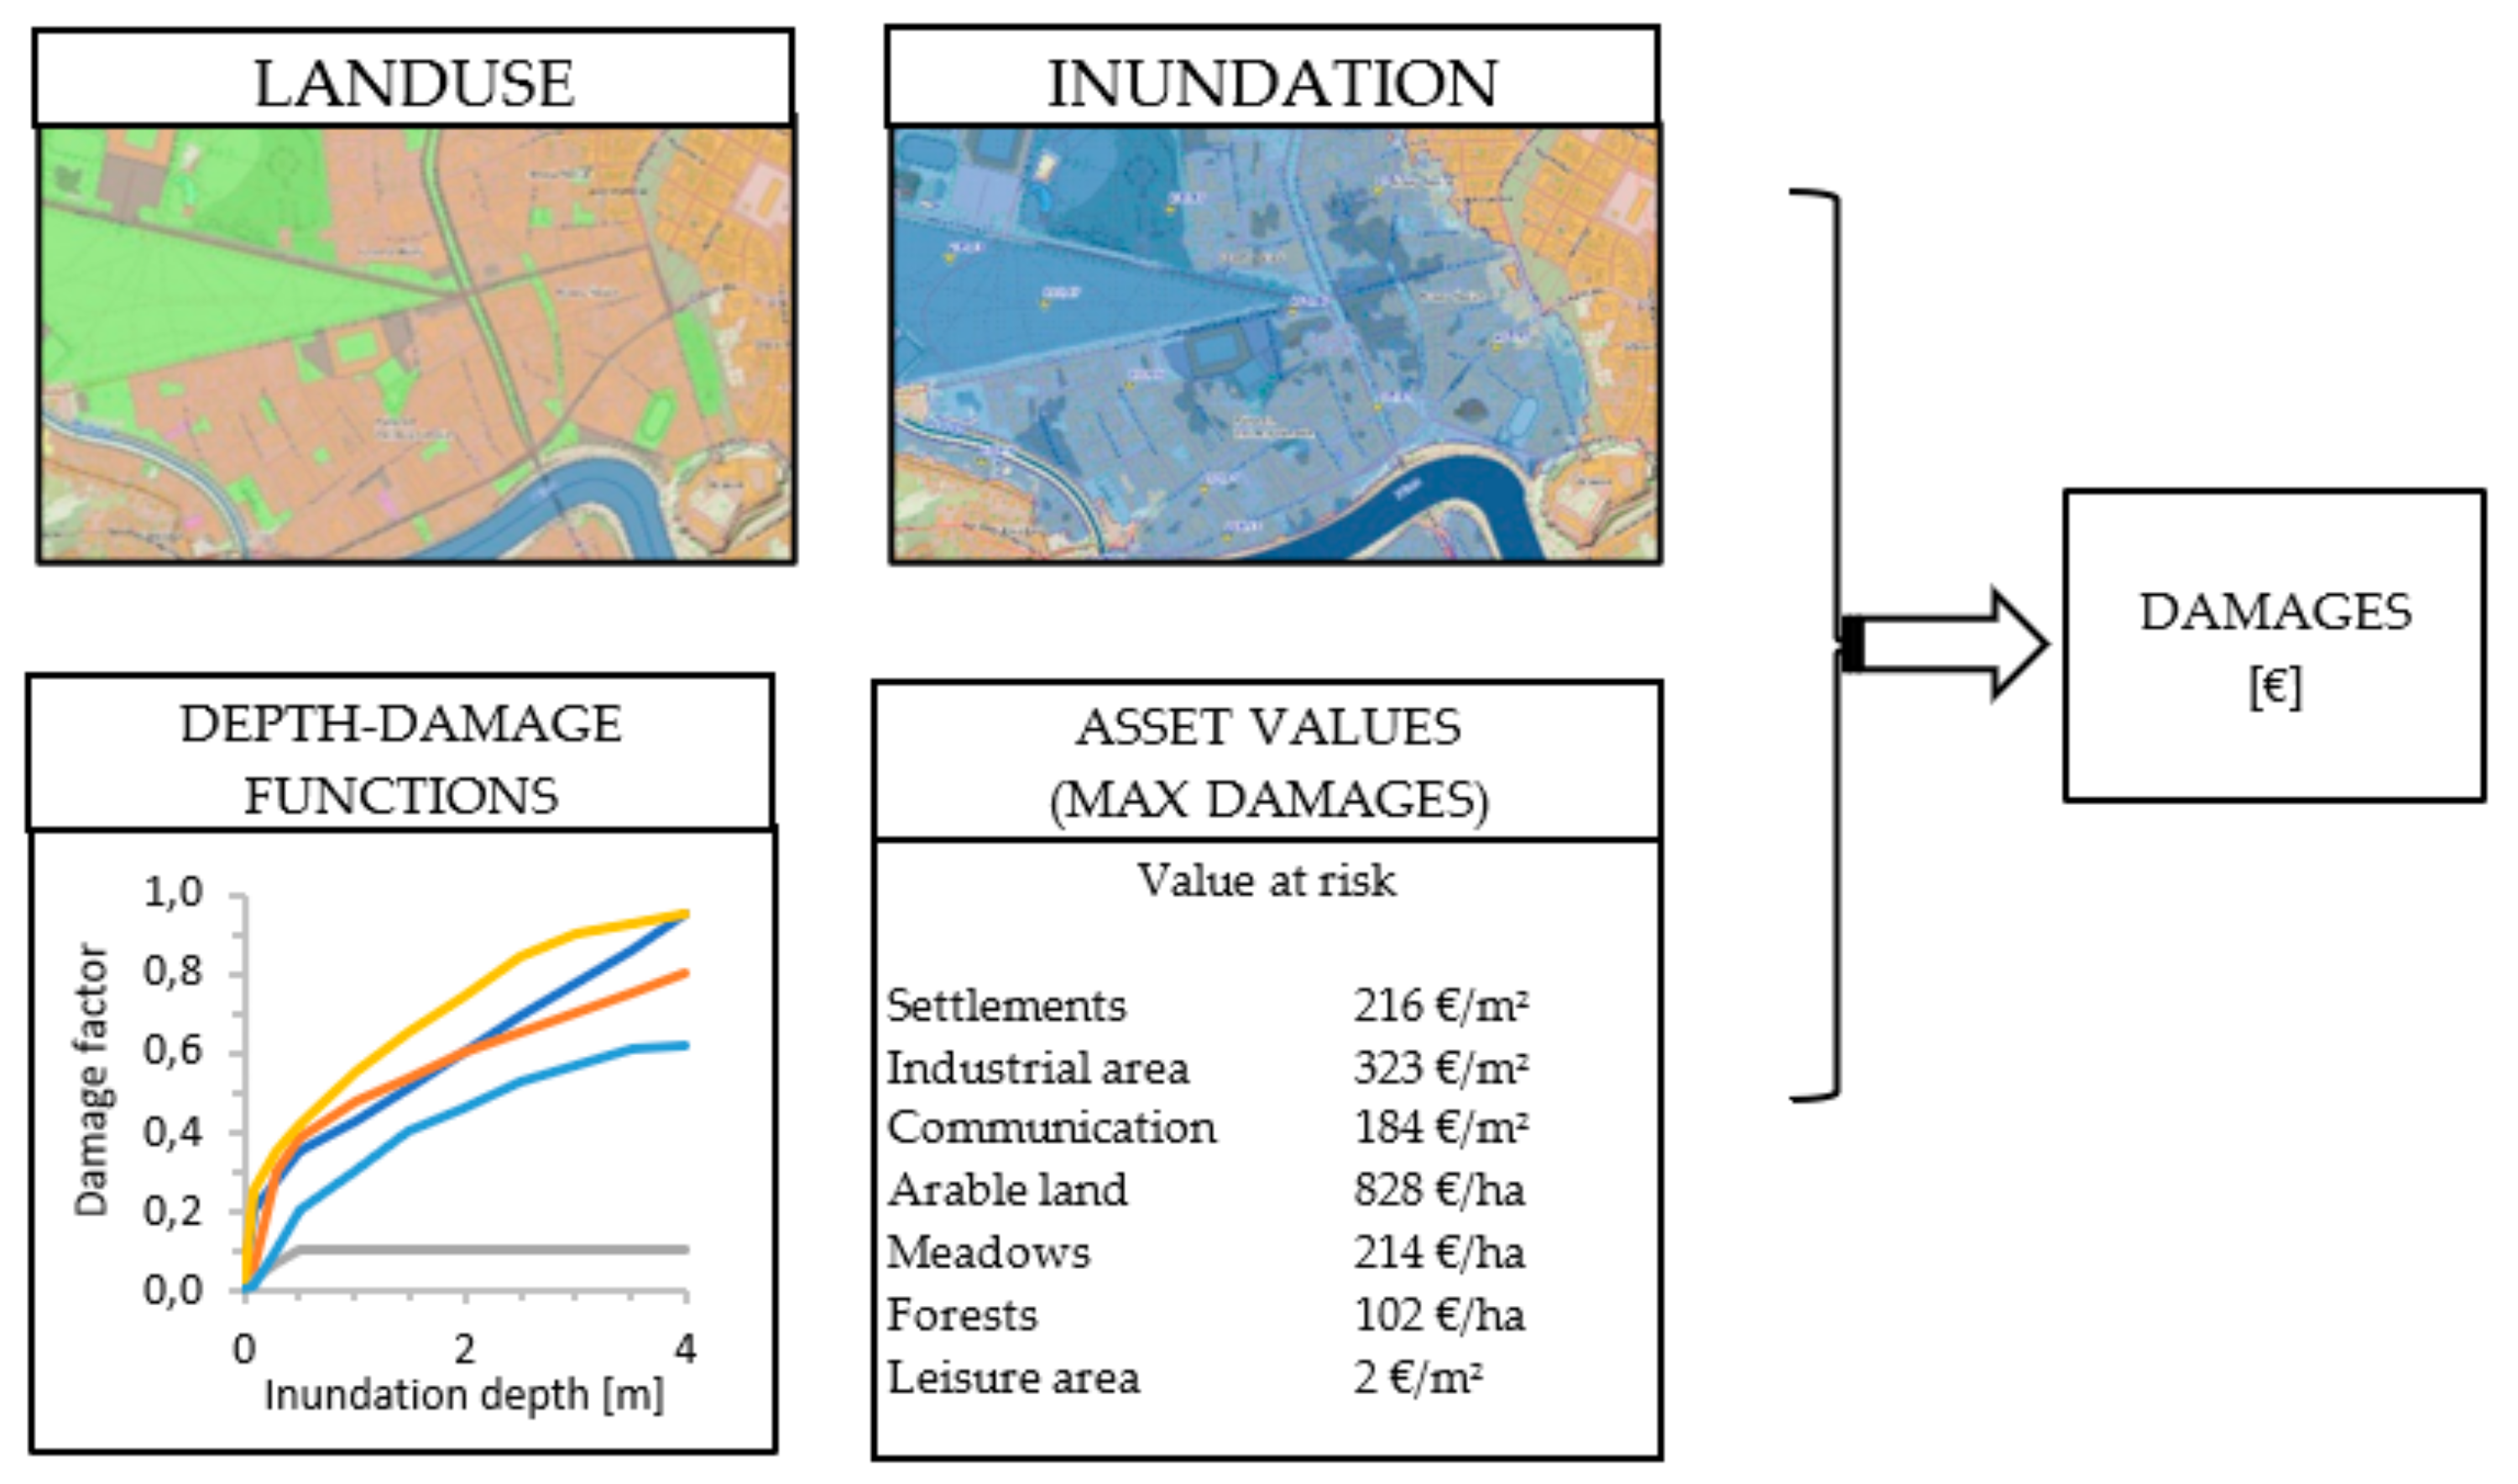
In 2016, documents from the second planning cycle were released in Poland, including updated flood risk maps and flood risk management plans. The first flood risk maps for Poland, published in December 2013, were created using a methodology developed in 2009 [1]. This methodology adopted a popular macro- and meso-scale approach to flood risk estimation, which determines flood losses based on several variables: the area and land use type, inundation, unit asset values depending on the type of development (also called asset value indicators or maximum damages), and depth–damage functions (Figure 1) [2,3,4,5,6,7,8,9,10,11,12,13,14].
The approach presented in Figure 1 varies in the literature, e.g., the asset values can be assessed at the scale of buildings (especially residential and commercial buildings) or at the scale of area types and land use, and depth–damage functions can refer to relative damage (damage factor) or monetary losses (which is a de facto multiplication of the damage factor and asset value) [4,16,17,18,19]. Correct estimation of such input data determines the comprehensiveness of the risk assessment and the adequacy of the measures taken in the flood risk management plan [3,17,18].
The methods of estimating the economic value of assets usually differs due to the scale of the analyzes [4,7,20]:
- In microscale models, the estimation is the most accurate and is usually based on the valuation of individual elements (buildings and infrastructure elements), e.g., valuation of 1 m2 of a residential building, commercial building, warehouse, etc.
- In mesoscale and macroscale models, in addition to the above-mentioned building valuation, spatial aggregation is also often used, and the value of property is determined for specific types of development or administrative units, e.g., valuation of 1 m2/1 ha/1 km2 of residential, industrial, or other areas.
The valuation of individual types of buildings is usually based on unit value/prices referring to the replacement or reparation costs or market values [4,7,21,22]. Determining asset values and, more broadly, flood damage models is the subject of review and research papers. Most methods and models are based on replacement and/or recovery value of buildings and their contents: Multi-Colored Manual developed in the UK [11], HAZUS-MH model (USA) [12], FLEMO models (Germany) [16,23], INSYDE model (Italy) [21], case studies from Italy [24,25], a Japan study [26], and an Australian model [27]. The market value of the assets was the basis for the models from Italy [24,25,28], the Croatian model [14], and the Greek case study [29]. The values are taken from insurance data [25,30], statistical data and censuses [14,16,31], expert assessments [25], the real estate market, and other market price sources [24,25]. The buildings that have historical, artistic, and/or cultural significance are valued through expert assessments [25] and other techniques, including substitution value approach and public willingness to pay for preservation, maintenance, or exploitation of such estates [32].
The area-based approach, which is applied in Poland, is presented and constantly developed in German research. The basis is the publication of Ministry of the Environment, Regional Planning and Agriculture (MURL) of the State of North Rhine-Westphalia on Potential Flood damage on the Rhine in North Rhine-Westphalia (2000), which was applied to the Rhine-Atlas 2001 (according to [7]). The approach was updated by Grünthal et al. and consisted in the valuation assets according to the following scheme [30]:
- For residential areas, the basis (unit values) is the average insurance values of buildings (community or federal state level), then the total asset value for the analyzed area is calculated by multiplying the unit values by the number of buildings, and finally, the unit asset index in €/m2 is determined by dividing the total value by the total settlement area;
- In Rhine Atlas, asset value indicators for other countries in the Rhine basin were calculated by converting German indices according to the multipliers resulting from gross domestic products.
Grünthal et al. estimated the asset value for the residential area for the city of Cologne as follows: the total number of buildings and cars was multiplied by the corresponding average insurance values in Cologne. The total asset value of households is €80.25 billion, and the average unit value per land area is €1015/m2. For the other economic sectors (manufacturing and industry; public service and infrastructure; commerce and services sector etc.), federal North Rhine-Westphalia indicators are used, which were estimated in the above-mentioned MURL study from 2000. The federal unit values are adjusted to Cologne using the gross value added per employee [30].
Kleist et al. [20] and Thieken et al. [33], in the framework of the project “Risk Map Germany”, regionalized the indicators of residential asset values to community level. Additionally, they refined the valuation, considering not only the mean value of the insurance data, but also the census data on building type and quality, construction costs, and building area (federal level statistics). The results show the per-capita value of residential building assets in all municipalities, and they show significant differences of values across the country.
Further development of the German approach of regionalization of asset indicators is the research by Seifert et al. [31] that presents asset values in non-residential areas. The indicators were estimated on the basis of statistical data for 16 federal states of Germany and data on countrywide stock of fixed assets for 60 economic activities. The indicators are regionalized by taking into account data from the level of communities on employee numbers, number of production sites, and land use data.
In Poland, the methodological framework of flood damage is based on relative depth–damage curves and spatial-scale (area-based) asset values. The Polish methodology was largely based on adapting the German methodology and data to Polish conditions, as the Polish statistical system did not have the data necessary for the evaluation [1]. The developed methodology included the following aspects:
- As in Germany, areas were differentiated into types such as residential settlements/urban areas, industrial areas, communication areas, forests, recreational and leisure areas, arable land, and grassland (meadows and pastures);
- Depth–damage functions were developed, among others, based on the 2001 Rhine Atlas [34];
- Most importantly, from the point of view of total flood losses, asset values for residential and industrial areas were determined as follows: (1) asset values in residential settlements were determined on the basis of German data on private property values; (2) asset values in industrial areas were determined on the basis of statistical data concerning only the value of fixed assets in the industry, and the value of stocks was not taken into account.
German data on the average private property value per capita were converted into Polish data using the ratio of Polish to German Gross Domestic Product (GDP) per capita for 2006 (the index was 0.45). This value was adjusted with the inflation index to obtain current prices and then differentiated for each voivodship (16 provinces in Poland), according to the ratio of GDP per capita in the voivodship to the national average [1]. The obtained asset value indicators were low, and thus, potential flood losses were underestimated. One of the factors causing the underestimation of the indicators was the adoption of the ratio between Polish and German GDP from 2006 and not taking into account its change over time [35,36]. In Poland, the GDP per capita in the period 2006–2019 was highly dynamic, which meant that the Polish/German GDP ratio was 0.49 in 2008, 0.55 in 2015, and 0.61 in 2019 [37,38]. Hence, adjusting the values only by the inflation rate likely did not reflect the increase in the value of assets, and the adopted ratios of asset values in residential areas were significantly underestimated. Fortunately, the results of economic analyses were not the only factors affecting decisions about actions to reduce the risk of damage. In line with the recommendations of the Flood Directive, the analyses also took into account social, environmental, and cultural criteria [39,40,41].
This paper presents the methodologies and specific residential and industrial asset values for estimating direct economic flood losses. This study was undertaken for three main reasons. First, reliable statistical surveys were published that could be used to compute the asset values of households. In 2014 and 2016, the Household Wealth and Debt Surveys were performed by Narodowy Bank Polski NBP (the Polish central bank) in cooperation with Statistics Poland [42,43]. The surveys aimed to identify the financial condition of Polish households, including their assets and debts. The results obtained from a wide range of research can be used to determine the value of household property for the purposes of preparing flood risk maps and flood risk management plans.
The second reason for starting work on extending the Polish approach to flood loss estimation is the lack of consideration of the property value of companies operating in residential areas, such as shops, commercial and service companies, small manufacturing companies, etc.
The last reason for this study is the hitherto asset value indicators in industrial areas. In 2009, these indicators were determined on the basis of data from the Polish Central Statistical Office on the gross value of fixed assets and the area of industrial regions in individual voivodeships. The estimation of losses did not include equipment and stocks, which are also damaged during floods, and in some sectors of the economy, their values may even exceed the value of fixed assets (e.g., in the trade sector) [44,45].
2. Materials and Methods
In Poland, in both the first and second cycles of flood risk mapping, unit asset value indicators (or unit values of flood losses) are used, and they are expressed in Polish złoty (PLN) per m2. As mentioned above, this approach is based on the methodology developed in the first cycle, which is modeled based on the German approach [1,46,47].
There are seven land-use types for which assets and potential flood losses are estimated:
- Residential areas;
- Industrial areas;
- Communication areas;
- Forests;
- Recreational and leisure areas;
- Arable land and permanent crops;
- Grassland (meadows and pastures).
In this approach, household assets are estimated in residential areas, and the assets of industrial enterprises are estimated in industrial areas. This method does not capture the total assets of all enterprises. The total fixed assets of economic entities in Poland amount to PLN 4,263,000 million (€992,000 million) [48]. The assets of the companies are mainly located in two types of areas: in industrial areas but also in residential areas. Assets in industrial areas include fixed assets worth PLN 1,411,000 million (€328,000 million) from four sectors of the economy classified by the Statistical Classification of Economic Activities in the European Community (NACE) as “industry”: (B mining and quarrying; C manufacturing; D electricity, gas, steam, and air conditioning supply; E water supply, sewerage, waste management, and remediation activities). This value of industrial assets was included in the valuation of potential flood losses in industrial areas. The assets of the remaining sectors of the economy (PLN 2,853,000 million/€664,000 million) were not included in the asset value indicators used in the flood risk assessment. In the proposed approach, it is assumed that the fixed assets of the remaining non-industrial sectors of the economy (commercial and various services classified by NACE into sectors F–U) are located in residential areas; thus, the newly developed asset value indicators for residential areas include the value of assets of these non-industrial sectors.
In addition, current assets will also be added to the tangible assets of these non-industrial sectors located in residential areas, particularly stocks, such as materials and finished products. The estimate is made according to the average value of the ratio of stocks to fixed assets in individual sectors of the economy [49].
Ultimately, the approach presented below determines the value of the assets of households (buildings with contents) and the assets of companies operating in residential areas (fixed assets and stocks).
Table 1 presents the changes in the method of asset valuation in residential areas compared to the approach of the 1st cycle.
In the proposed approach to estimating the value of assets in residential areas, the assets of households and business entities were taken into account. Rules for estimating the value of assets in residential areas are as follows:
- Asset value indicators are calculated for the voivodship level (there are 16 distinguished voivodships/provinces in Poland);
- Asset value indicators are calculated as the ratio of the value of assets to the area of residential land use;
- Residential areas: data on geodesic status and direction of land use by the Head Office of Geodesy and Cartography;
- Asset value in residential areas:
- Household assets (buildings with contents and vehicles) are calculated on the basis of data on fixed asset value per household (including the household main residence, other real estate, and vehicles). The contents are valued at 50% of the building value.
- Assets (fixed assets and stocks) of business entities are calculated for 13 non-industrial sectors of the economy, such as trade, services, accommodation and food service, information and communication, financial and insurance, education, and other sectors of NACE.
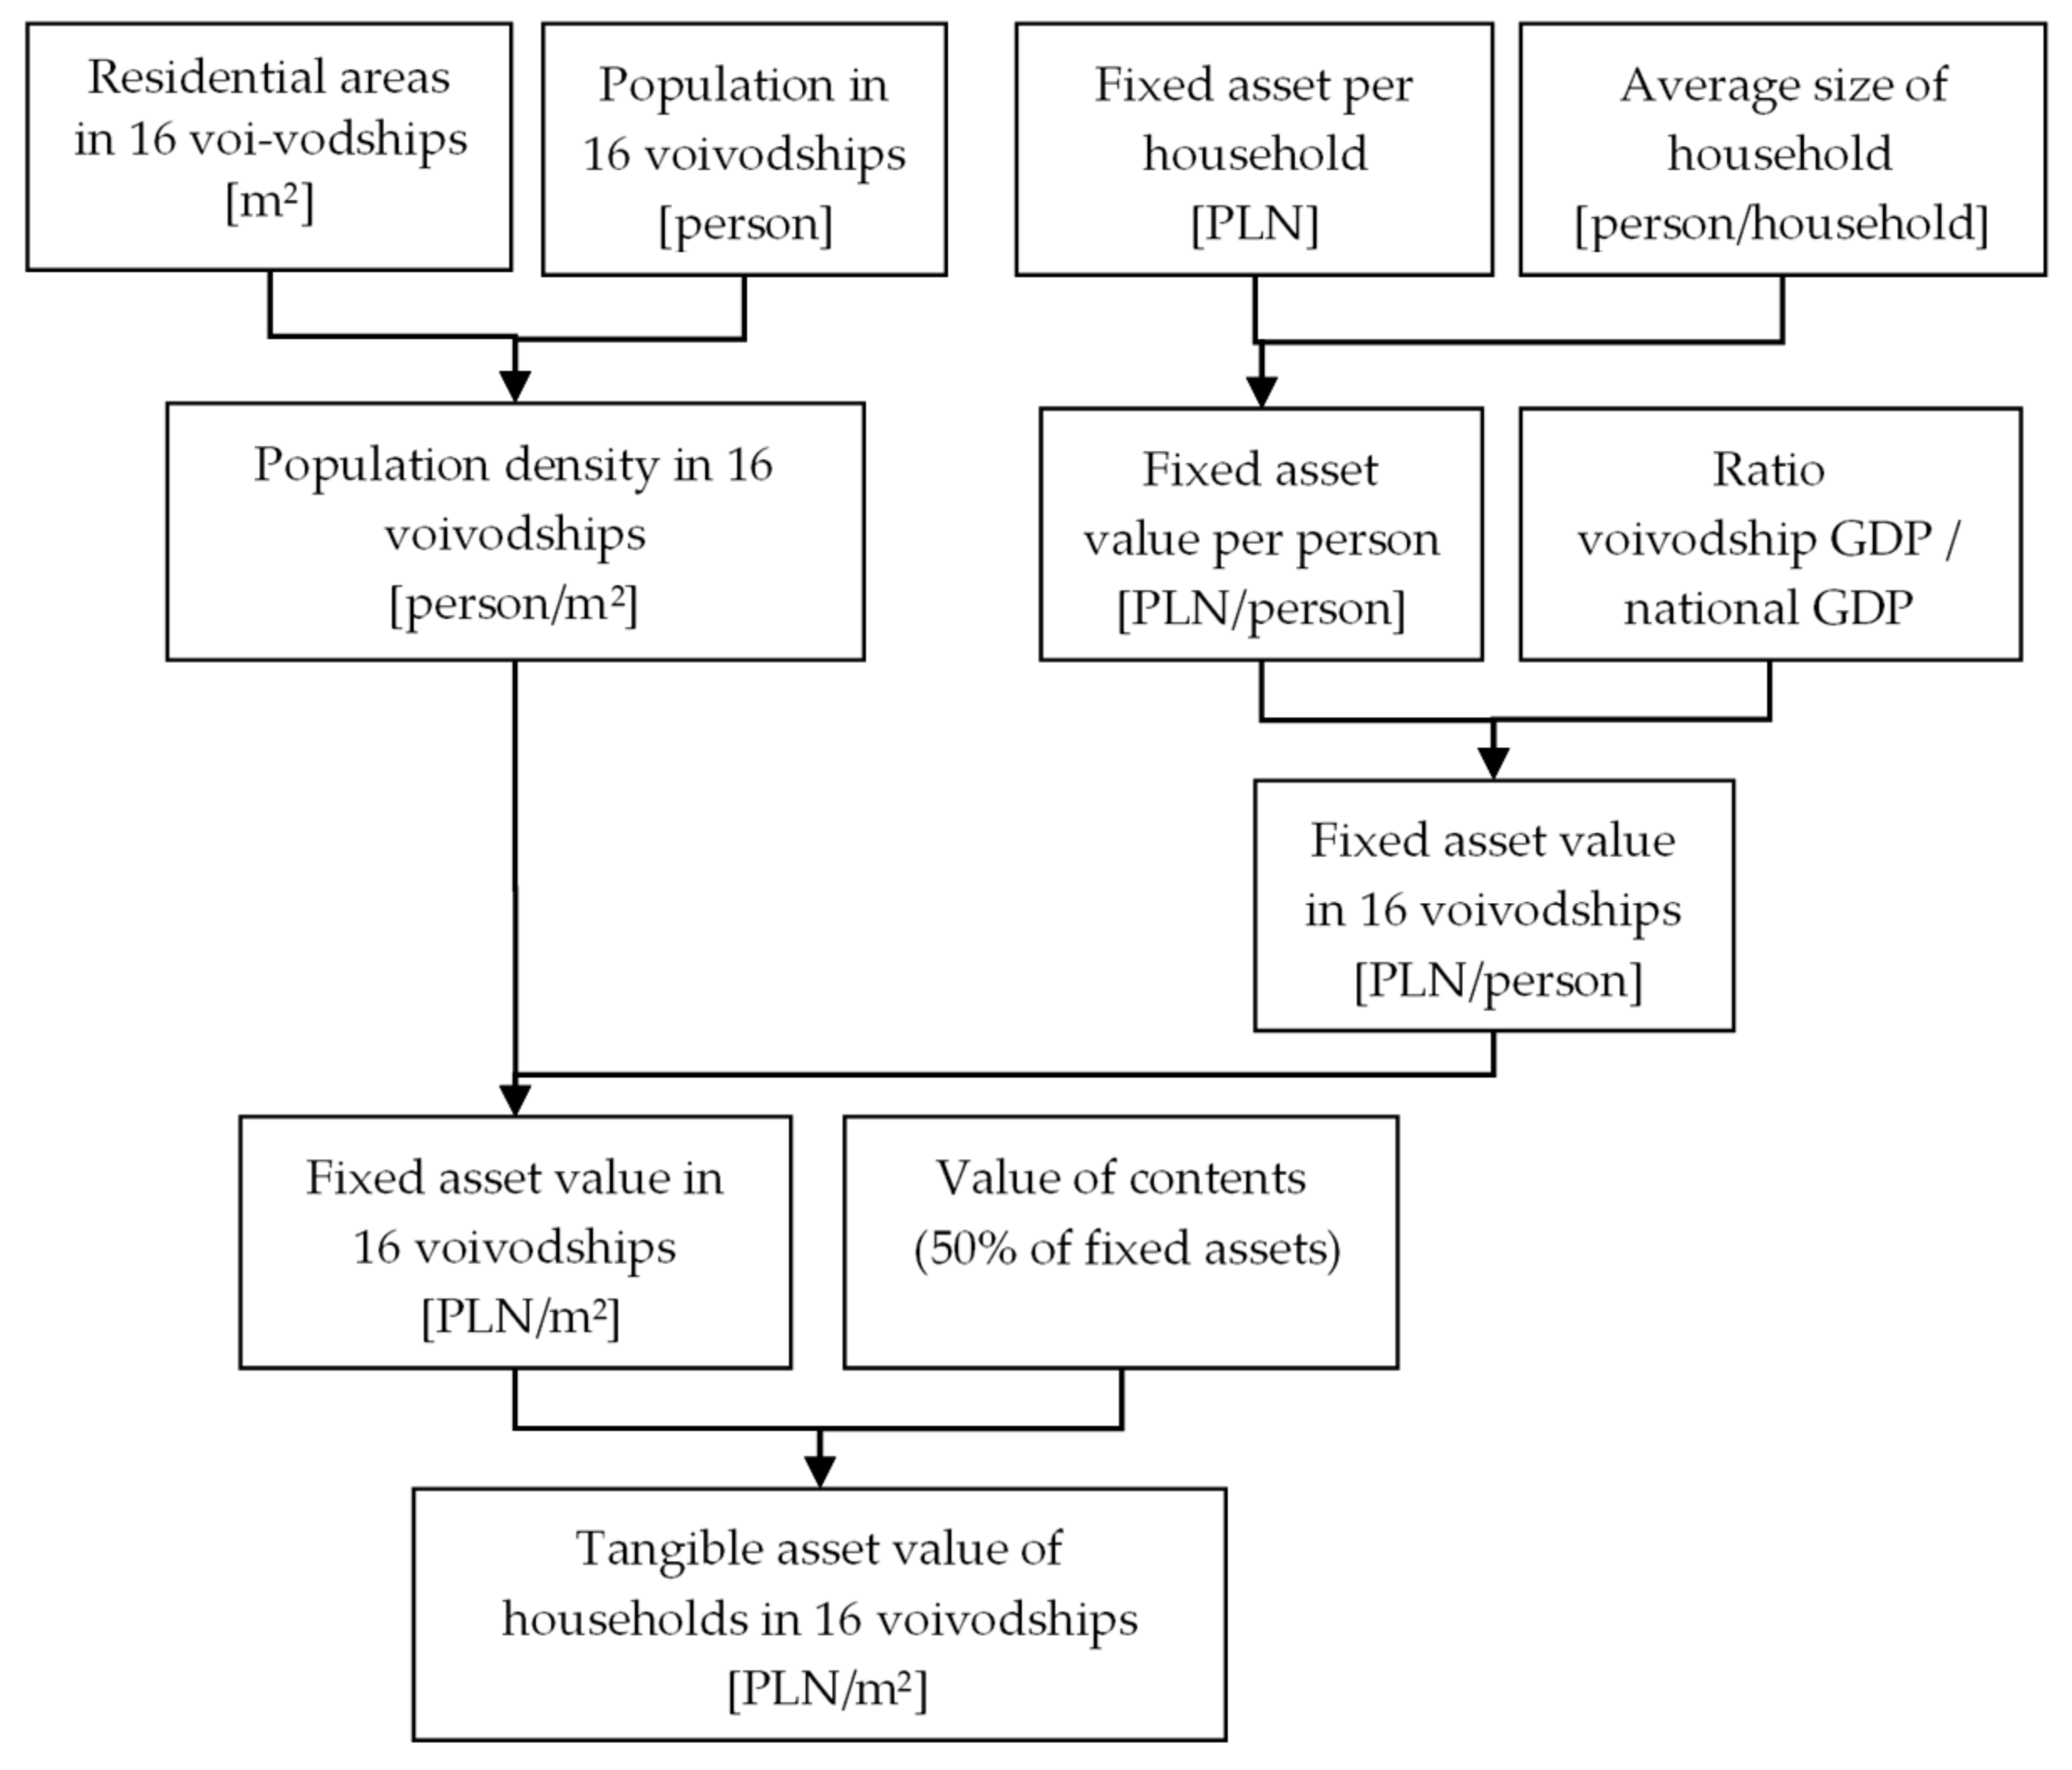
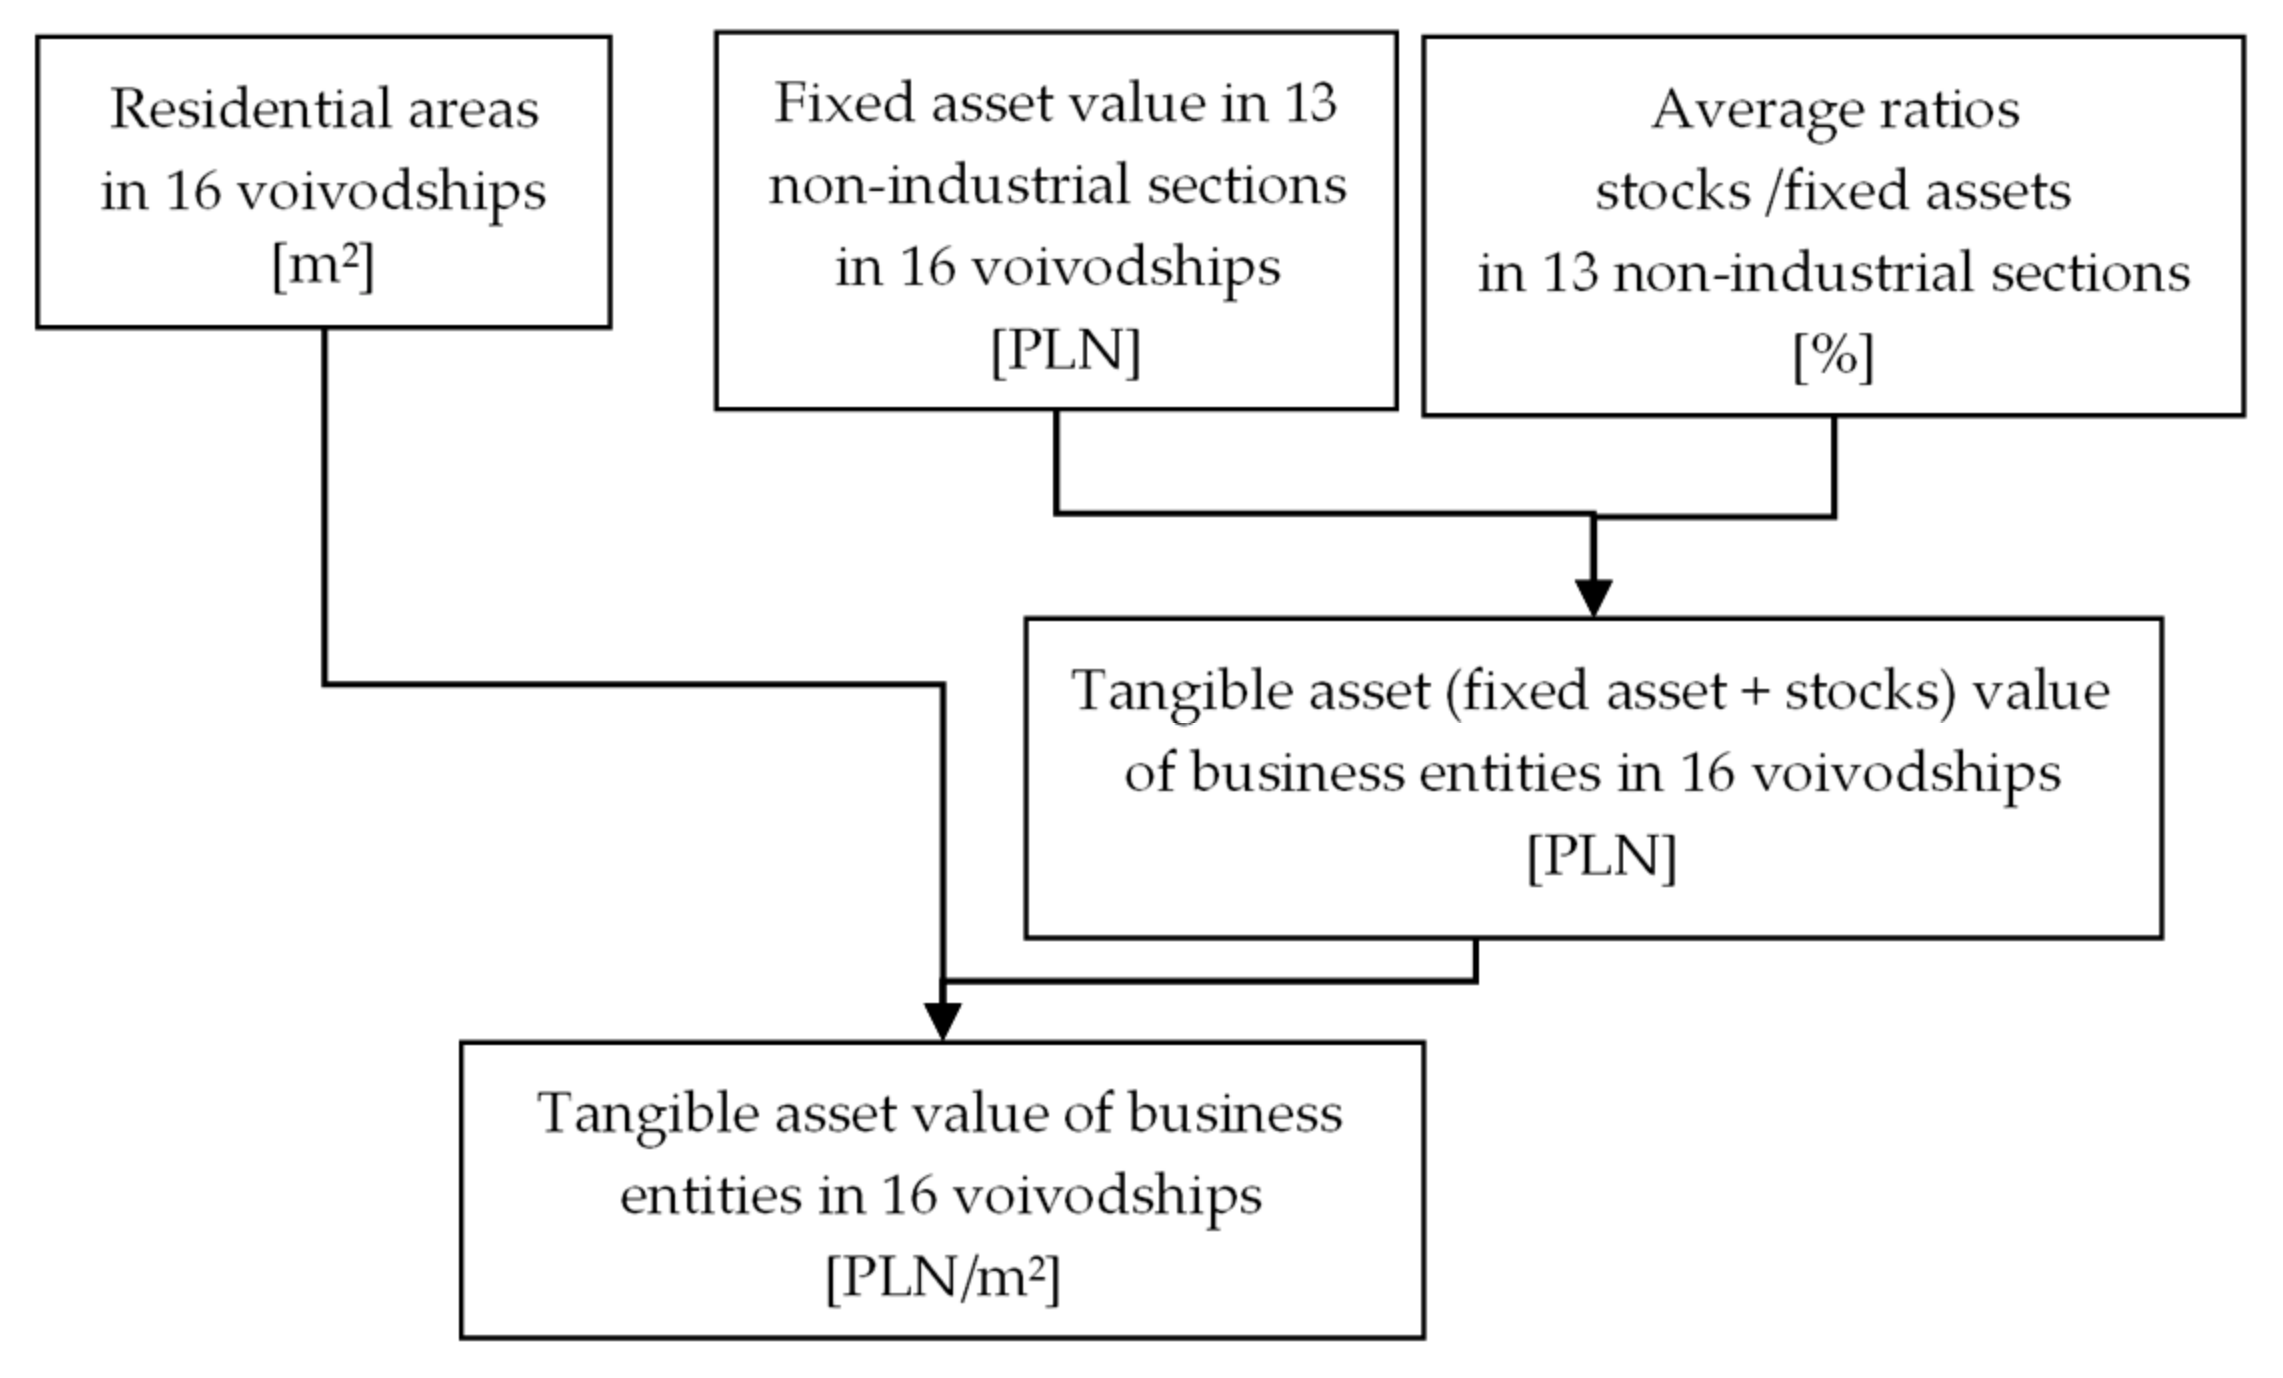
A schematic of the approach and the necessary calculations to determine the value of fixed assets and contents are presented for households in Figure 2 and for business entities (non-industrial sector) in Figure 3.
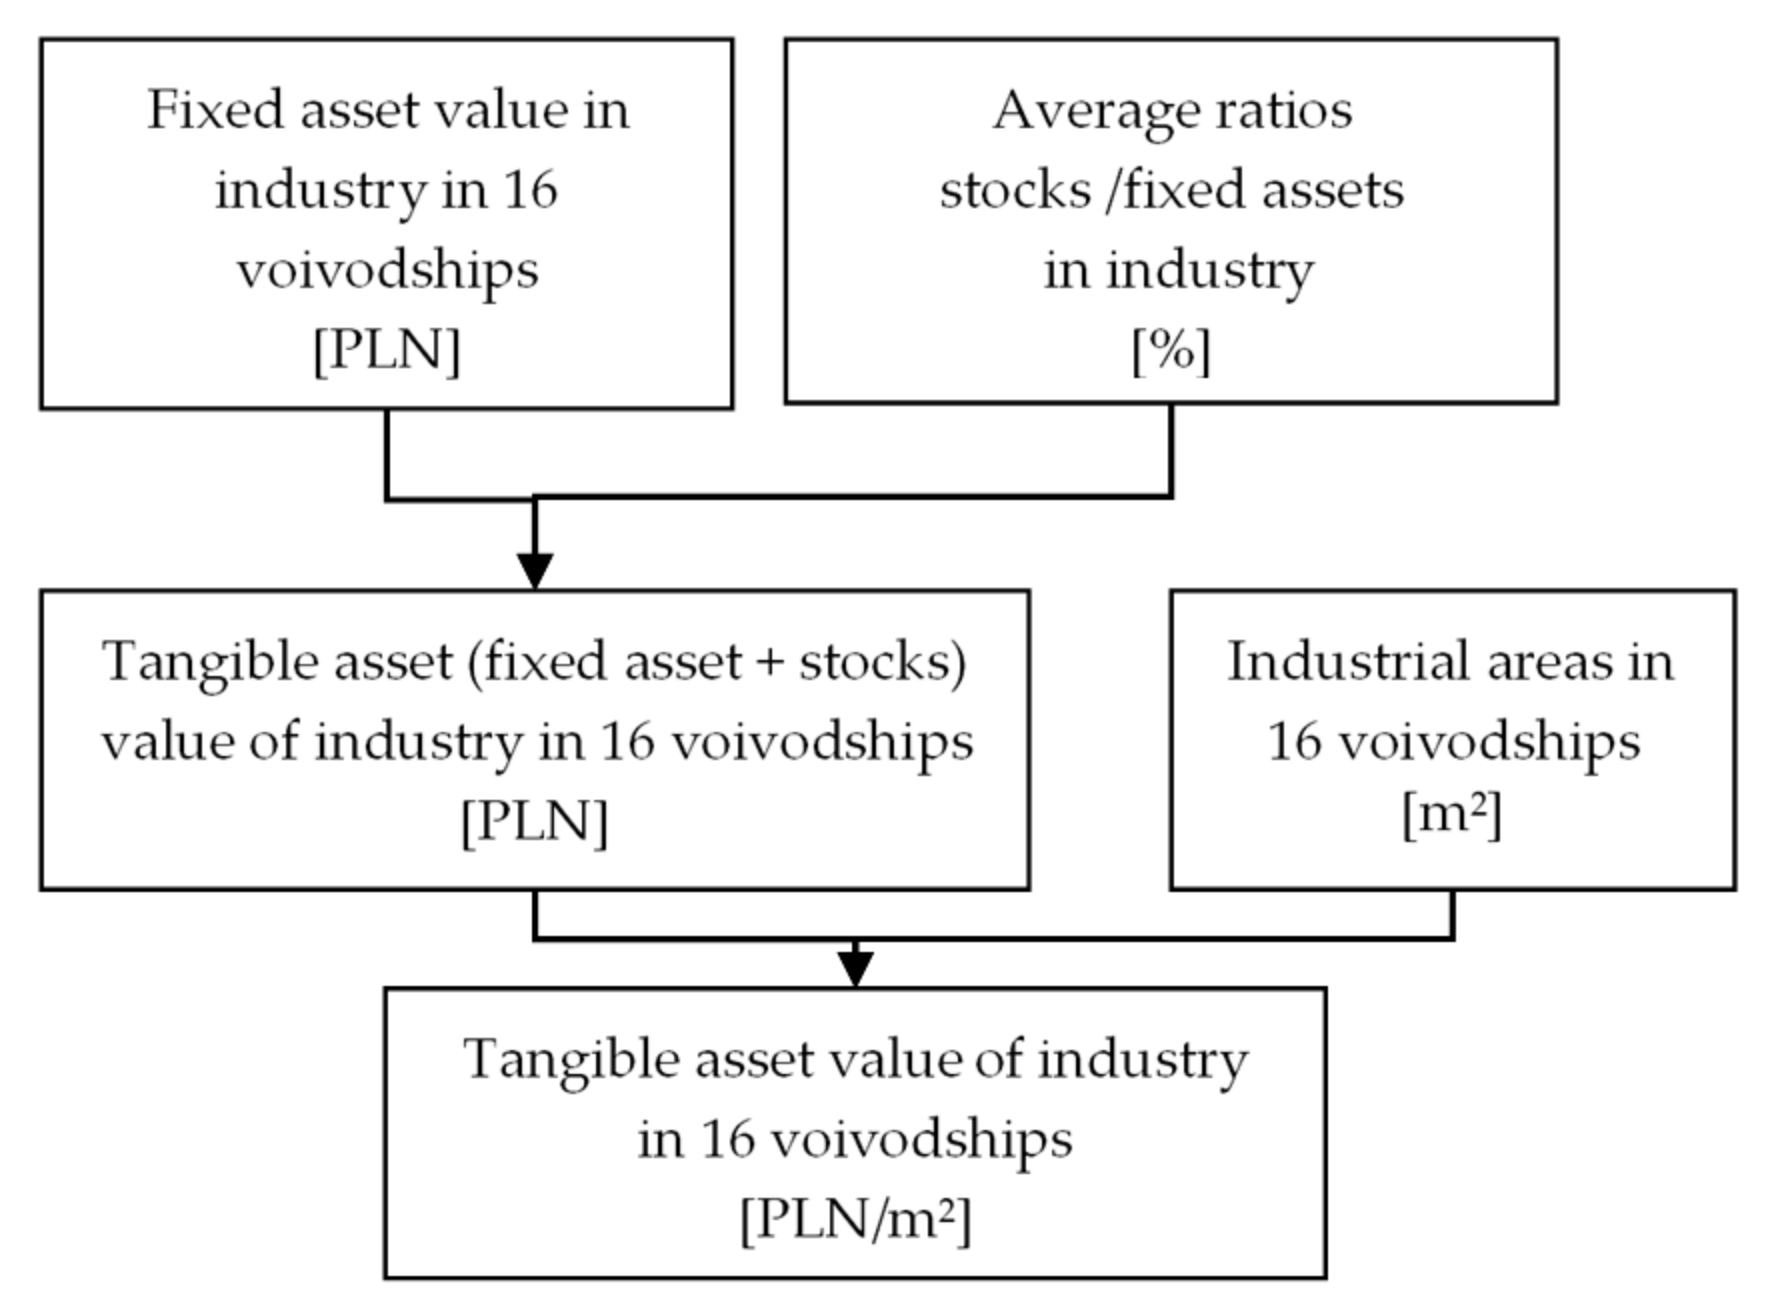
In the proposed approach to estimating the value of assets in industrial areas, the value of stocks is taken into account. The rules for estimating the value of assets in industrial areas are as follows (Figure 4):
- Asset value indicators are calculated for the voivodship level (16 voivodships).
- Asset value indicators are calculated as the ratio of the value of assets to the area of industrial land.
- Necessary data:
- ○
- Industrial areas: data regarding geodesic status and directions of land use by the Head Office of Geodesy and Cartography;
- ○
- Asset value in industrial areas;
- ○
- Fixed assets (buildings, machinery, vehicles, and others);
- ○
- Stocks (materials, products, goods, and others).
3. Results
3.1. Estimation of the Asset Value in Residential Areas
The approach outlined in Section 2 identifies the following for residential areas:
- The household asset value indicator, including house contents;
- The asset value of companies operating in residential areas, including the value of stocks.
3.1.1. The Asset of Households in Residential Areas
In 2017, the NBP published the results of the second survey of the wealth of Polish households [28], which was carried out in cooperation with Statistics Poland. The survey was based on 5858 responses containing information on the value of household wealth and debt. These national surveys can be used to estimate indicators of household asset values and potential flood losses. The household wealth survey included gathering information on accumulated resources (assets) and debt (liabilities). The collected data were broken down into two main asset groups: real assets and financial assets. The results showed that the value of household assets consists primarily of real assets (median value: PLN 293 thousand in 2016 prices (€67 thousand)); financial assets are definitely a less significant part of the assets (median value: PLN 15.3 thousand, (€3.5 thousand)) [42].
Among the real assets, the largest share was the value of the household main residence (70.7% of assets), followed by other real estate (12.3%), motor vehicles (3.8%), valuables (0.4%), and private business assets (12.8%) [42].
In further calculations, property related to running a business was excluded, and finally, household assets were valued at PLN 231.4 thousand (€53.0 thousand).
This value was converted into asset value per capita based on the average number of people in a household in 2016, which was 2.69 people. The obtained average value of household assets (real estates: PLN 81.9 thousand per person; vehicles: 3.8 thousand per person (€18.8 thousand and €0.9 thousand per person, respectively)) was then differentiated for voivodships (provinces), according to the approach in the first cycle of flood risk mapping [1], based on the GDP per capita in each of the 16 voivodships.
As the value of real estate did not include building contents in the survey, this value is included in order to verify the indicators. According to the literature, in the USA, the content value is approximately 43–71% of the value of buildings [45] and 50% in the HAZUS model (the Federal Emergency Management Agency (FEMA), USA) [44]; contents are 50% of houses in the Netherlands [15], 50% in the Flemish model (the Flemish Environmental Agency, Belgium) [4], and 23% in Barcelona, Spain [6]. Ultimately, it was assumed that the value of contents is 50% of the value of buildings.
Estimated asset values are based on 2016 prices; in order to apply them, they must be converted to current prices, and the price deflator may be the inflation index. However, this index is determined on the basis of consumer goods prices, which, in Poland, differ significantly from changes in asset prices, including real estate prices (and real estate is the majority of the property). While the changes in the prices of consumer goods and services have been subject to slight changes in recent years, 2014–2016 was characterized by low deflation (annual inflation indicators amounted to 99.1 in 2015/2014 and 99.4 in 2016/2015). The following years saw a slight increase in prices: the indices in the subsequent years amounted to 102.0, 101.6, and 102.3 [50]. Changes in the prices of consumer goods and services in the period 2016–2019 amounted to a total of 106.02. On the other hand, in the real estate market, an increase in prices was observed, significantly exceeding the increase in the prices of consumer goods, and changes in residential premises in the years 2016–2019 amounted to 114.93 [51]. Therefore, a deflator based on flat prices was used to convert real estate prices, while a deflator based on inflation was used for the value of vehicles. Indicators of the value of household assets at 2019 prices were determined by updating prices (deflators: 114.93 and 106.02) and adding the value of building contents (increased by 50%) (Table 2).
3.1.2. The Asset of Business Entities in Residential Areas
Determining the value of the assets of business entities operating in residential areas consists of setting the value of fixed assets and stocks in particular sectors of the national economy.
Based on data on the fixed asset values in individual sectors of the economy by voivodship, the value of fixed assets was estimated for the following sectors (NACE classification): construction, wholesale, and retail trade; repair of motor vehicles and motorcycles; transportation and storage; accommodation and food service activities; information and communication; financial and insurance activities; real estate activities; professional, scientific, and technical activities; administrative and support service activities; public administration and defense; compulsory social security; education; human health and social work activities; arts, entertainment, and recreation; and other service activities. For the “transport and storage” sector, 80% of fixed assets are included in further calculations, and the remaining 20% of assets belong to the transport sub-sector (roads, tracks, stations, etc.) and are included in the asset value indicators in the communication areas.
It is assumed that the assets of business entities are evenly distributed over residential areas, and a value per m2 can be determined. The fixed asset value indicators for each voivodship are presented in Table 3.
Apart from fixed assets, business entities have current assets, among which stocks (materials, goods, work in progress, and finished products) are exposed to flooding. Statistics Poland does not publish the value of stocks in individual sectors of the economy broken down by voivodship. To determine the value of stocks of economic entities in individual voivodships, nationwide data on the financial results of economic entities for the last 5 years (2015–2019) were used.
On the basis of these data, the average national indicators were estimated, e.g., the ratio of the value of stocks to the value of fixed assets in individual sectors of the economy (Table 4). These ratios were used to estimate the value of stocks in individual sectors by voivodship, and then “the stocks/fixed assets ratio” was calculated in each voivodship.
Stocks/fixed assets ratios were used to estimate the value of stocks and, finally, the total value of assets of business entities, taking into account both fixed assets and stocks in 16 voivodeships (Table 5).
3.1.3. The Total Values of Assets in Residential Areas
The final results of the calculations are the total values of assets in residential areas, including both household assets (buildings with contents and vehicles) and assets of business entities (fixed assets and stocks) (Table 6).
3.2. Estimation of the Asset Value in Industrial Areas
In the first cycle of flood risk mapping, the value of assets in industrial areas was determined on the basis of data on the fixed asset value in the industry, and the value of stocks was not taken into account. The proposed approach adds the value of stocks to the total value of assets in industrial areas.
In order to determine the current values of fixed assets, indicators were calculated based on the latest data from 2019 published by the Polish statistical system for individual voivodeships:
- Fixed assets in industry (NACE sectors: B mining and quarrying; C manufacturing; D electricity, gas, steam and air conditioning supply; E water supply, sewerage, waste management, and remediation activities): data published annually by Statistics Poland;
- Industrial areas: data regarding geodesic status and directions of land use by the Head Office of Geodesy and Cartography.
The data and determined asset values are shown in Table 7.
Statistics Poland annually publishes data on “financial results of non-financial enterprises”, and stocks account for approximately 28% of the value of fixed assets in the industry (sector industry by NACE). The stock level in a given year may be random; therefore, for the purposes of the analyses, the average value of the ratio of stocks to fixed assets was determined from the data for the last 5 years (2015–2019) (Table 8).
The average ratio of stocks to fixed assets was subsequently used to determine the final asset value in industrial areas, taking into account fixed assets and stocks (Table 9).
In order to compare and discuss the results, the obtained values are summarized in Table 10, together with the values that would be estimated by only using the inflation deflator to update the indices from the first cycle. In the first cycle of flood risk management planning, the values of assets in residential areas were developed and published based on 2008 prices. The total cumulative inflation index for the period from 2008 to 2019 is 121.02. The values updated to 2019 prices (second column of Table 10) were compared with the values proposed in this study.
The determined ratios of values from the first cycle to the new values show that the developed asset values in residential areas in each voivodship are twice as high as before. Such a significant change in their value is mainly due to three reasons:
- Updating the value of assets with only inflation may lead to underestimation, as it is established on the basis of changes in the prices of consumer goods (the main goods and services are food, housing with utility bills, clothing, transport, communications, health, recreation, etc.). Expenditures on furnishings and durable goods are of little importance in the construction of the entire index, and recent years show that Polish households are spending increasingly more in this sector, thus increasing the value of the main residence. In 2008–2019, the dynamics of this kind of expenditure was 70%, with real gross disposable income in the household sector increasing by 37% [57].
- The low values of indicators from 2008 were significantly influenced by the method of converting German indicators (property value per person) through the ratio of Polish to German GDP per capita, the value of which was 0.45. The data presented in the NPB report show that the current discrepancy in the statistical value of household assets between Germany and Poland is not as large as that in GDP in 2006. Analysis of the median value of tangible assets of households in Poland (EUR 67 thousand) and in Germany (EUR 91 thousand) indicates a ratio of approx. 0.75 (the ratio of GDP per capita in 2019 was 0.61, according to [37]).
- The third reason was that business entities operating in residential areas were not included in the asset values in the first cycle of FRMP preparation.
The values of assets for industrial areas are increased by the value of inventories, which increases the value of property and potential losses by approximately 28; this is a common approach to wealth estimation in most countries.
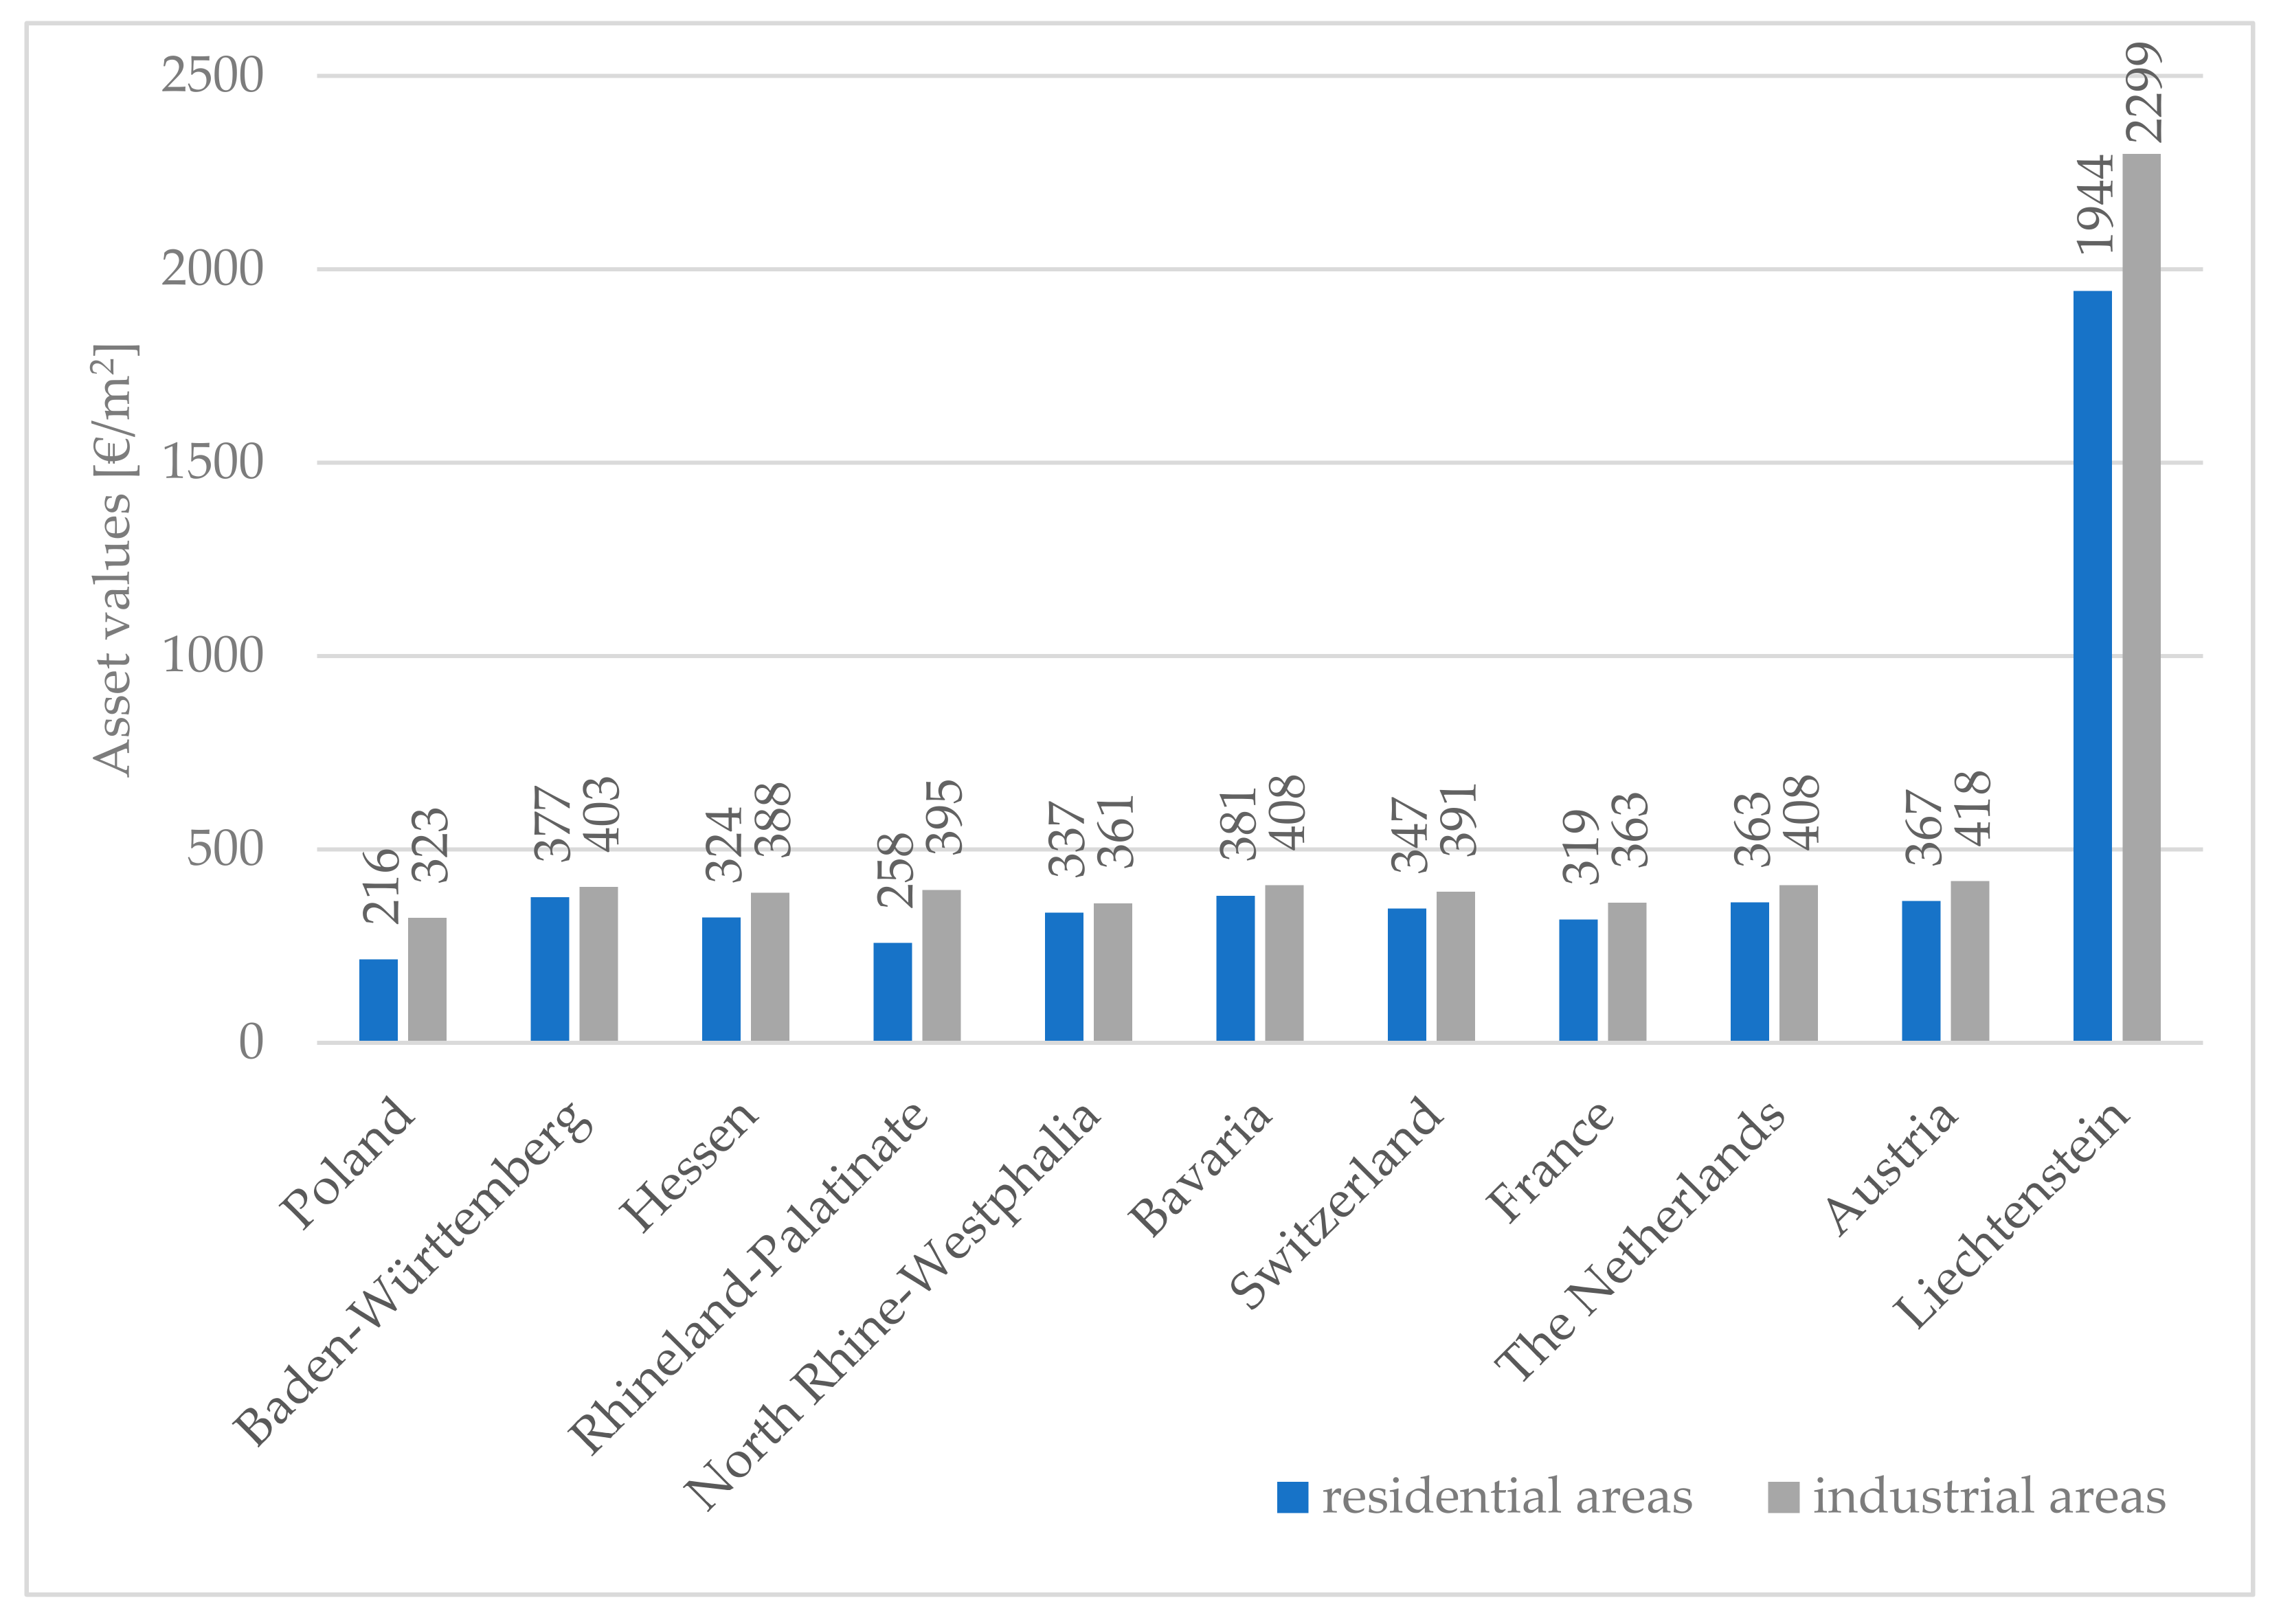
In order to analyze and discuss the obtained results, Figure 5 also compares the values with analogous indicators used in the Rhine Atlas in individual federal states in Germany, as well as in Switzerland, France, the Netherlands, Austria, and Liechtenstein [47].
The proposed asset values are similar (but lower) to those adopted in the countries covered by the analyses of the Rhine Atlas (except for the indicators for Liechtenstein, which differ significantly from all of them). Polish indicators are the lowest; for residential areas they are at the level of approx. 57–84% of the indicators from the Atlas of the Rhine (without taking Lichtenstein into account). The smallest difference is between the index for Poland and the index for Rhineland-Palatinate, which may be due to the fact that it is a regional index that covers the least populated areas, so it is also the lowest index in Germany.
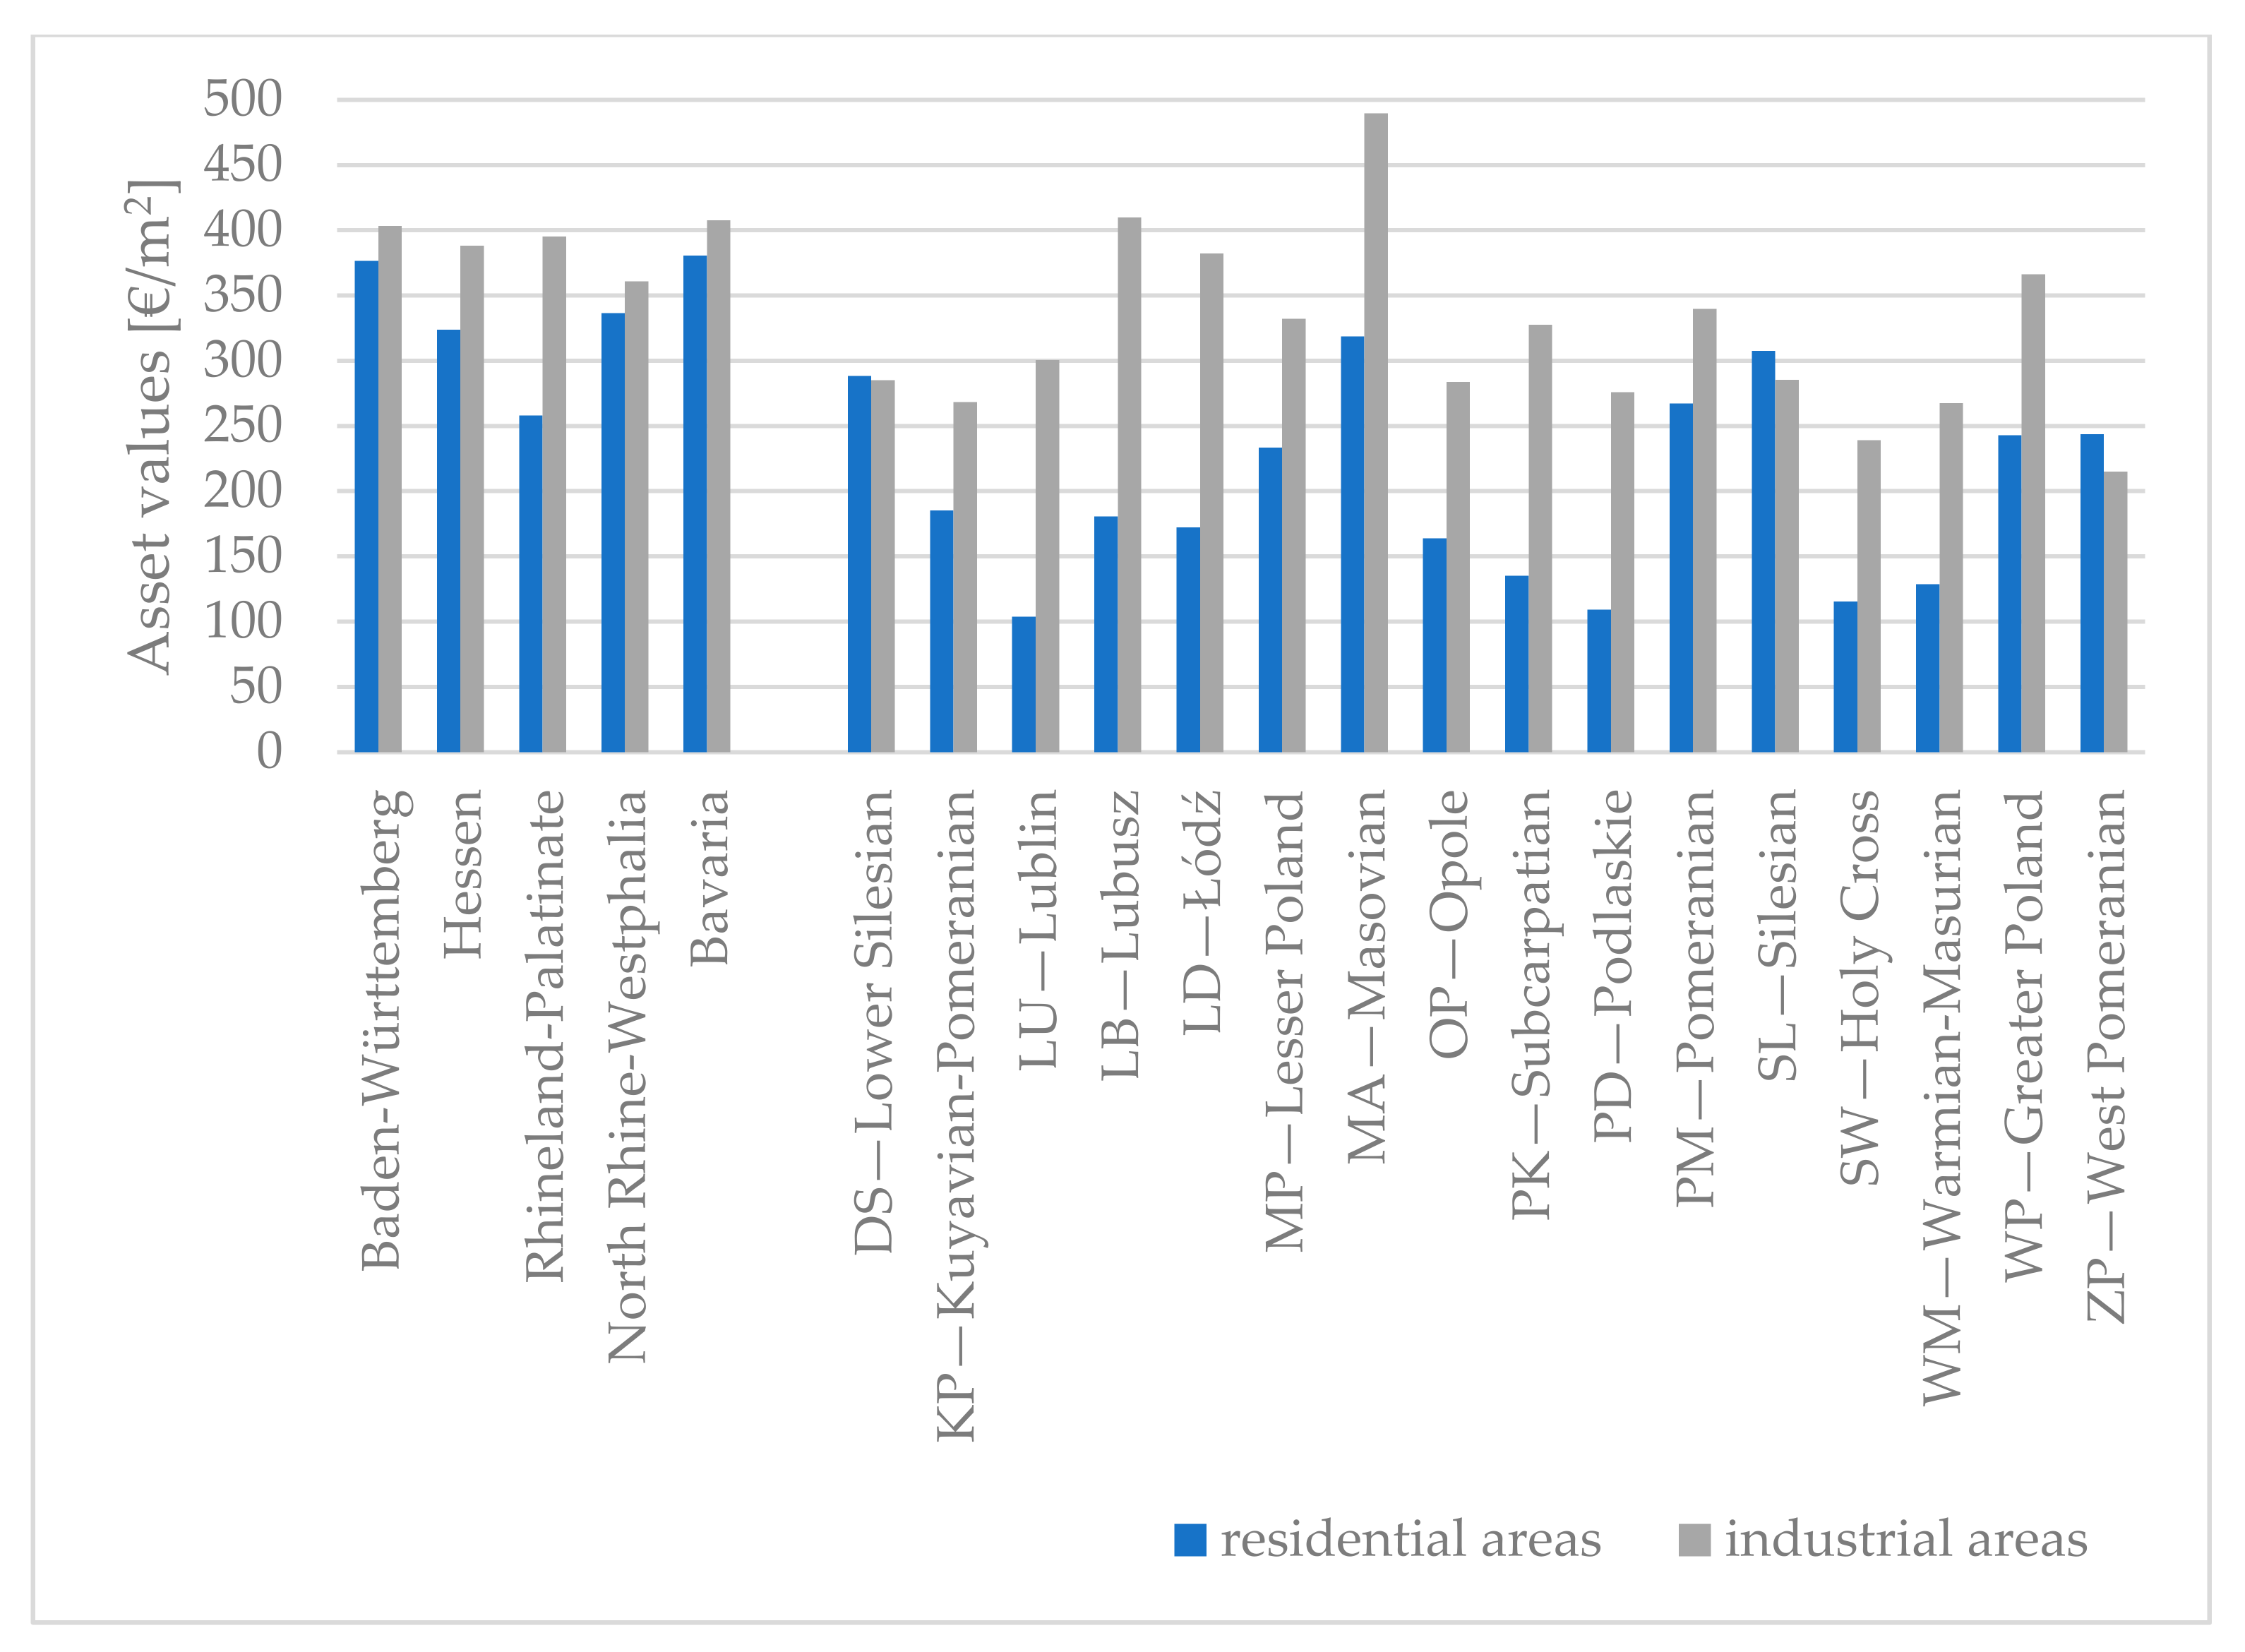
Figure 6 compares the obtained voivodeship indicators with the regional German indicators.
Comparison of regional Polish and German indicators reveals the following:
- Asset values for residential areas:
- The Polish indicators do not exceed the maximum German values. The maximum Polish values are for Masovia—the most developed voivodeship in Poland; this indicator (319 €/m2) is 84% of the highest Bavaria indicator.
- For the least developed Polish voivodships, Lublin and Podlaskie, asset values for settlements (104 and 109 €/m2, respectively) are 40% and 42% of the lowest Rhineland-Palatinate indicator (258 €/m2).
- Asset values for industrial areas:
- The indicators exceed the German values for only two voivodships. The maximum values are for Masovia—the most developed voivodeship in Poland—for which this indicator (490 €/m2) is 120% higher than the largest Bavaria indicator, and for Lubusz (410 €/m2), for which it is 101% higher than the largest Bavaria indicator.
- For the least industrialized Polish voivodships, West Pomeranian and Holy-Cross, the asset values for the industry (215 and 239 €/m2, respectively) are 60% and 66% of the lowest North Rhine-Westphalia indicator (361 €/m2).
4. Discussion
The approach based on official statistics, extensive household wealth surveys, and land use data was developed to value the exposures (property values in flood-prone areas) that are needed to conduct macro-level flood risk assessments.
Asset value indicators were established for residential and industrial areas. Improvements compared to already existing approaches are:
- For residential areas, the inclusion of household wealth data and not using the transfer of German index values was an improvement. The conversion of German indicators was made on the basis of data from 2006, when the ratio of Polish to German GDP per capita was only 0.45 and not taking into account that the Polish GDP per capita in the period 2006–2019 was highly dynamic. Recently, this ratio has reached the level of 0.61 in 2019 [37,38]. Also, other statistical data show that the wealth of households has changed significantly in recent years, going beyond the inflationary changes, e.g., the available income of households increased by 139% in 2006–2019 [58]. Transferring indices from other countries can carry many inaccuracies, and the value of maximum damage is one of the most important variables in assessing the size of damages [59]. Research by Molinari et al. also indicated that exposure pricing is a key variable for flood damage models, and one of the recommendations was, when applying damage model from other countries, to pay special attention to its transferability, which requires the availability of data for verification and adaptation of the model [22]. In this study, the values of household assets were determined using national data from a large survey conducted by the Polish central bank and will better reflect actual values.
- For residential areas, another improvement in asset estimation is the inclusion of the assets of business entities operating in residential areas. Due to the adopted division into types of areas and not distinguishing areas such as commercial, service, etc., flood losses in sectors other than industry may have been underestimated. In industrial areas, only assets of companies in the four sections of economy classified by NACE as “industry” (B mining and quarrying; C manufacturing; D electricity, gas, steam, and air conditioning supply; E water supply, sewerage, waste management and remediation activities) were valued. The assets of these four sectors represent only 33% of the assets of all companies [48]. The remaining sectors mostly operate in residential areas. This study included the fixed assets of these other sectors in the residential area indicators. The developed method is similar to that of Seifert et al. [31]; official statistical data on the assets of companies were used, broken down into 14 different types of economic activity, and divided into voivodeships. The value of stocks was also taken into account, based on the established nationwide ratios of stocks in relation to fixed assets, and they were also divided into 14 sectors. Stock value is a significant part of asset value and is usually included in estimates of maximum damages and flood losses [6,12,45], and the recent review study by Huizinga et al. provides indicators that incorporate the value of the stocks in flood damage models [44].
- For industrial areas, the presented method calculates the asset values throughout Poland broken down by voivodships, and the improvement, compared to the already existing approach, is the inclusion of stocks.
The main use of estimated asset values is flood risk management. Planning measures used to improve flood protection requires a cost–benefit analysis, and the benefits of flood protection measures can be expressed as avoided losses. To estimate the avoided losses, it is necessary to know the value of the asset at risk. The determined asset values are derived from real national data and will replace indicators adapted from other countries. In addition, the values typically omitted from the estimates of flood losses are taken into account, namely assets of business entities operating in residential areas, the content of residential buildings, and current assets (stocks) of industrial enterprises. This methodology contributes to a better estimation of potential flood losses and flood risk, and it can thus improve flood risk management plans. The proposed approach, as an extension in relation to the first cycle, was implemented in the second cycle of FRMP preparation in Poland.
As evidenced by the study of Grünthal et al. when aggregated to the regional level, some areas may be over- or underestimated due to an even allocation of assets within the region [30]. Undoubtedly, diversification to the municipal level needs further research [20,31,33]. In the future, an attempt will be made to develop a method that will estimate the asset values of industry and other sectors at the municipal level, although unfortunately the lack of employment data for specific sectors at the municipal level makes it difficult to apply the approach developed in German studies.
Funding
The study was financed under R&D funds of Department of Geoengineering and Water Management, Cracow University of Technology.
Institutional Review Board Statement
Not applicable.
Informed Consent Statement
Not applicable.
Data Availability Statement
Not applicable.
Conflicts of Interest
The author declares no conflict of interest. The funding sponsors had no role in the design of the study; in the collection, analyses, or interpretation of data; in the writing of the manuscript, or in the decision to publish the results.
References
- Fröhlich, K.; Żylicz, T.; Kwiatkowski, J.; Spatka, J.; Zeman, E. Metodyka Opracowania Map Ryzyka Powodziowego; Krajowy Zarząd Gospodarki Wodnej: Warszawa, Poland, 2009; p. 43. [Google Scholar]
- Albano, R.; Samela, C.; Crăciun, I.; Manfreda, S.; Adamowski, J.; Sole, A.; Sivertun, Å.; Ozunu, A. Large Scale Flood Risk Mapping in Data Scarce Environments: An Application for Romania. Water 2020, 12, 1834. [Google Scholar] [CrossRef]
- Budiyono, Y.; Aerts, J.; Brinkman, J.; Marfai, M.A.; Ward, P. Flood Risk Assessment for Delta Mega-Cities: A Case Study of Jakarta. Nat. Hazards 2015, 75, 389–413. [Google Scholar] [CrossRef]
- Jongman, B.; Kreibich, H.; Apel, H.; Barredo, J.I.; Bates, P.D.; Feyen, L.; Gericke, A.; Neal, J.; Aerts, J.C.J.H.; Ward, P.J. Comparative Flood Damage Model Assessment: Towards a European Approach. Nat. Hazards Earth Syst. Sci. 2012, 12, 3733–3752. [Google Scholar] [CrossRef] [Green Version]
- Kriščiukaitienė, I.; Baležentis, T.; Galnaitytė, A.; Namiotko, V. A Methodology for Flood Risk Appraisal in Lithuania. J. Water Land Dev. 2015, 25, 8. [Google Scholar] [CrossRef]
- Martínez-Gomariz, E.; Forero-Ortiz, E.; Guerrero-Hidalga, M.; Castán, S.; Gómez, M. Flood Depth–Damage Curves for Spanish Urban Areas. Sustainability 2020, 12, 2666. [Google Scholar] [CrossRef] [Green Version]
- Merz, B.; Kreibich, H.; Schwarze, R.; Thieken, A. Review Article “Assessment of Economic Flood Damage”. Nat. Hazards Earth Syst. Sci. 2010, 10, 1697–1724. [Google Scholar] [CrossRef]
- Meyer, V.; Priest, S.; Kuhlicke, C. Economic Evaluation of Structural and Non-Structural Flood Risk Management Measures: Examples from the Mulde River. Nat. Hazards 2012, 62, 301–324. [Google Scholar] [CrossRef]
- Meyer, V.; Becker, N.; Markantonis, V.; Schwarze, R.; van den Bergh, J.C.J.M.; Bouwer, L.M.; Bubeck, P.; Ciavola, P.; Genovese, E.; Green, C.; et al. Review Article: Assessing the Costs of Natural Hazards—State of the Art and Knowledge Gaps. Nat. Hazards Earth Syst. Sci. 2013, 13, 1351–1373. [Google Scholar] [CrossRef]
- Paprotny, D.; Sebastian, A.; Morales-Nápoles, O.; Jonkman, S.N. Trends in Flood Losses in Europe over the Past 150 Years. Nat. Commun. 2018, 9, 1985. [Google Scholar] [CrossRef]
- Penning-Rowsell, E.; Priest, S.; Parker, D.; Morris, J.; Tunstall, S.; Viavattene, C.; Chatterton, J.; Owen, D. Flood and Coastal Erosion Risk Management: A Manual for Economic Appraisal; Routledge: London, UK, 2013; ISBN 978-0-203-06639-3. [Google Scholar]
- Scawthorn, C.; Flores, P.; Blais, N.; Seligson, H.; Tate, E.; Chang, S.; Mifflin, E.; Thomas, W.; Murphy, J.; Jones, C.; et al. HAZUS-MH Flood Loss Estimation Methodology. II. Damage and Loss Assessment. Nat. Hazards Rev. 2006, 7, 72–81. [Google Scholar] [CrossRef]
- Schmid-Breton, A.; Kutschera, G.; Botterhuis, T.; The ICPR Expert Group ‘Flood Risk Analysis’ (EG HIRI). A Novel Method for Evaluation of Flood Risk Reduction Strategies: Explanation of ICPR FloRiAn GIS-Tool and Its First Application to the Rhine River Basin. Geosciences 2018, 8, 371. [Google Scholar] [CrossRef] [Green Version]
- Zabret, K.; Hozjan, U.; Kryžanowsky, A.; Brilly, M.; Vidmar, A. Development of Model for the Estimation of Direct Flood Damage Including the Movable Property. J. Flood Risk Manag. 2018, 11, S527–S540. [Google Scholar] [CrossRef]
- De Moel, H.; van Vliet, M.; Aerts, J.C.J.H. Evaluating the Effect of Flood Damage-Reducing Measures: A Case Study of the Unembanked Area of Rotterdam, the Netherlands. Reg. Environ. Chang. 2014, 14, 895–908. [Google Scholar] [CrossRef]
- Kreibich, H.; Seifert, I.; Merz, B.; Thieken, A.H. Development of FLEMOcs—A New Model for the Estimation of Flood Losses in the Commercial Sector. Hydrol. Sci. J. 2010, 55, 1302–1314. [Google Scholar] [CrossRef]
- Scorzini, A.R.; Frank, E. Flood Damage Curves: New Insights from the 2010 Flood in Veneto, Italy: Flood Damage Curves: New Insights from Italy. J. Flood Risk Manag. 2017, 10, 381–392. [Google Scholar] [CrossRef]
- Wünsch, A.; Herrmann, U.; Kreibich, H.; Thieken, A.H. The Role of Disaggregation of Asset Values in Flood Loss Estimation: A Comparison of Different Modeling Approaches at the Mulde River, Germany. Environ. Manag. 2009, 44, 524–541. [Google Scholar] [CrossRef] [PubMed] [Green Version]
- Godyń, I.; Mączałowski, A.; Nachlik, E. Ocena i Przeciwdziałanie Zagrożeniu Powodziowemu; Wydawnictwo Politechniki Krakowskiej: Kraków, Poland, 2021; ISBN 978-83-66531-77-2. [Google Scholar]
- Kleist, L.; Thieken, A.H.; Köhler, P.; Müller, M.; Seifert, I.; Borst, D.; Werner, U. Estimation of the Regional Stock of Residential Buildings as a Basis for a Comparative Risk Assessment in Germany. Nat. Hazards Earth Syst. Sci. 2006, 6, 541–552. [Google Scholar] [CrossRef]
- Dottori, F.; Figueiredo, R.; Martina, M.L.V.; Molinari, D.; Scorzini, A.R. INSYDE: A Synthetic, Probabilistic Flood Damage Model Based on Explicit Cost Analysis. Nat. Hazards Earth Syst. Sci. 2016, 16, 2577–2591. [Google Scholar] [CrossRef] [Green Version]
- Molinari, D.; Scorzini, A.R.; Arrighi, C.; Carisi, F.; Castelli, F.; Domeneghetti, A.; Gallazzi, A.; Galliani, M.; Grelot, F.; Kellermann, P.; et al. Are Flood Damage Models Converging to “Reality”? Lessons Learnt from a Blind Test. Nat. Hazards Earth Syst. Sci. 2020, 20, 2997–3017. [Google Scholar] [CrossRef]
- Thieken, A.; Ackermann, V.; Elmer, F.; Kreibich, H.; Kuhlmann, B.; Kunert, U.; Maiwald, H.; Merz, B.; Piroth, K.; Schwarz, J.; et al. Methods for the Evaluation of Direct and Indirect Flood Losses. In Proceedings of the (RIMAX Contributions at the 4th International Symposium on Flood Defence), 4th International Symposium on Flood Defence (ISFD4), Toronto, ON, Canada, 6–8 May 2008; p. 10. Available online: https://gfzpublic.gfz-potsdam.de/pubman/faces/ViewItemFullPage.jsp?itemId=item_6063_14 (accessed on 30 August 2021).
- Arrighi, C.; Brugioni, M.; Castelli, F.; Franceschini, S.; Mazzanti, B. Flood Risk Assessment in Art Cities: The Exemplary Case of Florence (Italy). J. Flood Risk Manag. 2018, 11, S616–S631. [Google Scholar] [CrossRef]
- Arrighi, C.; Rossi, L.; Trasforini, E.; Rudari, R.; Ferraris, L.; Brugioni, M.; Franceschini, S.; Castelli, F. Quantification of Flood Risk Mitigation Benefits: A Building-Scale Damage Assessment through the RASOR Platform. J. Environ. Manag. 2018, 207, 92–104. [Google Scholar] [CrossRef] [PubMed]
- Dutta, D.; Herath, S.; Musiake, K. A Mathematical Model for Flood Loss Estimation. J. Hydrol. 2003, 277, 24–49. [Google Scholar] [CrossRef]
- Blong, R. A New Damage Index. Nat. Hazards 2003, 30, 1–23. [Google Scholar] [CrossRef]
- Carisi, F.; Schröter, K.; Domeneghetti, A.; Kreibich, H.; Castellarin, A. Development and Assessment of Uni- and Multivariable Flood Loss Models for Emilia-Romagna (Italy). Nat. Hazards Earth Syst. Sci. 2018, 18, 2057–2079. [Google Scholar] [CrossRef] [Green Version]
- Pistrika, A.; Tsakiris, G.; Nalbantis, I. Flood Depth-Damage Functions for Built Environment. Environ. Process. 2014, 1, 553–572. [Google Scholar] [CrossRef] [Green Version]
- Grünthal, G.; Thieken, A.H.; Schwarz, J.; Radtke, K.S.; Smolka, A.; Merz, B. Comparative Risk Assessments for the City of Cologne—Storms, Floods, Earthquakes. Nat. Hazards 2006, 38, 21–44. [Google Scholar] [CrossRef] [Green Version]
- Seifert, I.; Thieken, A.H.; Merz, M.; Borst, D.; Werner, U. Estimation of Industrial and Commercial Asset Values for Hazard Risk Assessment. Nat. Hazards 2010, 52, 453–479. [Google Scholar] [CrossRef]
- Oliveri, E.; Santoro, M. Estimation of Urban Structural Flood Damages: The Case Study of Palermo. Urban Water 2000, 2, 223–234. [Google Scholar] [CrossRef]
- Thieken, A.H.; Müller, M.; Kleist, L.; Seifert, I.; Borst, D.; Werner, U. Regionalisation of Asset Values for Risk Analyses. Nat. Hazards Earth Syst. Sci. 2006, 6, 167–178. [Google Scholar] [CrossRef]
- Rheine Atlas 2001; International Commission for the Protection of the Rhine (ICPR): Koblenz, Germany, 2001; Available online: https://www.iksr.org/fileadmin/user_upload/Dokumente_de/Rhein-Atlas/english/English_text.pdf (accessed on 30 August 2021).
- Godyń, I. Ocena efektywności ekonomicznej inwestycji przeciwpowodziowych (Evaluation of the economic efficiency of flood protection projects). Gospod. W Prakt. I Teor. 2015, 1, 5–22. [Google Scholar] [CrossRef]
- Dumieński, G.; Krzyżanowski, M.; Tiukało, A. Municipality’s Financial Potential and Policy of Flood Risk Management in Poland. E3S Web Conf. 2018, 44, 20184400037. [Google Scholar] [CrossRef]
- EUROSTAT. GDP per Capita in Purchasing Power Standards (PPS). Available online: https://ec.europa.eu/eurostat/data/database (accessed on 30 August 2021).
- OECD. Gross Domestic Product (GDP). 2021. Available online: https://doi.org/10.1787/4537dc58-en (accessed on 30 August 2021).
- Porębska, A.; Godyń, I.; Radzicki, K.; Nachlik, E.; Rizzi, P. Built Heritage, Sustainable Development, and Natural Hazards: Flood Protection and UNESCO World Heritage Site Protection Strategies in Krakow, Poland. Sustainability 2019, 11, 4886. [Google Scholar] [CrossRef] [Green Version]
- Dumieński, G.; Lisowska, A.; Bedryj, M.; Tiukało, A. Ocena zrównoważenia polityki przeciwpowodziowej państwa z wykorzystaniem zintegrowanego ryzyka środowiskowego [Assessment of the State’s Sustainable Flood Policy Based on the Integrated Environmental Risk]. In Theoria i Praxis Zrównoważonego Rozwoju. 30 lat od Opublikowania Raportu Brundtland; Sadowski, R., Ed.; Towarzystwo Naukowe Franciszka Salezego: Warszawa, Poland, 2017; pp. 579–590. ISBN 978-83-61451-09-9. [Google Scholar]
- Tokarczyk, T.; Tiukało, A. Wariantowanie metod ochrony przeciwpowodziowej w świetle wymogów dyrektywy powodziowej oraz ramowej dyrektywy wodnej. In Gospodarowanie Wodami: Kluczowe Wyzwania w Ramach Nowego Cyklu Planistycznego; Pchałek, M., Ed.; Wolters Kluwer Polska: Warszawa, Poland, 2020; pp. 157–179. [Google Scholar]
- Bańbuła, P.; Grejcz, K.; Jabłonowski, J.; Przeworska, J. The Household Wealth and Debt in Poland. Report of 2016 Survey; NBP: Warszawa, Poland, 2017; p. 125. Available online: https://www.nbp.pl/homen.aspx?f=/en/publikacje/inne/bzgd.html (accessed on 30 August 2021).
- Bańbuła, P.; Grejcz, K.; Premik, F.; Przeworska, J.; Żółkiewski, Z. Household Wealth and Debt in Poland. Pilot Survey Report 2014; NBP: Warszawa, Poland, 2015; p. 86. Available online: https://www.nbp.pl/homen.aspx?f=/en/publikacje/inne/bzgd.html (accessed on 30 August 2021).
- Huizinga, J.; de Moel, H.; Szewczyk, W. Global Flood Depth-Damage Functions: Methodology and the Database with Guidelines; Publications Office of the European Union: Luxembourg, 2016; ISBN 978-92-79-67781-6. [Google Scholar]
- USACE. Depth-Damage Relationships for Structures, Contents, and Vehicles and Content-to-Structure Value Ratios (CSVR) in Support of the Donaldsonville to the Gulf, Louisiana, Feasibility Study; US Army Corps of Engineers: New Orleans, LA, USA, 2006; Available online: https://www.mvn.usace.army.mil/Portals/56/docs/PD/Donaldsv-Gulf.pdf (accessed on 31 August 2021).
- Godyń, I. Ocena ryzyka powodziowego—Wskaźniki wartości mienia na terenach mieszkalnych (Flood risk assessment—property value indicators for residential areas). Gospod. Wodna 2018, 11, 337–340. [Google Scholar]
- ICPR. Tool and Assessment Method to Determine Flood Risk Evolution/Reduction; Technical Report; International Commission for the Protection of the Rhine: Koblenz, Germany, 2016; Available online: https://www.iksr.org/fileadmin/user_upload/DKDM/Dokumente/Fachberichte/EN/rp_En_0237.pdf (accessed on 30 August 2021).
- Statistics Poland (GUS). Fixed Assets in National Economy in 2019. Available online: https://stat.gov.pl/en/topics/industry-construction-fixed-assets/fixed-assets/fixed-assets-in-national-economy-in-2019,1,17.html (accessed on 31 August 2021).
- Statistics Poland (GUS). Financial Results of Non-Financial Enterprises (Balance Sheet) in 2019. Available online: https://stat.gov.pl/en/topics/economic-activities-finances/activity-of-enterprises-activity-of-companies/financial-results-of-non-financial-enterprises-balance-sheet-in-2019,3,14.html (accessed on 30 August 2021).
- Statistics Poland (GUS). Topics/Prices, Trade/Price Indices/Price Indices of Consumer Goods and Services. Available online: https://stat.gov.pl/en/topics/prices-trade/price-indices/price-indices-of-consumer-goods-and-services/ (accessed on 30 August 2021).
- Statistics Poland (GUS). Price Indices of Residential Premises in the First Quarter of 2021. Available online: https://stat.gov.pl/en/topics/prices-trade/price-indices/price-indices-of-residential-premises-in-the-first-quarter-of-2021,18,11.html (accessed on 30 August 2021).
- NBP Narodowy Bank Polski—Exchange Rates. Available online: https://www.nbp.pl/homen.aspx?f=/kursy/kursyen.htm (accessed on 30 August 2021).
- Statistics Poland (GUS). Fixed Assets in National Economy in 2018. Available online: https://stat.gov.pl/en/topics/industry-construction-fixed-assets/fixed-assets/fixed-assets-in-national-economy-in-2018,1,16.html (accessed on 31 August 2021).
- Statistics Poland (GUS). Fixed Assets in the National Economy in 2017. Available online: https://stat.gov.pl/en/topics/industry-construction-fixed-assets/fixed-assets/fixed-assets-in-the-national-economy-in-2017,1,15.html (accessed on 31 August 2021).
- Statistics Poland (GUS). Fixed Assets in the National Economy in 2016. Available online: https://stat.gov.pl/en/topics/industry-construction-fixed-assets/fixed-assets/fixed-assets-in-the-national-economy-in-2016,1,14.html (accessed on 31 August 2021).
- Statistics Poland (GUS). Fixed Assets in the National Economy in 2015. Available online: https://stat.gov.pl/en/topics/industry-construction-fixed-assets/fixed-assets/fixed-assets-in-the-national-economy-in-2015,1,13.html (accessed on 31 August 2021).
- Statistics Poland (GUS). Poland Macroeconomic Indicators. Available online: https://stat.gov.pl/en/poland-macroeconomic-indicators/ (accessed on 31 August 2021).
- Statistics Poland (GUS). Household Budget Survey in 2019. Available online: https://stat.gov.pl/en/topics/living-conditions/living-conditions/household-budget-survey-in-2019,2,14.html (accessed on 24 September 2021).
- De Moel, H.; Aerts, J.C.J.H. Effect of Uncertainty in Land Use, Damage Models and Inundation Depth on Flood Damage Estimates. Nat. Hazards 2011, 58, 407–425. [Google Scholar] [CrossRef] [Green Version]

Figure 2.
Approach to estimating asset values of households in residential areas for 16 voivodships.
Figure 2.
Approach to estimating asset values of households in residential areas for 16 voivodships.

Figure 3.
Approach to estimating asset values of business entities in residential areas for 16 voivodships.
Figure 3.
Approach to estimating asset values of business entities in residential areas for 16 voivodships.

Figure 4.
Approach to estimating asset values in industrial areas for 16 voivodships.

Figure 5.
Comparison of asset values determined for Poland and used in the Rhine Atlas, in 2019 prices.
Figure 5.
Comparison of asset values determined for Poland and used in the Rhine Atlas, in 2019 prices.

Figure 6.
Comparison of asset values determined for Polish voivodships and German federal states, in 2019 prices.
Figure 6.
Comparison of asset values determined for Polish voivodships and German federal states, in 2019 prices.


Table 1.
Proposed changes in the approach to asset valuation in residential areas.
| Valuation Stages | The Approach in the First Cycle of Flood Risk Management Plans | The New Extended Approach |
|---|---|---|
| Estimation of the average value of assets of household | The original index of property value per person: German index | Property values per household: values from the survey conducted by NBP and Statistics Poland Conversion of index of PLN per person based on the average indicator of household size |
| Conversion of the German index to Polish conditions (by ratio GDP per capita in Poland and Germany) | ||
| Differentiation of the index for voivodship areas | Differentiation through the ratio of voivodship GDP/national GDP | |
| Conversion of the index from PLN/person to PLN/m2 | Conversion using the population density index in individual voivodeships | |
| Distinction/consideration of the value of contents | The contents of buildings were not distinguished | The contents of buildings are taken into account |
| Estimating the value of fixed assets of companies operating in residential areas | Not included in the index | Value of fixed assets in individual sectors of the economy, broken down by voivodships according to data of Statistics Poland |
| Estimating the value of stocks of companies operating in residential areas | Not included in the index | The stock value is taken into account by determining the average ratio of stocks to fixed assets for non-industrial sectors of economy |
| The final index of assets in residential areas | The unit value of assets of households in residential areas for 16 voivodships [PLN/m2] | The unit the value of assets of households and business entities, taking into account fixed assets and equipment/stocks in residential areas for 16 voivodships [PLN/m2] |
Table 2.
Value of household assets, including building contents, in 16 voivodships (in 2019 prices).
Table 2.
Value of household assets, including building contents, in 16 voivodships (in 2019 prices).
| Voivodships | Value of Household Assets Including Building Contents [PLN/m2] | Value of Household Assets Including Building Contents [€/m2] |
|---|---|---|
| DS—Lower Silesian | 915 | 213 |
| KP—Kuyavian-Pomeranian | 563 | 131 |
| LU—Lublin | 291 | 68 |
| LB—Lubusz | 532 | 124 |
| LD—Łódź | 524 | 122 |
| MP—Lesser Poland | 690 | 161 |
| MA—Masovian | 910 | 212 |
| OP—Opole | 496 | 115 |
| PK—Subcarpatian | 393 | 91 |
| PD—Podlaskie | 319 | 74 |
| PM—Pomeranian | 798 | 186 |
| SL—Silesian | 988 | 230 |
| SW—Holy Cross | 341 | 79 |
| WM—Warmian-Masurian | 377 | 88 |
| WP—Greater Poland | 741 | 172 |
| ZP—West Pomeranian | 739 | 172 |
| Poland, average | 646 | 150 |
Exchange ratio: 4.298 PLN/€ [52].
Table 3.
Value of fixed assets of business entities in residential areas in 16 voivodships (in 2019 prices).
Table 3.
Value of fixed assets of business entities in residential areas in 16 voivodships (in 2019 prices).
| Voivodships | Value of Fixed Assets of Business Entities [PLN/m2] | Value of Fixed Assets of Business Entities [€/m2] |
|---|---|---|
| DS—Lower Silesian | 268 | 62 |
| KP—Kuyavian-Pomeranian | 193 | 45 |
| LU—Lublin | 134 | 31 |
| LB—Lubusz | 211 | 49 |
| LD—Łódź | 182 | 42 |
| MP—Lesser Poland | 261 | 61 |
| MA—Masovian | 384 | 89 |
| OP—Opole | 175 | 41 |
| PK—Subcarpatian | 163 | 38 |
| PD—Podlaskie | 132 | 31 |
| PM—Pomeranian | 299 | 70 |
| SL—Silesian | 278 | 65 |
| SW—Holy Cross | 131 | 30 |
| WM—Warmian-Masurian | 156 | 36 |
| WP—Greater Poland | 233 | 54 |
| ZP—West Pomeranian | 266 | 62 |
| Poland, average | 236 | 55 |
Table 4.
Ratios of the value of stocks to the value of fixed assets in individual sectors of the economy.
Table 4.
Ratios of the value of stocks to the value of fixed assets in individual sectors of the economy.
| Sectors of Economy (NACE Codes) | 2015 | 2016 | 2017 | 2018 | 2019 | Average 2015–2019 |
|---|---|---|---|---|---|---|
| Industry (section B,C,D,E) | 27% | 26% | 27% | 29% | 29% | 28% |
| B—Mining and Quarrying | 14% | 13% | 15% | 16% | 16% | 15% |
| C—Manufacturing | 44% | 44% | 45% | 47% | 46% | 45% |
| D—Electricity, Gas, Steam, and Air Conditioning Supply | 7% | 5% | 5% | 6% | 8% | 6% |
| E—Water Supply; Sewerage, Waste Management, and Remediation Activities | 1% | 1% | 1% | 1% | 2% | 1% |
| F—Construction | 92% | 100% | 115% | 121% | 126% | 111% |
| G—Wholesale and Retail Trade; Repair of Motor Vehicles and Motorcycles | 101% | 104% | 109% | 114% | 114% | 108% |
| H—Transportation and Storage | 2% | 3% | 3% | 3% | 3% | 3% |
| I—Accommodation and Food Service Activities | 2% | 3% | 2% | 2% | 3% | 2% |
| J—Information and Communication | 8% | 9% | 10% | 12% | 11% | 10% |
| K—Financial and Insurance Activities | 13% 1 | n/a | n/a | n/a | n/a | 13% 1 |
| L—Real Estate Activities | 5% | 5% | 6% | 7% | 9% | 7% |
| M—Professional, Scientific, and Technical Activities | 17% | 17% | 18% | 21% | 26% | 20% |
| N—Administrative and Support Service Activities | 9% | 8% | 10% | 8% | 7% | 8% |
| O—Public Administration and Defense; Compulsory Social Security | n/a | n/a | n/a | n/a | n/a | n/a |
| P—Education | 5% | 7% | 4% | 4% | 7% | 5% |
| Q—Human Health and Social Work Activities | 3% | 3% | 3% | 3% | 3% | 3% |
| R—Arts, Entertainment, and Recreation | 2% | 2% | 2% | 2% | 2% | 2% |
| S—Other Service Activities | 13% | 18% | 14% | 16% | 9% | 14% |
1 For K section—the average ratio from 2013 to 2015: 13%.
Table 5.
Value of assets of business entities in residential areas in 16 voivodships (in 2019 prices).
Table 5.
Value of assets of business entities in residential areas in 16 voivodships (in 2019 prices).
| Voivodships | Value of Fixed Assets of Business Entities [PLN/m2] | Ratio of Stocks/Fixed Assets [%] | Total Value of Assets of Business Entities [PLN/m2] | Total Value of Assets of Business Entities [€/m2] |
|---|---|---|---|---|
| DS—Lower Silesian | 268 | 21% | 324 | 75 |
| KP—Kuyavian-Pomeranian | 193 | 21% | 233 | 54 |
| LU—Lublin | 134 | 16% | 155 | 36 |
| LB—Lubusz | 211 | 16% | 243 | 57 |
| LD—Łódź | 182 | 19% | 216 | 50 |
| MP—Lesser Poland | 261 | 20% | 313 | 73 |
| MA—Masovian | 384 | 20% | 459 | 107 |
| OP—Opole | 175 | 19% | 208 | 48 |
| PK—Subcarpatian | 163 | 16% | 189 | 44 |
| PD—Podlaskie | 132 | 14% | 151 | 35 |
| PM—Pomeranian | 299 | 17% | 349 | 81 |
| SL—Silesian | 278 | 20% | 334 | 78 |
| SW—Holy Cross | 131 | 18% | 155 | 36 |
| WM—Warmian-Masurian | 156 | 13% | 176 | 41 |
| WP—Greater Poland | 233 | 30% | 303 | 70 |
| ZP—West Pomeranian | 266 | 16% | 308 | 72 |
| Poland, average | 236 | 19% | 282 | 66 |
Table 6.
Value of assets in residential areas in 16 voivodships (in 2019 prices).
| Voivodships | Value of Assets of Households [PLN/m2] | Value of Assets of Business Entities [PLN/m2] | Total Value of Assets in Residential Areas [PLN/m2] | Total Value of assets in Residential Areas [€/m2] |
|---|---|---|---|---|
| DS—Lower Silesian | 915 | 324 | 1239 | 288 |
| KP—Kuyavian-Pomeranian | 563 | 233 | 796 | 185 |
| LU—Lublin | 291 | 155 | 446 | 104 |
| LB—Lubusz | 532 | 243 | 776 | 181 |
| LD—Łódź | 524 | 216 | 740 | 172 |
| MP—Lesser Poland | 690 | 313 | 1003 | 233 |
| MA—Masovian | 910 | 459 | 1369 | 319 |
| OP—Opole | 496 | 208 | 704 | 164 |
| PK—Subcarpatian | 393 | 189 | 581 | 135 |
| PD—Podlaskie | 319 | 151 | 469 | 109 |
| PM—Pomeranian | 798 | 349 | 1148 | 267 |
| SL—Silesian | 988 | 334 | 1322 | 308 |
| SW—Holy Cross | 341 | 155 | 496 | 115 |
| WM—Warmian-Masurian | 377 | 176 | 553 | 129 |
| WP—Greater Poland | 741 | 303 | 1044 | 243 |
| ZP—West Pomeranian | 739 | 308 | 1047 | 244 |
| Poland, average | 646 | 282 | 928 | 216 |
Table 7.
Value of fixed assets in industrial areas in 16 voivodships (in 2019 prices).
| Voivodships | Fixed Assets [million PLN] | Industrial Area [km2] | Fixed Assets per 1 m2 [PLN/m2] | Fixed Assets per 1 m2 [€/m2] |
|---|---|---|---|---|
| DS—Lower Silesian | 143,655 | 150.06 | 957 | 223 |
| KP—Kuyavian-Pomeranian | 62,843 | 69.75 | 901 | 210 |
| LU—Lublin | 44,513 | 44.10 | 1009 | 235 |
| LB—Lubusz | 48,097 | 34.96 | 1376 | 320 |
| LD—Łódź | 98,909 | 77.12 | 1283 | 299 |
| MP—Lesser Poland | 93,544 | 83.88 | 1115 | 259 |
| MA—Masovian | 209,756 | 127.57 | 1644 | 383 |
| OP—Opole | 47,810 | 50.15 | 953 | 222 |
| PK—Subcarpatian | 62,826 | 57.10 | 1100 | 256 |
| PD—Podlaskie | 28,146 | 30.39 | 926 | 215 |
| PM—Pomeranian | 69,520 | 60.93 | 1141 | 265 |
| SL—Silesian | 213,495 | 222.95 | 958 | 223 |
| SW—Holy Cross | 32,510 | 40.51 | 803 | 187 |
| WM—Warmian-Masurian | 34,660 | 38.58 | 898 | 209 |
| WP—Greater Poland | 134,686 | 109.54 | 1230 | 286 |
| ZP—West Pomeranian | 52,723 | 73.06 | 722 | 168 |
| Poland, average | 1,377,695 | 1271.65 | 1084 | 252 |
Table 8.
The ratios of stocks to fixed assets in the industry sector in 2015–2019 (in current prices).
Table 8.
The ratios of stocks to fixed assets in the industry sector in 2015–2019 (in current prices).
| Voivodships | Fixed Assets [Million PLN] | Fixed Assets [Million PLN] | Stocks/Fixed Asset Ratio [%] |
|---|---|---|---|
| 2015 | 535,315 | 142,746 | 27% |
| 2016 | 570,421 | 150,488 | 26% |
| 2017 | 592,323 | 161,983 | 27% |
| 2018 | 617,221 | 181,310 | 29% |
| 2019 | 655,984 | 191,414 | 29% |
| the average ratio | 28% | ||
Table 9.
Value of fixed assets in industrial areas in 16 voivodships (in 2019 prices).
| Voivodships | Fixed Assets per 1 m2 [PLN/m2] | Stocks/Fixed Asset Ratio [%] | Total Value of Assets in Industrial Areas [PLN/m2] | Total Value of Assets in Industrial Areas [€/m2] |
|---|---|---|---|---|
| DS—Lower Silesian | 957 | 28% | 1225 | 285 |
| KP—Kuyavian-Pomeranian | 901 | 1153 | 268 | |
| LU—Lublin | 1009 | 1292 | 301 | |
| LB—Lubusz | 1376 | 1761 | 410 | |
| LD—Łódź | 1283 | 1642 | 382 | |
| MP—Lesser Poland | 1115 | 1427 | 332 | |
| MA—Masovian | 1644 | 2104 | 490 | |
| OP—Opole | 953 | 1220 | 284 | |
| PK—Subcarpatian | 1100 | 1408 | 328 | |
| PD—Podlaskie | 926 | 1185 | 276 | |
| PM—Pomeranian | 1141 | 1460 | 340 | |
| SL—Silesian | 958 | 1226 | 285 | |
| SW—Holy Cross | 803 | 1028 | 239 | |
| WM—Warmian-Masurian | 898 | 1149 | 267 | |
| WP—Greater Poland | 1230 | 1574 | 366 | |
| ZP—West Pomeranian | 722 | 924 | 215 | |
| Poland, average | 1084 | 1388 | 323 |
Table 10.
Value of assets in residential areas in 16 voivodships.
| Voivodships | Value of Assets in Residential Areas in First Cycle of FRMP (in 2008 Prices) | Value of Assets in Residential Areas in First Cycle of FRMP (in 2019 Prices) | Proposed Total Value of Assets in Residential Areas (in 2019 Prices) | Ratio Value acc. to First Cycle/Value ac. to the Proposed Approach |
|---|---|---|---|---|
| (1) | (2) = 1.21 × (1) | (3) | (4) = (3)/(2) | |
| [PLN/m2] | [PLN/m2] | [PLN/m2] | [%] | |
| DS—Lower Silesian | 422 | 511 | 1239 | 242% |
| KP—Kuyavian-Pomeranian | 333 | 403 | 796 | 198% |
| LU—Lublin | 165 | 199 | 446 | 224% |
| LB—Lubusz | 276 | 334 | 776 | 232% |
| LD—Łódź | 291 | 352 | 740 | 210% |
| MP—Lesser Poland | 364 | 441 | 1003 | 228% |
| MA—Masovian | 510 | 617 | 1369 | 222% |
| OP—Opole | 266 | 322 | 704 | 219% |
| PK—Subcarpatian | 201 | 244 | 581 | 239% |
| PD—Podlaskie | 163 | 197 | 469 | 238% |
| PM—Pomeranian | 400 | 484 | 1148 | 237% |
| SL—Silesian | 559 | 677 | 1322 | 195% |
| SW—Holy Cross | 201 | 243 | 496 | 204% |
| WM—Warmian-Masurian | 203 | 246 | 553 | 225% |
| WP—Greater Poland | 361 | 436 | 1044 | 239% |
| ZP—West Pomeranian | 310 | 375 | 1047 | 279% |
| Poland, average | 341 | 413 | 928 | 225% |
Publisher’s Note: MDPI stays neutral with regard to jurisdictional claims in published maps and institutional affiliations. |
© 2021 by the author. Licensee MDPI, Basel, Switzerland. This article is an open access article distributed under the terms and conditions of the Creative Commons Attribution (CC BY) license (https://creativecommons.org/licenses/by/4.0/).
Share and Cite
MDPI and ACS Style
Godyń, I. A Revised Approach to Flood Damage Estimation in Flood Risk Maps and Flood Risk Management Plans, Poland. Water 2021, 13, 2713. https://doi.org/10.3390/w13192713
AMA Style
Godyń I. A Revised Approach to Flood Damage Estimation in Flood Risk Maps and Flood Risk Management Plans, Poland. Water. 2021; 13(19):2713. https://doi.org/10.3390/w13192713
Chicago/Turabian StyleGodyń, Izabela. 2021. "A Revised Approach to Flood Damage Estimation in Flood Risk Maps and Flood Risk Management Plans, Poland" Water 13, no. 19: 2713. https://doi.org/10.3390/w13192713
Note that from the first issue of 2016, this journal uses article numbers instead of page numbers. See further details here.