1. Introduction
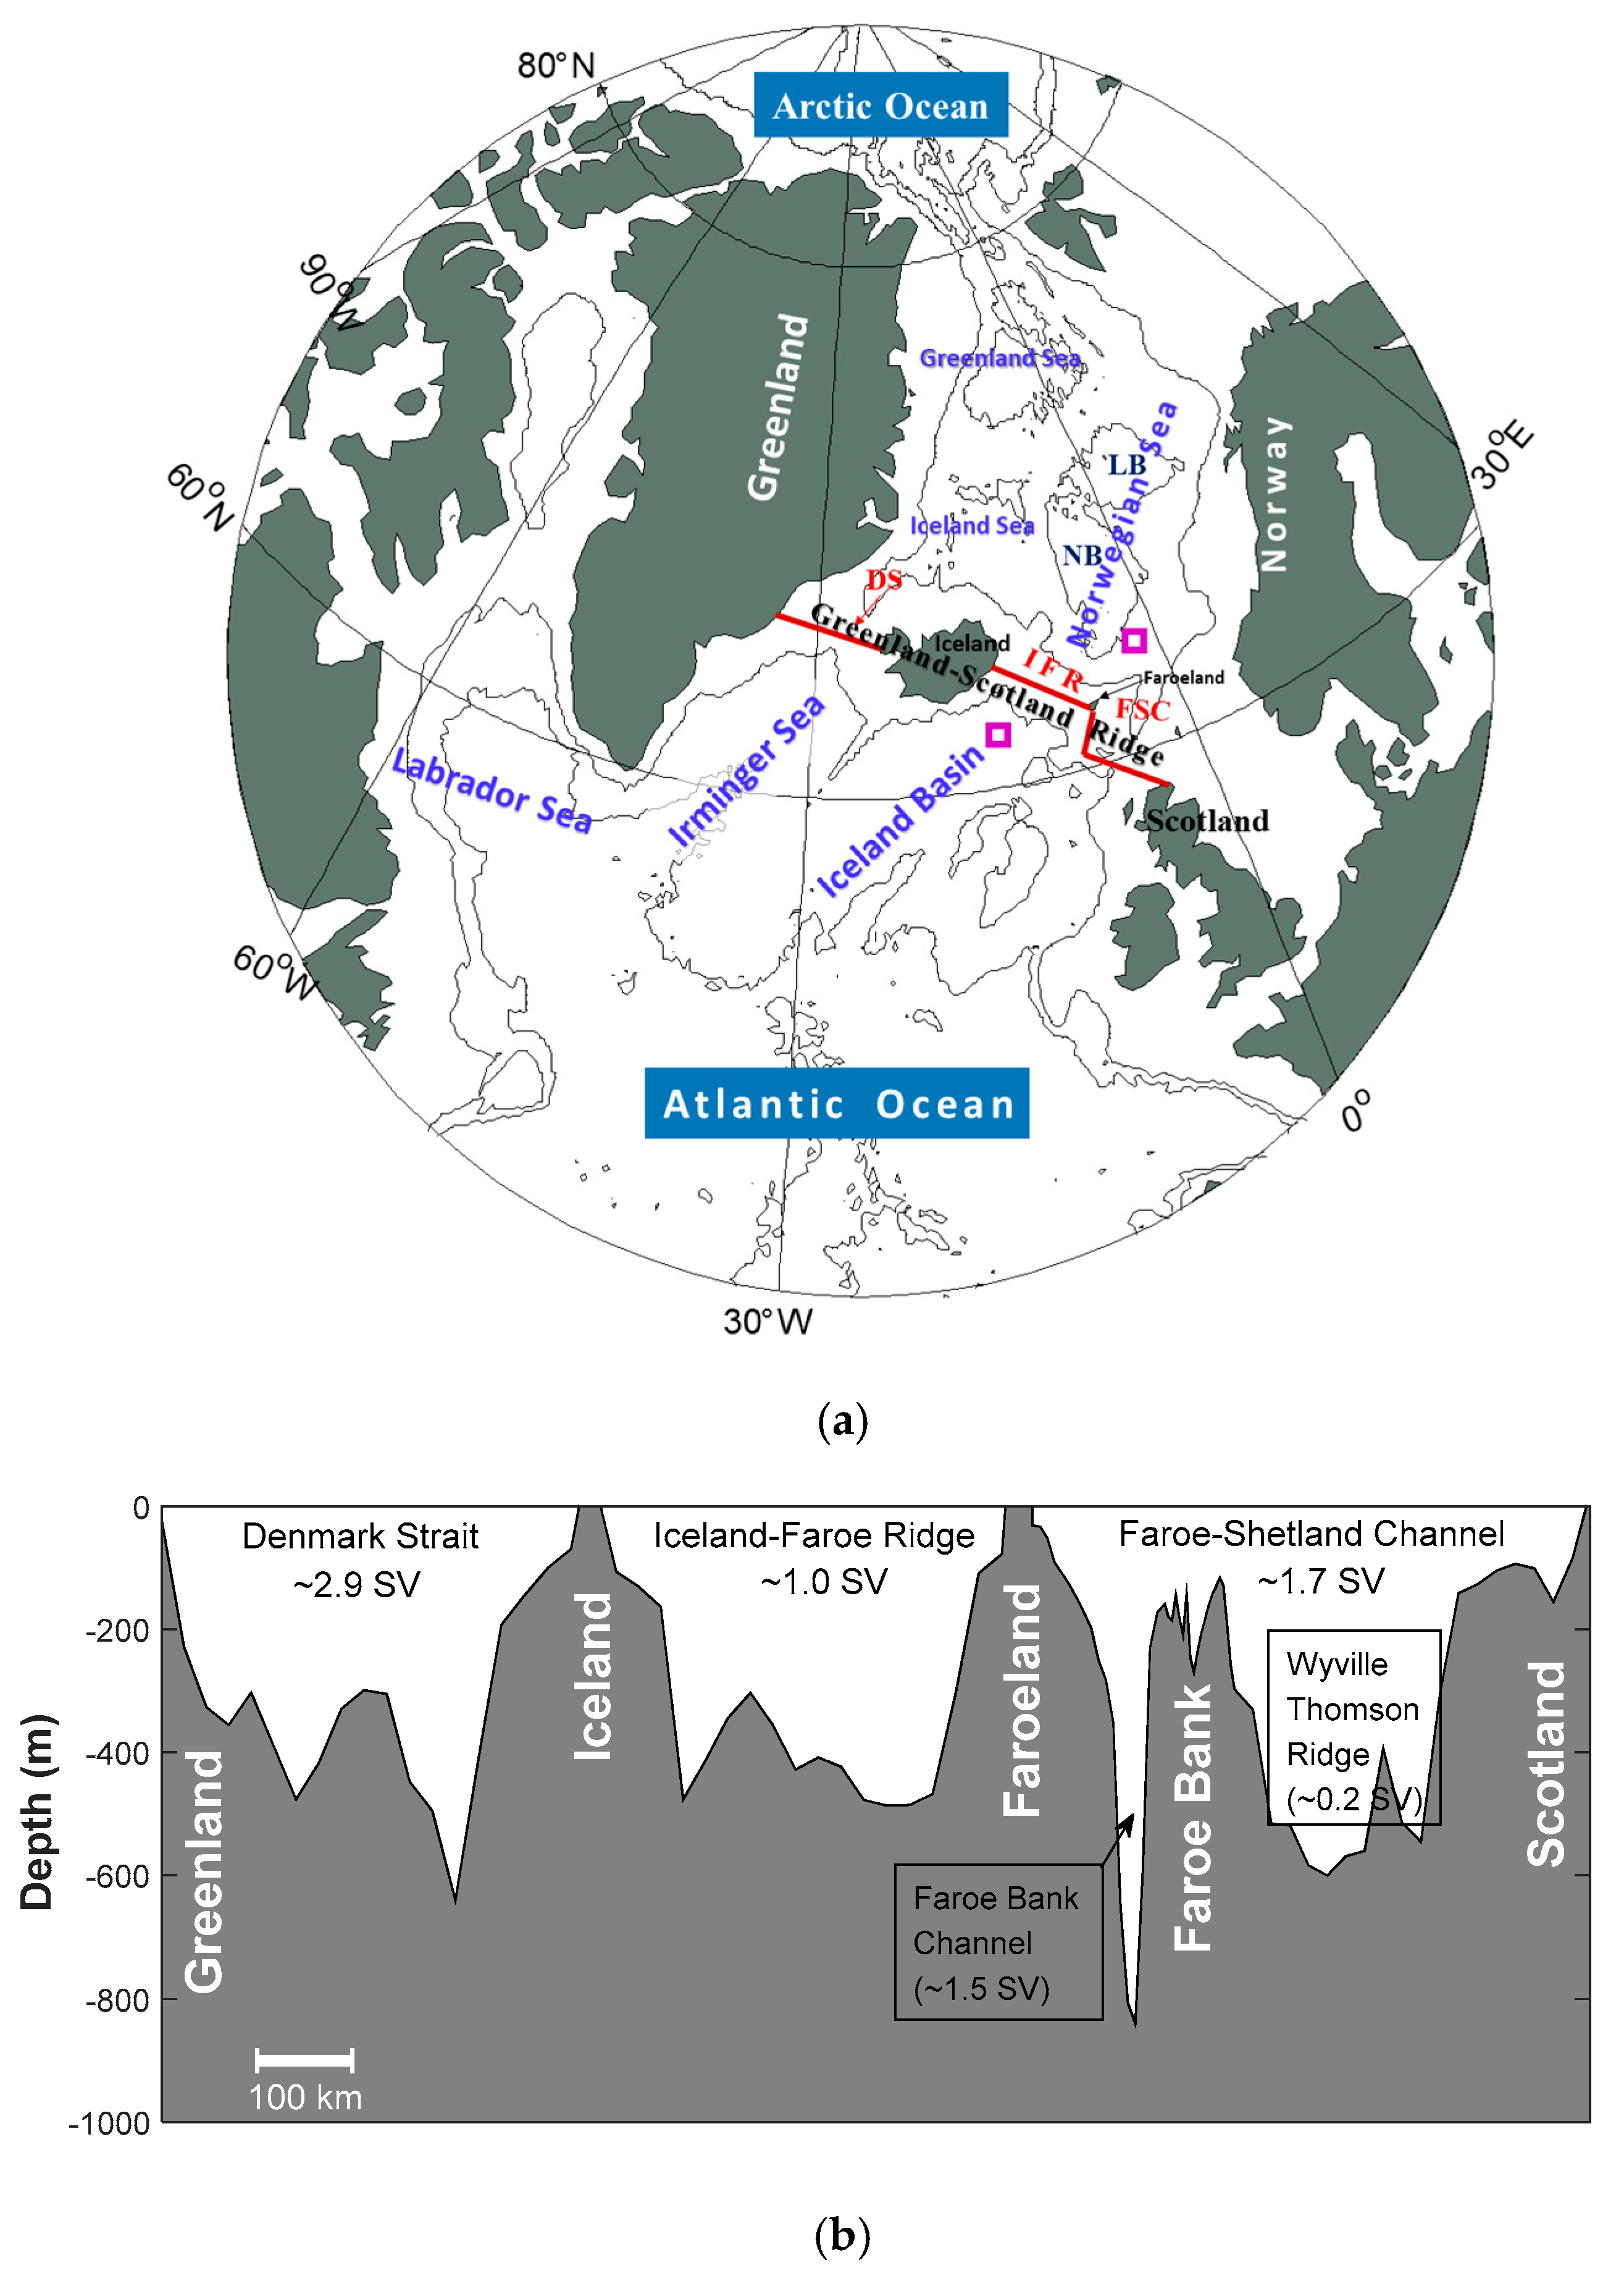
As an important driver of thermohaline circulation, the Nordic Sea overflow has a profound impact on environmental changes in the Arctic and even the world. In the Nordic Sea, high-density water bodies with a geopotential density (σ
ө) greater than 27.8 kg/m
3 and shallower than the Greenland-Scotland Ridge (GSR) depth can overflow. There are three overflow channels on the GSR. From west to east, they are the Denmark Strait (DS), the Iceland-Faroe Ridge (IFR), and the Faroe-Shetland Channel (FSC) (
Figure 1a,b). The overflow of dense water between Greenland and Shetland consists of the Faroe Bank Channel (FBC) overflow and Wyville Thomson Ridge (WTR) overflow, and FBC is the main channel for FSC overflow. The high-density water overflowing from these channels forms the North Atlantic Deep Water (NADW), which affects the nature of the deep-water mass and the deep circulation in the North Atlantic [
1,
2,
3,
4].
Theoretical analysis and field measurement results show that the Nordic Sea overflow is hydraulically controlled. In hydraulic control theory, changes of the overflow flux through a strait depend only on the total pressure difference at the depth of the sill on both sides of the GSR [
1,
2,
3,
4]. The total pressure difference is equal to the barotropic pressure difference plus the baroclinic pressure difference, depending on the local and remote physical processes, such as convection, mixing, and circulation, which further determine the overflow flux of the Nordic Sea [
4].
Affected by climate change, the deep convection in the Nordic Sea has been weakened significantly from the 1960s to the beginning of the 21st century; by about 2006, the depth of deep convection in Greenland was less than 1000 m [
5,
6]. Recent studies showed that although there is a decreasing trend in atmospheric forcing from 1993 to 2016, the depth of convection in the Greenland Sea in winter has a deepening tendency. This is due to the increase in the salinity of seawater in the upper 1500 m, which results in the weakening of stratification inside the Greenland Sea circulation [
7,
8]. Modern climate models have found that the overflow flux of the Nordic Sea has a good consistency with the Greenland Sea convection, showing a weakening trend [
9,
10,
11,
12]. However, this weakening is not reflected by the measured data. The field measurement found that the overflow flux of the Nordic Sea remained strong and stable from 1995 to 2015, and there was no significant trend change [
13,
14].
For the phenomenon of stable overflow transport of the Nordic Sea during the last two decades, there have been studies explaining it from different aspects. Based on the model results, Olsen et al. [
4] pointed out that the upper interface of the overflow water in the Nordic Sea declined from 1948 to 2005, which would cause a decrease in the pressure difference on both sides of the GSR. However, the rising sea level of the Nordic Sea offsets this effect, resulting in no trend change in the total pressure difference on both sides, making the overflow flux stable. Some other studies showed that the circulation of the Atlantic waters in the Nordic Sea has a greater impact on overflow changes, and the impact of weakened convection has been concealed [
15]. Zhang and Thomas [
16] believed that the Arctic Ocean, rather than the Greenland Sea, is the northern end of the mean Atlantic Meridional Overturning Circulation (AMOC). They further pointed out that the deep convection of the Labrador Sea and the Greenland Sea contribute the least to the mean AMOC, and AMOC may not be significantly weakened by the closure of the deep convections. However, some other studies still believed that the Greenland Sea is the main source area of the densest overflow water into the North Atlantic after 2005 and is the main ventilation area of the deepest layer in the North Atlantic [
7,
17]. Other studies suggest that the volume of the dense water above the GSR sill depth in the Nordic Seas is sufficient to supply decades of overflow transport without dense water production [
1,
2,
3]. The premise in such estimations, however, is that all dense water above the sill depth is freely available for overflow transport. However, basin-scale oceanic circulation is nearly geostrophic and its streamlines are basically the same as the isobaths. The vast majority of the dense water is stored inside the closed geostrophic contours in the deep basin and thus is not freely available for overflow transport [
18]. Therefore, an external force or a non-geostrophic mechanism is required to help transport the interior water mass to the boundary current. The numerical simulation results of Yang and Pratt [
19] show that 80%–85% of the dense water above the GSR sill depth in the Nordic Seas is not freely available for overflow transport, and the amount of the dense water freely available to overflow accounts for only 15%–20%. Therefore, the Nordic Seas has a relatively small capacity as a dense water reservoir and thus the overflow transport is sensitive to climate changes.
In short, there is still controversy about the reasons for the stable overflow flux in the past two decades. Based on the satellite altimeter data and the reanalysis hydrological data, this paper will analyze the changes in the barotropic pressure and baroclinic pressure on both sides of the GSR and then discuss the reasons for the long-term stable flux of the Nordic Sea overflow by the hydraulic control theory.
The structure of this paper is as follows. Chapter 2 introduces the data and the method for calculating the pressure. Chapter 3 evaluates the credibility of the EN4 data to calculate the pressure by comparing the measured hydrological data and the overflow flux results. Chapter 4 mainly analyzes the spatial distribution of the change trends of the positive pressure, baroclinic pressure, and total pressure on both sides; the change characteristics of the pressure difference on both sides of the GSR; the changes in depth of the overflow water interface in the Nordic Sea; and then analyzes the reasons for stable overflow flux from 1993 to 2015. Chapter 5 mainly analyzes the correlation between the positive pressure and baroclinic pressure on both sides of the GSR and the role of the changes in the properties of the upper seawater. Chapter 6 is the conclusion.
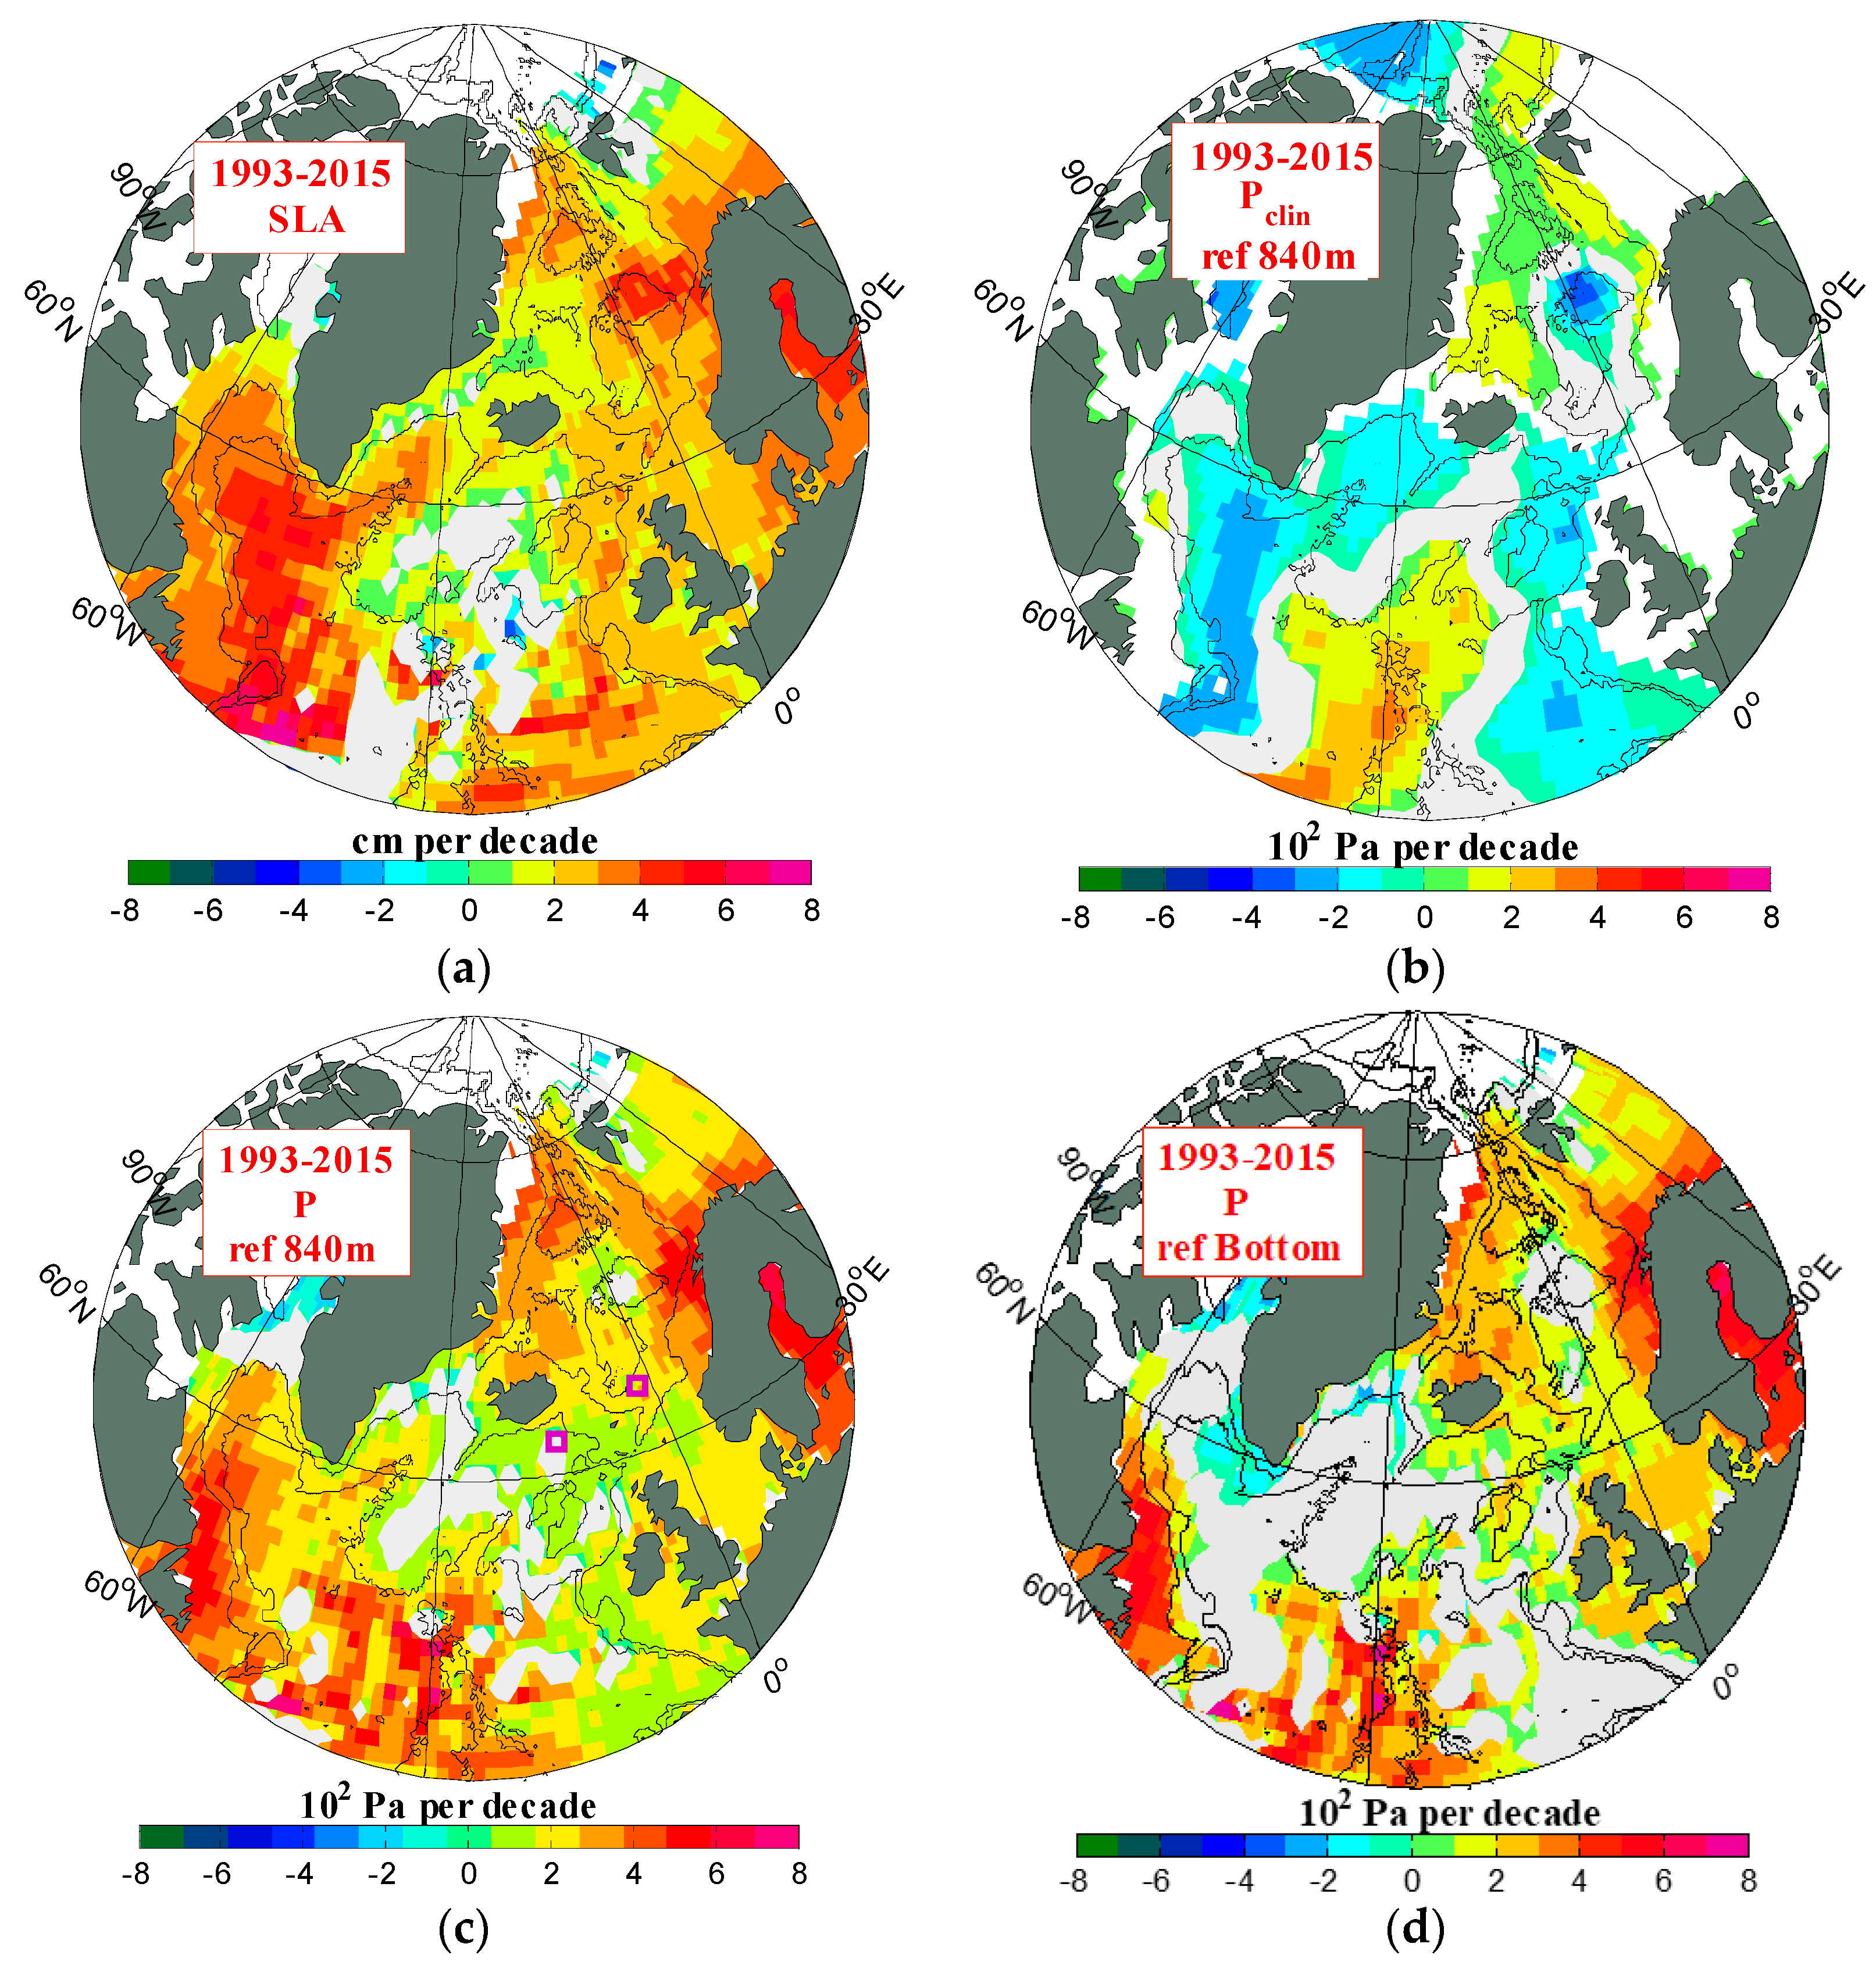
4. Change from 1993 to 2015
In the published literatures, the observation of GSR overflow flux is available until 2015 [
14]. Since the Nordic Sea overflow is hydraulically controlled, the pressure difference on both sides of the GSR can be used to analyze the long-term changes of the overflow flux. The depth of the deepest GSR sill is about 840 m on the FBC, which can be used to calculate the pressure difference [
4]. As shown in
Figure 4, from 1993 to 2015 the SLAs of the Nordic Sea and the North Atlantic subpolar region near the GSR basically increased at the same rate; P
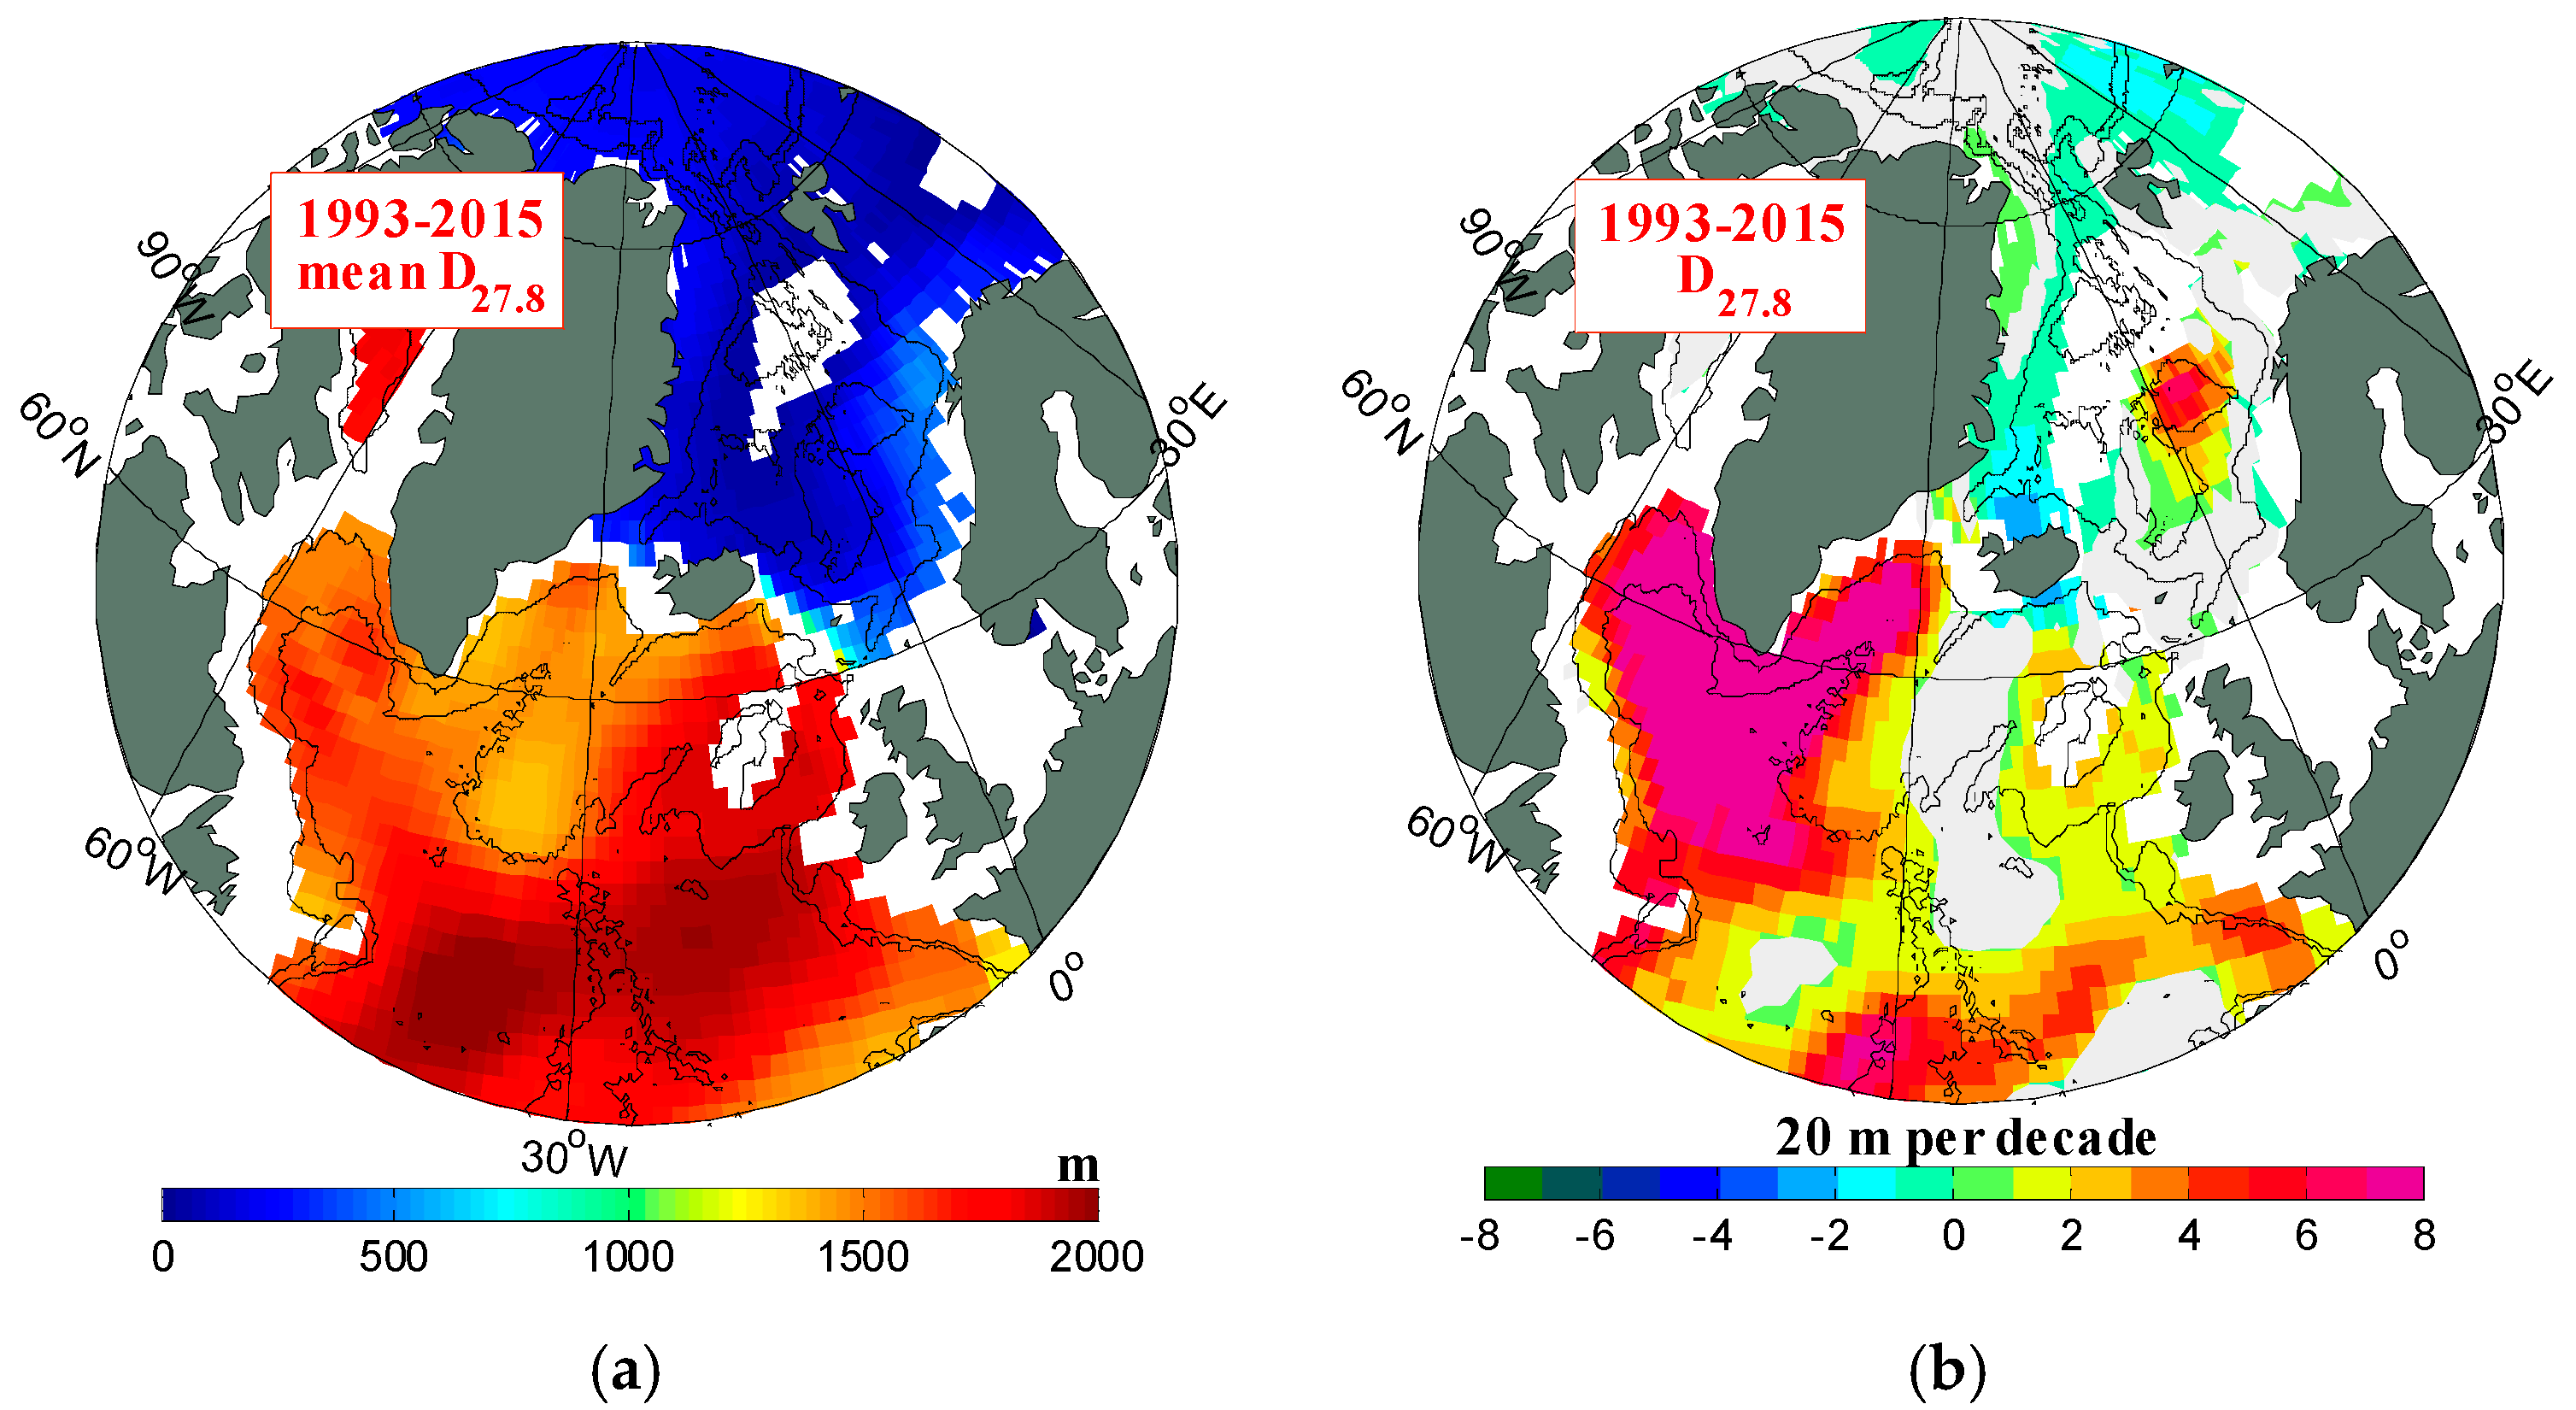
clin mostly declined in the south of GSR, increased near DS in the north of GSR, and had no significant change in the south of Norwegian Basin. The pressure difference in the west of Iceland had a clear upward trend; the pressure difference to the east of Iceland was basically unchanged. This means that DS overflow increased, while FBC overflow and IFR overflow did not change much. Therefore, the total overflow in the Nordic Sea slightly increased.
In the Nordic Sea, the depth of σ
ө = 27.8 kg/m
3 (D
27.8) (
Figure 5a,b, the upper interface of the overflow water) is more consistent with the spatial distribution of the change rate of P
clin, indicating that changes in the properties of the upper seawater necessarily indicate the adjustments of the upper interface of the overflow water. Especially in the Nordic Sea, the sinking of D
27.8 in the Lofoten Basin is about 100 m/dec, which may be directly caused by the reduction of deep convection in the Greenland Sea [
5,
6] or the weakening of other dense water production. When the total overflow transport flux remains unchanged, the amount of overflow water flowing out of the Lofoten Basin almost remains unchanged. Therefore, the reduction of dense water supply leads to the rapid sinking of the overflow water interface in the Lofoten Basin. There, the rapid decline of P
clin and the rapid rise of P
trop occur at the same time, while P is basically unchanged, indicating that the above changes are probably caused by the change of physical property of the upper water.
The Labrador Sea is a fast-sinking area of D
27.8, with a sinking rate up to 160 m/dec or more, which is consistent with the reported weakening of convection there [
24,
25]. In the modern climate, the Nordic Sea overflow, entrainment process, and Labrador Sea convection provides about 1/3 of the deep branch of the radial overturning circulation in the Atlantic Ocean [
4,
26]. Under the condition that the overflow of the Nordic Sea is relatively stable, the convection in the Labrador Sea is significantly weakened, which may be the main reason for the significant weakening of the AMOC near 25° N [
24,
27]. However, some relatively new observational evidence has indicated that the deep convection of the Labrador Sea has the smallest total contribution to the subpolar overturning circulation [
28,
29].
The convection of the Labrador Sea is significantly weakened, which causes the upper interface of the dense water to sink quickly. Since the upper interface of the overflow water in the Labrador Sea is deeper than 1500 m, its impact on the P
clin at 840 m is small, and the decrease rate of P
clin at 840 m depth is only −2 × 10
2 Pa/dec. The deepening of the overflow water in the Labrador Sea means that warming and freshening of the entire water column causes a large increase in SLA, which is consistent with the calculated results. The greater the bottom depth is, the greater the increase of SLA is. However, there is no significant trend change in the mass of the entire water column from surface to the bottom (
Figure 4d).
Although the changes in properties of seawater can ensure the mass conservation of the whole water column, the compression or expansion of the water column caused by the change of properties of seawater will lead to the change of the mass ratio of the upper and lower water column at a certain depth. Therefore, in hydrostatic balance, the pressure change of seawater at a certain depth may be caused by the change of properties of seawater below this depth, and the change of properties of seawater above this depth has no effect on it. The different changing trends of the pressure at 840 m depth and the seabed depth in the Labrador Sea and the Irminge Sea in the south of Greenland (
Figure 4b,d) show this effect.
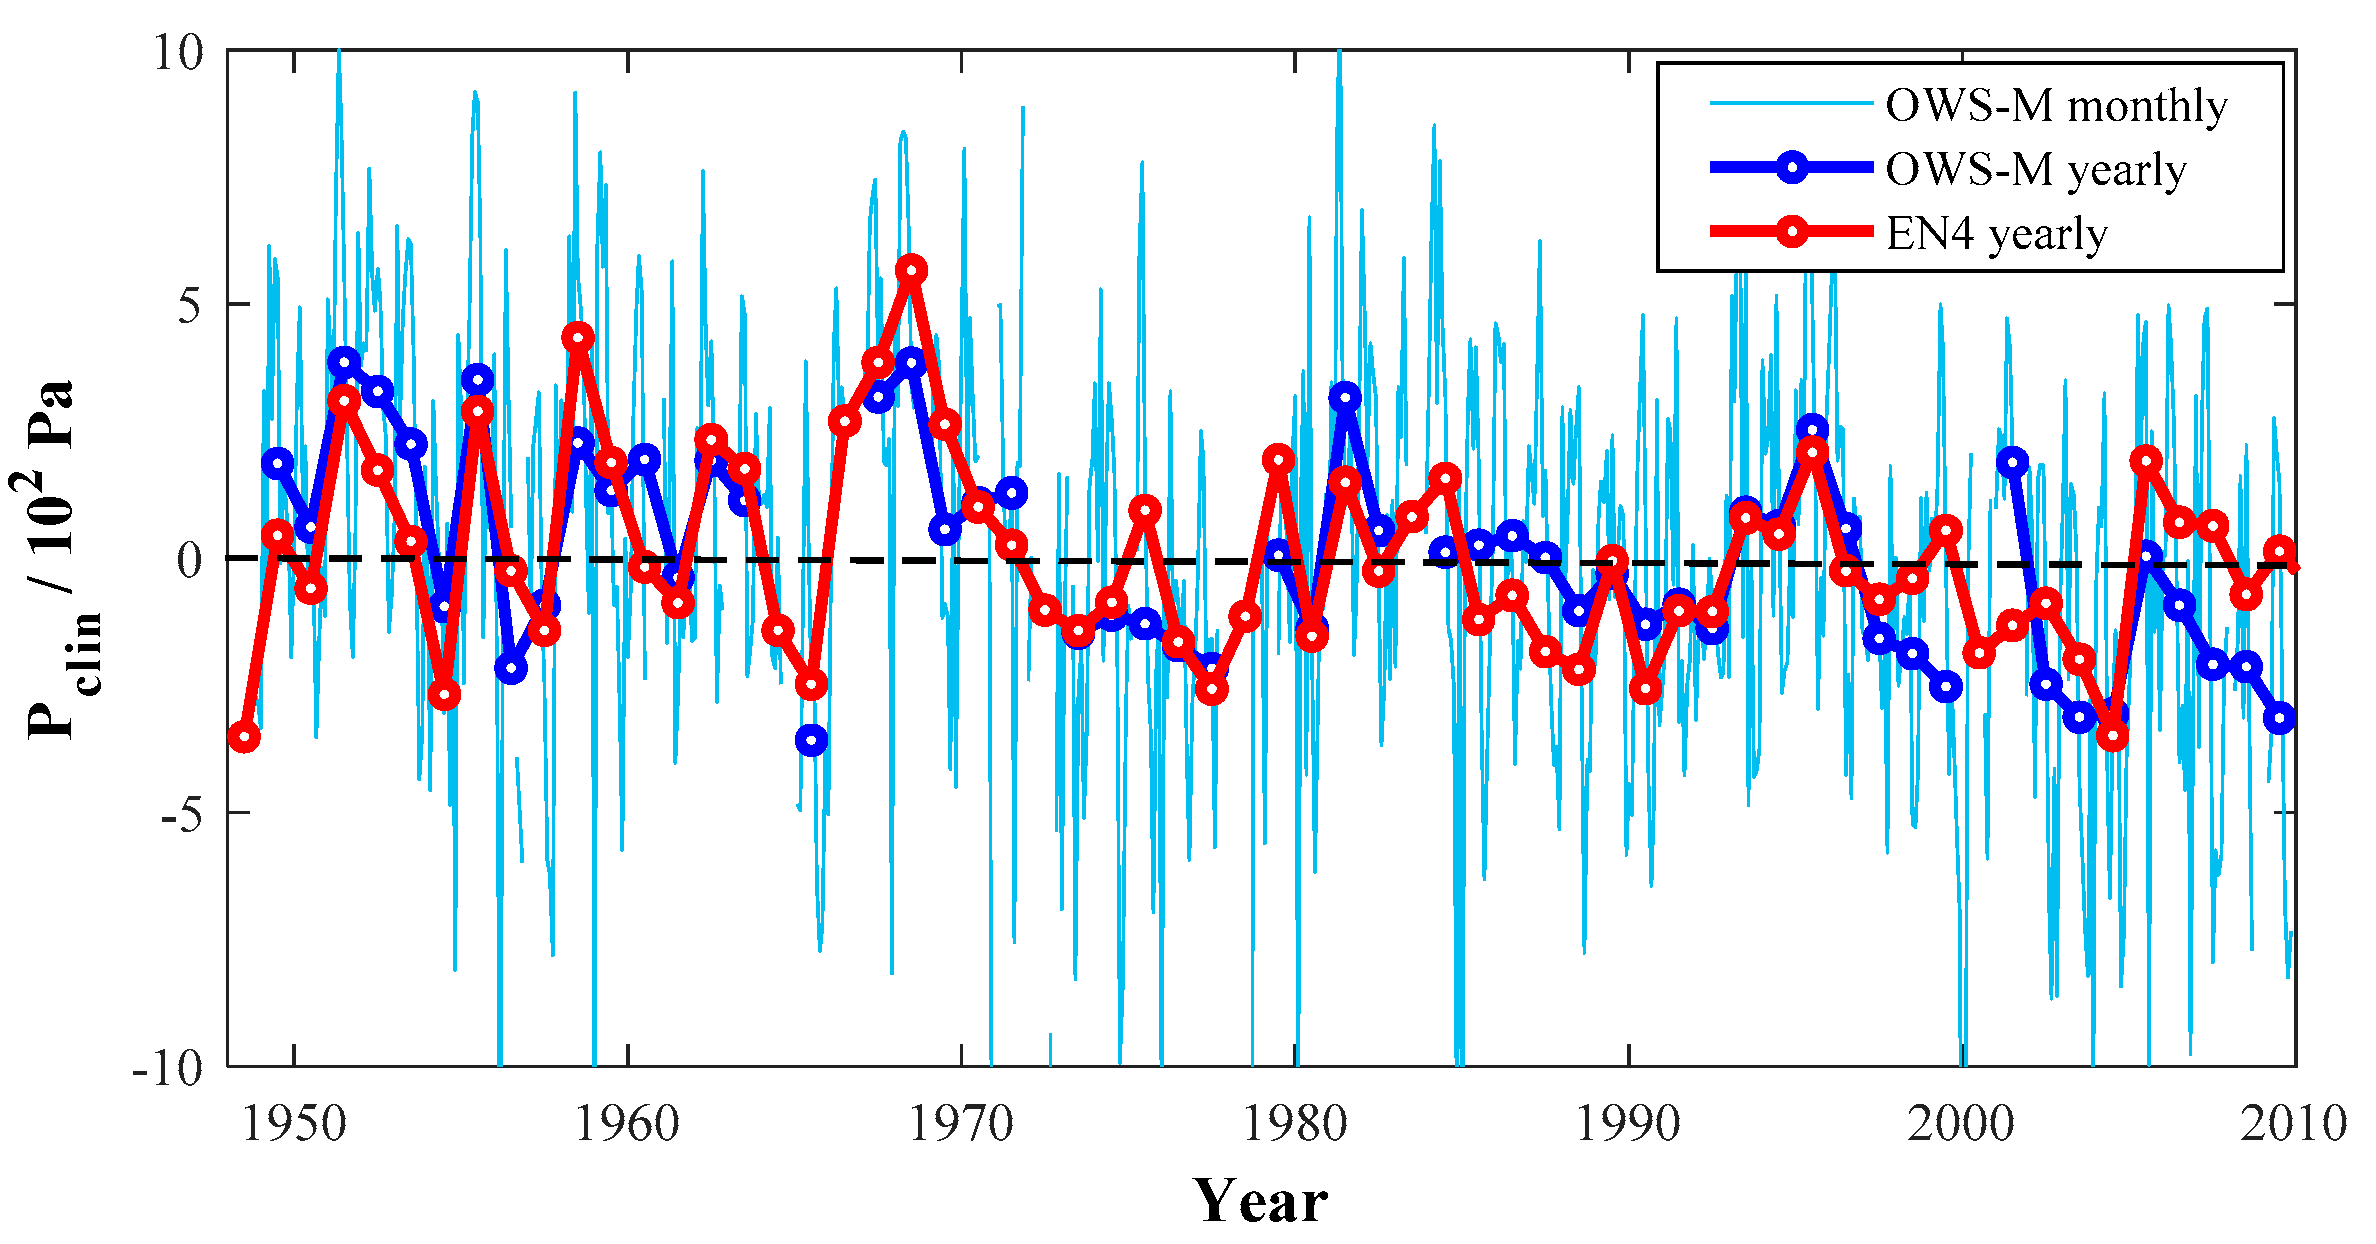
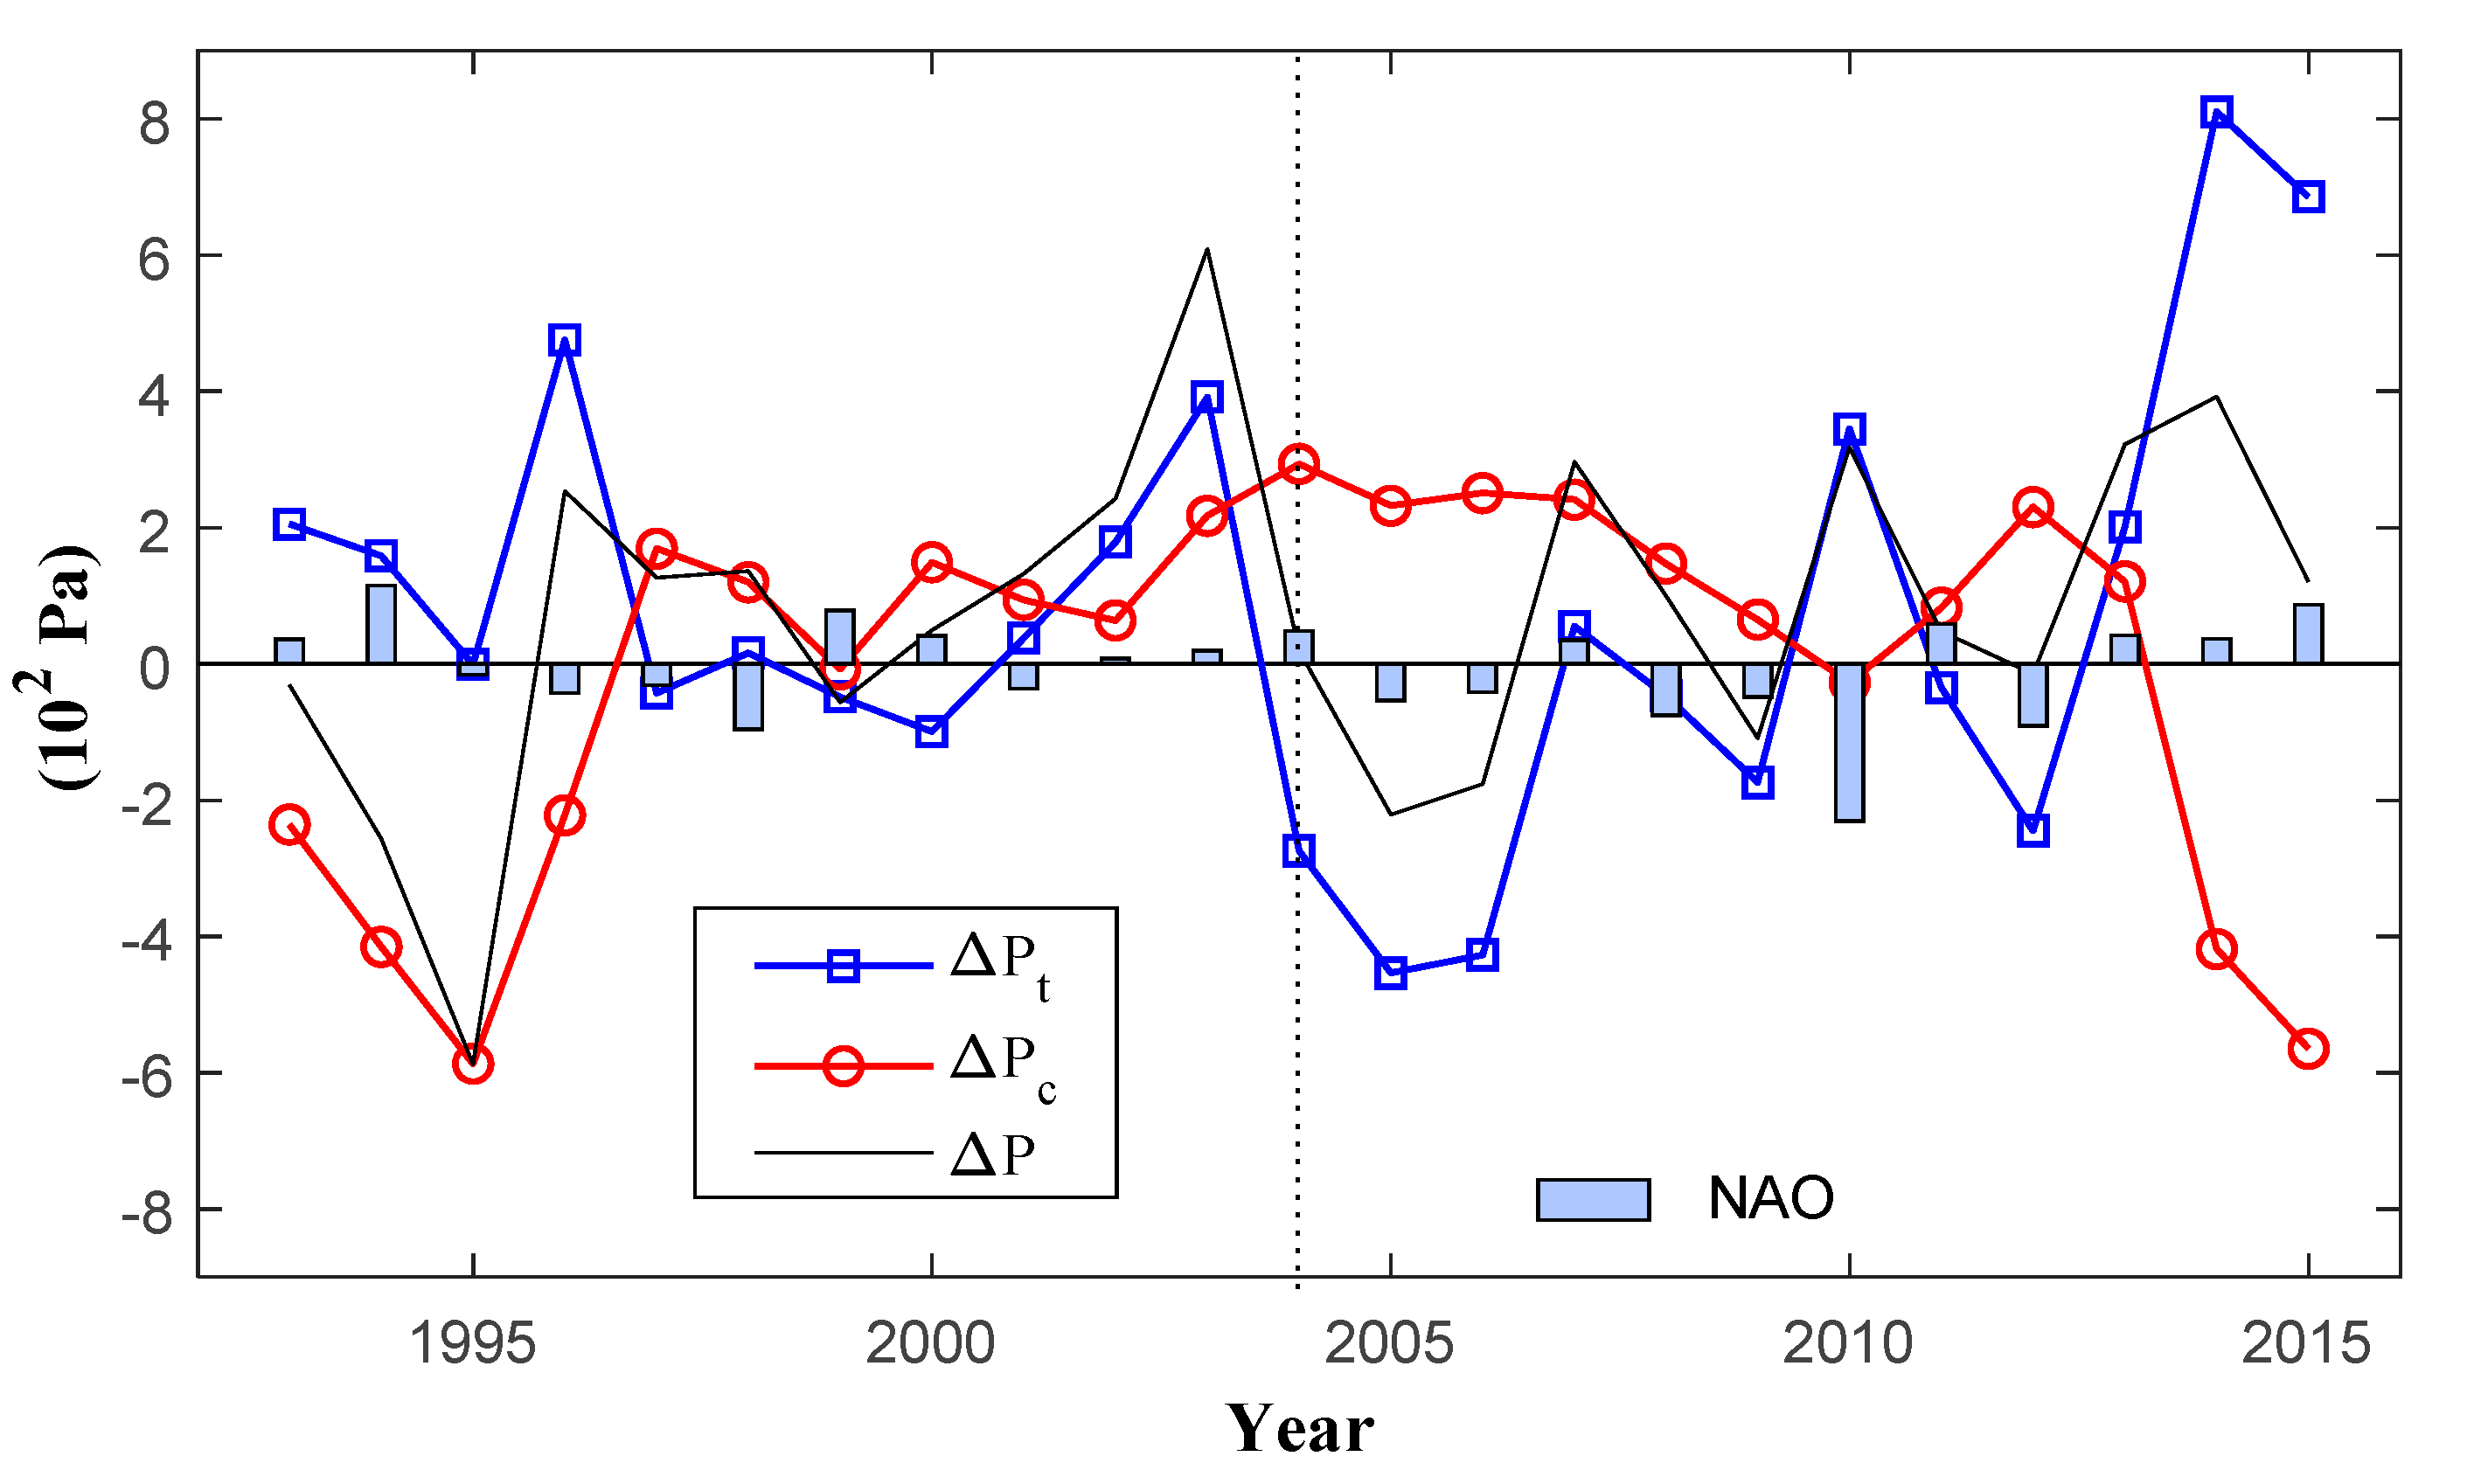
Two points have been selected at the upstream and downstream ends of the FBC to construct the temporal variations of pressure difference. Based on the overflow water sources in different overflow channels and combining the location given by Olsen et al. [
4], we selected (64 N, 2 W) and (62 N, 15 W) to estimate the FBC overflow flux (the location is shown in
Figure 1). It can be seen from
Figure 6 that the inter-annual variation characteristics of ∆P
trop and ∆P
clin obtained in this paper are very consistent with
Figure 2 of Olsen et al. [
4]. Both results showed the minimum values of ∆P
clin and ∆P in 1995, and the relative maximum values of ∆P
trop and ∆P in 2003; from 1993 to 2005, ∆P
clin and ∆P were rapidly rising and ∆P
trop had no significant change trend. At the same time, the inter-annual variation of ∆P calculated here is about 2 × 10
2 Pa and about 10% of the mean ∆P, which is basically consistent with the observed inter-annual variation of FBC overflow [
3]. In short, the pressure difference between the two points selected in this paper can be used to estimate the FBC overflow flux change. From the spatial distribution map of the SLA trend rate (
Figure 4), it can be seen that the trend rate of SLA has a good spatial continuity in the sea areas near both sides of the GSR, and the results would not be significantly changed due to slight difference in the selection of the grid location.
Specifically, ∆P
trop experienced a slow decline with fluctuation from 1993 to 2005 and reached the minimum value in the past 23 years before 2005. ∆P
trop increased with fluctuation from 2005 to 2013 and rose rapidly from 2013 to 2014; after that, it fell back. The year 2014 had the maximum value of ∆P
trop in the past 23 years (
Figure 6). ∆P
clin first decreased slightly in the period of 1993–1997, then increased before 2004, and reached the maximum value in the past 23 years before 2004; then it decreased slowly in the period of 2004–2013, and decreased rapidly in the last two years. ∆P
clin in 2015 reached the minimum value in the past 23 years. ∆P was basically at an average level in 1993, followed by a relatively large fluctuation. After experiencing the minimum value in 1995 and the maximum value in 2003, it basically returned to the mean level in 2015. The linear regression of the annual mean ∆P results in a change rate of 1.6 × 10
2 Pa/dec. Olsen et al. [
4] gave a linear coefficient of FBC overflow flux change (∆q) and ∆P of k = 10
−3 Sv/Pa. Using this linear coefficient, we obtain the FBC overflow enhancement rate of about 0.16 Sv/dec, which is quite small relative to the mean FBC overflow flux (2.9 Sv). At the same time, the linearly increasing trend of ∆P failed the 95% confidence test but passed the 90% confidence test. In fact, ∆P in 2015 was only about 1 × 10
2 Pa larger than in 1993, which is quite small.
The changes in these three parameters have no significant correspondence with NAO, and most of the wind stress curl changes in the Nordic Sea are related to NAO [
30]. This indicates that the interannual sea level changes are not mainly driven by wind stress, but more likely are the result of changes in the properties of the upper seawater.
5. Relationship between Barotropic Pressure and Baroclinic Pressure
Olsen et al. [
4] concluded that ∆P
trop and ∆P
clin on both sides of the FBC have a correlation lag of about three years, and analyzed the mechanism of the correlation as follows: due to wind stress, the sea level difference on both sides of the FBC increases (decreases) and the ∆P on both sides increases (decreases) through the barotropic pressure effect. Then, the overflow transport is enhanced (weakened), causing the iso-density interface in the Norwegian Basin to sink (rise) and the ∆P
clin gradually decreases (increases); and then ∆P gradually decreases (increases) until recovers to normal level. This feedback mechanism could help ∆P remain stable, which means the overflow transport is stable. They use a simplified two-layer model to express the mechanism as:
where
= 1.025 × 10
3 kg/m
3 is the surface seawater density, g = 9.8 kg/m
3 is the gravitational acceleration, and ∆ρ = 0.5 kg/m
3 is the density difference between overflow water and upper water body. Linear regression coefficient of overflow flux change (∆q) and pressure difference (∆P) is k = 10
−3 Sv/Pa. A is the contact area between the overflow layer and the upper layer in the Nordic Sea, or rather the area of the Norwegian Sea deeper than 500 m, which is equal to 5.8 × 10
11 m
2 [
4]. T is the time for the high-density water interface to sink ∆D after the barotropic pressure disturbance, which is also the time for ∆P to restore to the initial state. The calculated T is approximately equal to three years.
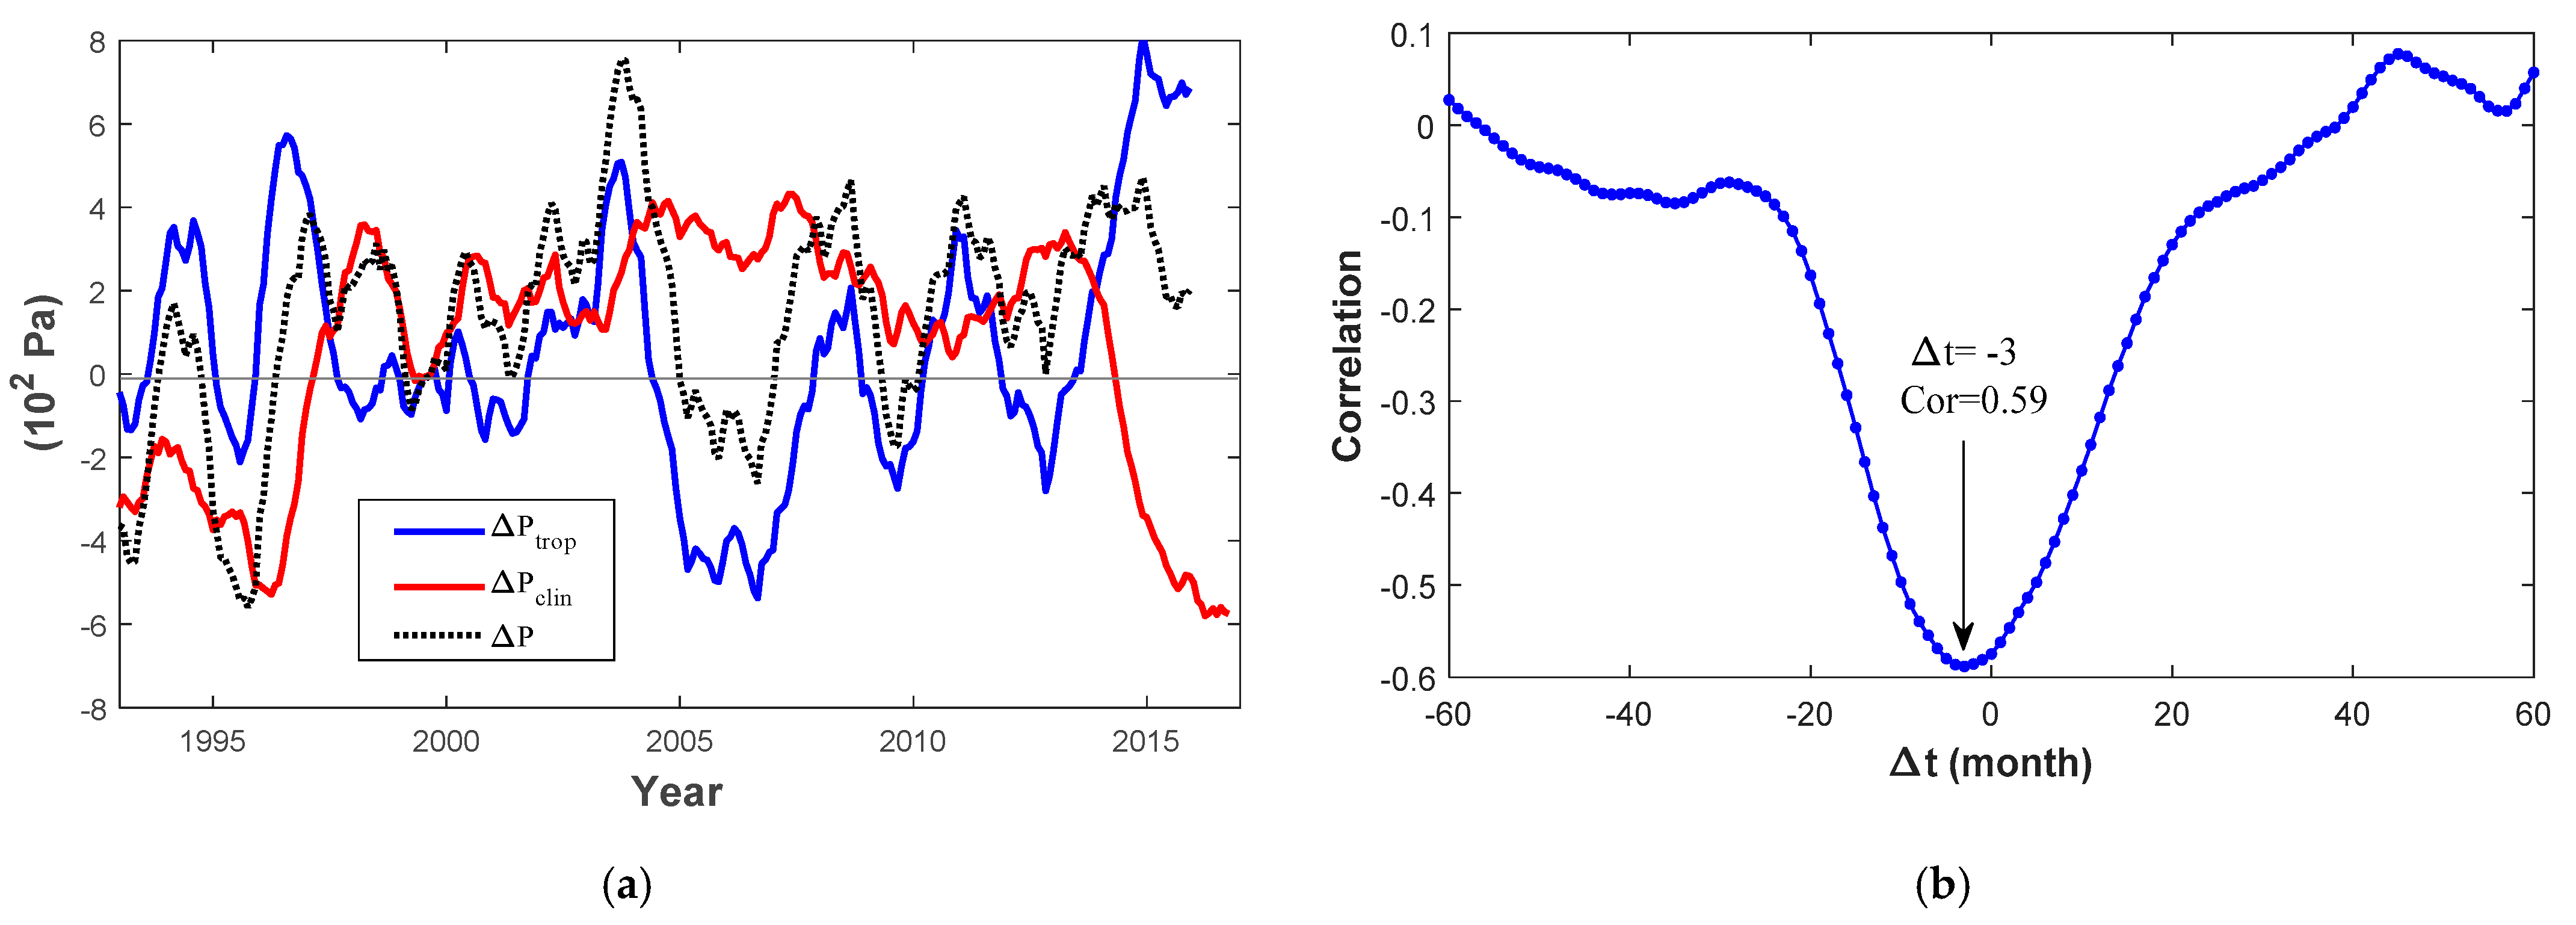
The monthly mean variation of ∆P
trop, ∆P
clin, and ∆P was constructed based on EN4 and SLA data, and the correlation between ∆P
trop and ∆P
clin lagging or leading in different months was analyzed (
Figure 7). When ∆P
trop is about three months ahead of ∆P
clin, the negative correlation between them is the largest (−0.59). Olsen et al. [
4] defined the horizontal spatial area occupied by overflow water as the seabed deeper than 500 m. However, the dense water in the Norwegian Sea is not freely available for overflow transport, and the dense water in the center of the basin, which occupies most of the area, is circulated by the boundary oceanic circulation. Therefore, the size of the effective overflow area is much smaller than that of the ocean basin. Based on the feedback mechanism of Olsen et al. [
4] and the lag time obtained in this article, the horizontal spatial range of available overflow water upstream of the FBC can be estimated to be 0.5 × 10
11 m
2, which is about 1/12 of the value given by Olsen et al. [
4]. This ratio is close to the percentage of available overflow water in the total overflow water in the Nordic Sea (80%~85%) obtained by other studies [
19].
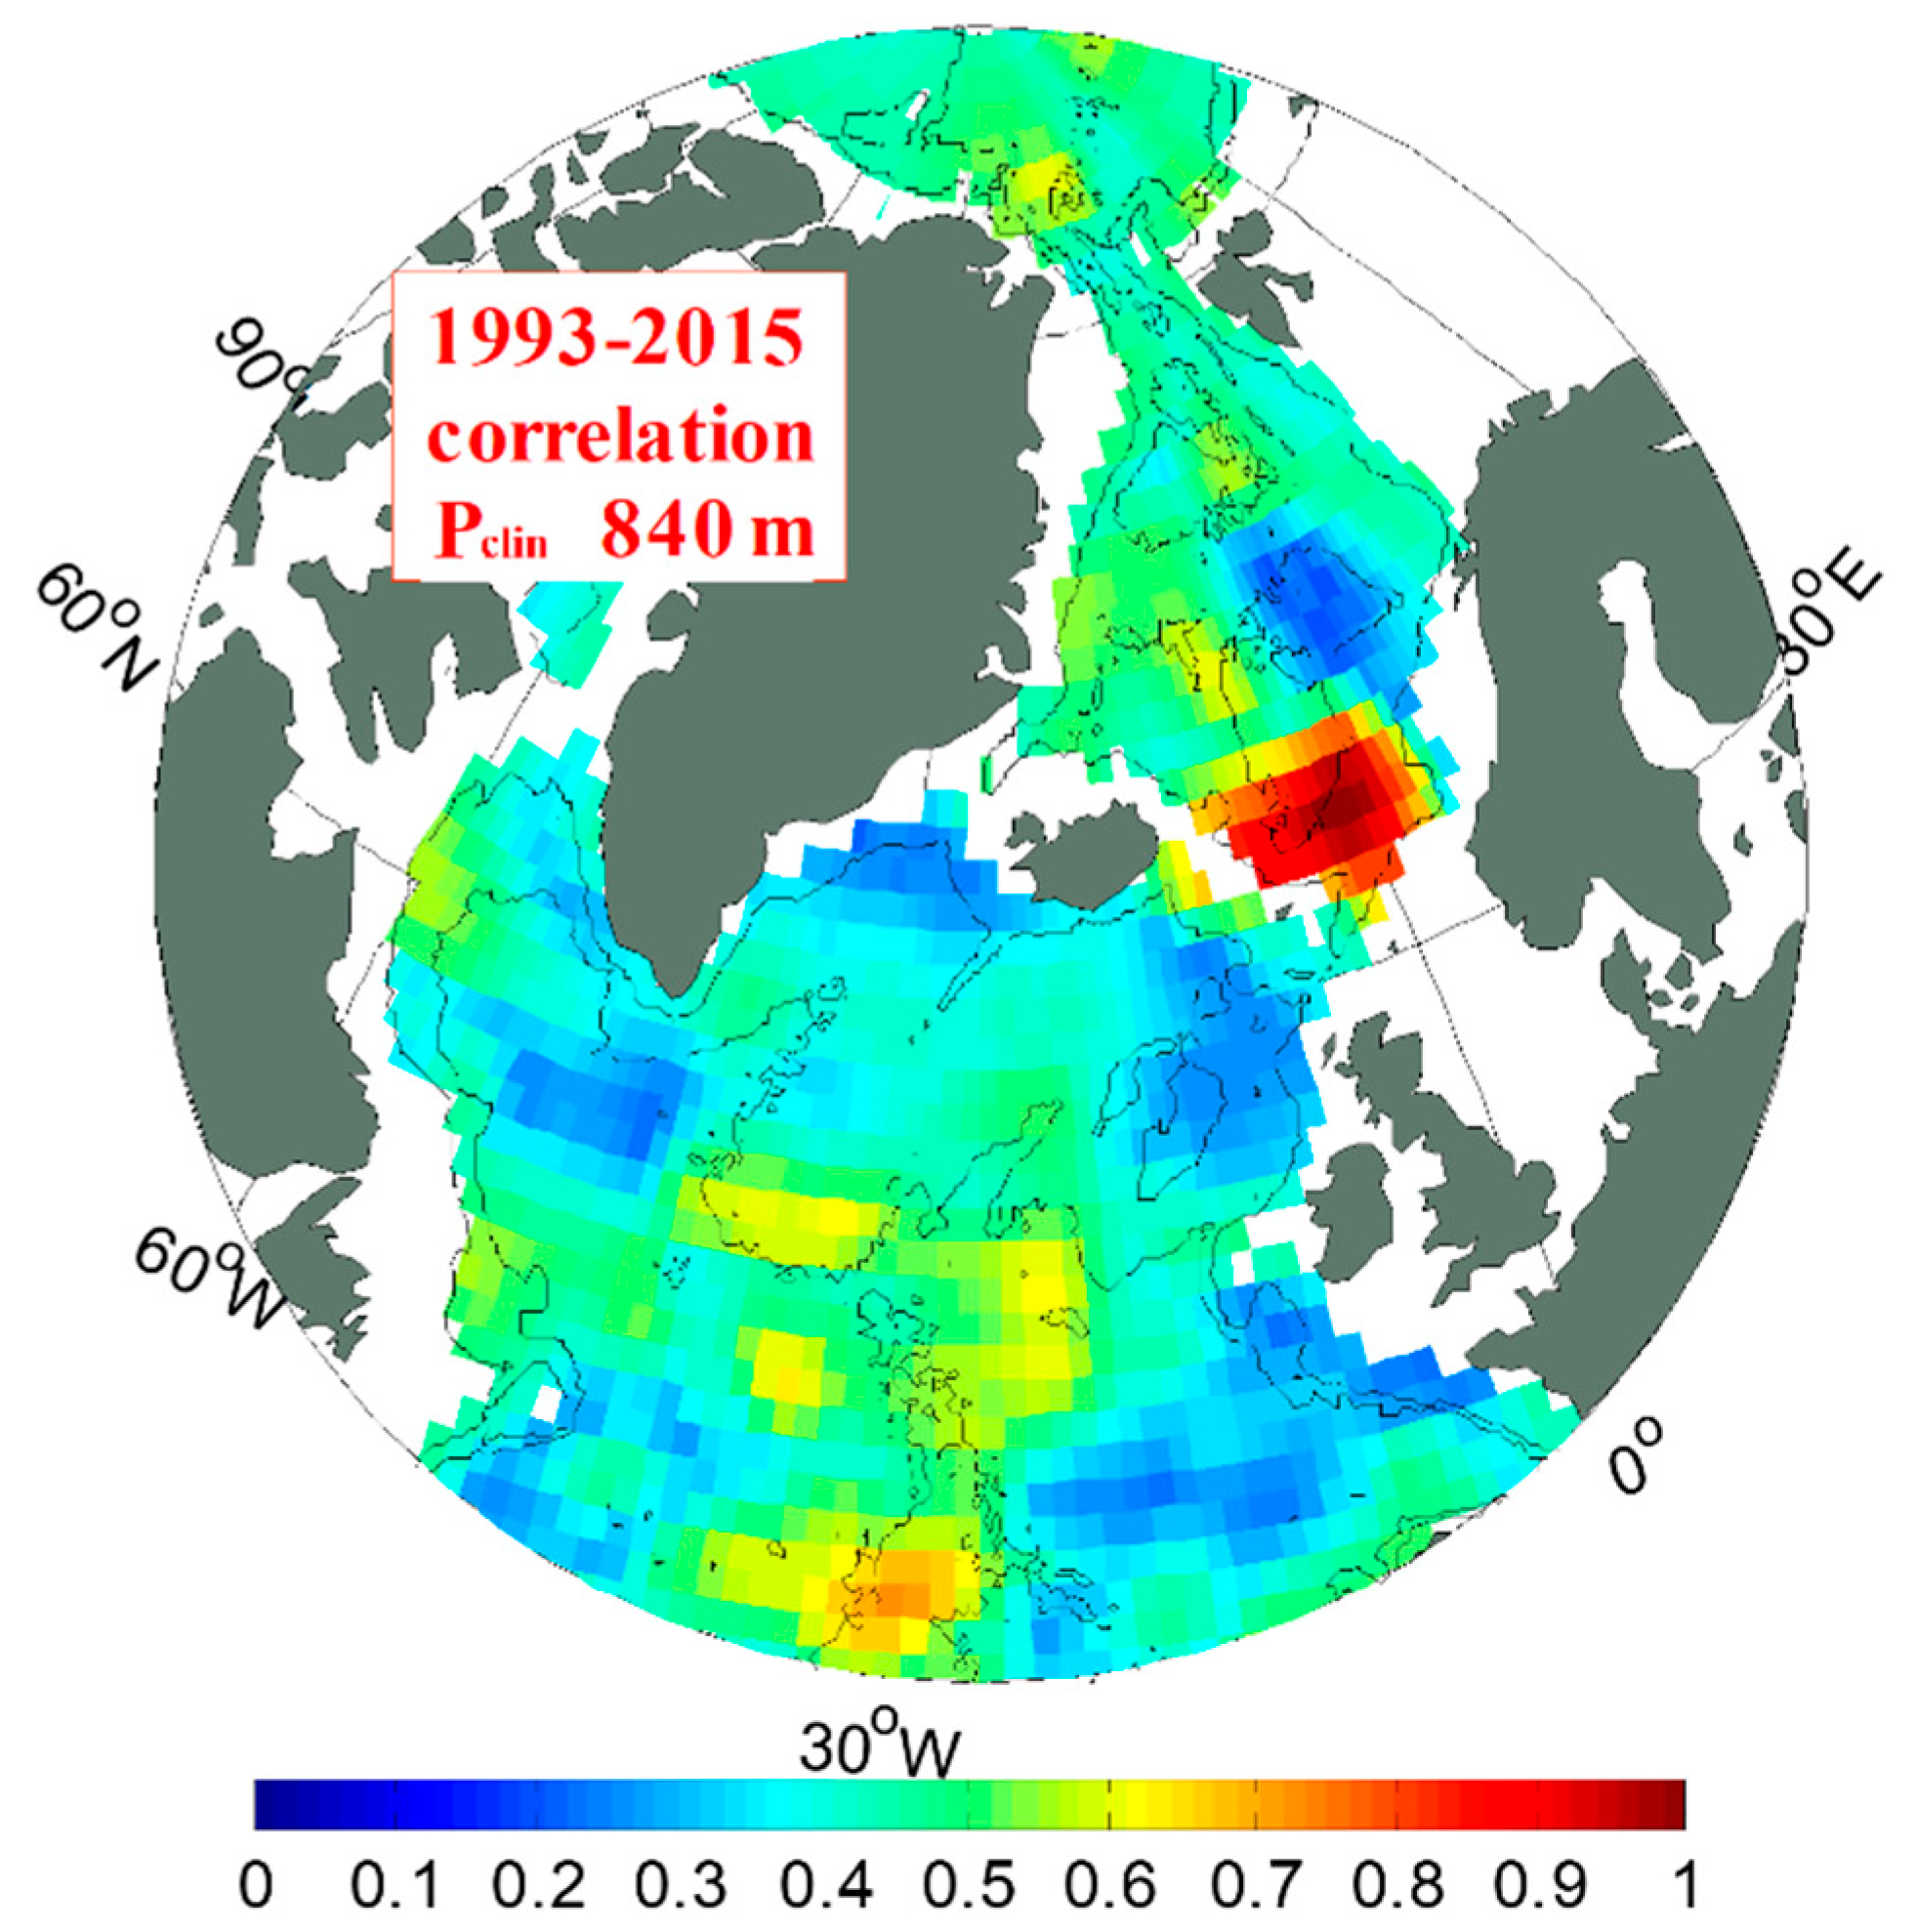
The high P
clin correlation with the station in the southern part of the Norwegian Sea (64 N, 2 W) is limited to a small area in the southern part of the Norwegian Sea (the area with a correlation greater than 0.8 in
Figure 8). The P
clin in this area has a good consistency of change, which can be considered as the available overflow area upstream of the FBC overflow. The area with a correlation greater than 0.8 is about 1.8 × 10
11 m
2, and the area with a correlation greater than 0.9 is 0.9 × 10
11 m
2. It is more likely that the changes of ∆P
trop and ∆P
clin are both dominated by changes in seawater properties, so the largest negative correlation between them basically has no lead or lag (
Figure 9).
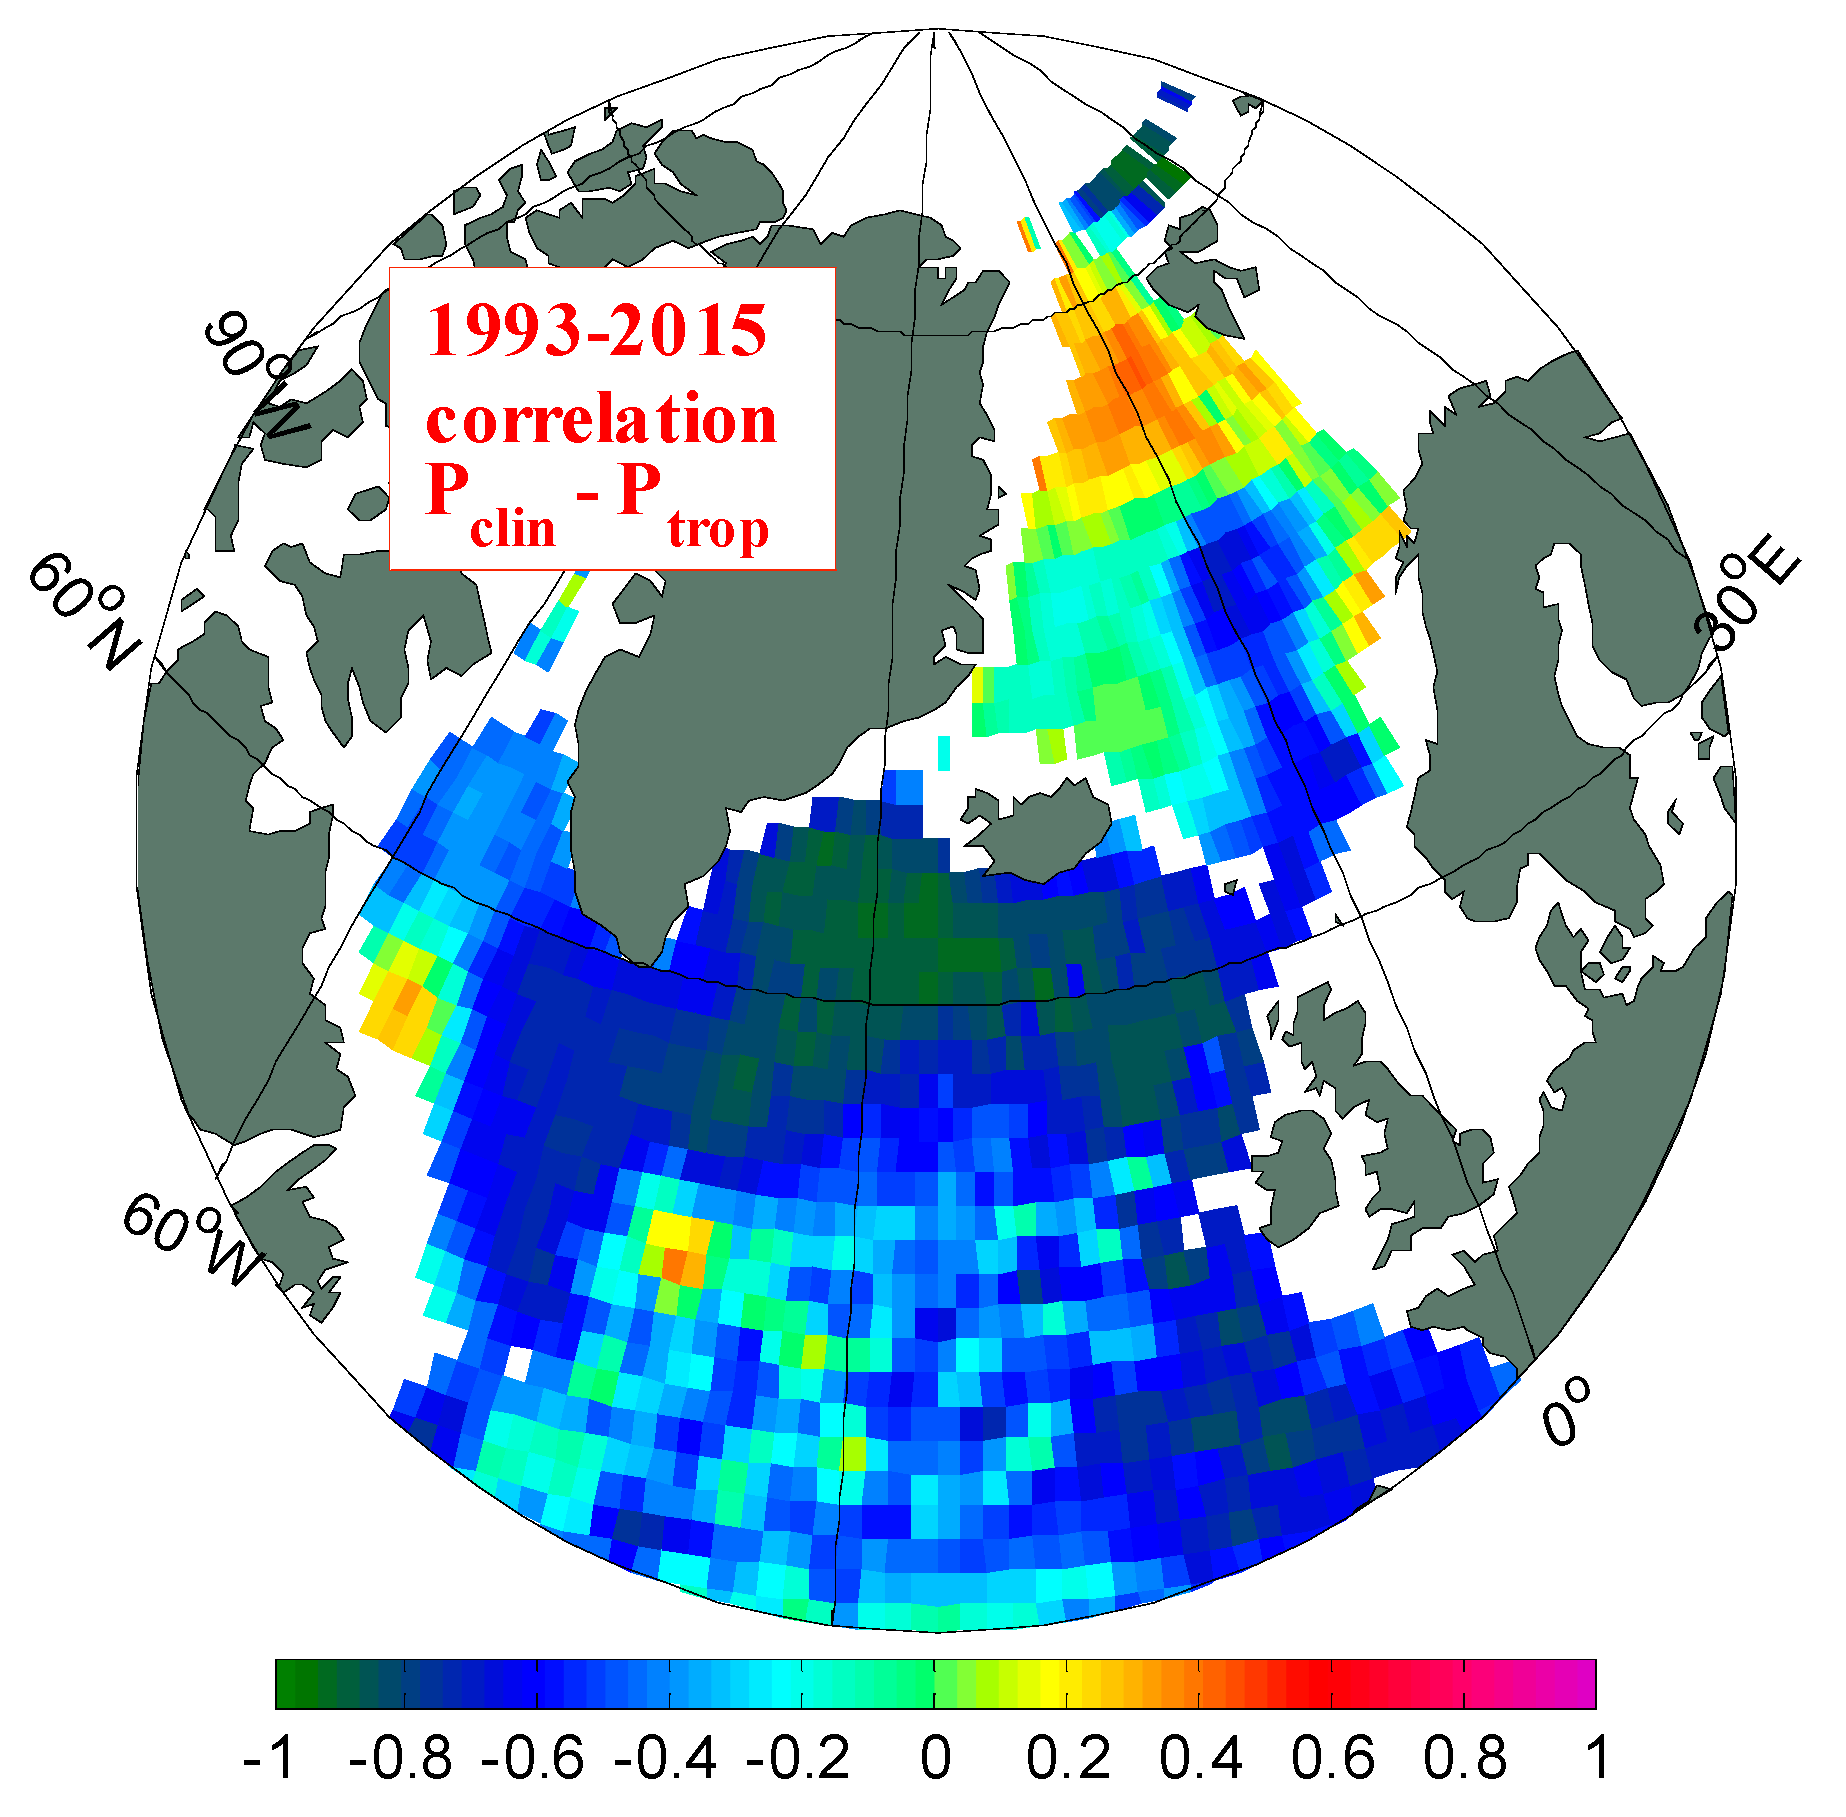
Changes in the properties of the upper seawater will cause the reverse change of P
clin and P
trop, while the total pressure will not change due to the unchanged seawater quality. Therefore, the sea area with a stronger negative correlation between P
clin and P
trop indicates that changes in the properties of the upper seawater play a greater role in the changes of both there. It can be seen from
Figure 9 that there is a strong negative correlation between P
clin and P
trop in the southern sea area of GSR, the correlation coefficient is close to −1.0, while the total pressure at this place has no trend change characteristics (
Figure 4), which shows that the changes of P
clin and P
trop are mainly caused by the changes in the properties of the upper seawater. In the Nordic Sea north of GSR, this negative correlation is not so strong. Among them, in the Norwegian Sea, P
clin and P
trop have a certain negative correlation, indicating that the change in the properties of the upper seawater is one of the important factors which cause the changes in the two. There are other processes that lead to the increase in the quality of the upper seawater, which causes a slight increase trend in the total pressure (
Figure 4). The negative correlation between P
clin and P
trop is no longer significant in other areas of the Nordic Sea except the Norwegian Sea. In the Icelandic Sea, the correlation between P
clin and P
trop is poor and the SLA increases significantly, which leads to a significant increase in the total pressure (
Figure 4). There is a weak positive correlation between the two in the Greenland Sea, indicating that the changes of P
clin and P
trop in this area are mainly affected by other processes.
Under hydrostatic assumption, changes in the density of seawater above 840 m depth will not change the hydrostatic pressure at this depth. To change the pressure at this depth, it needs to change the mass of the water column at this depth. There are two ways. One is to change the absolute mass of the water column, or to change the sea level through wind stress curl, runoff input, sea-air material flux, and other factors. The other is to change the relative mass of the water column by changing the density of the deep layer, causing the column to expand or contract. The mass percentage of the water column above the 840 m depth can change the entire water column.
At present, most ocean numerical models are based on Boussinesq approximation, which cannot reflect sea level changes caused by changes in seawater properties. When the density of the sea layer in Northern Europe decreases, the pressure obtained by simulation decreases, which in turn leads to the weakening of simulated overflow [
31]. It can be seen from the results of this paper that the steric effect contributes to most of the sea level trend changes in the sea area surrounding the GSR and has a significant impact on the long-term changes in overflow transport. Therefore, the simulation and prediction of long-term changes in overflow requires the use of non-Boussinesq ocean models, considering the impact of changes in seawater properties on SLA.
6. Conclusions
The Nordic Sea overflow is hydraulically controlled; the changes of the overflow flux depend only on the pressure difference at the depth of the overflow outlet on both sides of the GSR. Based on the satellite altimeter data and the reanalysis hydrological data, we obtained a slight increase in the pressure difference between the two sides of the GSR from 1995 to 2015. However, this trend is not significant and is more consistent with the observed stable overflow flux. Among them, the barotropic pressure and baroclinic pressure in the southern sea area of the GSR have a very good negative correlation (correlation coefficient is close to −1.0). The changes in both are basically caused by the changes in the properties of the upper seawater, and the total pressure there is only a slight increasing trend. The barotropic pressure and baroclinic pressure of the Norwegian Sea in the northern part of the GSR have a certain negative correlation (correlation coefficient is about −0.6), indicating that changes in the properties of the upper seawater are important factors that cause changes in the barotropic and baroclinic pressures in the sea area, and other processes can also lead to a slight increase in the barotropic pressure there. While the correlation between the barotropic pressure and the barotropic pressure in the Icelandic Sea is poor, the barotropic pressure increases significantly which leads to a significant increase in the total pressure there.
By selecting two representative points, the barotropic pressure difference and baroclinic pressure difference on both sides of the FBC are constructed. The changes in the barotropic pressure and baroclinic pressure on both sides of the FBC are more likely caused by the changes in the properties of the local upper seawater. The total pressure difference caused no significant trend changes characteristics between 1993–2015, which is consistent with the observation of stable overflow flux.
In the Nordic Sea, the area with the fastest sinking of the overflow water upper interface is the Lofton Basin, with a sinking speed of more than 100 m/dec, indicating that the storage of overflow water there is rapidly decreasing. The physical processes that produce dense water, such as deep convection in the Greenland Sea, are weakening, and the source of overflow provided is reducing, leading to warming and lightening of the upper layer of the Norwegian Sea and sinking of the upper interface of the overflow water. However, the changes in the properties of the upper seawater in the Norwegian Sea cannot reduce upstream pressure in the depth of the sill to weaken overflow transport. Therefore, it will cause the upper interface of upstream overflow water to further decrease. In the future, when the depth of the overflow water upper interface in the Nordic Sea is less than the depth of the sill on the GSR, the overflow may greatly slow down or even experience a hiatus. This is worthy of close attention and further study.


