Article

Integrated Assessment of Groundwater Potential Using Geospatial Techniques in Southern Africa: A Case Study in the Zambezi River Basin

Department of Civil Engineering, Central University of Technology, Bloemfontein 9300, South Africa
*
Author to whom correspondence should be addressed.
Water 2021, 13(19), 2610; https://doi.org/10.3390/w13192610
Submission received: 25 August 2021 / Revised: 18 September 2021 / Accepted: 19 September 2021 / Published: 22 September 2021
(This article belongs to the Special Issue Integrated Water Assessment and Management under Climate Change)

Abstract

:
Groundwater resources are largely used in rural communities of river basins due to their acceptable water quality and reliability for domestic purposes where little or no treatment is required. However, groundwater resources have been affected by changes in land use, mining activities, agricultural practices, industrial effluent, and urbanisation among anthropogenic influences while climate change impacts and volcanic eruptions have affected its involvement among the natural phenomena. The purpose of the study was to assess groundwater potential in the basin with the use of Analytical Hierarchy Process (AHP), remote sensing, GIS techniques, and groundwater occurrence and movement influencing factors. These factors were used to produce seven thematic maps, which were then assigned weights and scale using an AHP tool, based on their degree of influence on groundwater occurrence and movement. A weighted groundwater potential map was produced with four zones denoted as 0.4% (317 km2) for very good potential; 27% (19,170 km2) for good potential; 61% (43,961 km2) for moderate potential and 12% (8639 km2) for poor potential. Validation, using existing boreholes, showed that 89% were overlain on moderate to very good potential zones and henceforth considered to be a novel approach which is useful for groundwater resources assessment and integrated water management in the basin.

1. Introduction

Groundwater resources assessments are of great prominence in arid and semi-arid regions where water is generally a critical resource [1]. Assessment of groundwater potential for a river basin is a prerequisite for integrated water management [2,3]. Adequate information on temporal and spatial variability of potential groundwater resources is required, especially with regard to water availability, quality and maintenance of environmental flows [4]. Groundwater resources are a primary source of domestic use for many communities across the world [5,6].
Human development largely depends on the availability of quality surface and groundwater resources to meet the needs of water supply for human health, energy, agricultural, environmental, industrial, and mining sectors. The priority in water allocation is to meet the needs of water supply for human health. Groundwater resources are the most preferred resources for domestic use since little or no treatment is required. Many surveys for groundwater potential involve costly and complex techniques which include geophysical investigations, predictions, ground-based surveys and exploratory drilling [1]. These techniques require much time, large data sets and are also expensive [5].
Several studies are currently using weighted overlay analysis to evaluate groundwater potential zones [5,7,8,9]. For instance, a groundwater potential zone was simulated in the Itwad-Khamis watershed in Saudi Arabia using Fuzzy-AHP and geoinformation techniques, and found that 82% of existing wells were located in a very good and good potential area [10]; Geoscience, GIS and the AHP approach were used for mapping groundwater potential zones in Buffalo semi-arid catchment in South Africa, where the obtained results showed a good correlation between borehole data and the groundwater potential zones, and recommended the approach for semi-arid areas [11]. Groundwater potential zones were delineated using geospatial techniques and AHP for Dumka district of India, and after comparing the groundwater potential zone map with measured discharge data from various wells within the study area, the results were found to be reasonable [12]. Geospatial techniques were used to evaluate groundwater potential in the Gerardo River Catchment of Northern Ethiopia; the dug wells and boreholes on groundwater potential suitability map were overlaid, and found that they coincided with expected values [13]. GIS and AHP techniques were applied by the delineation of groundwater potential zones as a case study in Southern Western Ghats of India and concluded that much of the basin area was covered under moderate, followed by low and high groundwater potential zones while very high and very low potential zones were extremely limited in the basin [14].
Other previous studies in geospatial techniques include: a comparative study of machine learning and Fuzzy-AHP technique to groundwater potential mapping in the data-scarce region of India, where it was concluded that machine learning models could not map the groundwater potential areas as much as fuzzy-AHP based weighted overlay analysis [9]; a model-driven fuzzy spatial multi-criteria decision making method was used in developing sustainable road infrastructure performance indicators in western Australia and was found to be a reliable and accurate method in decision making [15]; multi-criteria decision making and machine learning in conjunction with remote sensing and GIS techniques were used in a flash-flood susceptibility assessment of Prahova river basin of Romania and it was concluded that, in general, a better performance could be realized from the kNN–AHP ensemble model [16].
Most of the studies in the Zambezi River Basin have explored aspects such as surface hydrology, general modelling, and climate change. Some of the studies undertaken include: comparison of the performance of two models in the Zambezi River Basin with regard to reliability and identifiability [17]; satellite rainfall data was compared with observations from gauging station networks in Southern Africa [18]; an assessment of impacts of climate change on water resources and hydropower systems in central and Southern Africa [19]; modelling impact of climate change on Kabompo catchment water balance in Zambezi River Basin [20]; application of gridded climate data for hydrological modelling in the Zambezi River Basin, Southern Africa [21]; assessment of hydrological risks and consequences for Zambezi River Basin dams [22]; analysis of spatiotemporal precipitation in the sparsely gauged Zambezi River Basin [23]; assessment of climate change/variability implications on hydroelectricity generation in the Zambezi River Basin [24].
However, there are no known studies that have assessed groundwater potential at a high resolution in the basin. This paper, therefore, seeks to fill the existing research gap by assessing the groundwater potential for Kabompo catchment (KC) in the Zambezi River Basin and help to generate new knowledge around the integrated assessment of groundwater potential, and contribute towards integrated water management in the basin.
This paper focusses on the application of the Analytical Hierarchy Process (AHP), remote sensing, GIS techniques, and groundwater occurrence and movement influencing factors in an integrated manner to assess the potential for groundwater resources in the KC. The resultant groundwater potential map emanating from this study is expected to be a useful tool for groundwater assessments, prospection, and integrated groundwater management in the basin.

2. Materials and Methods

2.1. The Study Area

Kabompo catchment was selected as a study site within the Zambezi River Basin, in Southern Africa. The Kabompo catchment is found in the north-western province of Zambia and Kabompo River is one of the major tributaries of the middle Zambezi River Basin. The basin is predominately underlain with loose sandy soils and with wooded savannah as the major land use. Figure 1 shows the location of the study area in Southern Africa.

2.2. Biophysical Data

The study involved the collection of biophysical data such as land use/land cover, soil, topography, precipitation, lithology, and borehole data (ground truthing data).
The land use/land cover was sourced from Global Land Cover Characterisation (GLCC). The data set has the resolution of 500 × 500 m land cover type from Moderate Resolution Imaging Spectroradiometer (MODIS). The MODIS Global Land Cover Types are widely used in hydrological investigations. The MODIS land cover type product (MCD12Q1), with a collection 5.1, has annual plant functional types of classification with a valid range of 0 to 11 which is recognised with higher inter-annual variations, reaching 40% of land pixels that indicate land cover change in one or more times during 2001–2010 [25].
The soil data was obtained from the FAO Africa database, http://www.fao.org/soils-portal/soil-survey/soil-maps-and-databases/en/ (accessed on 12 October 2020). The KC has four major soil types, of which loose sandy soils are predominant, followed by fine loamy to clayey soils, fine loamy soils and gravelly clayey soils. The loose sandy soils, also called Kalahari sands, cover nearly one metre of depth with a sand content of more than 70%, and characterised with a clay and silt content of less than 10%, low nutrient content, and low water retention capacity.
Precipitation, which is mostly rainfall in the basin and measured in mm, was obtained from Zambia Meteorological Department (ZMD), Lusaka, Zambia, an institution responsible for collection and management of weather data in the country. The monthly rainfall data for the period from 1982 to 2013 was collected from weather stations, which are considered to have direct influence on the KC. These are Solwezi, Mwinilunga, Kabompo, Kasempa and Zambezi. Hydrogeological data was obtained from Water Resources Management Authority (WARMA), Lusaka, Zambia, which contained a complete description of lithology, such as rock type, class, age, and formation for the entire catchment.
Borehole data was obtained for 980 boreholes from the Department of Water Resources Development (DWRD), Solwezi, north-western province under Ministry of Water Development, Water Supply and Sanitation and Environmental Protection of the Government of the Republic of Zambia. The data covered the period from 1970 to 2016 and was considered vital for ground truthing and validation. The 980 boreholes were just few of the thousands of boreholes and wells constructed in the basin over the years. The data was obtained from every part of the basin, which included Mwinilunga, Ikelenge, Kabompo, Manyinga, Mufumbwe and Kalumbira districts. Kalumbira district includes Manyama, Lumwana and Maheba areas. The data details included: name of borehole, location coordinates, depth of borehole, static water level, dynamic water level, constituency, ward and, in a few cases, borehole yield. The status of these boreholes in terms of functionality is unknown but the Department estimate that 75% of the captured boreholes could be functional and 25% may be non-functional due to factors such as breakdown of pumping device, drying up of the borehole, borehole collapsing, polluted water, vandalised boreholes, and abandoned boreholes due relocation of communities.
The Digital Elevation Model (DEM) was obtained from the Shuttle Radar Topographical Mission (SRTM) with a resolution of 30 m US-Geological Survey, earth explorer (https://earthexplorer.usgs.gov/, accessed on 17 October 2020), the elevation data most commonly used in the world. The KC was extracted from the pro-mosaic DEM, with elevation ranging from 1020 to 1568 m above sea level.
The study focussed on geological, biophysical and hydrometeorological factors, which are critical in the study area. Based on these factors, seven thematic maps were created for the integrated assessment of groundwater potential.

2.3. Methodological Approach

The study approach considered geology, biophysical and hydrometeorological factors where seven thematic layers were extracted and assigned varying weights depending on their influence on groundwater potential [26,27]. Figure 2 illustrates the methodological approach for assessment of groundwater potential.
Figure 2 illustrates seven thematic maps that were processed from geological, biophysical and hydrometeorological factors in groundwater evaluation potential. The thematic layers included: lineament density, lithology, land use land cover, soil, slope, rainfall and drainage density.

2.4. Preparation of Thematic Data

The lineament density layer was created through the digitisation of Digital Elevation Model (DEM) from and combining this with the identified faults from the geological data using GIS techniques. DEM was downloaded from SRTM with a resolution of 30 m under earth explorer U.S. Geological Survey website (www.earthexplorer.usgs.gov, accessed on 10 October 2020). Lithology was extracted and processed from geological map of Zambia and clipped to the study area in GIS.
Land use and land cover data was downloaded from GLCC, https://www.usgs.gov/centers/eros/science/usgs-eros-archive-land-cover-products-global-land-cover-characterization-glcc (accessed on 12 October 2020). This was a Moderate Resolution Imaging Spectroradiometer (MODIS) Land Cover Type that has a ground resolution of 500 m × 500 m. The obtained land cover data was clipped to the study area and further processed in GIS. The soil data was obtained from FAO Africa soils and the identification of soil types for the study area was conducted using the FAO soil scientific description in GIS. The soils can be accessed from FAO Africa, website http://www.fao.org/soils-portal/soil-survey/soil-maps-and-databases/en/ (accessed on 12 October 2020).
Slope layer was processed from DEM and calculated in degrees in GIS. A river network, drainage density layer and study area were processed from the DEM in GIS. The drainage density layer was determined in kilometres per unit area (km2). The evaluation of groundwater potential would not be complete without hydrometeorological data analysis; therefore, a rainfall map was created from ground observed meteorological data obtained from Zambia Meteorological Department using inverse distance weighted method (IDW) in GIS. Rainfall was considered very important for the catchment without which groundwater would not be available.

2.5. Multi-Criteria Decision Making Methods

There are several multi-criteria decision making methods used in groundwater potential evaluation among them are: Multi-Influencing Factor (MIF), Analytical Hierarchy Process (AHP), Fuzzy Logic (FL), Frequency Ratio (FR), Certainty Factor (CF), Weights–Of-Evidence (WOE), Index Models (IM). Among these techniques, AHP, is the most widely used method and a forerunner in the delineation of groundwater potential zones [12,14]. The AHP technique is one of the most efficient decision making tools and the results obtained are often reliable [28,29]. It simplifies difficult decisions to a series of pair-wise comparisons and then integrates the results. Furthermore, AHP is an appropriate tool for determining the consistency ratio of the results in order to minimise biases in decision making process [30]. Therefore, in this study, AHP technique was selected and used in the analysis of groundwater potential.

2.6. Assignment of Weights to Individual Thematic Layers

The assignment of weights was conducted using the AHP technique, which helps to integrate the information based on the user knowledge of the influence of the thematic layers in the study area. Comparisons are made in pairs based on specific criteria for the created thematic layers and the weight for each parameter is then determined. The accuracy of the matrix is estimated by a Consistency Ratio (CR). The recommended CR values are as follows: less than 0.05 for a 3 × 3 matrix, 0.09 for a 4 × 4 matrix and 0.1 for larger matrices [30]. The thematic layers are subdivided into classes, each based on the scale factor in AHP, which ranges from very poor to very good or very low to very high depending on the preference of the user. Influence (weight) is the overall importance of a layer, while the scale value is the importance of the features in the layer. The scale values may range from 1 to 5 where 1 is less important (very poor) and 5 is more important (very good).

2.7. Validation of Groundwater Potential Zones

The verification of delineated groundwater zones is achieved via validation, using existing boreholes, wells and springs data. Several previous studies have used existing borehole data for validations, for example [28,31,32]. Borehole or well data may include: name, location details such as coordinates, yield important for classification of groundwater zones, depth, static water levels, dynamic water level while the spring data will mostly include the discharge, type of spring and location details. However, this kind of data is very scarce in most developing countries such as Zambia in Southern Africa [27].

3. Results

Groundwater recharge is influenced by dominant catchment and climate factors [33]. It is an important process for increasing the volumes of groundwater reserves. Groundwater flow is governed by Darcy’s law that describes a method for estimating the volume of groundwater flow based on the hydraulic gradient and the permeability of an aquifer, expressed using K, the hydraulic conductivity. The equation widely used by hydrogeologist, may be presented as follows;
Q = K × i × A
where Q is the volume of the groundwater flow (m3/s), K is the hydraulic conductivity (m/s), i is the hydraulic gradient, and A is the cross-sectional area of the aquifer [34].
Groundwater normally occurs in fissures, faults, and fractured zones within a geological formation. Geological composition has a higher influence on the groundwater occurrence and distribution in any terrain [35]. In general, aquifers are classified into four basic formation types based on the geologic environment of their occurrence and these include: unconfined, confined, semi-confined, and perched [36]. Important aquifer properties include transmissivity and storativity [37]. According to [38], the aquifers in Zambia are classified into three major types:
  • Aquifers, where groundwater flow is mostly through fractures, fissures and/or discontinuities, are categorised as highly productive. Highly productive aquifers occur mostly in karstic limestones/marbles on the Copperbelt and stretching down into the Lusaka area;
  • Aquifers, where intergranular groundwater flow is dominant, occur mostly in alluvial soils and Tertiary sand deposits;
  • Low-yielding weathered and/or fractured aquifers with limited potential are largely found in the Basement complex, and some in igneous rocks.
Factors influencing groundwater recharge may vary from one location to another largely due to geological, climatological, and biophysical aspects. The following factors, considered in this study, are found to be critical in influencing groundwater recharge for the study area (KC); these factors are lithology, drainage density, lineament density, slope, soil, land use/land cover and precipitation.

3.1. Lithology

Lithology is an important factor in influencing groundwater, besides drainage and lineament densities. Many studies have shown that lithology is critical for the evaluation of groundwater recharge as it has a large influence on water infiltration and percolation for a particular area [5,7,34].
The study area is predominantly underlain with fossil seif dunes and shale silt sandstone, followed by mine series undifferentiated, undifferentiated granite gneiss, carbonate rocks, basal conglomerate and others (Figure 3). The fossil seif dunes, basal conglomerate and carbonate rocks are considered to be good aquifers of groundwater [39].

3.2. Drainage Density

The drainage density, which is largely dependent on the lithology, is an indicator of groundwater recharge as it affects the percolation rate [5,7]. The recharge rate becomes higher when drainage density is lower than it was when it was higher [40]. If the area is well drained, there will be less infiltration of water into the ground as much of the surface water will be drained to larger water bodies [11,12]. The drainage network for KC was processed from DEM and validated with topographical data. The drainage density is calculated using Equation (2).
D r a i n a g e   d e n s i t y = T o t a l   l e n g t h   o f   r i v e r   n e t w o r k D r a i n a g e   a r e a
The lower the drainage density the more potential the area may have for groundwater occurrence and vice versa. The drainage density map was further categorised into five classes, which are 0–3 for very good, 3–7 for good, 7–11 for moderate,11–15 for poor and 15–18 for very poor. Figure 4 illustrates the drainage density for the catchment.

3.3. Lineament Density
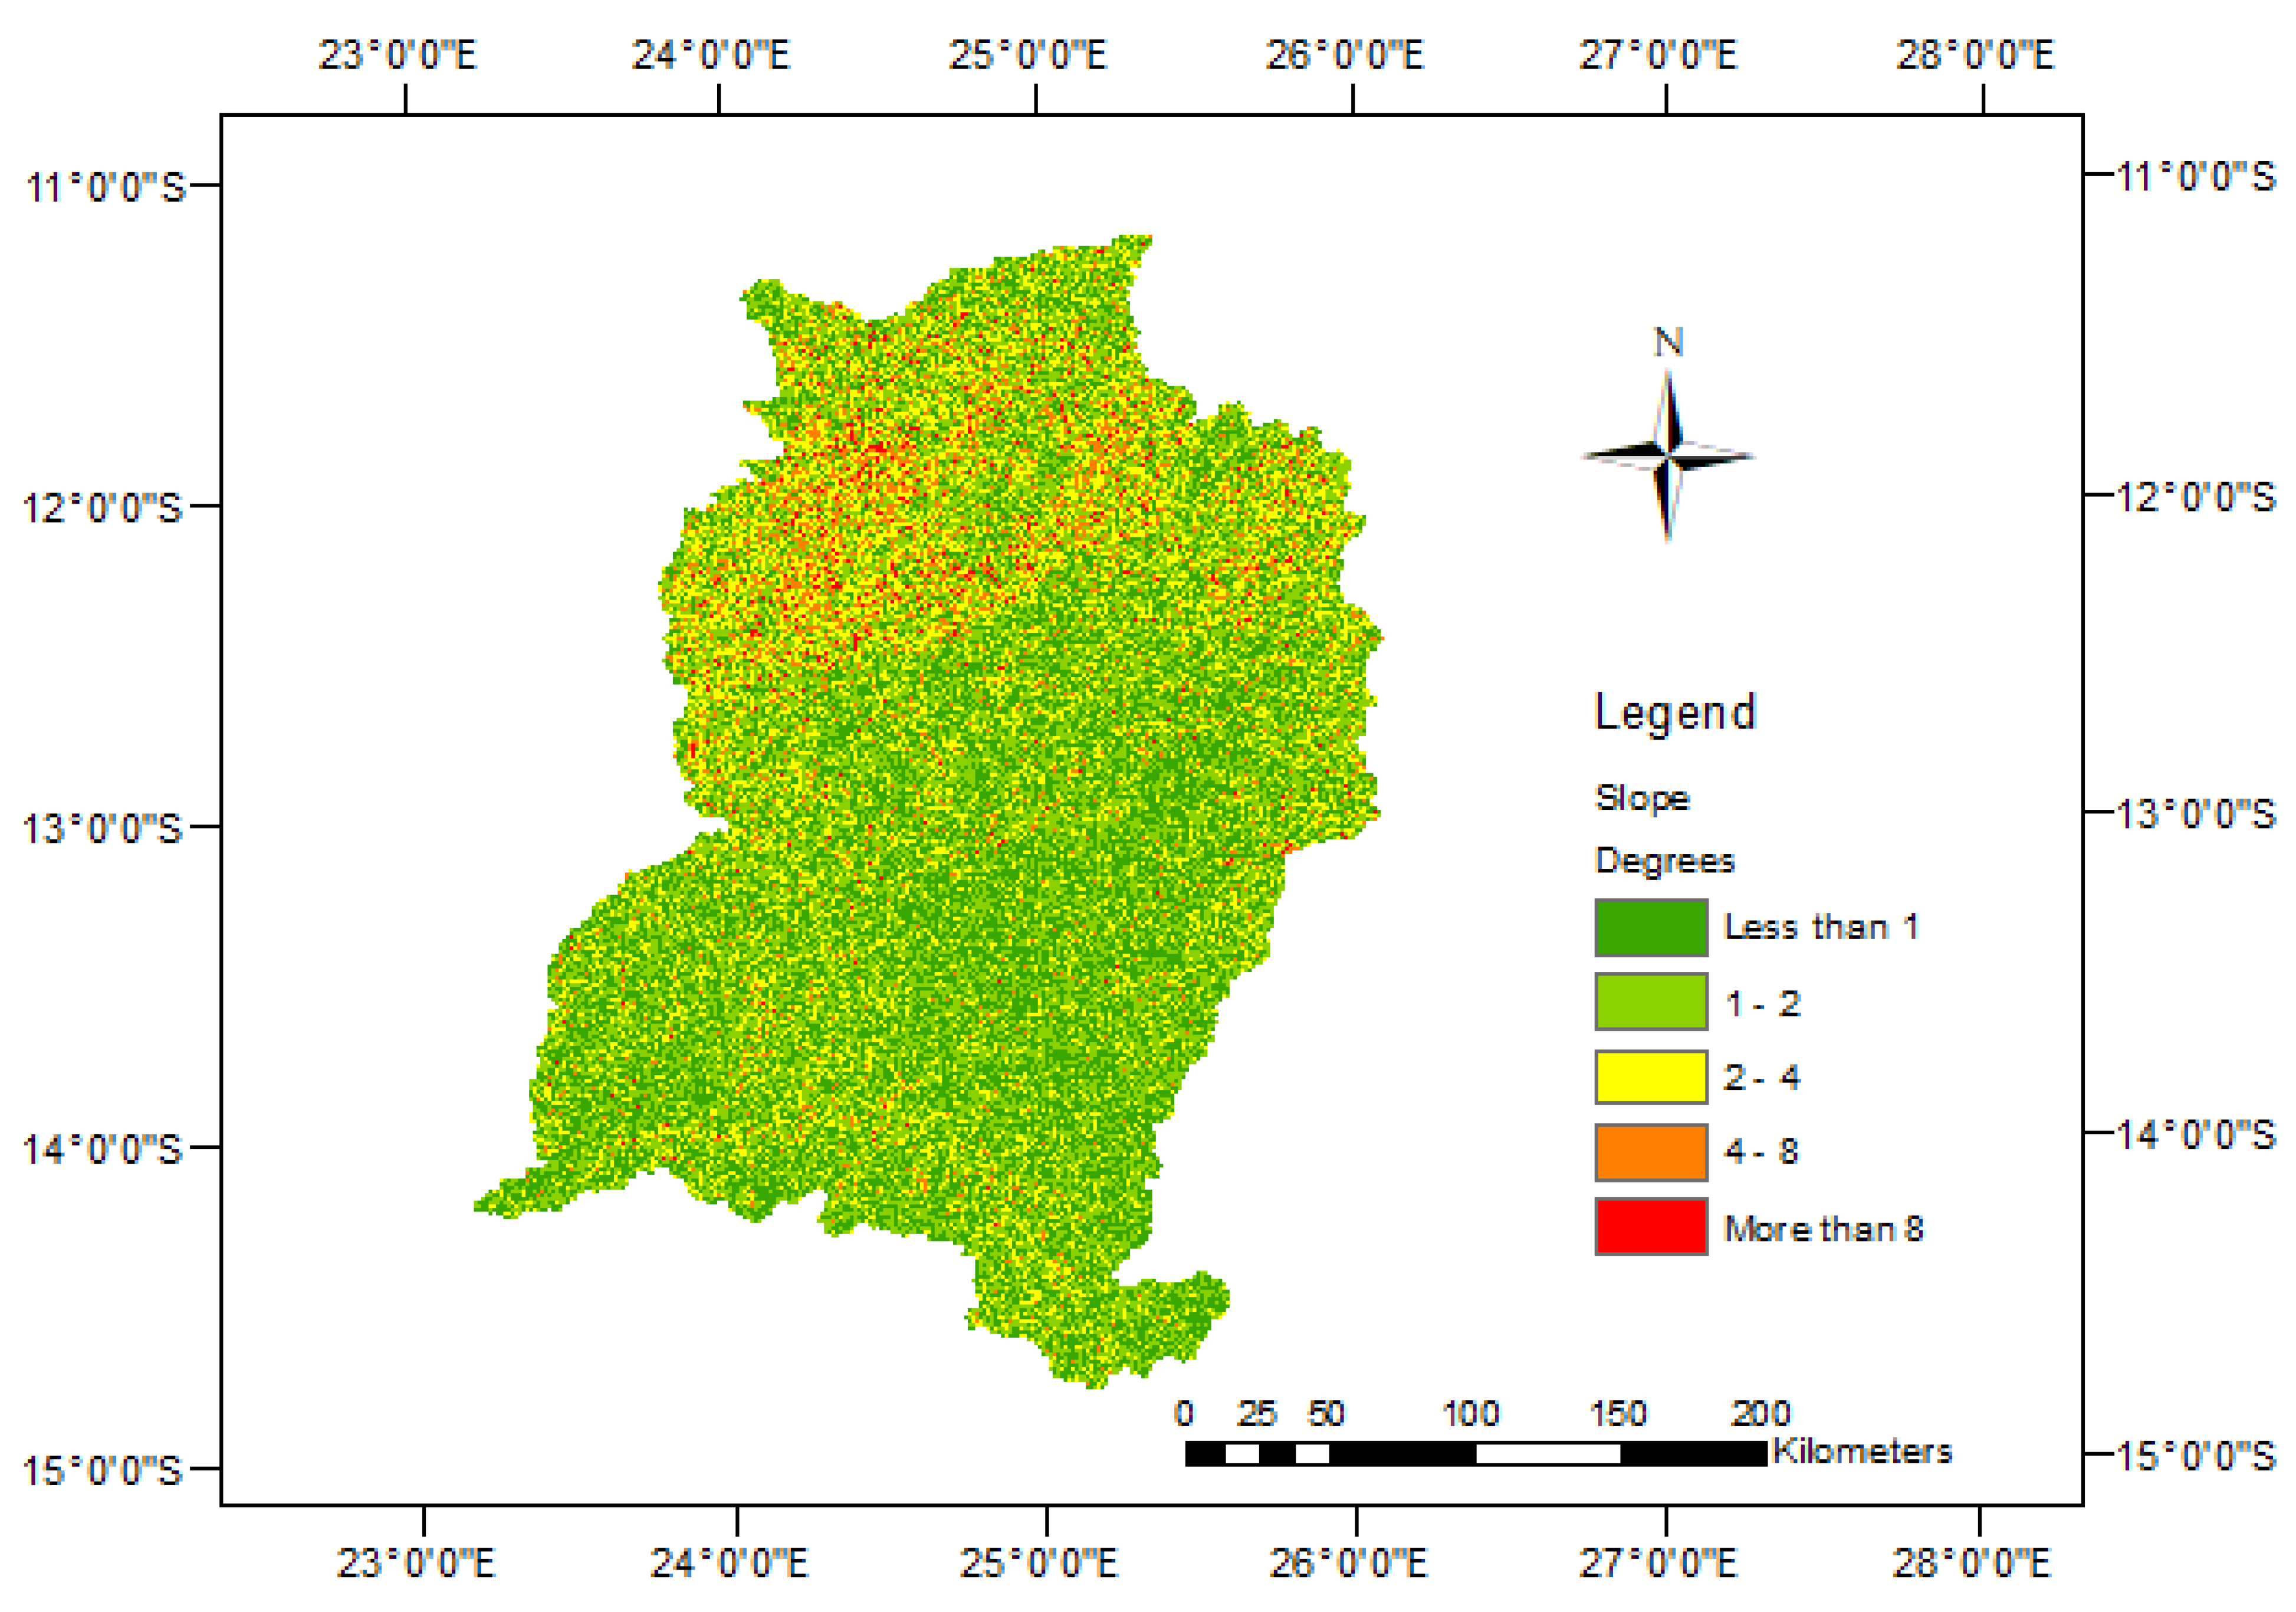
A lineament is a simple or complex linear feature of a surface that can be drawn. Its components are aligned in a rectilinear or slightly curvilinear correlation, which varies from the configuration of adjacent features and apparently characterises a subsurface occurrence [7,41]. Geological lineaments are mostly presented as faults and joints that are deemed ducts for granitic intrusions [41]. Typically, a lineament will appear as a fault-aligned valley, a series of fault or fold-aligned hills, a straight coastline or indeed a combination of these features. Lineaments are hydro-geological factors which provide pathways for groundwater movement [7,42]. They are also used in the exploration of minerals and location of weathered zones from lineament density map which is usually applied in soil erosion investigations [5]. The lineament density in this study was calculated using Equation (3).
L d = i = 1 i = n L i A
where, i = 1 i = n L i denotes the total length of lineaments (L) and A denotes the unit area (L2). A high lineament length density indicates high secondary porosity, thus indicating a zone with high groundwater potential [43].
Areas with high lineament density indicate a permeable zone, which reveals good groundwater potential. Very high lineament density is indicative of good groundwater potential whereas areas with very low lineament density indicate poor groundwater potential. The lineament map was created from DEM and the faults structure from the geological map and categorised into lineament density with classes ranging from 0.00–0.04 for very poor; 0.04–0.09 for poor; 0.09–0.13 for moderate, 0.13–0.18 for good and 0.18–0.22 for very good. Figure 5 illustrates the lineament density for Kabompo catchment.

3.4. Slope

The gradient of any given land directly influences the infiltration rate of precipitation and/or surface water. The steeper the ground the less the infiltration and the flatter the ground the more the infiltration. Slope also influences the velocity of the runoff, which may lead to soil erosion. Gentle to flat slopes are very important for groundwater recharge.
The slope may also indicate a general flow direction of groundwater. In order to assess the potential for groundwater recharge, the catchment area was classified into five slopes: less than 1o for very good; 1–2° for good, 2–4° for moderate, 4–8° for poor, and above 8° for very poor ground water potential. The catchment is generally flat with gentle to undulating slopes in some parts. Figure 6 illustrates the catchment slope in degrees.

3.5. Soils

The physical characteristics of soils, such as structure and texture, play a significant role in groundwater recharge. Therefore, it needs to be identified and classified according to texture in order to determine their infiltration rate. The soils with fine texture tend to have higher runoff rates and less infiltration. The KC is predominantly Kalahari sand, which has higher infiltration rates.
The soils were categorised according to infiltrations rates, which included: loose sand soils for very good infiltration rate, fine loamy soils for good infiltration rate, gravelly to clayey soils for moderate infiltration rate, fine loamy to clayey soils for poor infiltration rate, and clayey soils with high clay/silt ratio for very poor infiltration rate. The catchment is predominantly underlain by loose sand soils followed by fine loamy soils which have higher infiltration rates and therefore leads to better potential for groundwater. Figure 7 illustrates the soil distribution across the catchment.

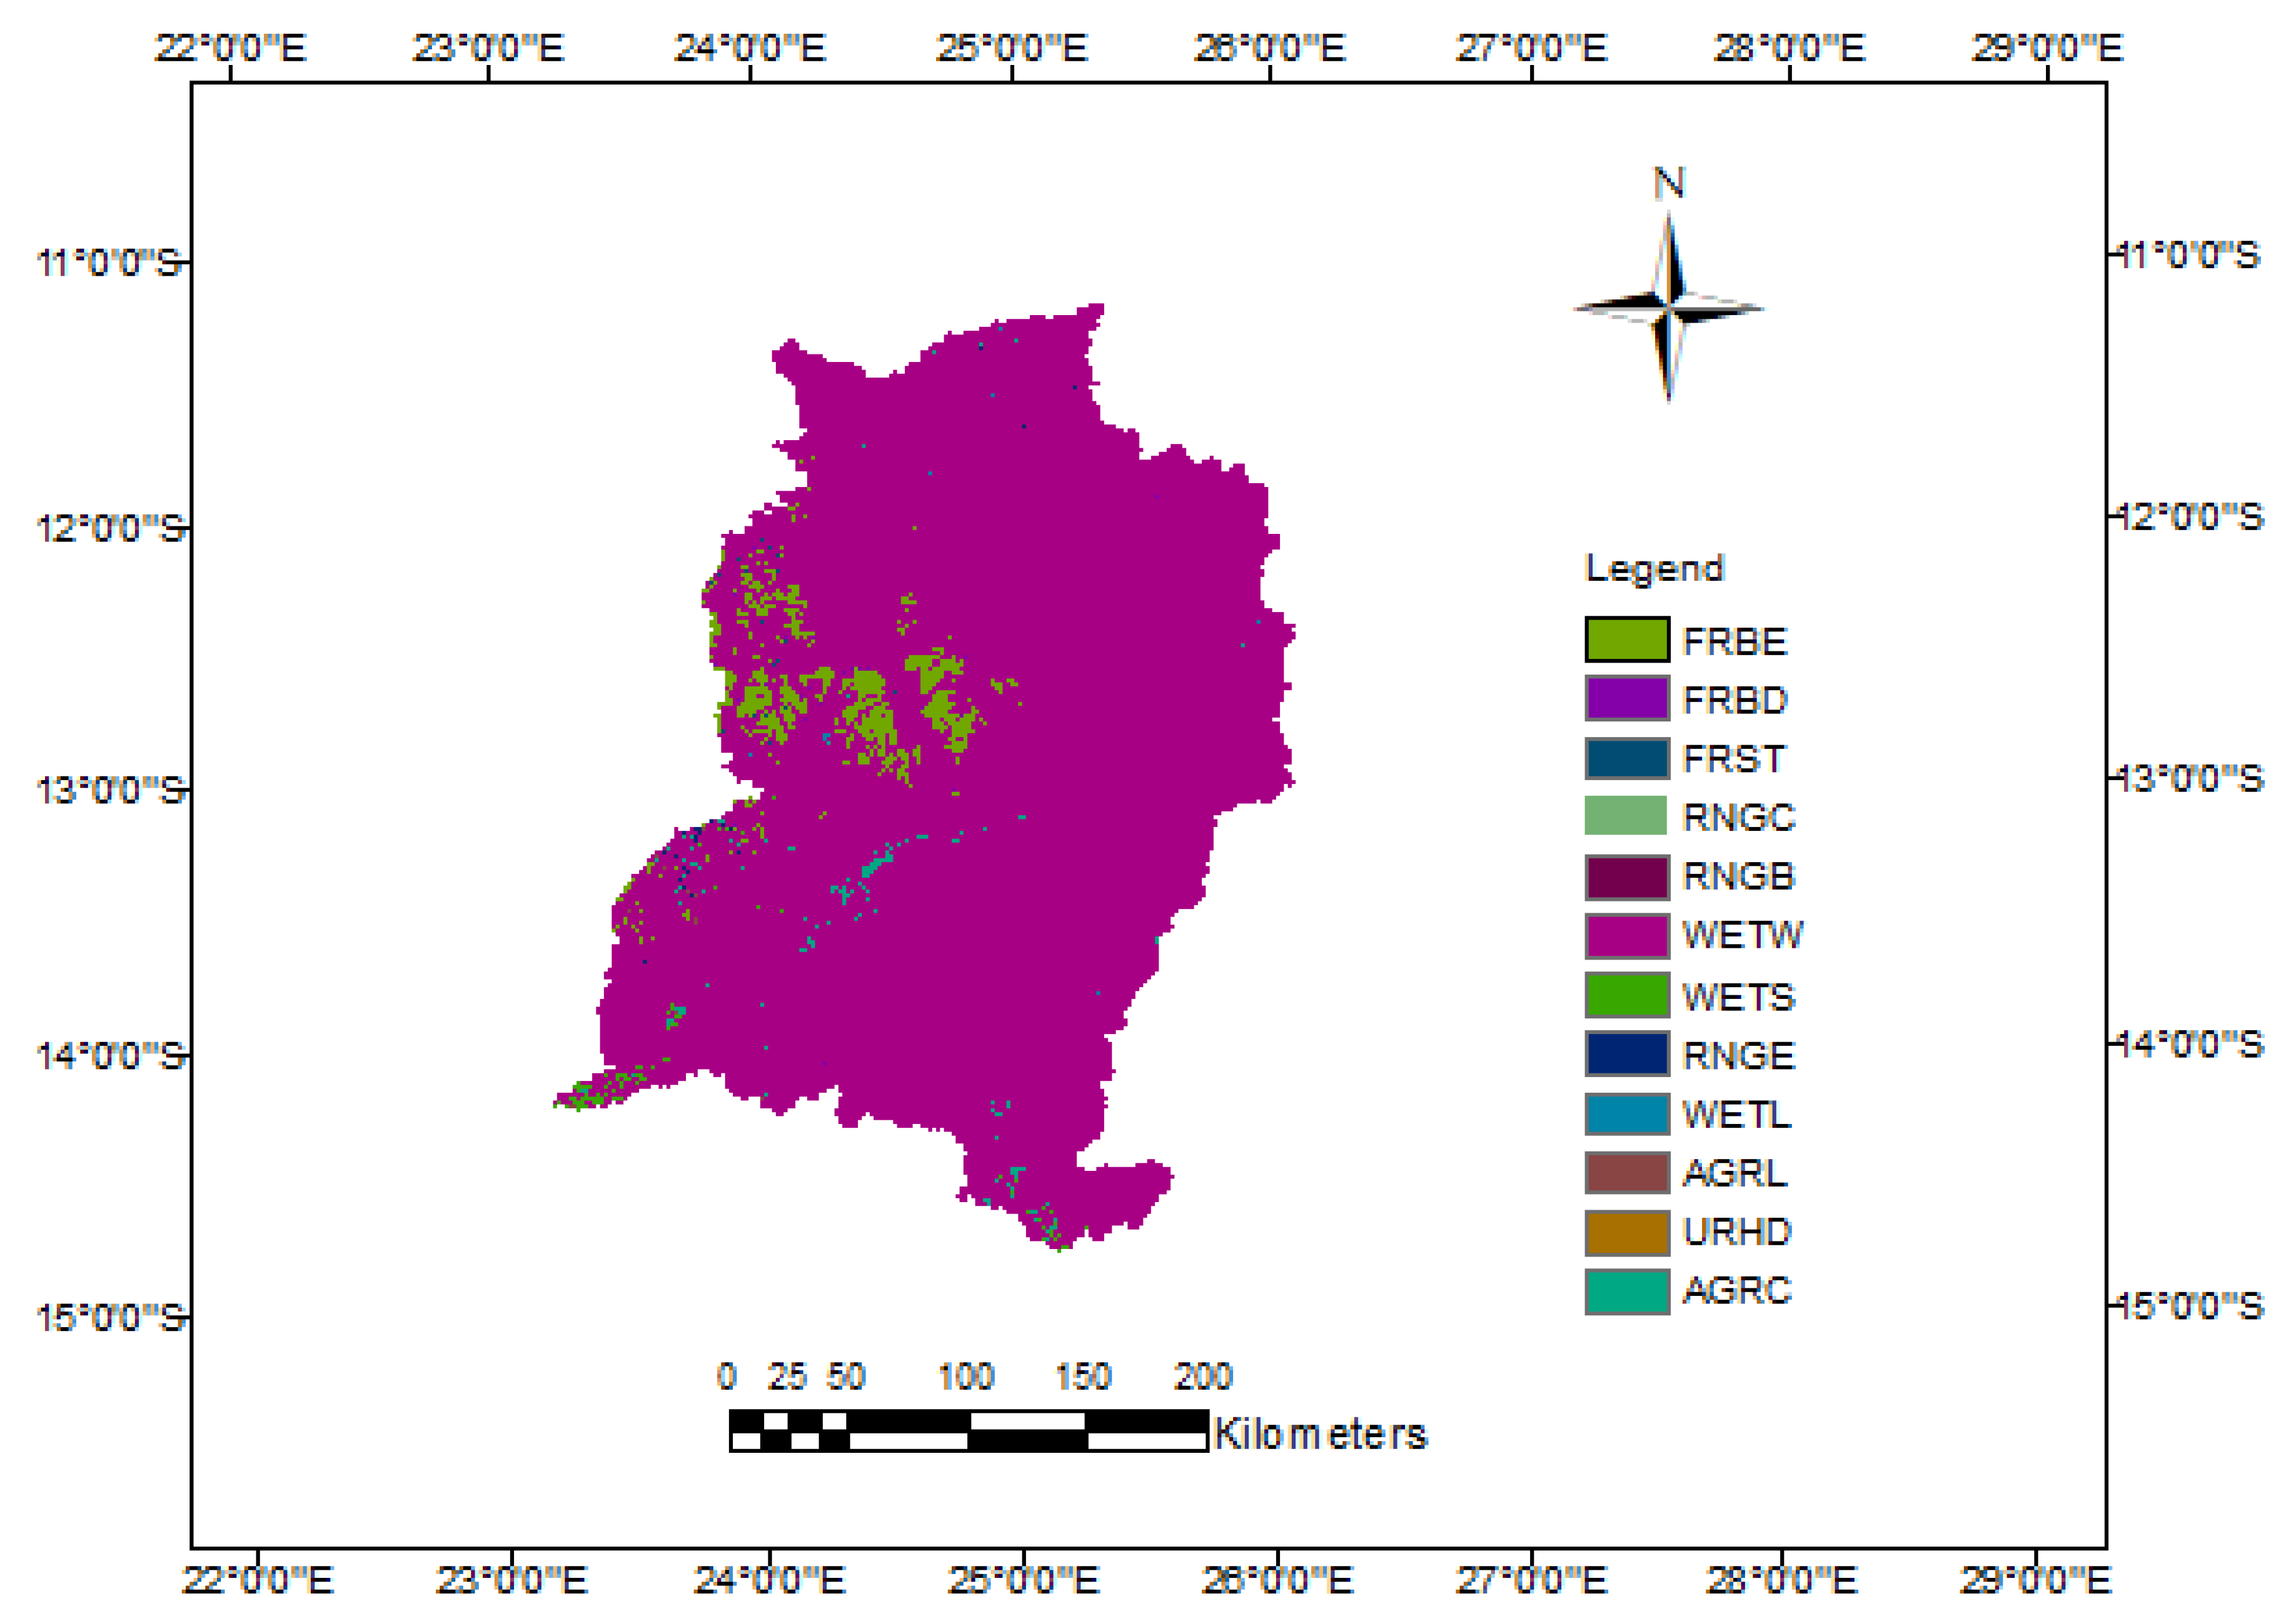
3.6. Land Use/Land Cover

The land use/land cover type can either increase or decrease infiltration. Urbanised areas have lower infiltration rates than vegetated areas. It is for this reason that classifying land use becomes important. The catchment area was classified into five major land use/land cover classes based on the infiltration capacity. The classes include: urbanised areas for very poor infiltration; range brush, mixed forest for poor infiltration; closed shrub land, ever green broadleaf forest, range grasses, woody savannahs, savannahs; for moderate infiltration; agricultural land-generic, for good infiltration; mixed wetlands, for very good infiltration. Figure 8 illustrates the catchment land use/land cover.

3.7. Precipitation

Groundwater principally comes from precipitation and therefore good rainfall can lead to good groundwater recharge while less rainfall may also mean limited recharge. Precipitation is therefore an important factor in mapping groundwater potential zones [1]. Precipitation was estimated using the arithmetic mean as shown in the Equation (4).
P = p 1 + p 2 + p 3 . p n N
where P is the average depth of precipitation of the area, P1, P2, P3 and Pn are rainfall data at weather stations 1, 2, 3, and N is the number of weather stations.
A precipitation map was created from observed historical rainfall data for 32 years (1982–2013) from the five most influential meteorological stations within the catchment, using inverse distance weighted (IDW) method in the GIS environment. The monthly rainfall was further categorised into classes of amounts received per year as follows: 900–950 for very poor; 950–1000 for poor; 1000–1100 for moderate; 1100–1150 for good and 1150–1250 for very good. The map in Figure 9 clearly shows that more rainfall is received in the northern part of the catchment than the southern parts.

3.8. Ranking of Influencing Factors Using Analytical Hierarchy Process

The identified parameters with influence on the basin were ranked according to their importance in Analytic Hierarchy Process (AHP). The AHP is a tool that has been widely used in the assessment of groundwater influencing factors [12,14]. The introduced AHP tool, deals with complicated decisions in groundwater assessments and other related fields [44,45]. Table 1 illustrates the criteria for assignment of scales during a pair-wise comparison.
Comparisons were conducted in pairs based on the criteria in Table 2 for seven thematic layers and the weight for each parameter was determined. Consistency Ratio (CR) was used to estimate the accuracy of the matrix and in this study, it was calculated to be 0.08, which is well within the recommendations [30]. The CR values obtained using the AHP were tabulated (Table 2).
The seven thematic layers with normalized weights were determined by the AHP based on the degree of influence on groundwater potential. Precipitation was analysed with a higher weight, followed by lithology, lineament density, land use/land cover, drainage density, soil, and finally slope. The thematic layers were further subdivided into five classes, each based on the scale factor in AHP, which ranged from 1, for very poor to 5, for very good. Table 3 illustrates the thematic layers with rankings and normalised weights.

3.9. Weighted Overlay Operation

The information in Table 3 was used for reclassification in GIS in order to standardise all the thematic layers as a preparation for weighted overlay. The reclassification was conducted for slope, drainage density, lineament density and precipitation while land use/land cover, soil and lithology thematic maps were already classified. After reclassification, all the thematic maps were arranged, and a weighted overlay analysis, based on groundwater potential index, was performed in GIS to determine the groundwater potential of the catchment [28,46]. The groundwater potential index (GwPI) was calculated using Equation (5) proposed by [47].
G w P I = j = 1   m i = 1 n ( W j   * X i )
where, GwPI is the groundwater potential index, Wj is the normalised weight of the j thematic layer, Xi is the rank number (values) of each class with respect to the j layer, m is the total number of thematic layers, and n is the total number of ranks in a thematic layer. Figure 10 illustrates the groundwater water potential of the Kabompo catchment.
Figure 10 shows that much of the northern part of the KC has good potential for groundwater while the southern part has some areas with poor potential. The northern part of the catchment is also characterised by high annual rainfalls, lower drainage density and higher lineament density. In general, the basin is predominately characterised with moderate to good potential for groundwater giving hope for conjunctive water management involving domestic water supply, environmental water requirement, irrigated agriculture, and fish farming. The groundwater potential variability across the catchment was further analysed into coverage areas to highlight risk and uncertainty. Table 4 shows these coverage areas.

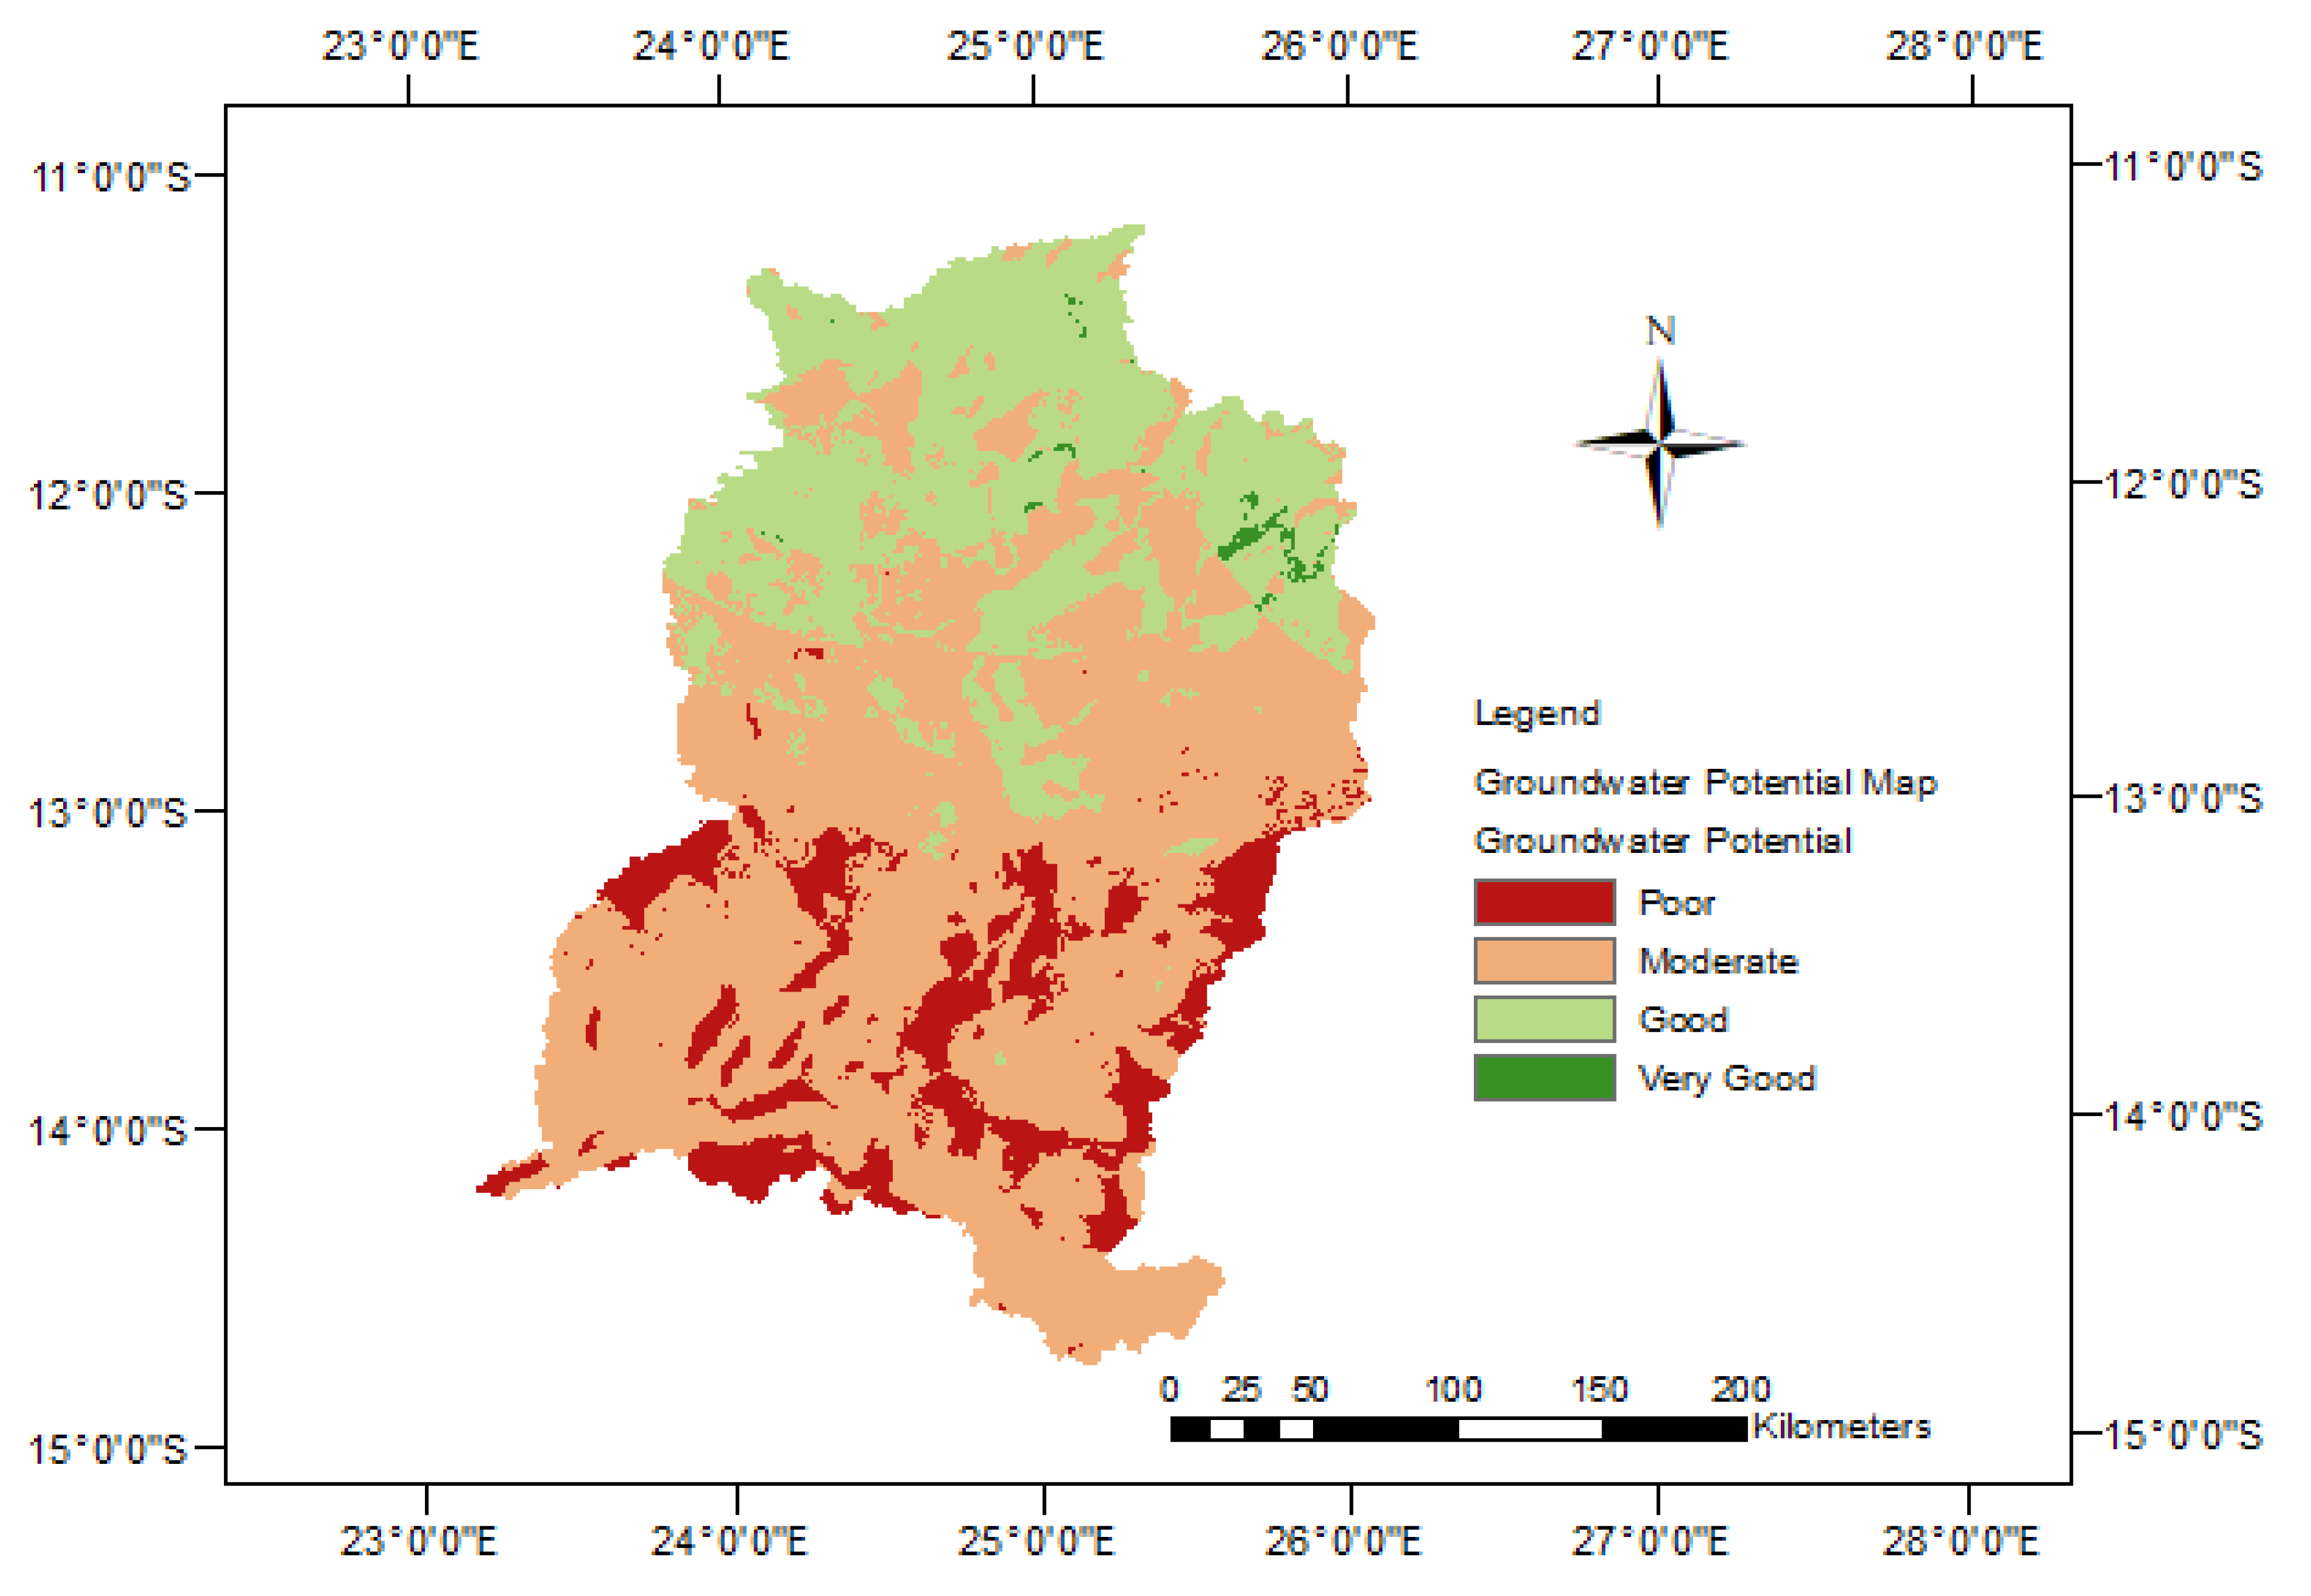
3.10. Validation of the Groundwater Potential Map

The groundwater potential map was validated using ground truthing data obtained from Department of Water Resources Development (DWRM) north-western province of Zambia. The data used were existing boreholes across the basin drilled between 1970 and 2016. The boreholes are mostly used for domestic purposes in the rural population and Central Business Districts (CBD) of Mufumbwe, Manyinga and Lumwana districts. According to the Department, about 75% of the boreholes may be functional while 25% are considered non-functional.
Most of the borehole yield ranged from 0.5 to 1 ℓ/s while some high-yielding boreholes for domestic use have 1–5 ℓ/s. These are non-commercial boreholes with 100 mm diameter and depth ranging from 20 to 60 m. Commercial boreholes have diameters equal to or greater than 150 mm and depth ranges from 30 to 100 m. The total number of 980 boreholes across the basin were overlaid on the Groundwater Potential Map to validate the delineated potential zones. The results revealed that 89% of the boreholes were found on the moderate to very good potential zones for groundwater. Figure 10 illustrates the validation of the groundwater potential.
The boreholes were selected from all areas of the catchment that included Maheba refugee camp, Lumwana mine area, Kalumbira mine area, Mufumbwe, Mwinilunga, and Kabompo districts. The light sky-blue dots on Figure 11 show high yielding boreholes estimated between 7.2 and 18 m3/h, which corresponds to good potential for groundwater.

4. Discussion

The results have shown that the catchment has moderate to very good potential for groundwater, which is why the existing boreholes are found on most parts of the catchment. These results are in agreement with previous studies that analysed the aquifer productivity on the north-western part of Zambia (where the basin is located) to be low to moderate and high in some parts. The aquifer was identified to be unconsolidated in some areas, while other areas a sedimentary fracture with high aquifer productivity [48]. The distribution of boreholes on the zones is shown in Table 5.
Table 5 shows that 89% of the existing boreholes are found on the moderate potential zone, followed by good potential zone, and very good potential zones, which are delineated to be suitable. The results show that boreholes can be drilled at nearly any location within the catchment with a very high success rate. It is noted that even in poor groundwater potential zones, boreholes have been drilled except that the yield has been estimated to be less than 1.8 m3/h.
However, a few challenges were encountered during validation as most of existing boreholes did not have borehole yield data, due to some missing information and in cases where the yield was provided, it was as old as the borehole (no update has been conducted).
The high-yielding boreholes in Figure 11 have correlated well with the delineated groundwater potential zones. The use of borehole data, such as total number per zone and yield to validate the delineated groundwater potential, has also been widely used in many previous studies for groundwater potential assessment [10,12,13,14]. The pattern of the existing boreholes follows the human settlement, which is mostly along the roads other than the geological formation. It is, however, found that the settlements are predominantly located on moderate to good groundwater potential zones. This is an indication that the local people were also using their indigenous knowledge for prospecting groundwater before settlement.
The fact that the catchment is predominantly moderate potential for groundwater confirms the findings of the previous studies that analysed the overall groundwater potential for the Zambezi River Basin to be moderate to low and occasionally high especially in alluvium aquifers along the major river channels and karst aquifers with high secondary porosity [27].
The study area is predominantly underlain with fossil seif dunes and shale silt sandstone, followed by mine series undifferentiated, undifferentiated granite gneiss, carbonate rocks, basal conglomerate which are good aquifers. The findings are in agreement with previous studies that analysed the kahalahari of Zambezi River Basin to have sediments composed mainly of conglomerates, gravels, clays, sandstones and unconsolidated sands [39]. The groundwater potential map also demonstrates that drilling of boreholes and construction of shallow hand-dug wells in the catchment may be successfully conducted without any special geophysical investigations or surveys (terrameters, resistivity meters, magnetometers etc.) provided that the map be utilised for guidance purpose.
The use of geospatial techniques for the assessment of groundwater potential has been proved as a useful model that may be replicated in Southern Africa and other parts of the world, providing easy and reliable results. Similar previous studies found the use of GIS and Remote sensing model approach for groundwater assessments to be reliable and recommended its use in any semi-arid environment [11,12,14].
Therefore, the groundwater potential map presented in this study can be a useful tool for stakeholders to enhance integrated groundwater management and reduce risk and uncertainty.

5. Conclusions

The use of geospatial techniques for the integrated assessment of groundwater potential in KC has proved to be a novel approach that has generated new knowledge. The produced weighted groundwater potential map for the basin has four zones denoted as 0.4% (317 km2) for very good potential; 27% (19,170 km2) for good potential; 61% (43,961 km2) for moderate potential and 12% (8639 km2) for poor potential. Overall, the results have revealed that KC predominantly has moderate to very good groundwater potential zones as confirmed by 89% of the overlaid existing boreholes.
The groundwater potential map may be used as a cost-effective and alternative tool for groundwater assessments in rural and urban development processes. The map also shows that boreholes and hand-dug wells may be constructed on nearly any part of the catchment with good success rate and minimal challenges. The application of the groundwater potential map, produced in this study, coupled with indigenous knowledge, may contribute towards sustainable use and management of groundwater in the area. The research results have created a baseline for future research on impacts of climate change on groundwater resources and analyses of the risks and uncertainties.

Author Contributions

Conceptualization, G.Z.N., Y.E.W.; methodology, G.Z.N., Y.E.W.; software, G.Z.N.; validation, G.Z.N., Y.E.W.; formal analysis, G.Z.N., Y.E.W.; investigation, G.Z.N., Y.E.W.; writing original draft preparation, G.Z.N.; writing review and editing, Y.E.W.; visualization, G.Z.N. All authors have read and agreed to the published version of the manuscript.

Funding

This research received no external funding.

Acknowledgments

The Meteorological data used were obtained from the Zambia Meteorological Department (ZMD) while the borehole data was sourced from Department of Water Resources Development, North-western Province under the Ministry of Water Development, Water Supply, Sanitation and Environmental Protection of the Republic of Zambia.

Conflicts of Interest

The authors declare no conflict of interest.

References

  1. Tolche, A.D. Groundwater potential mapping using geospatial techniques: A case study of Dhungeta-Ramis sub-basin, Ethiopia. Geol. Ecol. Landscapes 2020, 5, 65–80. [Google Scholar] [CrossRef]
  2. Arnell, N.W.; Halliday, S.J.; Battarbee, R.W.; Skeffington, R.A.; Wade, A.J.; Fung, F.; Orr, H.G.; Charlton, M.B. The implications of climate change for the water environment in England. Prog. Phys. Geogr. Earth Environ. 2015, 39, 93–120. [Google Scholar] [CrossRef] [Green Version]
  3. Kusangaya, S.; Warburton, M.L.; van Garderen, E.A.; Jewitt, G. Impacts of climate change on water resources in southern Africa: A review. Phys. Chem. Earth, Parts A/B/C 2014, 67–69, 47–54. [Google Scholar] [CrossRef]
  4. Chien, H.; Yeh, P.J.-F.; Knouft, J.H. Modeling the potential impacts of climate change on streamflow in agricultural watersheds of the Midwestern United States. J. Hydrol. 2013, 491, 73–88. [Google Scholar] [CrossRef]
  5. Naomi Carrard, Tim Foster and Juliet Willetts Groundwater as a Source of Drinking Water in Southeast Asia and the Pacific: A Multi-Country Review of Current Reliance and Resource Concerns. Water 2019, 11, 1605. [CrossRef] [Green Version]
  6. Hosseinifard, S.J.; Aminiyan, M.M. Hydrochemical Characterization of Groundwater Quality for Drinking and Agricultural Purposes: A Case Study in Rafsanjan Plain, Iran. Water Qual. Expo. Heal. 2015, 7, 531–544. [Google Scholar] [CrossRef] [Green Version]
  7. Ghosh, P.K.; Bandyopadhyay, S.; Jana, N.C. Mapping of groundwater potential zones in hard rock terrain using geoinformatics: A case of Kumari watershed in western part of West Bengal. Model. Earth Syst. Environ. 2015, 2, 1. [Google Scholar] [CrossRef]
  8. Waikar, M.L.; Nilawar, A.P. Identification of Groundwater Potential Zone Using Remote Sensing and GIS Technique. IJIRSET 2015, 3, 12163–12174. [Google Scholar]
  9. Kumar, R.; Dwivedi, S.B.; Gaur, S. A comparative study of machine learning and Fuzzy-AHP technique to groundwater potential mapping in the data-scarce region. Comput. Geosci. 2021, 155, 104855. [Google Scholar] [CrossRef]
  10. Mallick, J.; Khan, R.A.; Ahmed, M.; Alqadhi, S.D.; Alsubih, M.; Falqi, I.; Hasan, M.A. Modeling Groundwater Potential Zone in a Semi-Arid Region of Aseer Using Fuzzy-AHP and Geoinformation Techniques. Water 2019, 11, 2656. [Google Scholar] [CrossRef] [Green Version]
  11. Owolabi, S.T.; Madi, K.; Kalumba, A.M.; Orimoloye, I.R. A groundwater potential zone mapping approach for semi-arid environments using remote sensing (RS), geographic information system (GIS), and analytical hierarchical process (AHP) techniques: A case study of Buffalo catchment, Eastern Cape, South Africa. Arab. J. Geosci. 2020, 13, 1184. [Google Scholar] [CrossRef]
  12. Murmu, P.; Kumar, M.; Lal, D.; Sonker, I.; Singh, S.K. Delineation of groundwater potential zones using geospatial techniques and analytical hierarchy process in Dumka district, Jharkhand, India. Groundw. Sustain. Dev. 2019, 9, 100239. [Google Scholar] [CrossRef]
  13. Hussein, A.-A.; Govindu, V.; Nigusse, A.G.M. Evaluation of groundwater potential using geospatial techniques. Appl. Water Sci. 2016, 7, 2447–2461. [Google Scholar] [CrossRef] [Green Version]
  14. Arulbalaji, P.; Padmalal, D.; Sreelash, K. GIS and AHP Techniques Based Delineation of Groundwater Potential Zones: A case study from Southern Western Ghats, India. Sci. Rep. 2019, 9, 2082. [Google Scholar] [CrossRef] [PubMed]
  15. Song, Y.; Thatcher, D.; Li, Q.; McHugh, T.; Wu, P. Developing sustainable road infrastructure performance in-dicators using a model-driven fuzzy spatial multi-criteria decision making method. Renew. Sustain. Energy Rev. 2021, 138, 110538. [Google Scholar] [CrossRef]
  16. Costache, R.; Pham, Q.B.; Sharifi, E.; Linh, N.T.T.; Abba, S.I.; Vojtek, M.; Vojteková, J.; Nhi, P.T.T.; Khoi, D.N. Flash-flood suscepti-bility assessment using multi-criteria decision making and machine learning supported by remote sensing and GIS techniques. Remote Sens. 2020, 12, 106. [Google Scholar] [CrossRef] [Green Version]
  17. Winsemius, H.C.; Savenije, H.H.G.; Gerrits, A.M.J.; Zapreeva, E.A.; Klees, R. Comparison of Two Model Ap-proaches in the Zambezi River Basin with Regard to Model Reliability and Identifiability. Hydrol. Earth Syst. Sci. Discuss. 2005, 2, 2625–2661. [Google Scholar] [CrossRef] [Green Version]
  18. Hughes, D. Comparison of satellite rainfall data with observations from gauging station networks. J. Hydrol. 2006, 327, 399–410. [Google Scholar] [CrossRef]
  19. Hamududu, B.H. Impacts of Climate Change on Water Resources and Hydropower Systems in Central and Southern Africa; Norwegian University of Science and Technology: Trondheim, Norway, 2012; Available online: http://hdl.handle.net/11250/242354 (accessed on 12 August 2021).
  20. Ndhlovu, G.; Woyessa, Y. Modelling impact of climate change on catchment water balance, Kabompo River in Zambezi River Basin. J. Hydrol. Reg. Stud. 2019, 27, 100650. [Google Scholar] [CrossRef]
  21. Ndhlovu, G.; Woyessa, Y. Use of gridded climate data for hydrological modelling in the Zambezi River Basin, Southern Africa. J. Hydrol. 2021, 602, 126749. [Google Scholar] [CrossRef]
  22. Beilfuss, R. A Risky Climate for Southern African Hydro. International Rivers, Berkely, 2012, no. September: 1–46. Available online: http://climenews.com/letoltes/zambezi_climate_report_final.pdf (accessed on 18 February 2020).
  23. Zeng, H.; Wu, B.; Zhang, N.; Tian, F.; Phiri, E.; Musakwa, W.; Zhang, M.; Zhu, L.; Mashonjowa, E. Spatiotemporal Analysis of Precipitation in the Sparsely Gauged Zambezi River Ba-sin Using Remote Sensing and Google Earth Engine. Remote Sens. 2019, 11, 2977. [Google Scholar] [CrossRef] [Green Version]
  24. Yamba, F.D.; Walimwipi, H.; Jain, S.; Zhou, P.; Cuamba, B.; Mzezewa, C. Climate change/variability implications on hydroelectricity generation in the Zambezi River Basin. Mitig. Adapt. Strat. Glob. Chang. 2011, 16, 617–628. [Google Scholar] [CrossRef] [Green Version]
  25. Friedl, M.; Sulla-Menashe, D. MCD12Q1 MODIS/Terra+Aqua Land Cover Type Yearly L3 Global 500m SIN Grid V006 [Data set]. NASA EOSDIS Land Processes DAAC. Available online: https://lpdaac.usgs.gov/products/mcd12q1v006/ (accessed on 12 August 2019). [CrossRef]
  26. Pérez-Lapeña, B.; Saimone, F.; Juízo, D. Mapping groundwater availability and adequacy in the Lower Zambezi River basin. Proc. Int. Assoc. Hydrol. Sci. 2018, 378, 37–42. [Google Scholar] [CrossRef] [Green Version]
  27. Euroconsult Mott Macdonald. Rapid Assessment—Final Report Integrated Water Resources Management pre-sented to Southern African Development Community (SADC), Lusaka. 2007. Available online: http://zambezicommission.org/sites/default/files/publication_downloads/rapid-assessment.pdf (accessed on 10 August 2020).
  28. Andualem, T.G.; Demeke, G.G. Groundwater potential assessment using GIS and remote sensing: A case study of Guna tana landscape, upper blue Nile Basin, Ethiopia. J. Hydrol. Reg. Stud. 2019, 24, 100610. [Google Scholar] [CrossRef]
  29. Jha, M.K.; Chowdary, V.M.; Chowdhury, A. Groundwater assessment in Salboni Block, West Bengal (India) using remote sensing, geographical information system and multi-criteria decision analysis techniques. Hydrogeol. J. 2010, 18, 1713–1728. [Google Scholar] [CrossRef]
  30. Saaty, T.L. How to make a decision: The analytic hierarchy process. Eur. J. Oper. Res. 1990, 48, 9–26. Available online: https://www.sciencedirect.com/science/article/pii/037722179090057I (accessed on 30 April 2020). [CrossRef]
  31. Basavarajappa, H.T.; Dinakar, S.; Manjunatha, M.C. Validation of Derived Groundwater Potential Zones (Gwpz) Using Geoinformatics and Actual Yield From Well Points in Parts of Upper Cauvery Basin of Mysuru and Chamarajanagara Districts, Karntaka, India. Int. J. Civ. Eng. Technol. (IJCIET) 2016, 7, 141–161. Available online: http://www.iaeme.com/IJCIET/issues.asp?JType=IJCIET&VType=7&IType=1 (accessed on 12 August 2021).
  32. Ojo, J.S.; Olorunfemi, M.O.; Akintorinwa, O.J.; Bayode, S.; Omosuyi, G.O.; Akinluyi, F.O. GIS Integrated Geomorphological, Geological and Geoelectrical Assessment of the Groundwater Potential of Akure Metropolis, Southwest Nigeria. J. Earth Sci. Geotech.Eng. 2015, 5, 85–101, ISSN: 1792-9040 (print), 1792–9660 (online). Available online: https://www.researchgate.net/publication/288060491 (accessed on 12 August 2021).
  33. Rukundo, E.; Doğan, A. Dominant Influencing Factors of Groundwater Recharge Spatial Patterns in Ergene River Catchment, Turkey. Water 2019, 11, 653. [Google Scholar] [CrossRef] [Green Version]
  34. Earle, S. Physical Geology, 2nd ed.; BCcampus: Victoria, BC, Canada, 2019; Available online: https://opentextbc.ca/physicalgeology2ed/ (accessed on 12 August 2021).
  35. Yeh, H.-F.; Cheng, Y.-S.; Lin, H.-I.; Lee, C.-H. Mapping groundwater recharge potential zone using a GIS approach in Hualian River, Taiwan. Sustain. Environ. Res. 2016, 26, 33–43. [Google Scholar] [CrossRef] [Green Version]
  36. U.S. Army Corps of Engineers. Washington, DC 20314-1000, Engineering and Design, Groundwater Hydrology. Manual No. 1110-2-1421. 1999. Available online: https://www.samsamwater.com/library/Groundwater_Hydrology.pdf (accessed on 10 September 2021).
  37. Atangana, A. Fractional Operators with Constant and Variable Order with Application to Geo-Hydrology; Elsevier: Amsterdam, The Netherlands, 2018. [Google Scholar] [CrossRef]
  38. JICA & MEWD. JICA 1995 Final Report Water Resources Master Plan-Zambia.Pdf. 1995. Available online: https://openjicareport.jica.go.jp/pdf/11251659_01.pdf (accessed on 23 January 2020).
  39. Bäumle, R.; Himmelsbach, T.; Noell, U. Hydrogeology and geochemistry of a tectonically controlled, deep-seated and semi-fossil aquifer in the Zambezi Region (Namibia). Hydrogeol. J. 2018, 27, 885–914. [Google Scholar] [CrossRef] [Green Version]
  40. Prasad, R.K.; Mondal, N.; Banerjee, P.; Nandakumar, M.V.; Singh, V.S. Deciphering potential groundwater zone in hard rock through the application of GIS. Environ. Earth Sci. 2007, 55, 467–475. [Google Scholar] [CrossRef]
  41. Chikambwe, E.M. GIS-Based Predictive Mapping for Aquamarine-Bearing Pegmatites, Lundazi Area, Northeast Zambia. 2002. International Institute For Geo-Information Science and Earth Observation, University of Twenty, Enschede, The Netherlands. Available online: https://webapps.itc.utwente.nl/librarywww/papers/msc_2002/ereg/chikambwe.pdf (accessed on 30 April 2021).
  42. Magesh, N.; Chandrasekar, N.; Soundranayagam, J.P. Delineation of groundwater potential zones in Theni district, Tamil Nadu, using remote sensing, GIS and MIF techniques. Geosci. Front. 2012, 3, 189–196. [Google Scholar] [CrossRef] [Green Version]
  43. Greenbaum, D. Review of Remote Sensing Applications to Groundwater Exploration in Basement and Regolith; British Geological Survey: Nottingham, UK, 1985; 63p, (WC/OG/85/001). [Google Scholar]
  44. Saaty, T.L.; Vargas, L.G. The Analytic Hierarchy Process: Planning and Risk. 1991, An overview of the analytic hierarchy process and its applications. Eur. J. Oper. Res. 1990, 48, 11–32. [Google Scholar] [CrossRef]
  45. Karayalcin, I. The analytic hierarchy process: Planning, priority setting, resource allocation: Thomas L. SAATY McGraw-Hill, New York, 1980, xiii + 287 pages. Eur. J. Oper. Res. 1982, 9, 97–98. [Google Scholar] [CrossRef]
  46. Rejith, R.G.; Anirudhan, S.; Sundararajan, M. Chapter 25—Delineation of Groundwater Potential Zones in Hard Rock Terrain Using Integrated Remote Sensing, GIS and MCDM Techniques: A Case Study From Vamanapuram River Basin, Kerala, India; Venkatramanan, S., Prasanna, M.V., Chung, S.Y., Eds.; GIS and Geostatistical Techniques for Groundwater Science; Elsevier: Amsterdam, The Netherlands, 2019; pp. 349–364. ISBN 9780128154137. Available online: https://www.sciencedirect.com/science/article/pii/B9780128154137000250 (accessed on 30 April 2021). [CrossRef]
  47. Malczewski, J. GIS and Multicriteria Decision Analysis; J. Wiley & Sons: New York, NY, USA, 1999; Available online: http://books.google.com/books?id=oJ8sAQAAMAAJ (accessed on 30 April 2021).
  48. Nkhuwa, D.C.W.; Kang’omba, S.; Chomba, K.C.; Crane, E.; Upton, K.; Ó Dochartaigh, B.É.; Bellwood-Howard, I. Africa Groundwater Atlas: Hydrogeology of Zambia. British Geological Survey. Accessed [date you accessed the information]. 2018. Available online: http://earthwise.bgs.ac.uk/index.php/Hydrogeology_of_Zambia (accessed on 19 August 2021).
Figure 1. Location of study area (http://cridf.net/RC/wp-content/uploads/2018/01/CRIDF-Map-Project-distibution-1.jpg (accessed on 18 September 2021)).
Water 13 02610 g001
Figure 2. Methodological approach.
Water 13 02610 g002
Figure 3. Lithology of the Kabompo Catchment.
Water 13 02610 g003
Figure 4. The drainage density of Kabompo catchment.
Water 13 02610 g004
Figure 5. Lineament density map of Kabompo catchment.
Water 13 02610 g005
Figure 6. The slopes of Kabompo catchment in degrees.
Water 13 02610 g006
Figure 7. Distribution of soil types in the Kabompo catchment.
Water 13 02610 g007
Figure 8. Land use/land cover for Kabompo catchment [21].
Water 13 02610 g008
Figure 9. Observed rainfall across the Kabompo catchment.
Water 13 02610 g009
Figure 10. Ground Water Potential Map of the Kabompo catchment.
Water 13 02610 g010
Figure 11. Groundwater points overlaid on groundwater potential map.
Water 13 02610 g011
Table 1. Pair-wise comparison criteria.
ImportanceDefinitionDescription
1Equal ImportanceTwo elements contribute equally to the objective
3Moderate importanceExperience and judgement slightly favour one element over another
5Strong ImportanceExperience and judgement strongly favour one element over another
7Very strong importanceOne element is favoured very strongly over another, its dominance is demonstrated in practice
9Extreme importanceThe evidence favouring one element over the other is of the highest possible order or affirmation
2, 4, 6 & 8 are normally used to express intermediate values.
Table 2. Pair-wise comparison matrix of seven thematic layers and their normalised weights.
FactorsRainfallLithologyLineament
Density
LULCDrainage
Density
SoilSlopeNormalized Weight (%)
Rainfall133555737
Lithology0.3313355724
Lineament density0.330.331335516
LULC0.20.330.33133510
Drainage density0.20.20.330.331336
Soil0.20.20.20.330.33134
Slope0.140.140.20.20.330.3313
Total2.45.28.0612.8617.6622.3331100
Table 3. Thematic layers with ranks and normalised weights.
ParameterClassGroundwater PotentialRankingNormalised
Weight (%)
Precipitation(mm/year) 37
1150–1250Very Good5
1050–1150Good4
1000–1050Moderate3
950–1000Poor2
900–950Very Poor1
LithologyLithological Unit 24
Alluv colluv lateritVery Good5
Basal conglomerateVery Good5
BasaltsVery Good5
Carbonate rocksGood4
Dolomite & argilliGood4
Fossil sief dunesGood4
Meta-carbonate rocksGood4
Meta-quartzitesModerate3
Mine Series undiffModerate3
Syenite syenodioriteModerate3
Upp Karoo undiffPoor2
psammite rudite formPoor2
shale silt sandstonePoor2
Undiff granite gneissVery poor1
Undiff schistsVery Poor1
GrainiteVery Poor1
Igneous meta-igneousVery Poor1
Lineament densityKm/Km2 16
0.18–0.22Very Good5
0.13–0.18Good4
0.09–0.13Moderate3
0.04–0.09Poor2
0.00–0.04Very Poor1
Land use/Land coverWetlands-MixedVery Good5 10
Agriculture Land-Close grownGood4
Agricultural Land-GenericGood4
Range-GrassesModerate3
SavannahsModerate3
Woody SavannahsModerate3
Closed Shrub-landsModerate3
Evergreen Broadleaf ForestModerate3
Range BrushPoor2
Forest-MixedPoor2
Deciduous Broadleaf ForestPoor2
Urban and Built-UpVery poor1
Drainage densitykm/km2 6
0–3Very Good5
3–7Good4
7–11Moderate3
11–15Poor2
15–18Very Poor1
SoilSoil Texture 4
Loose sandy soilsVery Good5
Fine loamy soilsGood4
Gravelly clayey soilsModerate3
Fine loamy to clayey soilsPoor2
Clayey soils with a high silt/ clay ratioVery Poor1
SlopeDegrees 3
0–1°Very Good5
1–2°Good4
2–4°Moderate3
4–8°Poor2
8–52°Very Poor1
Table 4. Ground water potential zonal areas.
Groundwater
Potential
Number
of Pixels
Sub Area
km2
Area
(%)
Comments
Poor5203863912Has low potential for ground water
Moderate26,47643,96161Has sufficient potential for ground water
Good11,54519,17027Has a high potential for ground water
Very Good1913170.4Has a very high potential for ground water
Total43,41572,087100
Table 5. Number of boreholes on suitable groundwater potential zones.
Number of
Zones
Groundwater
Potential
Zone
Coverage Area
km2
Number
of Existing Boreholes
% of Existing Total Boreholes% of Boreholes on Suitable Zones
1Poor863911311n/a
2Moderate43,9616666868
3Good19,1701431515
4Very Good3175866
Total 72,08798010089
Publisher’s Note: MDPI stays neutral with regard to jurisdictional claims in published maps and institutional affiliations.

