
Hydrochemical and Isotopic Investigation of the Groundwater from Wajid Aquifer in Wadi Al-Dawasir, Southern Saudi Arabia


Abstract
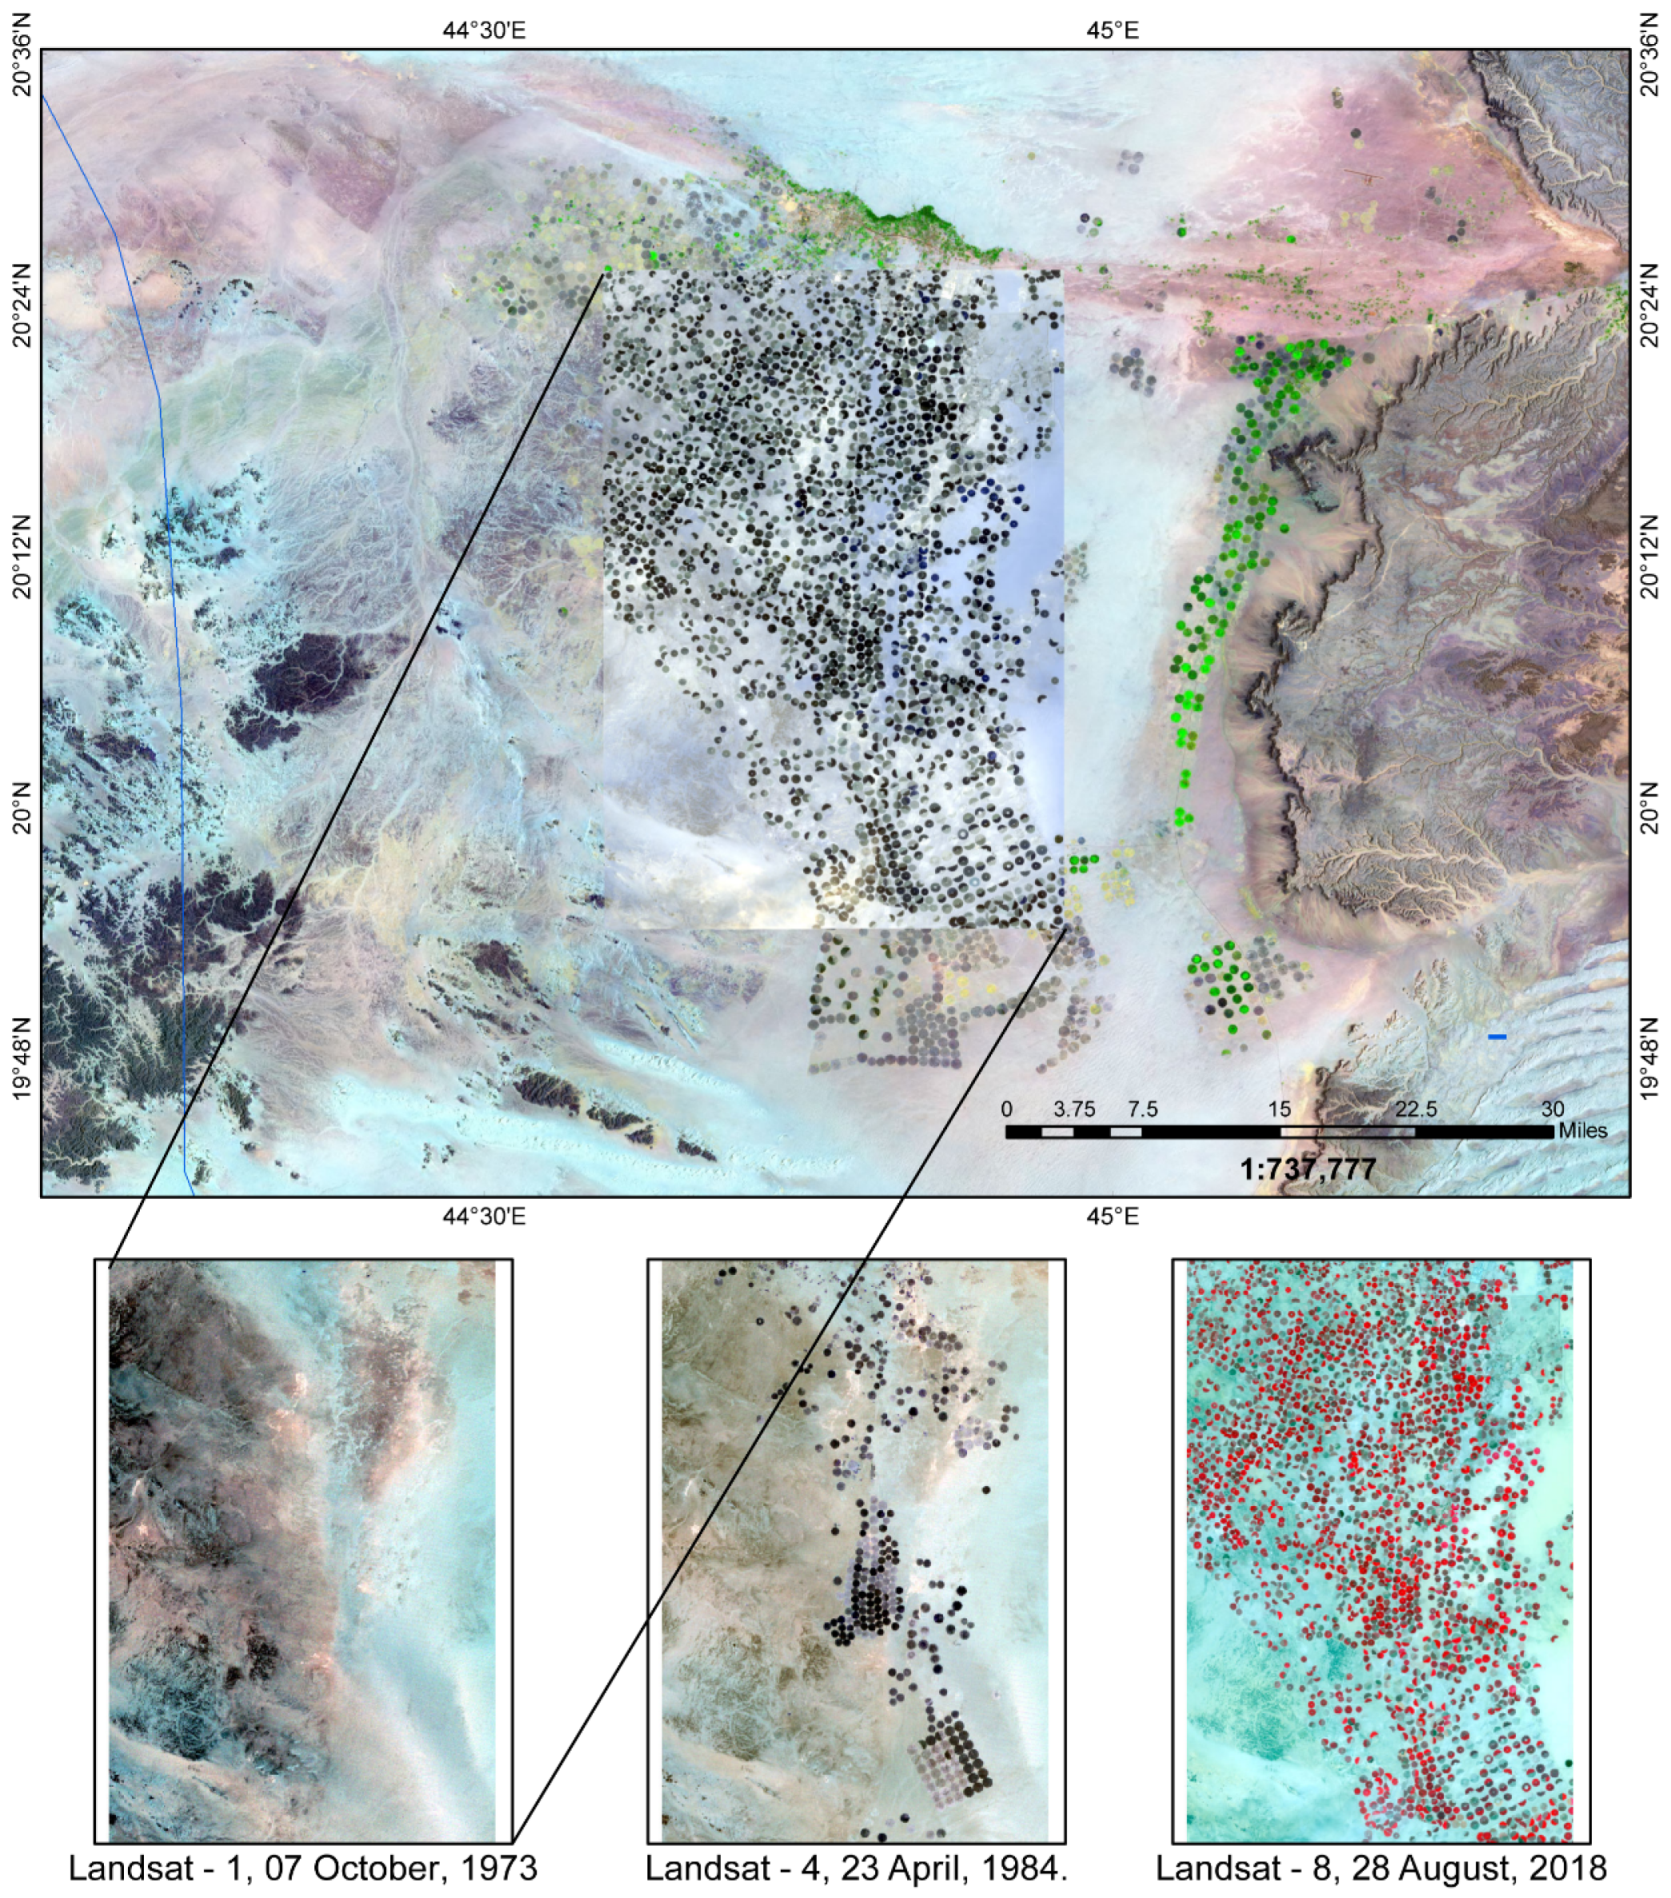
:1. Introduction
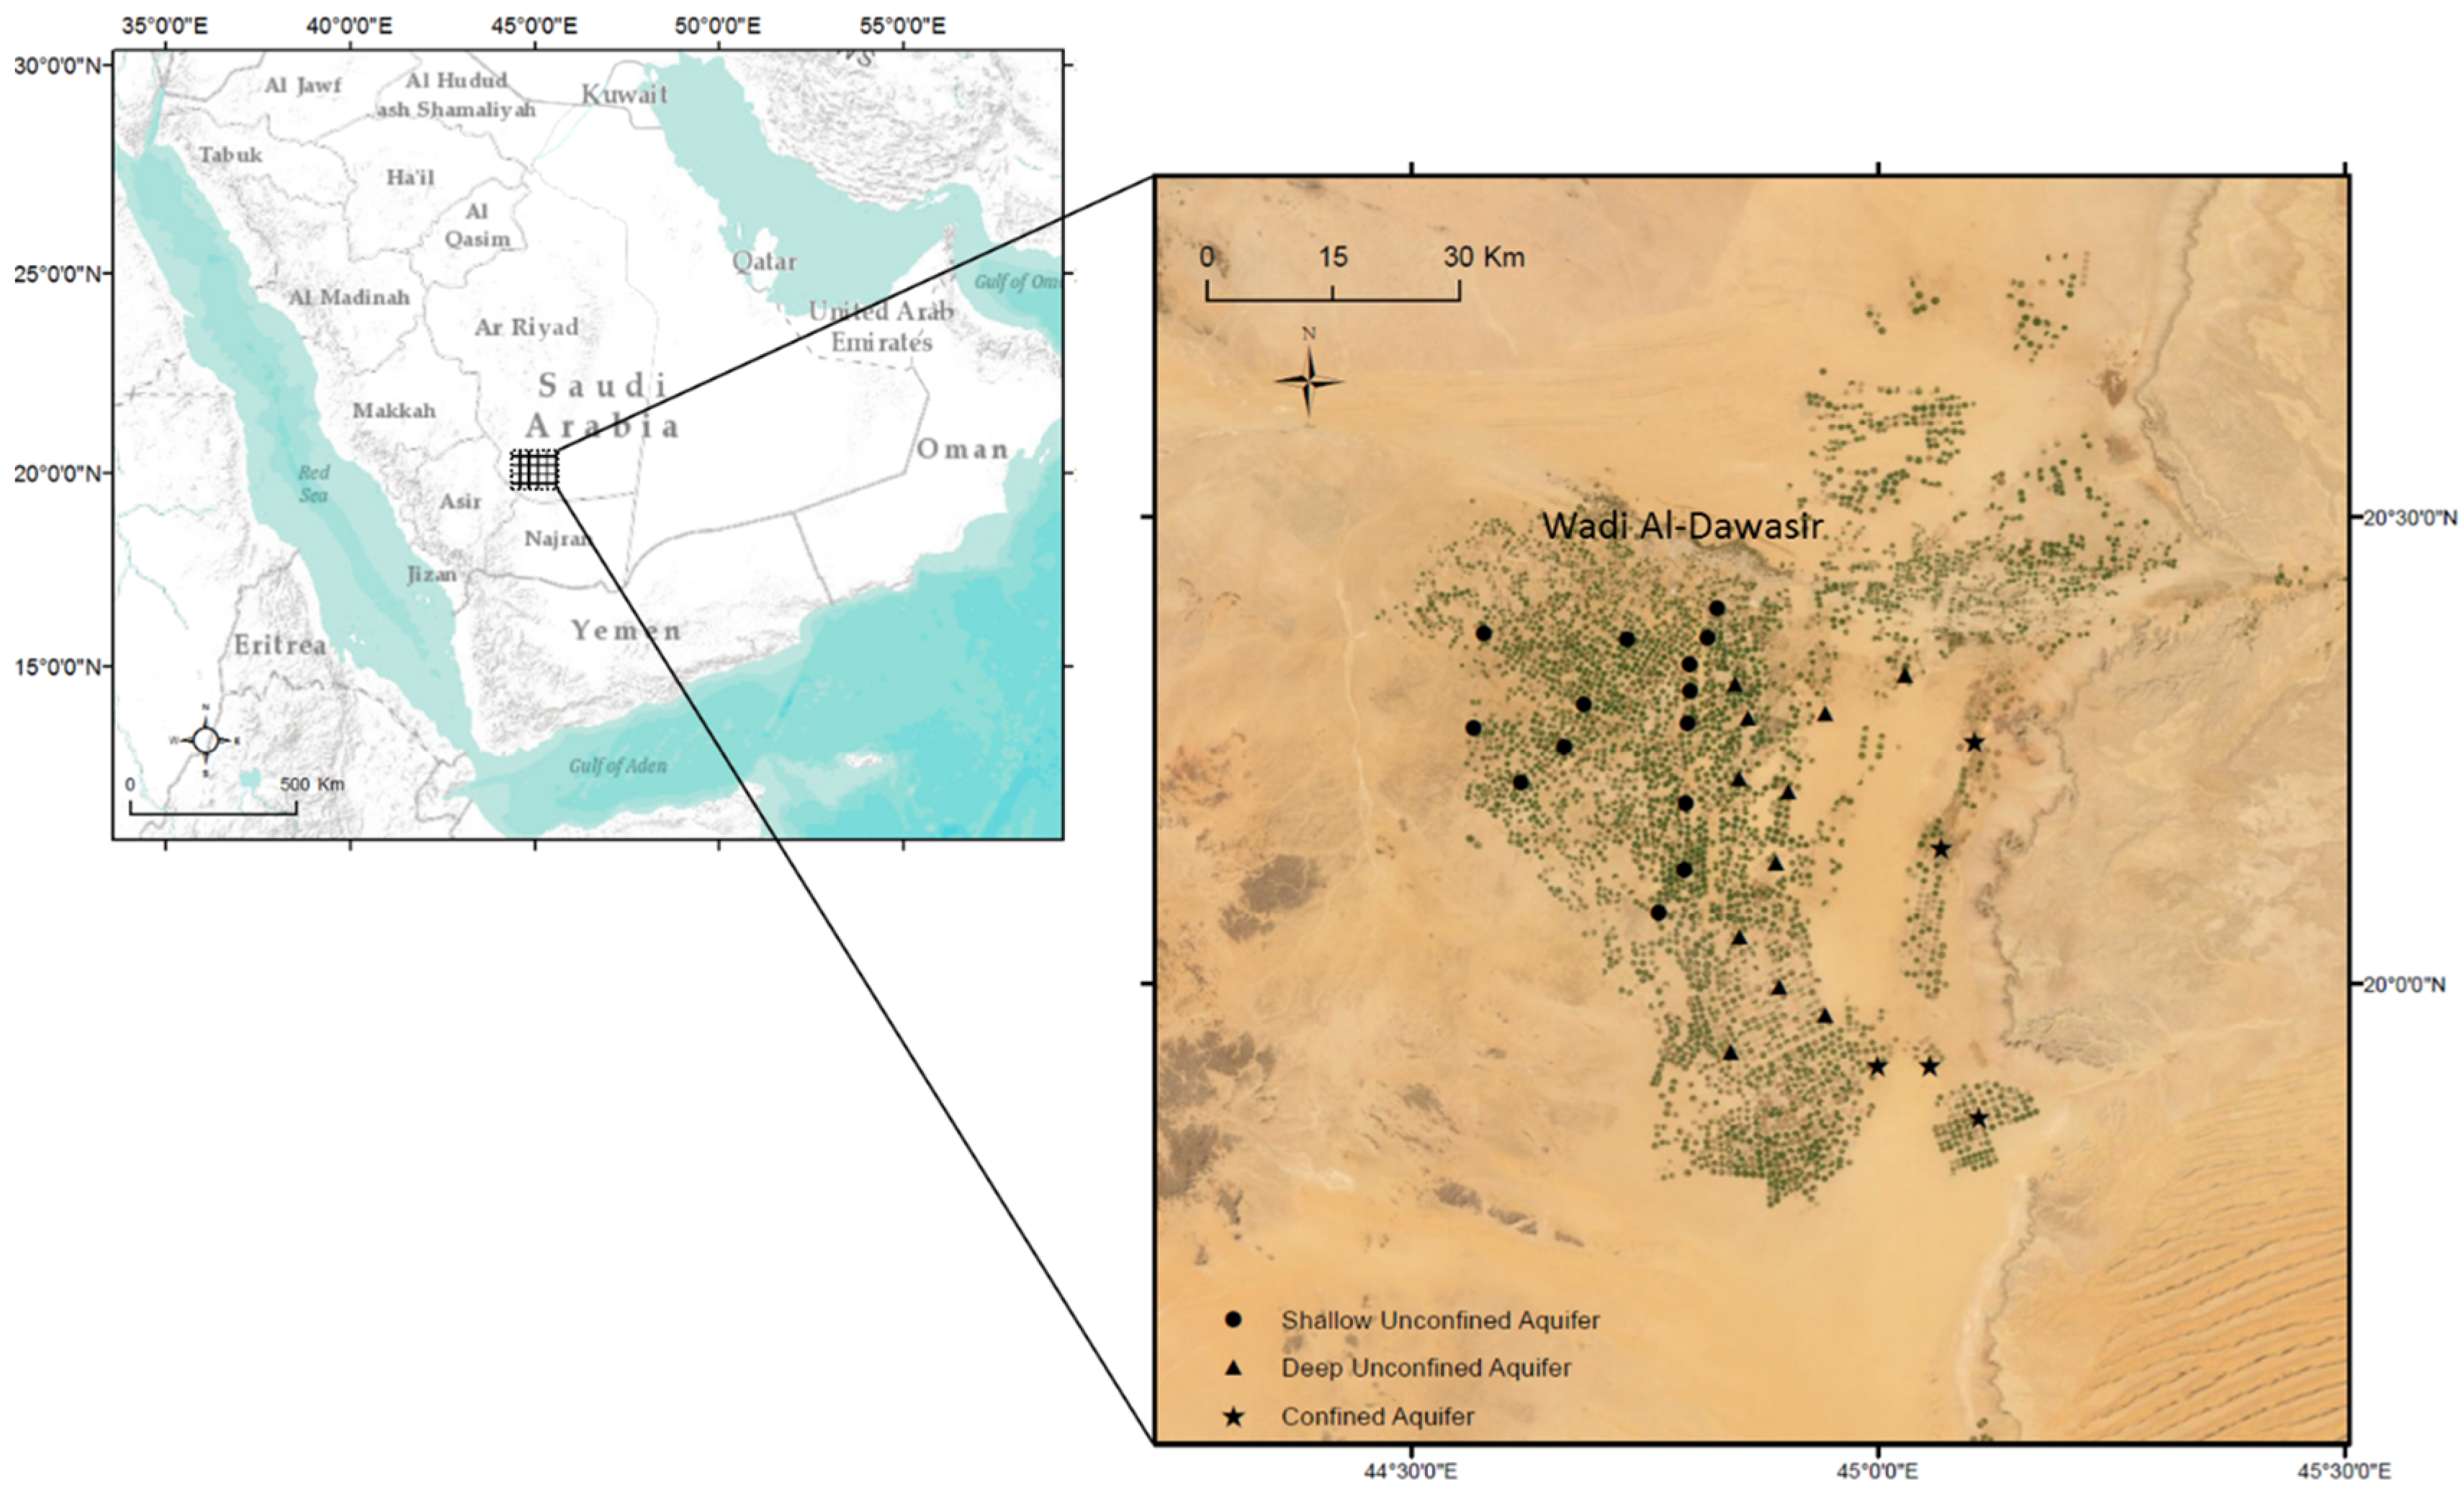
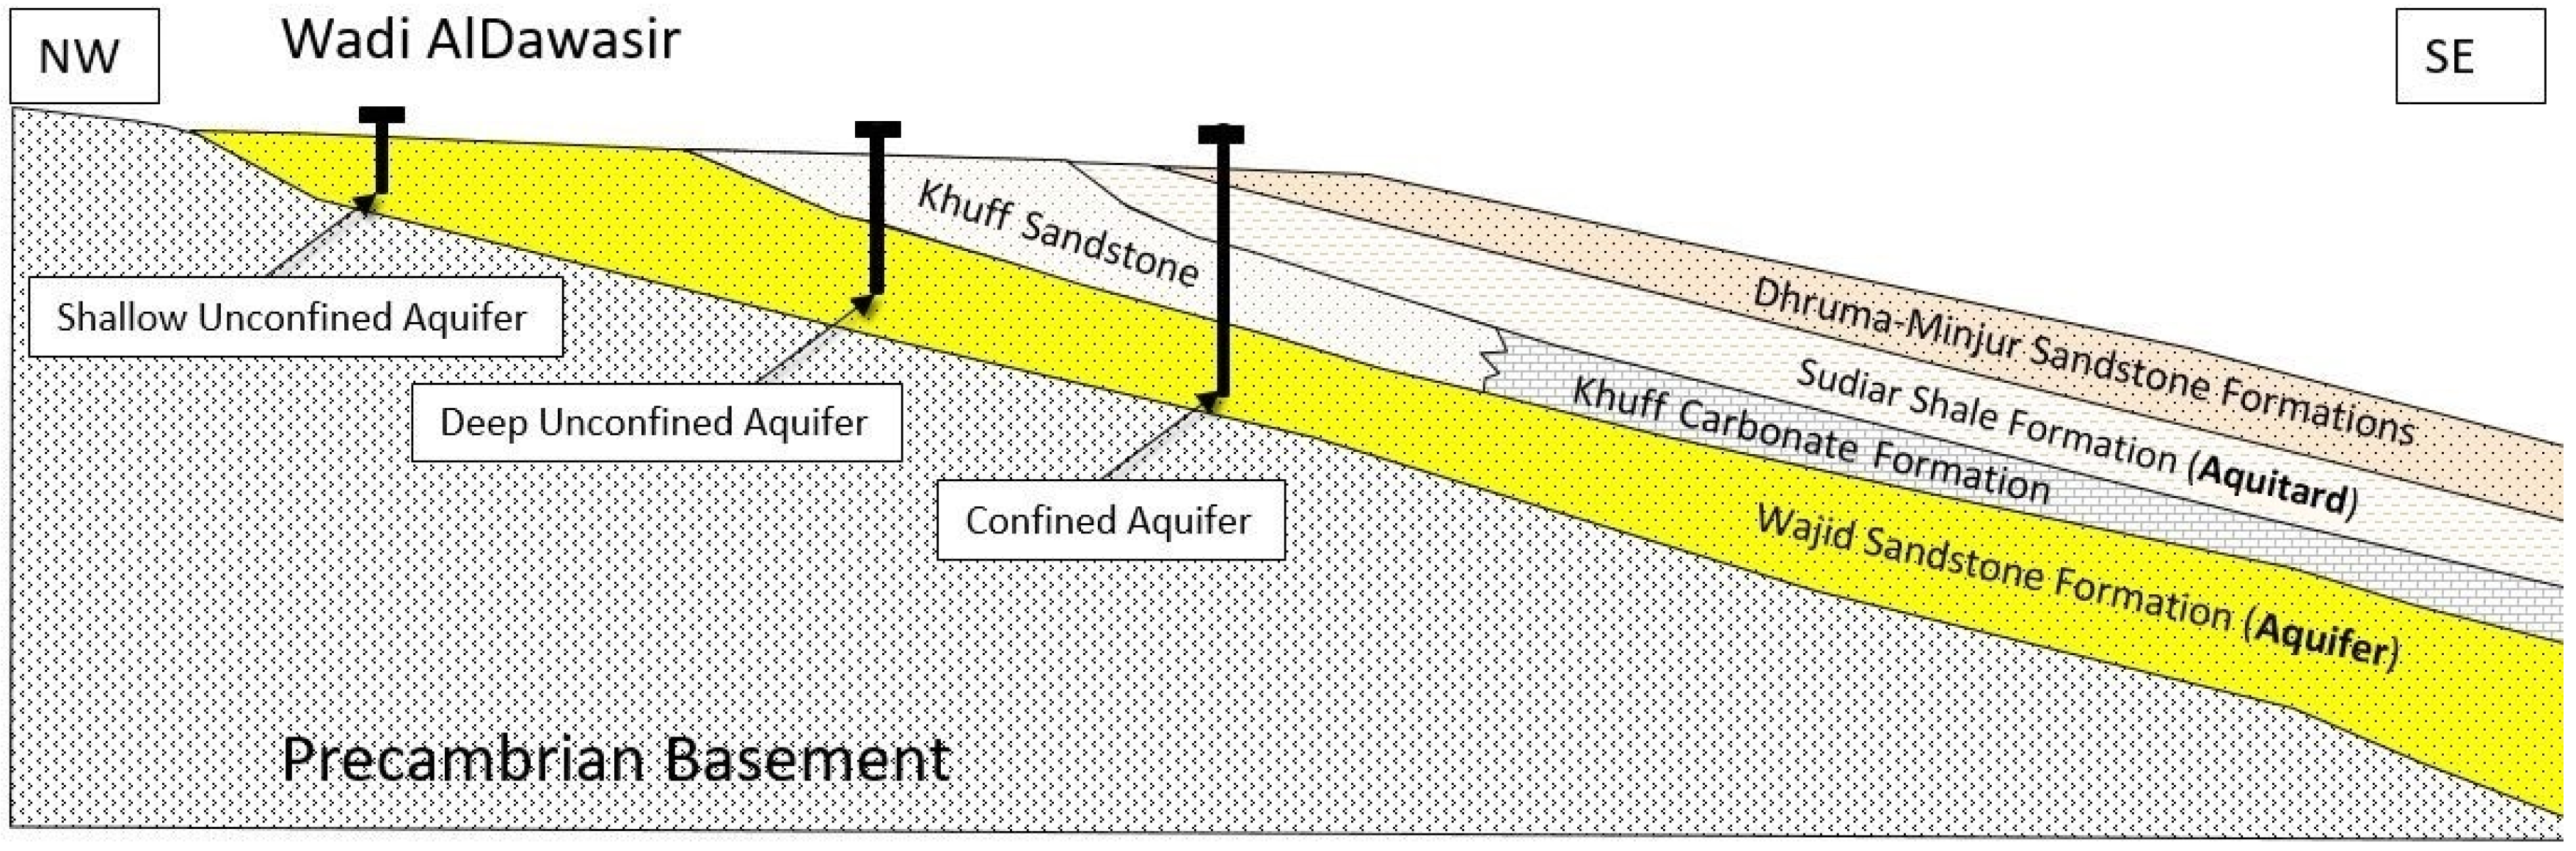
2. Materials and Methods
3. Results
3.1. Hydrochemical Characteristics
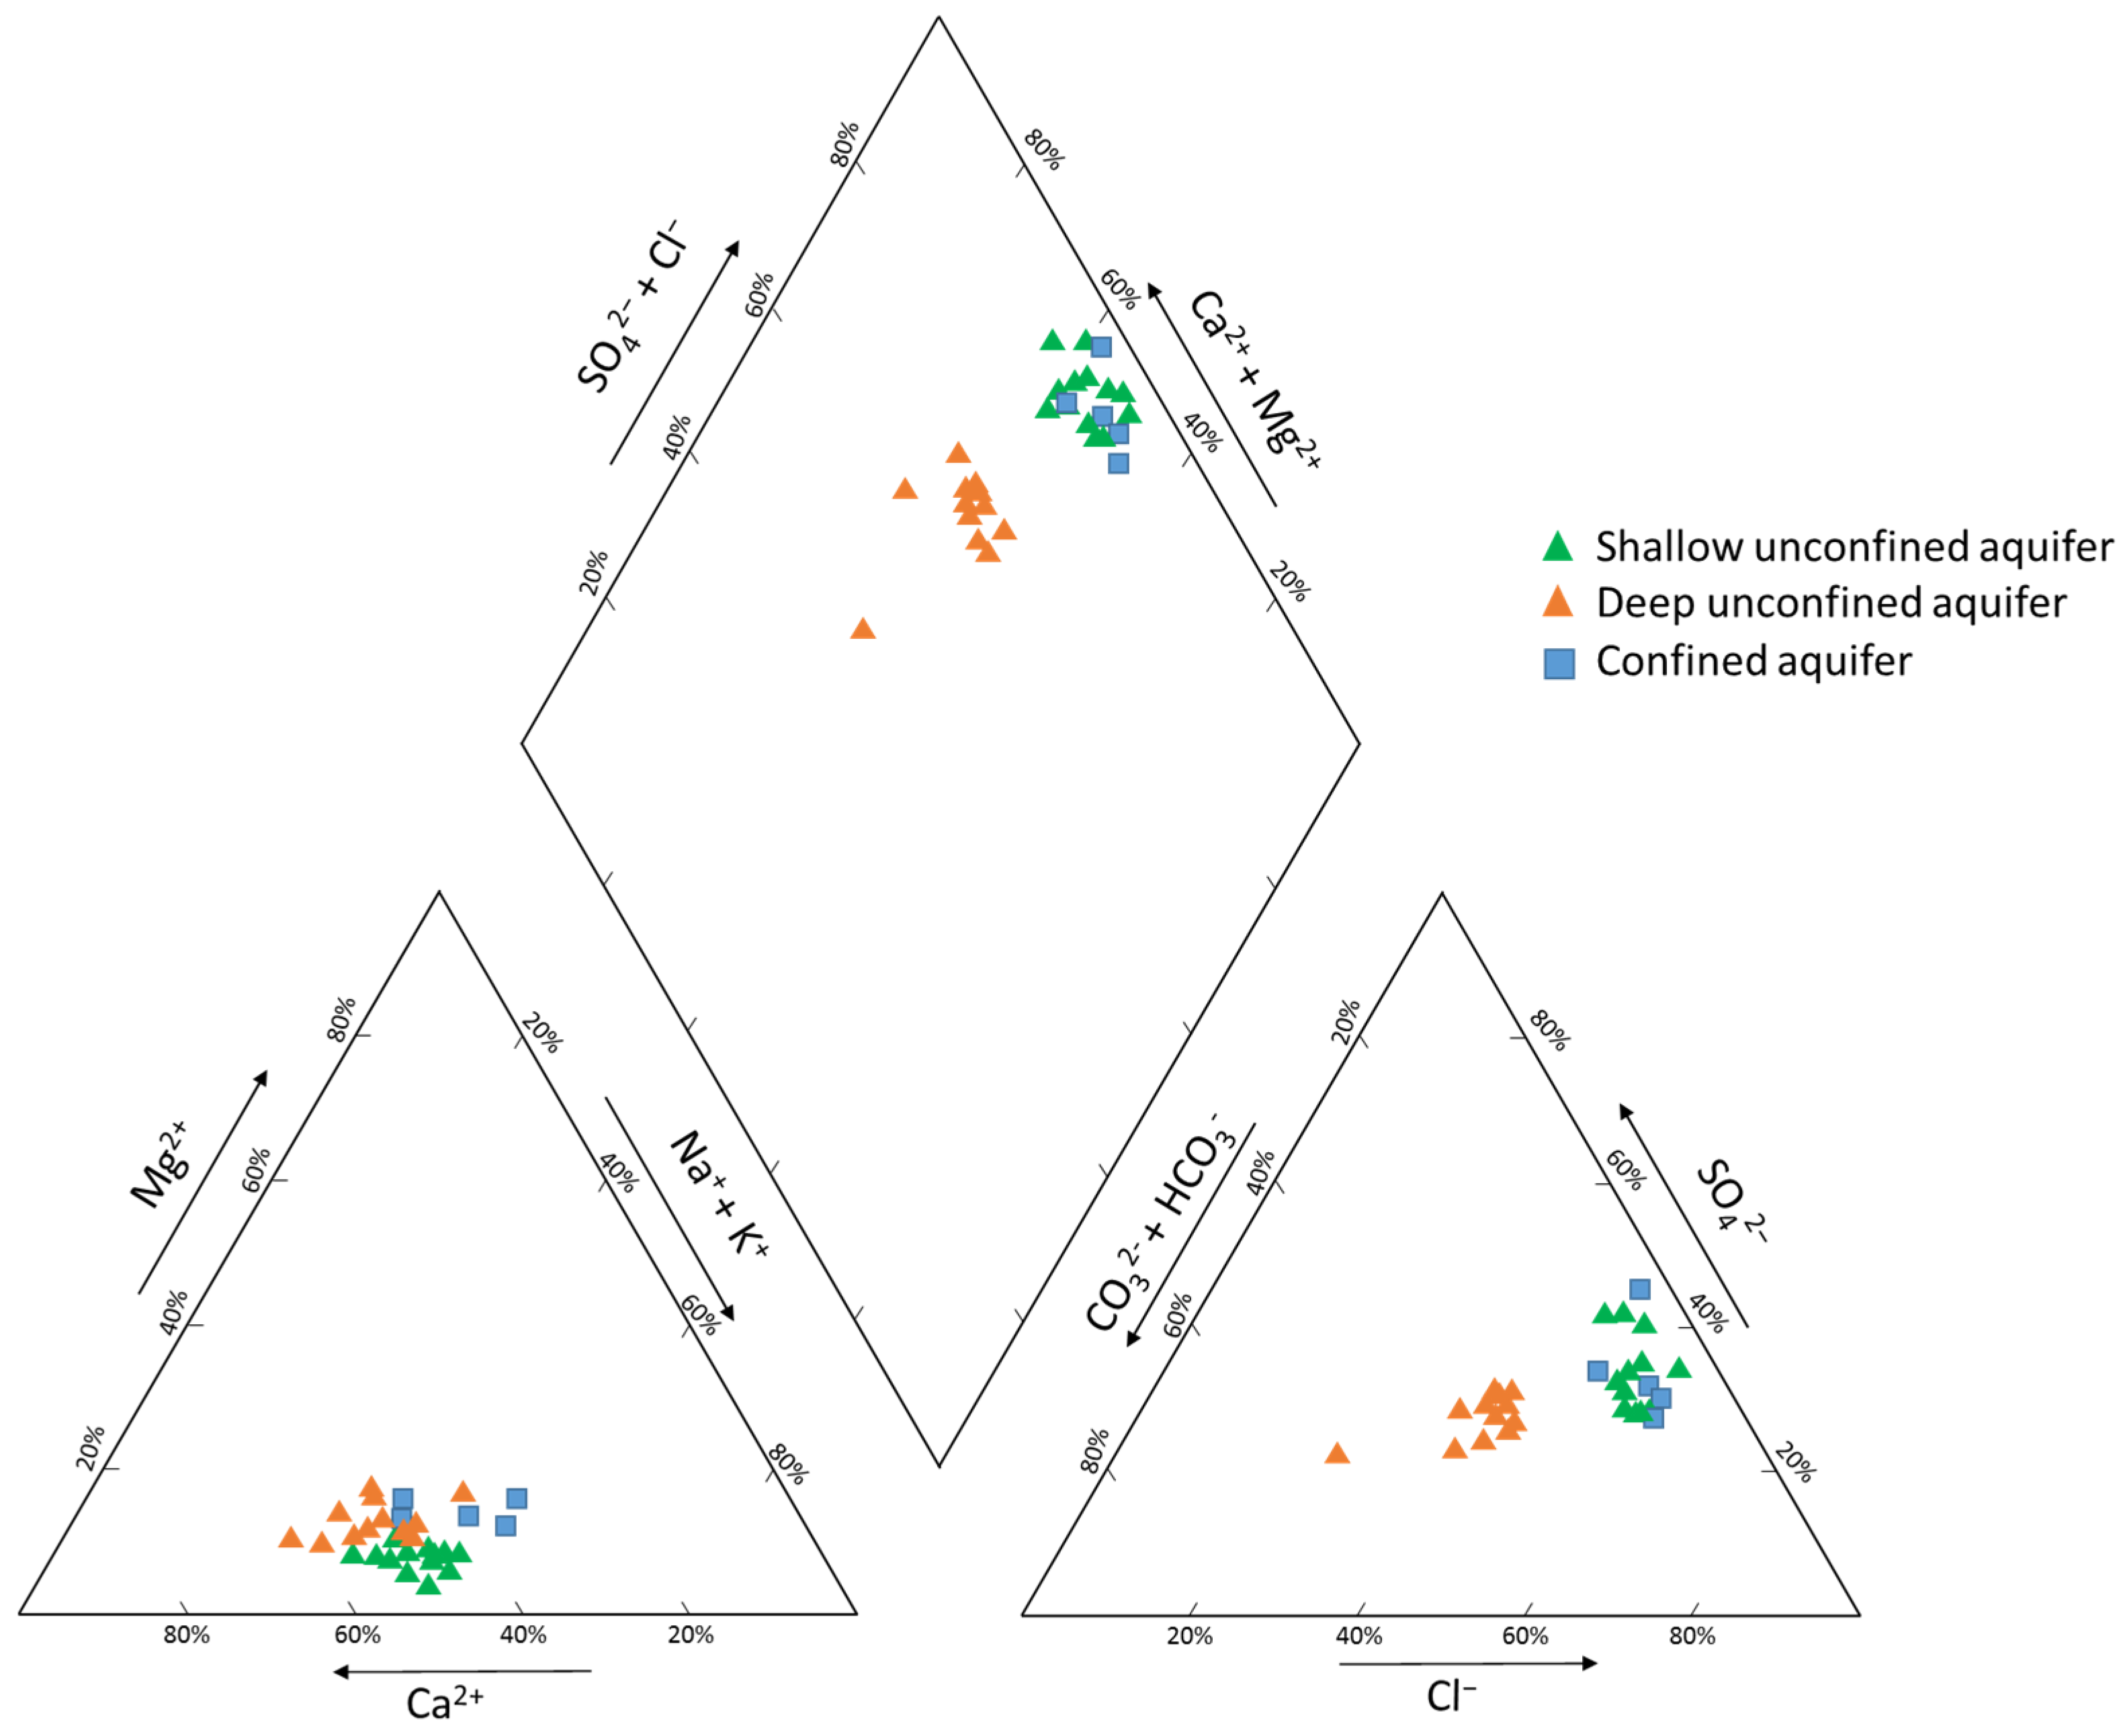
3.2. Hydrochemical Facies
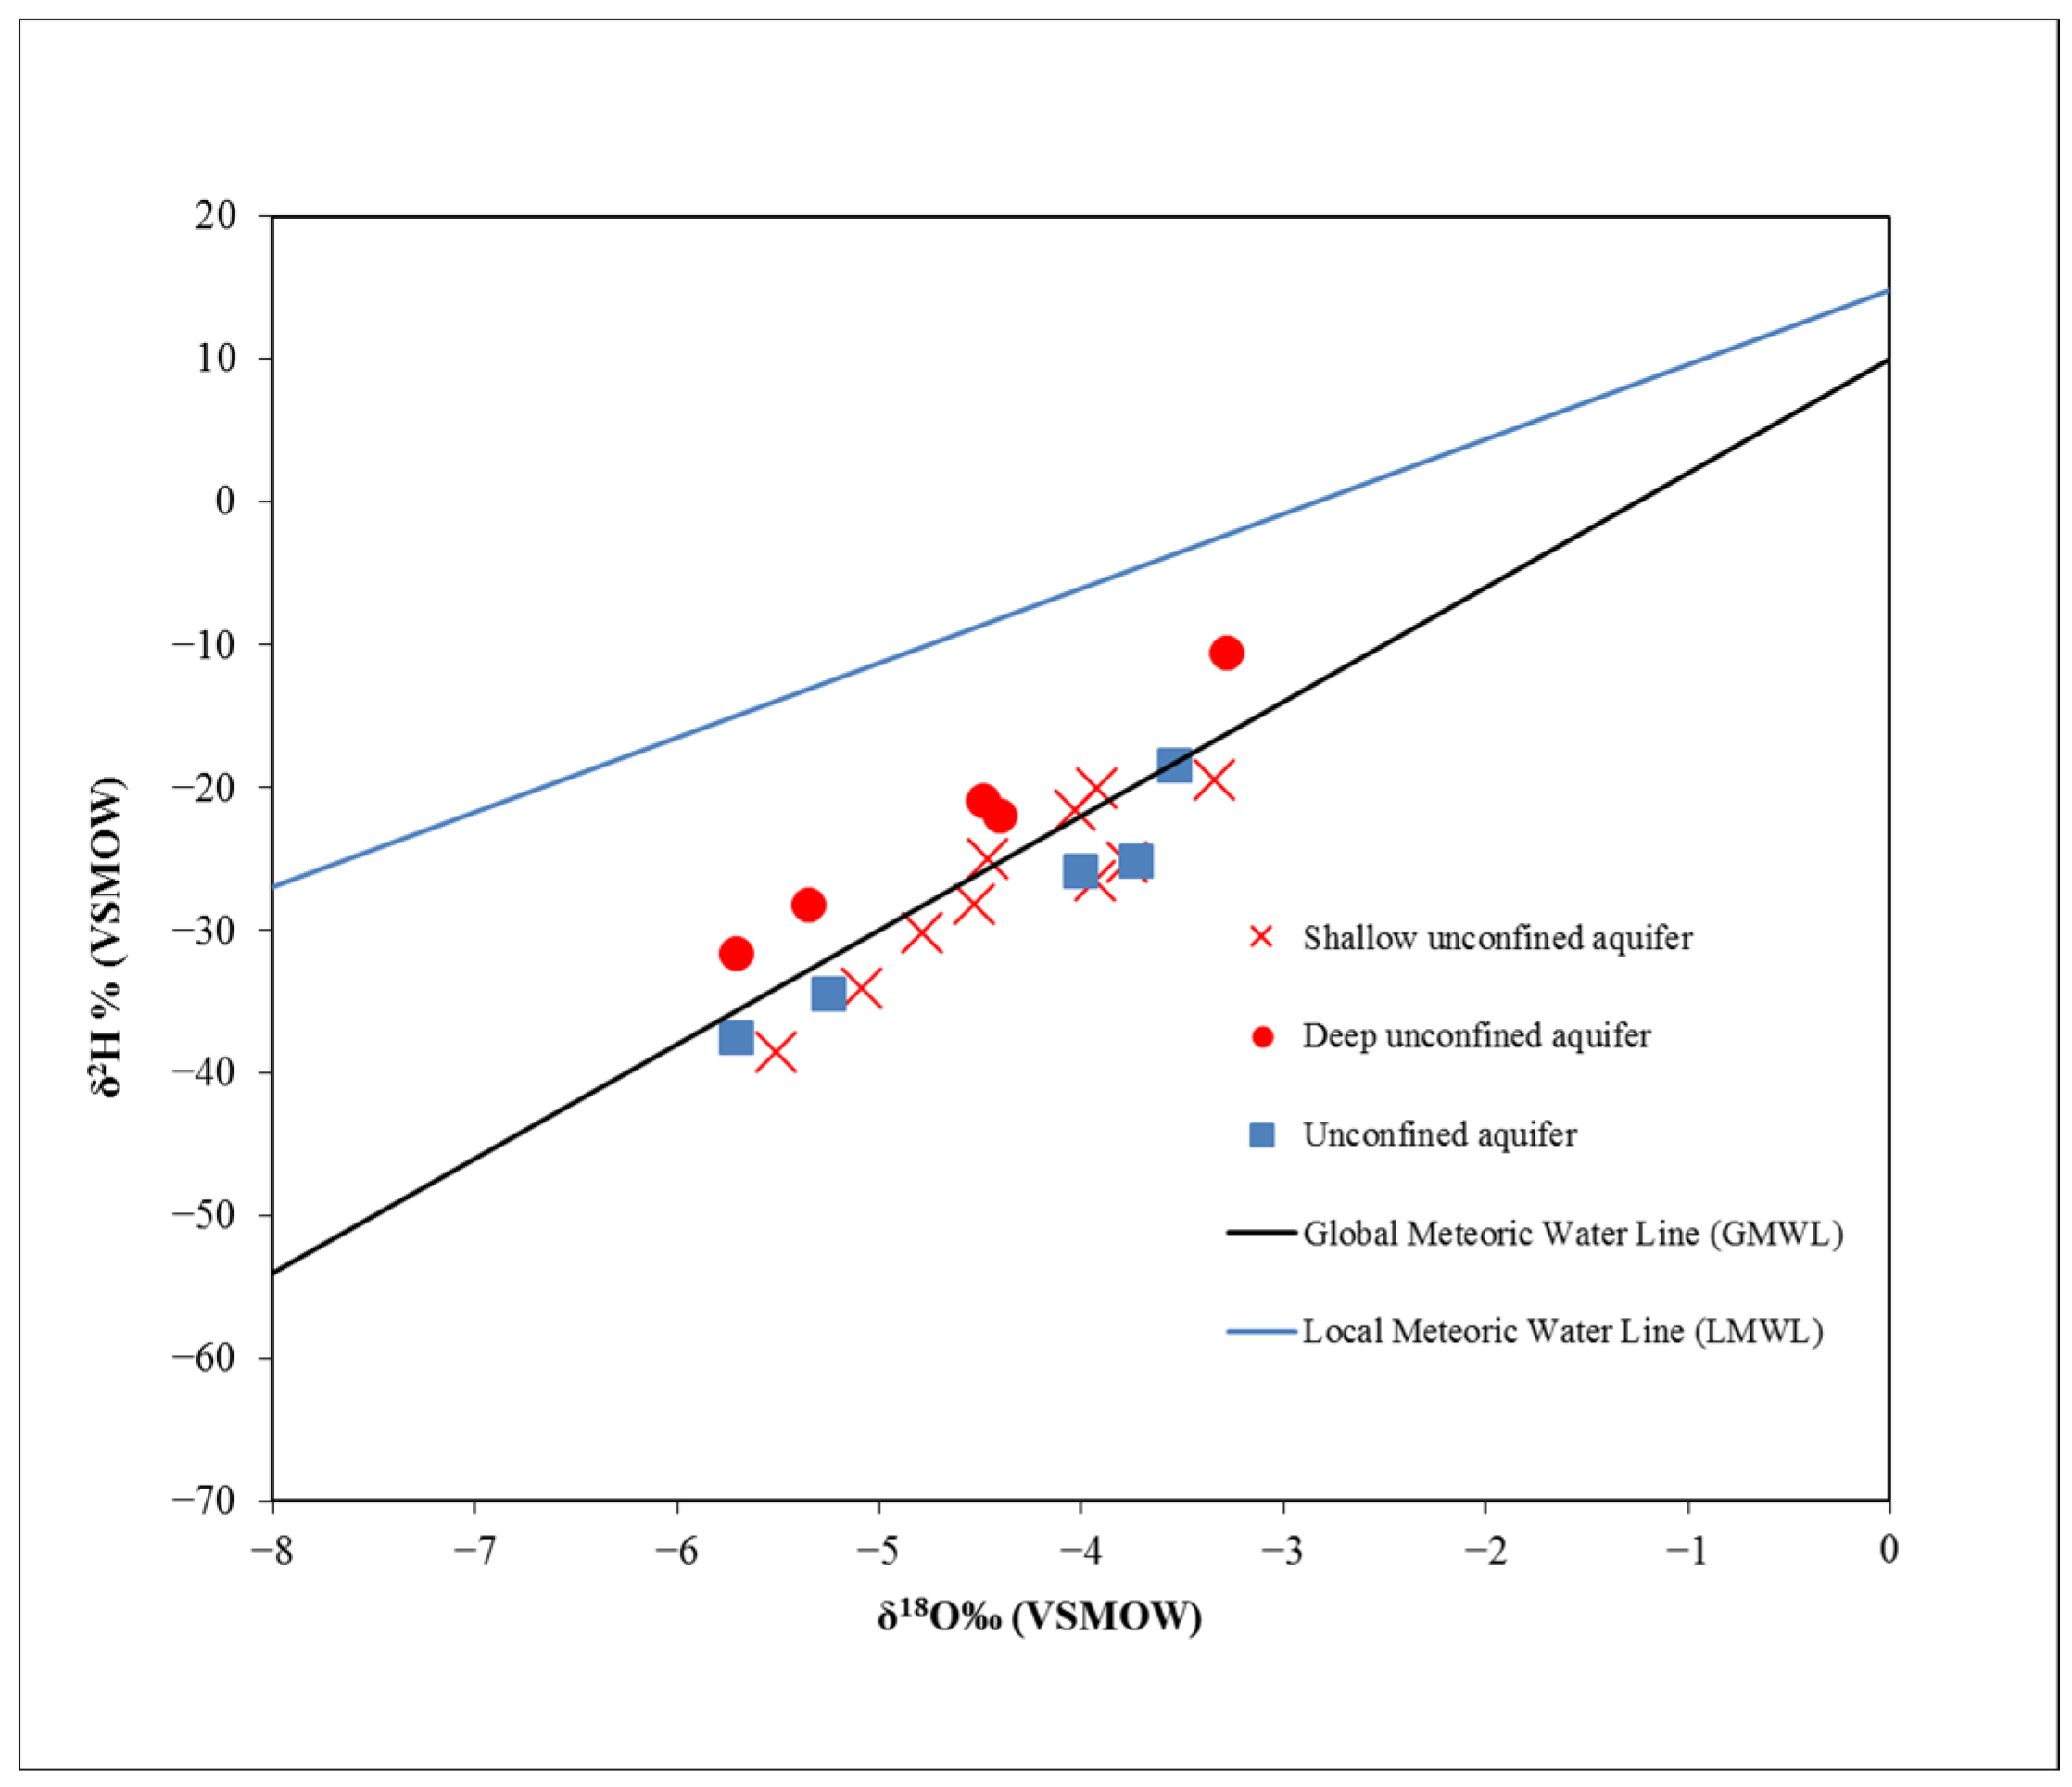
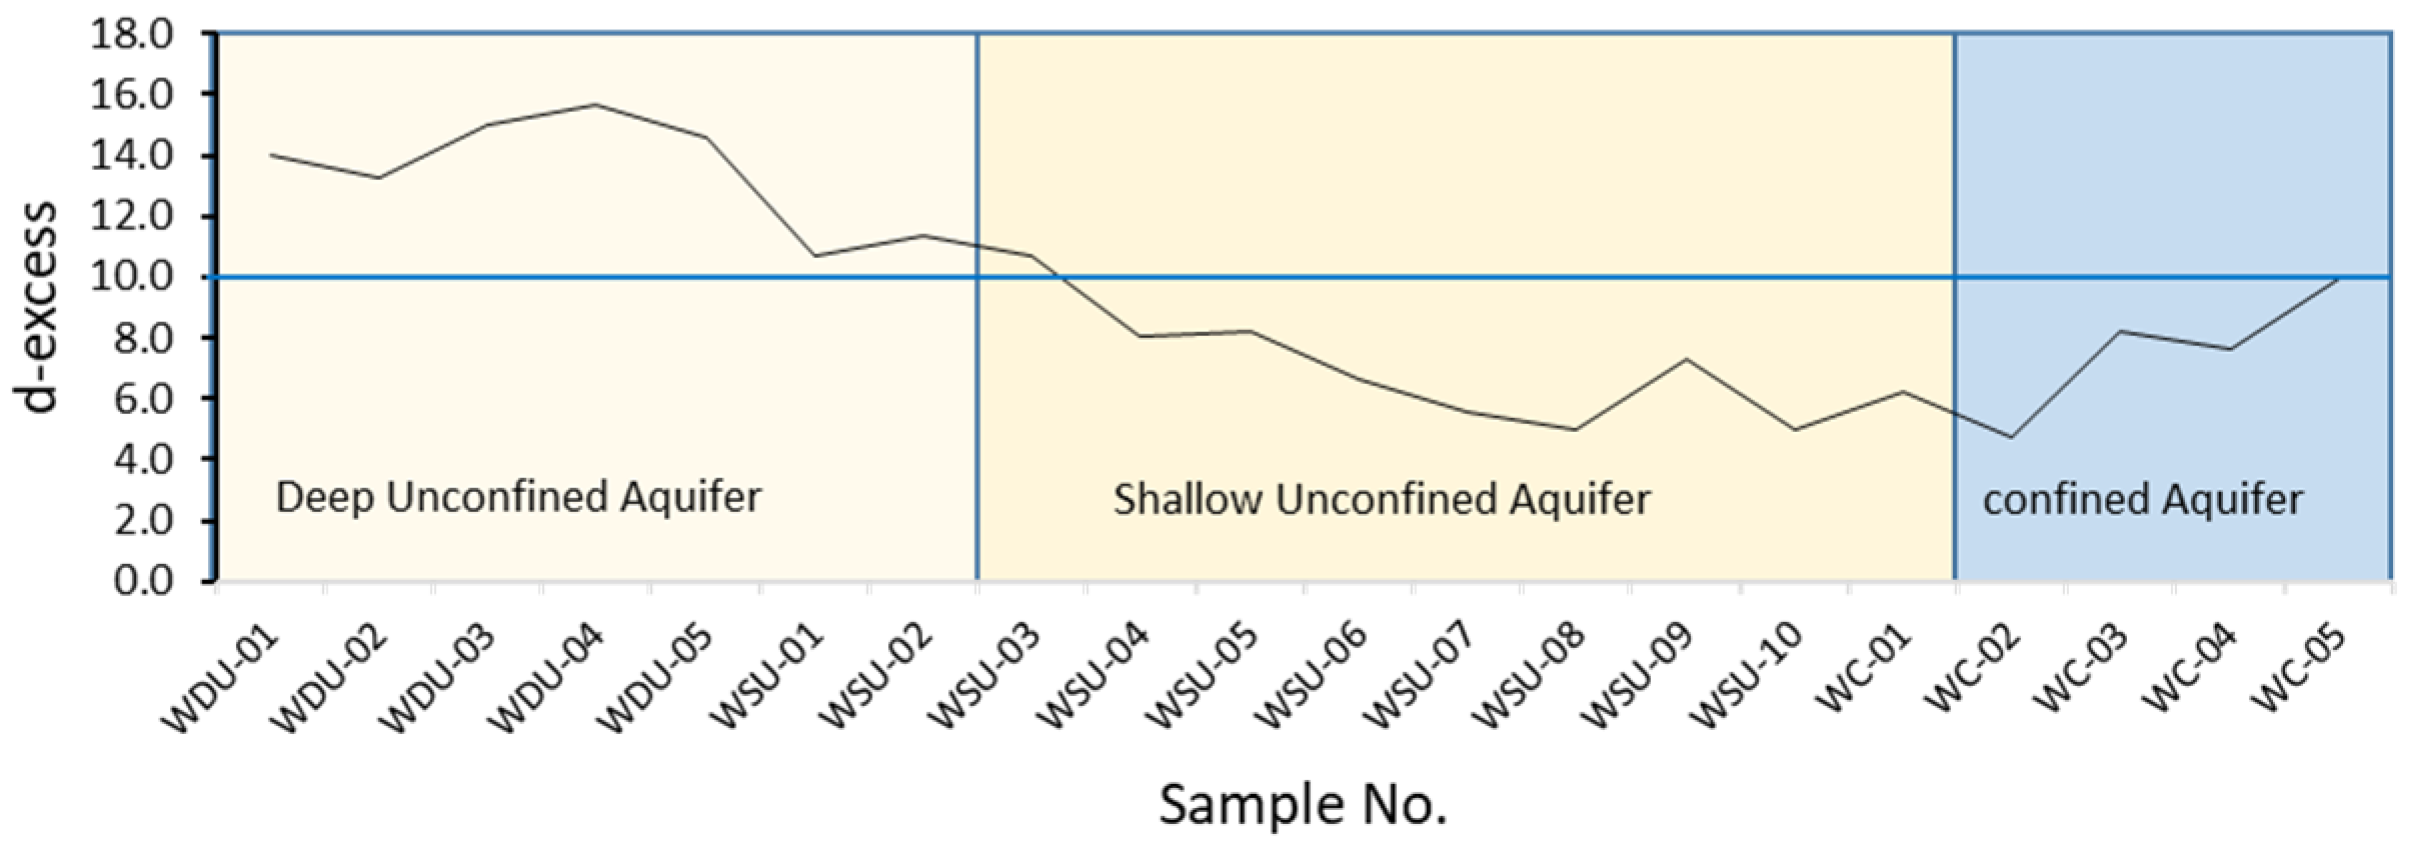
3.3. Oxygen-18 and Deuterium Compositions
4. Discussion
4.1. Hydrochemical Processes Controlling Water Chemistry
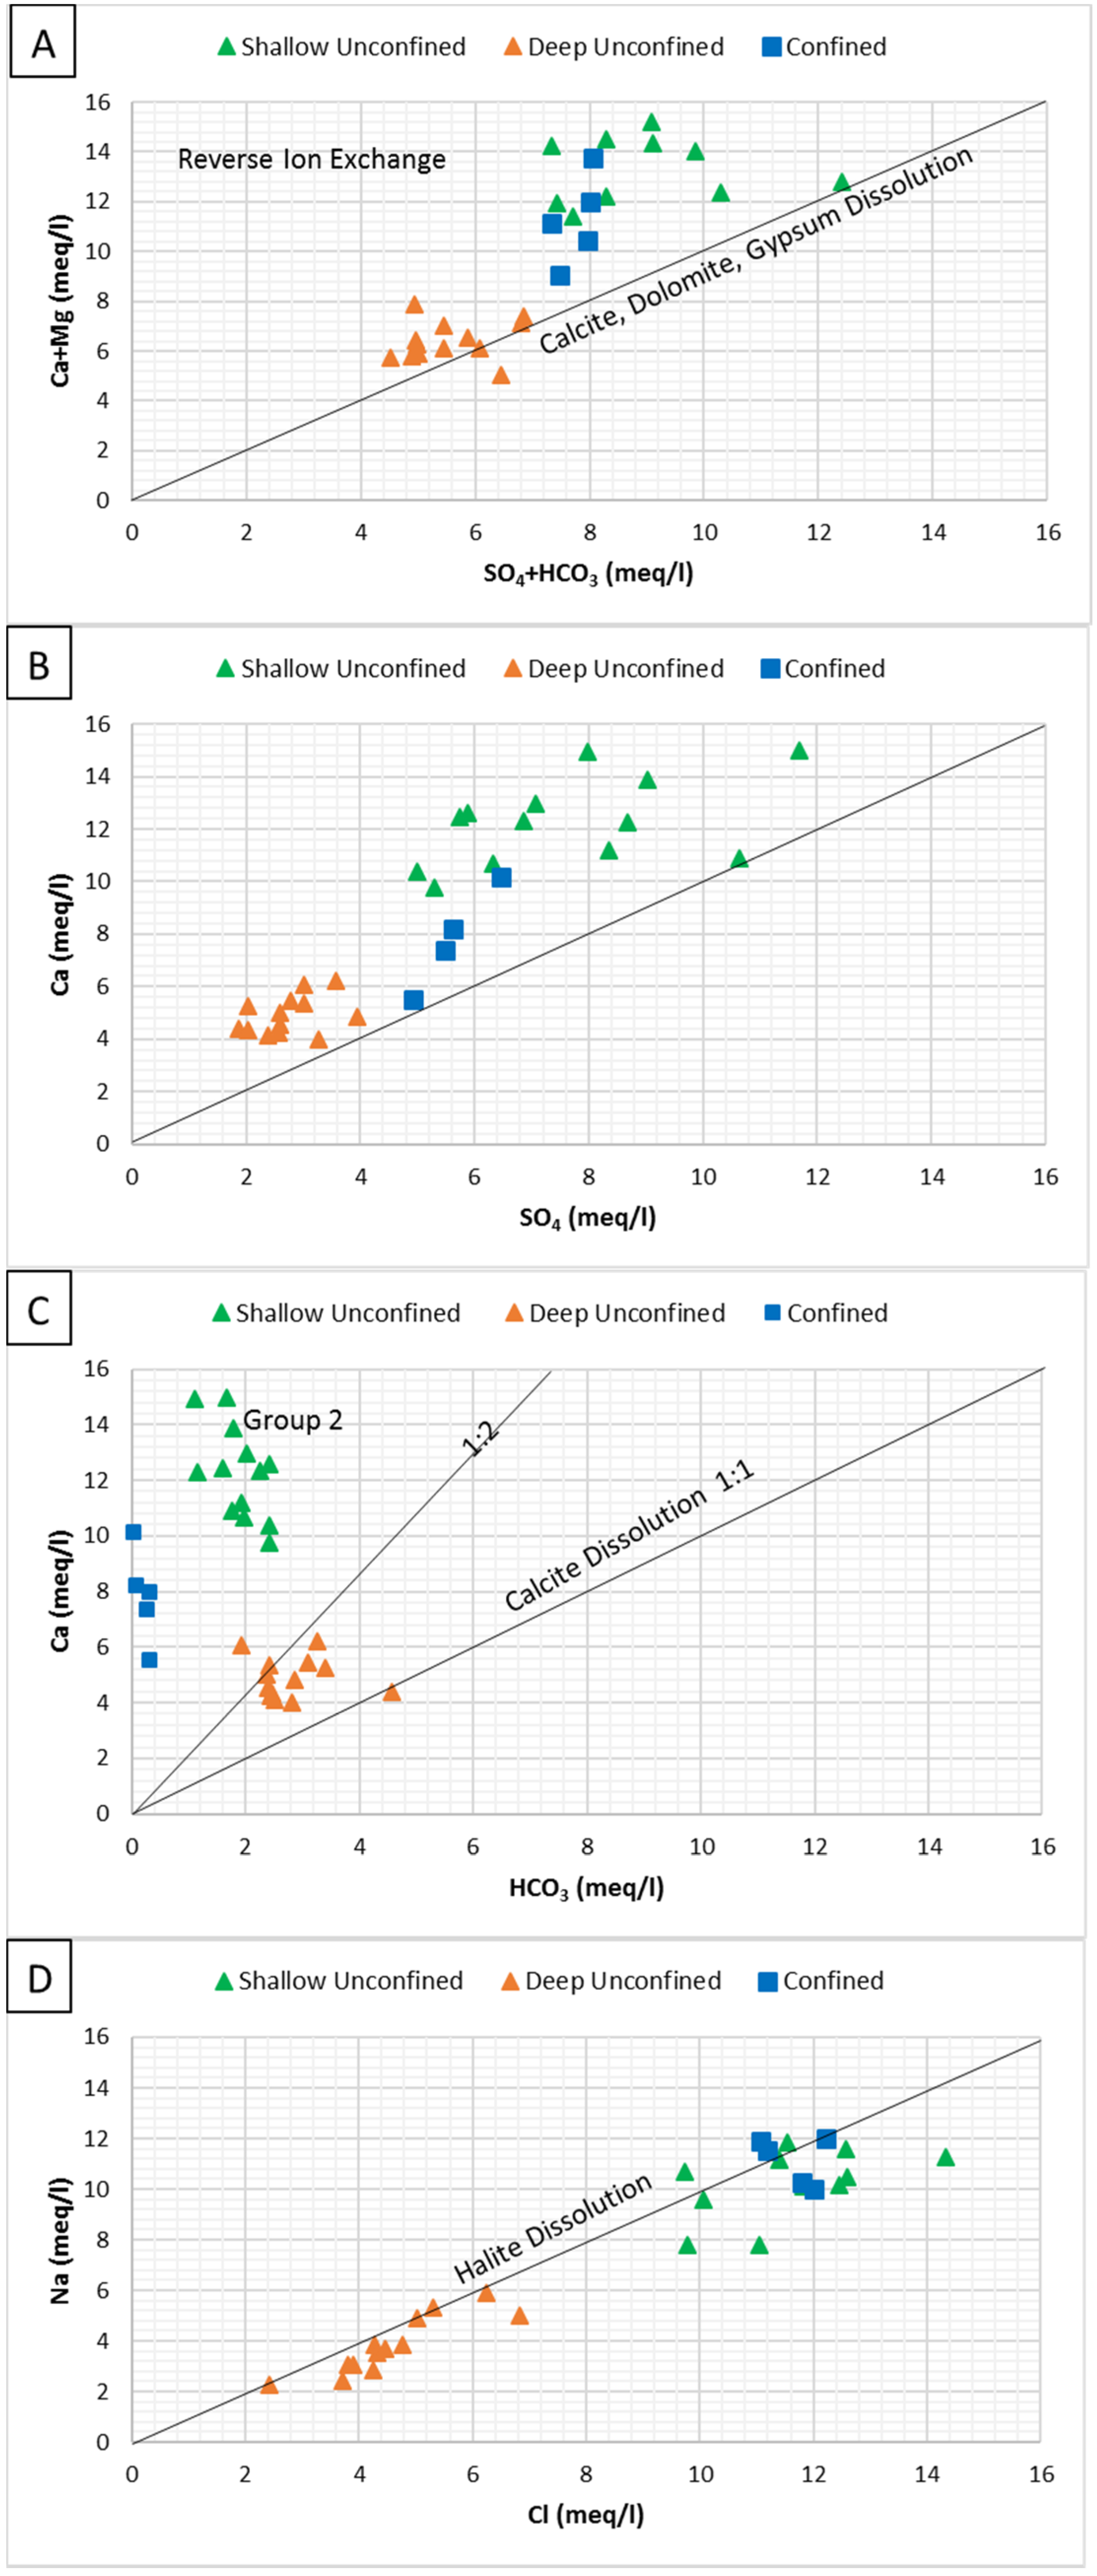
4.1.1. Weathering Process
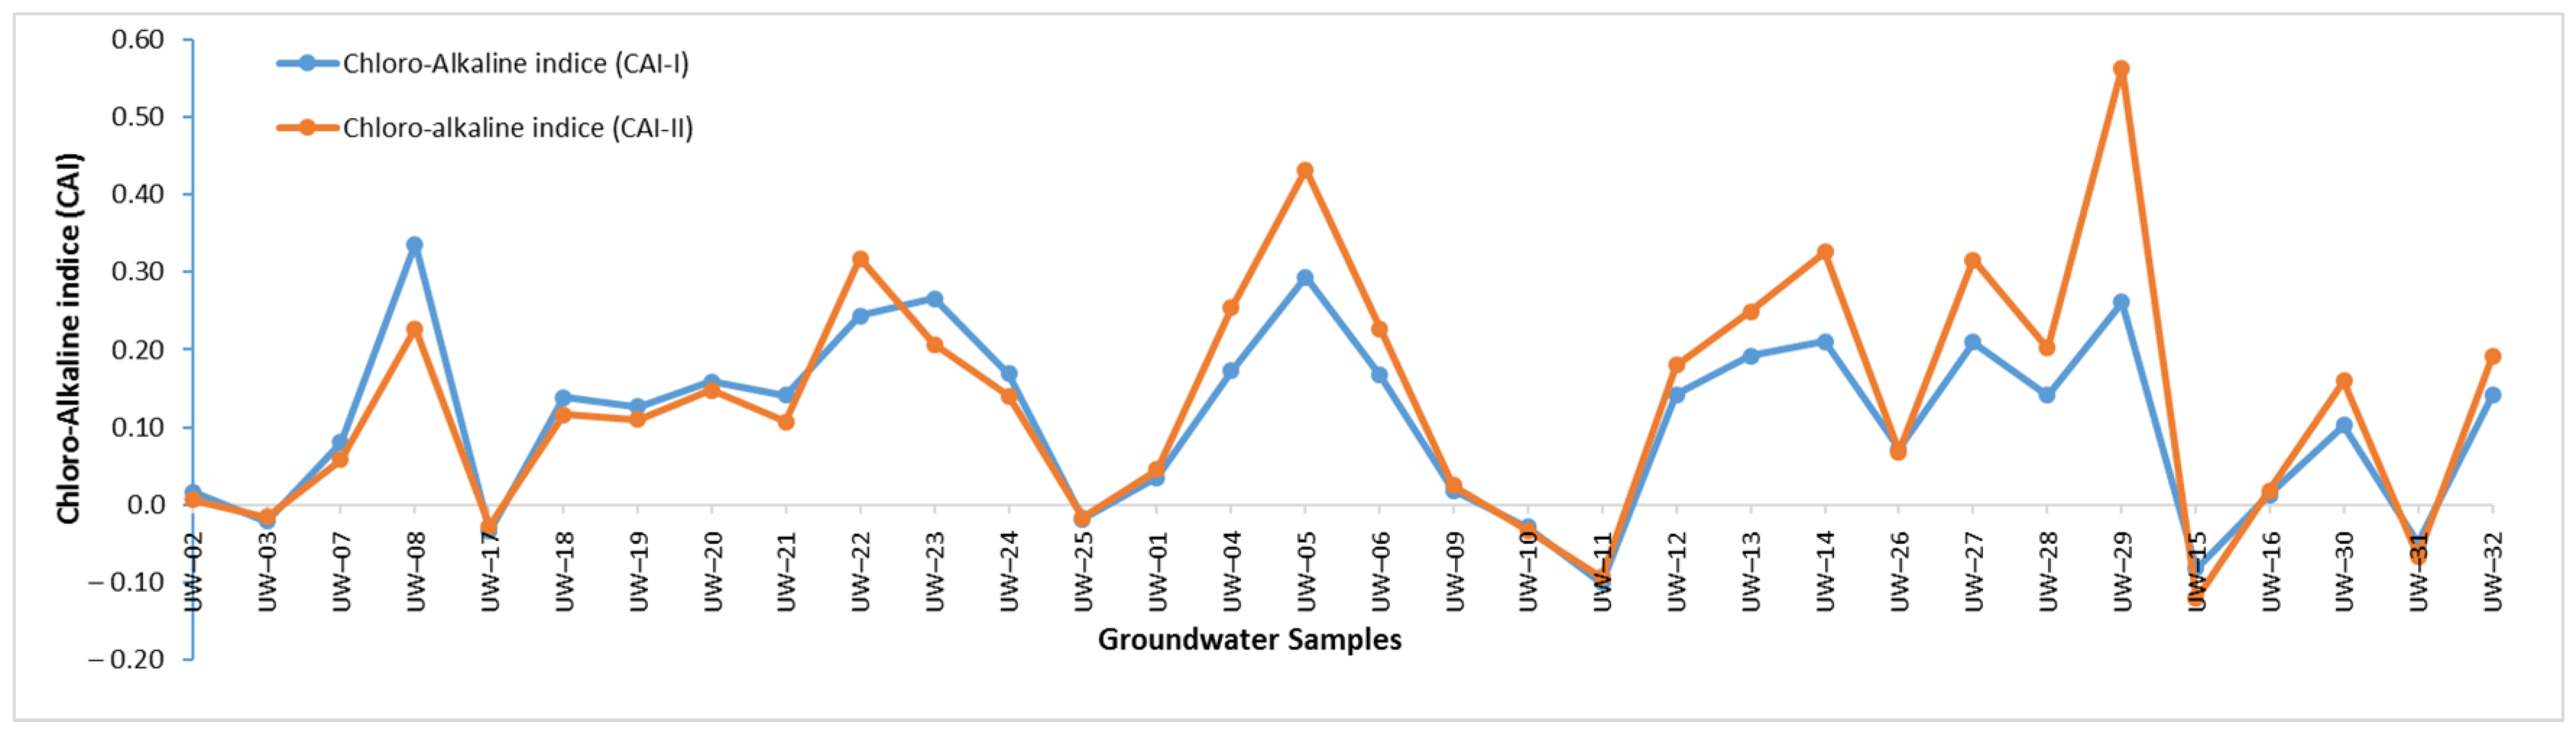
4.1.2. Ion Exchange Process
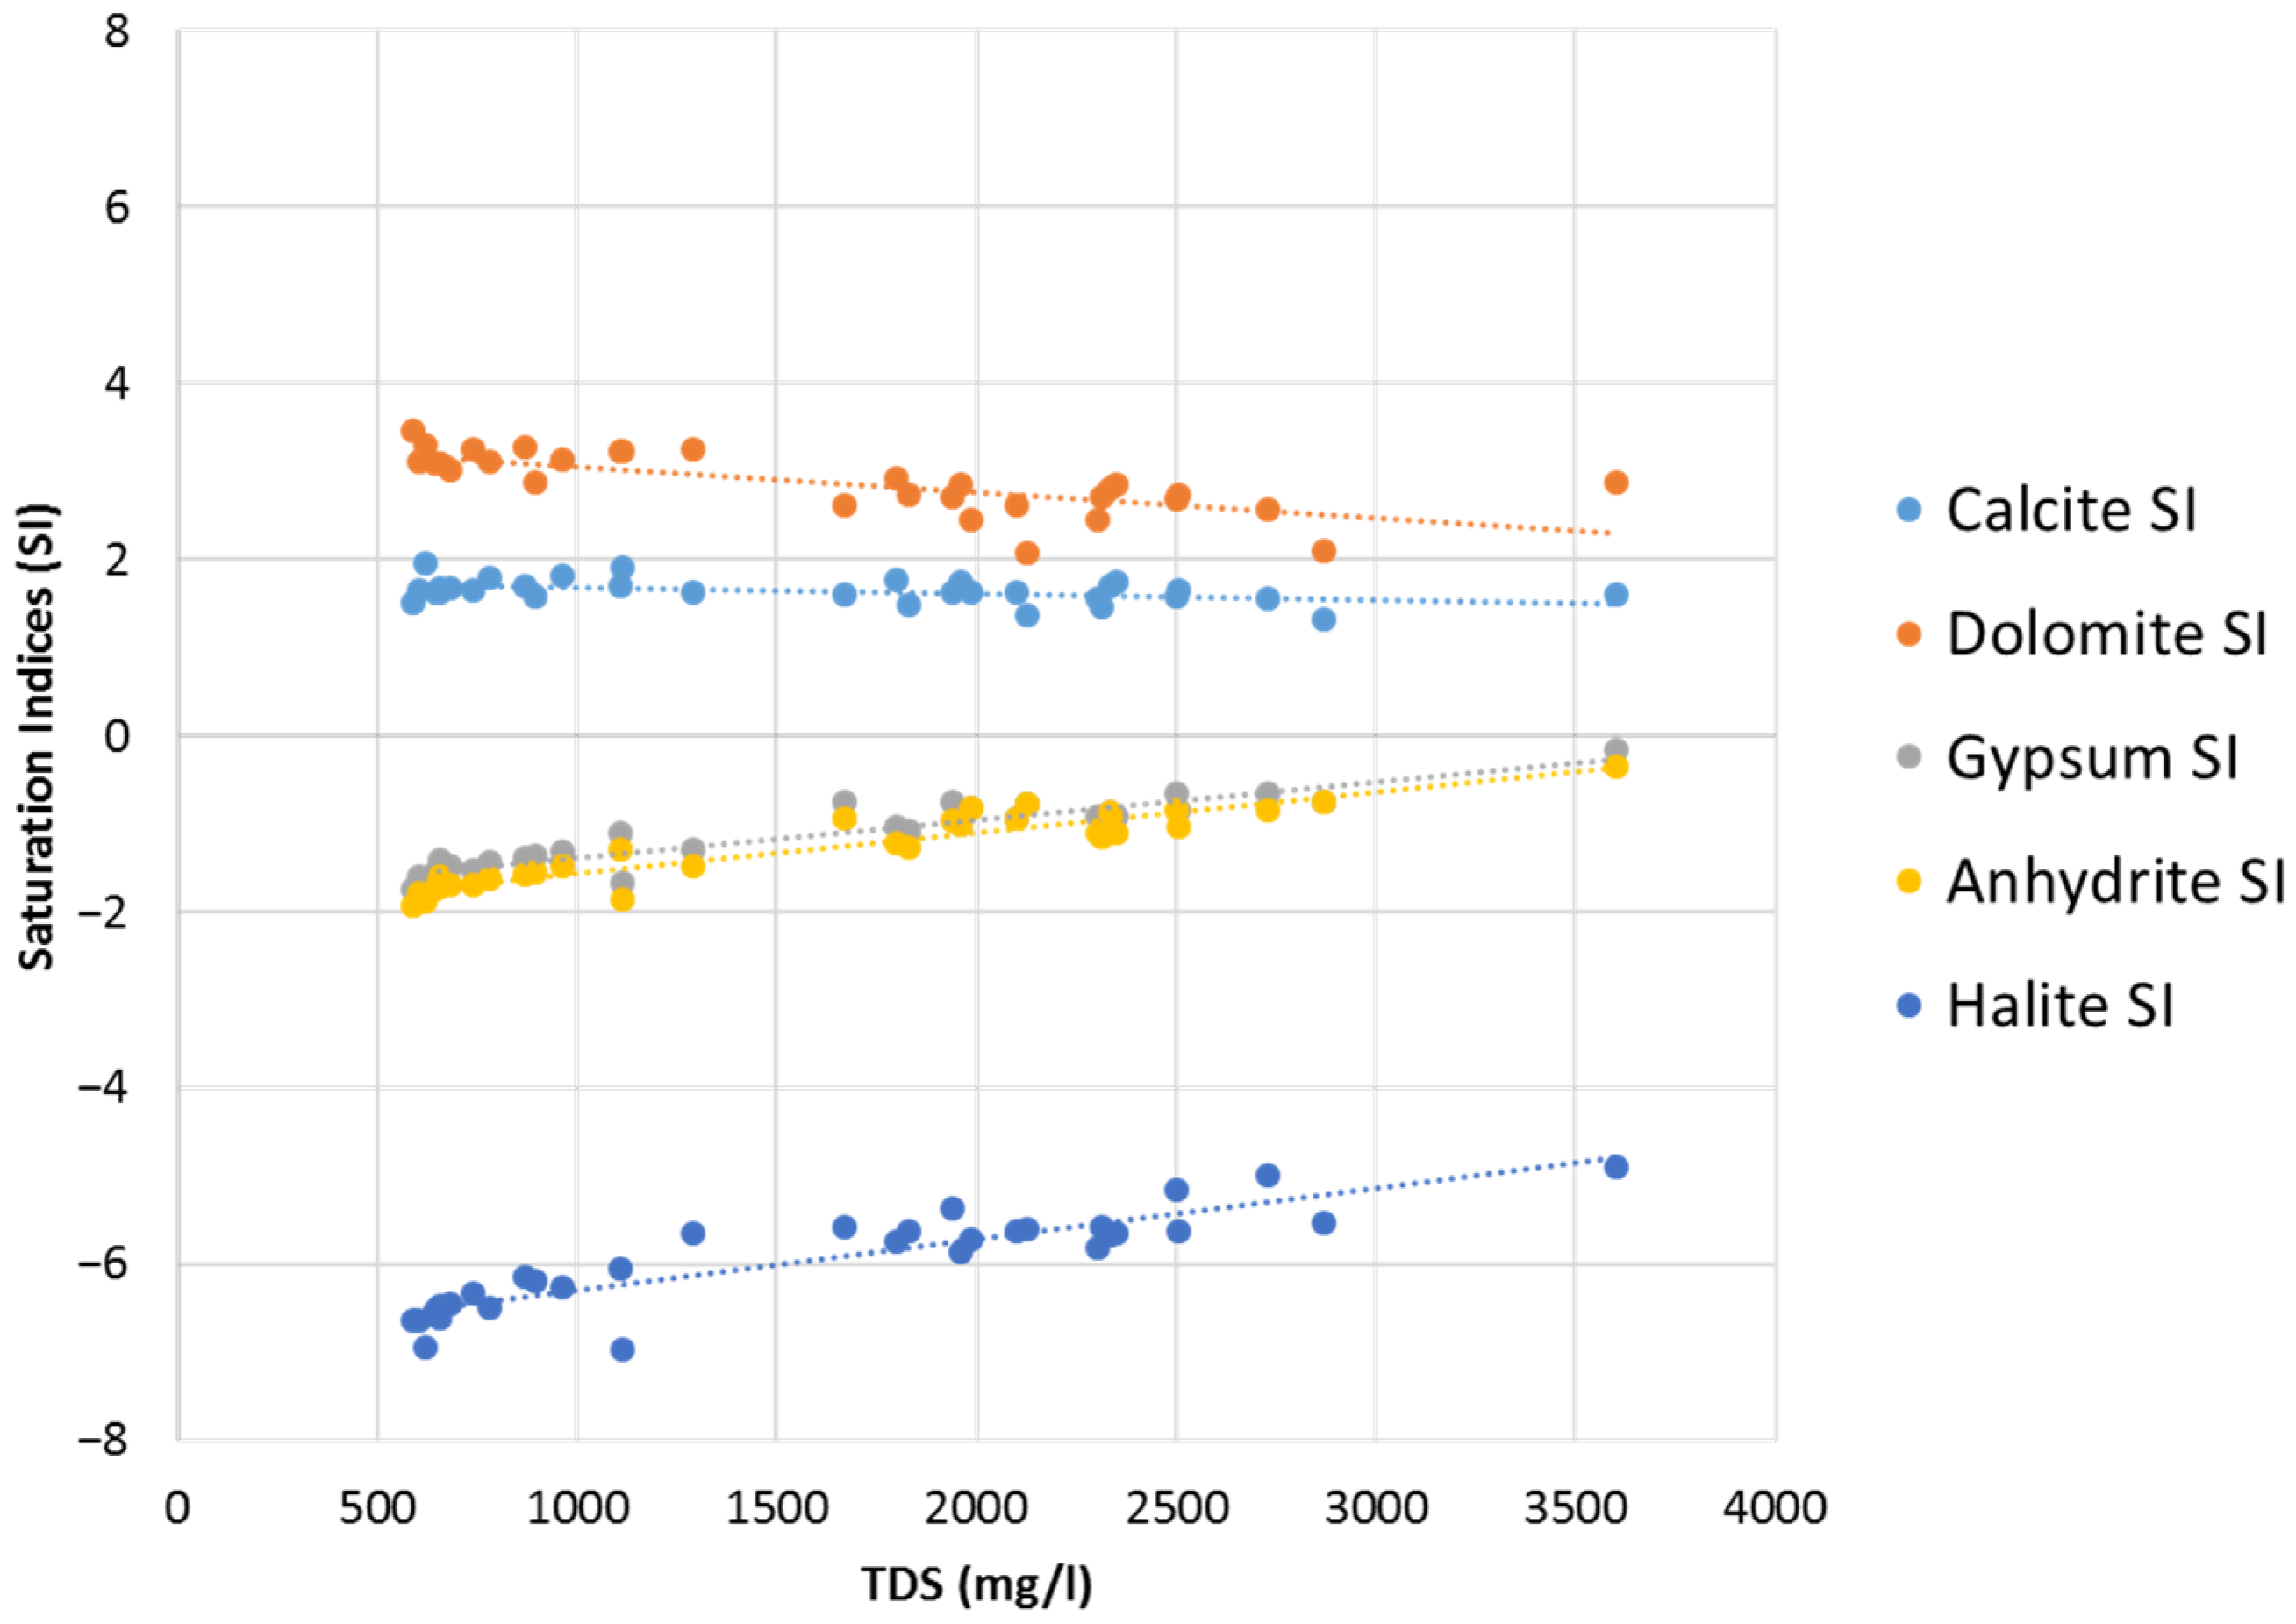
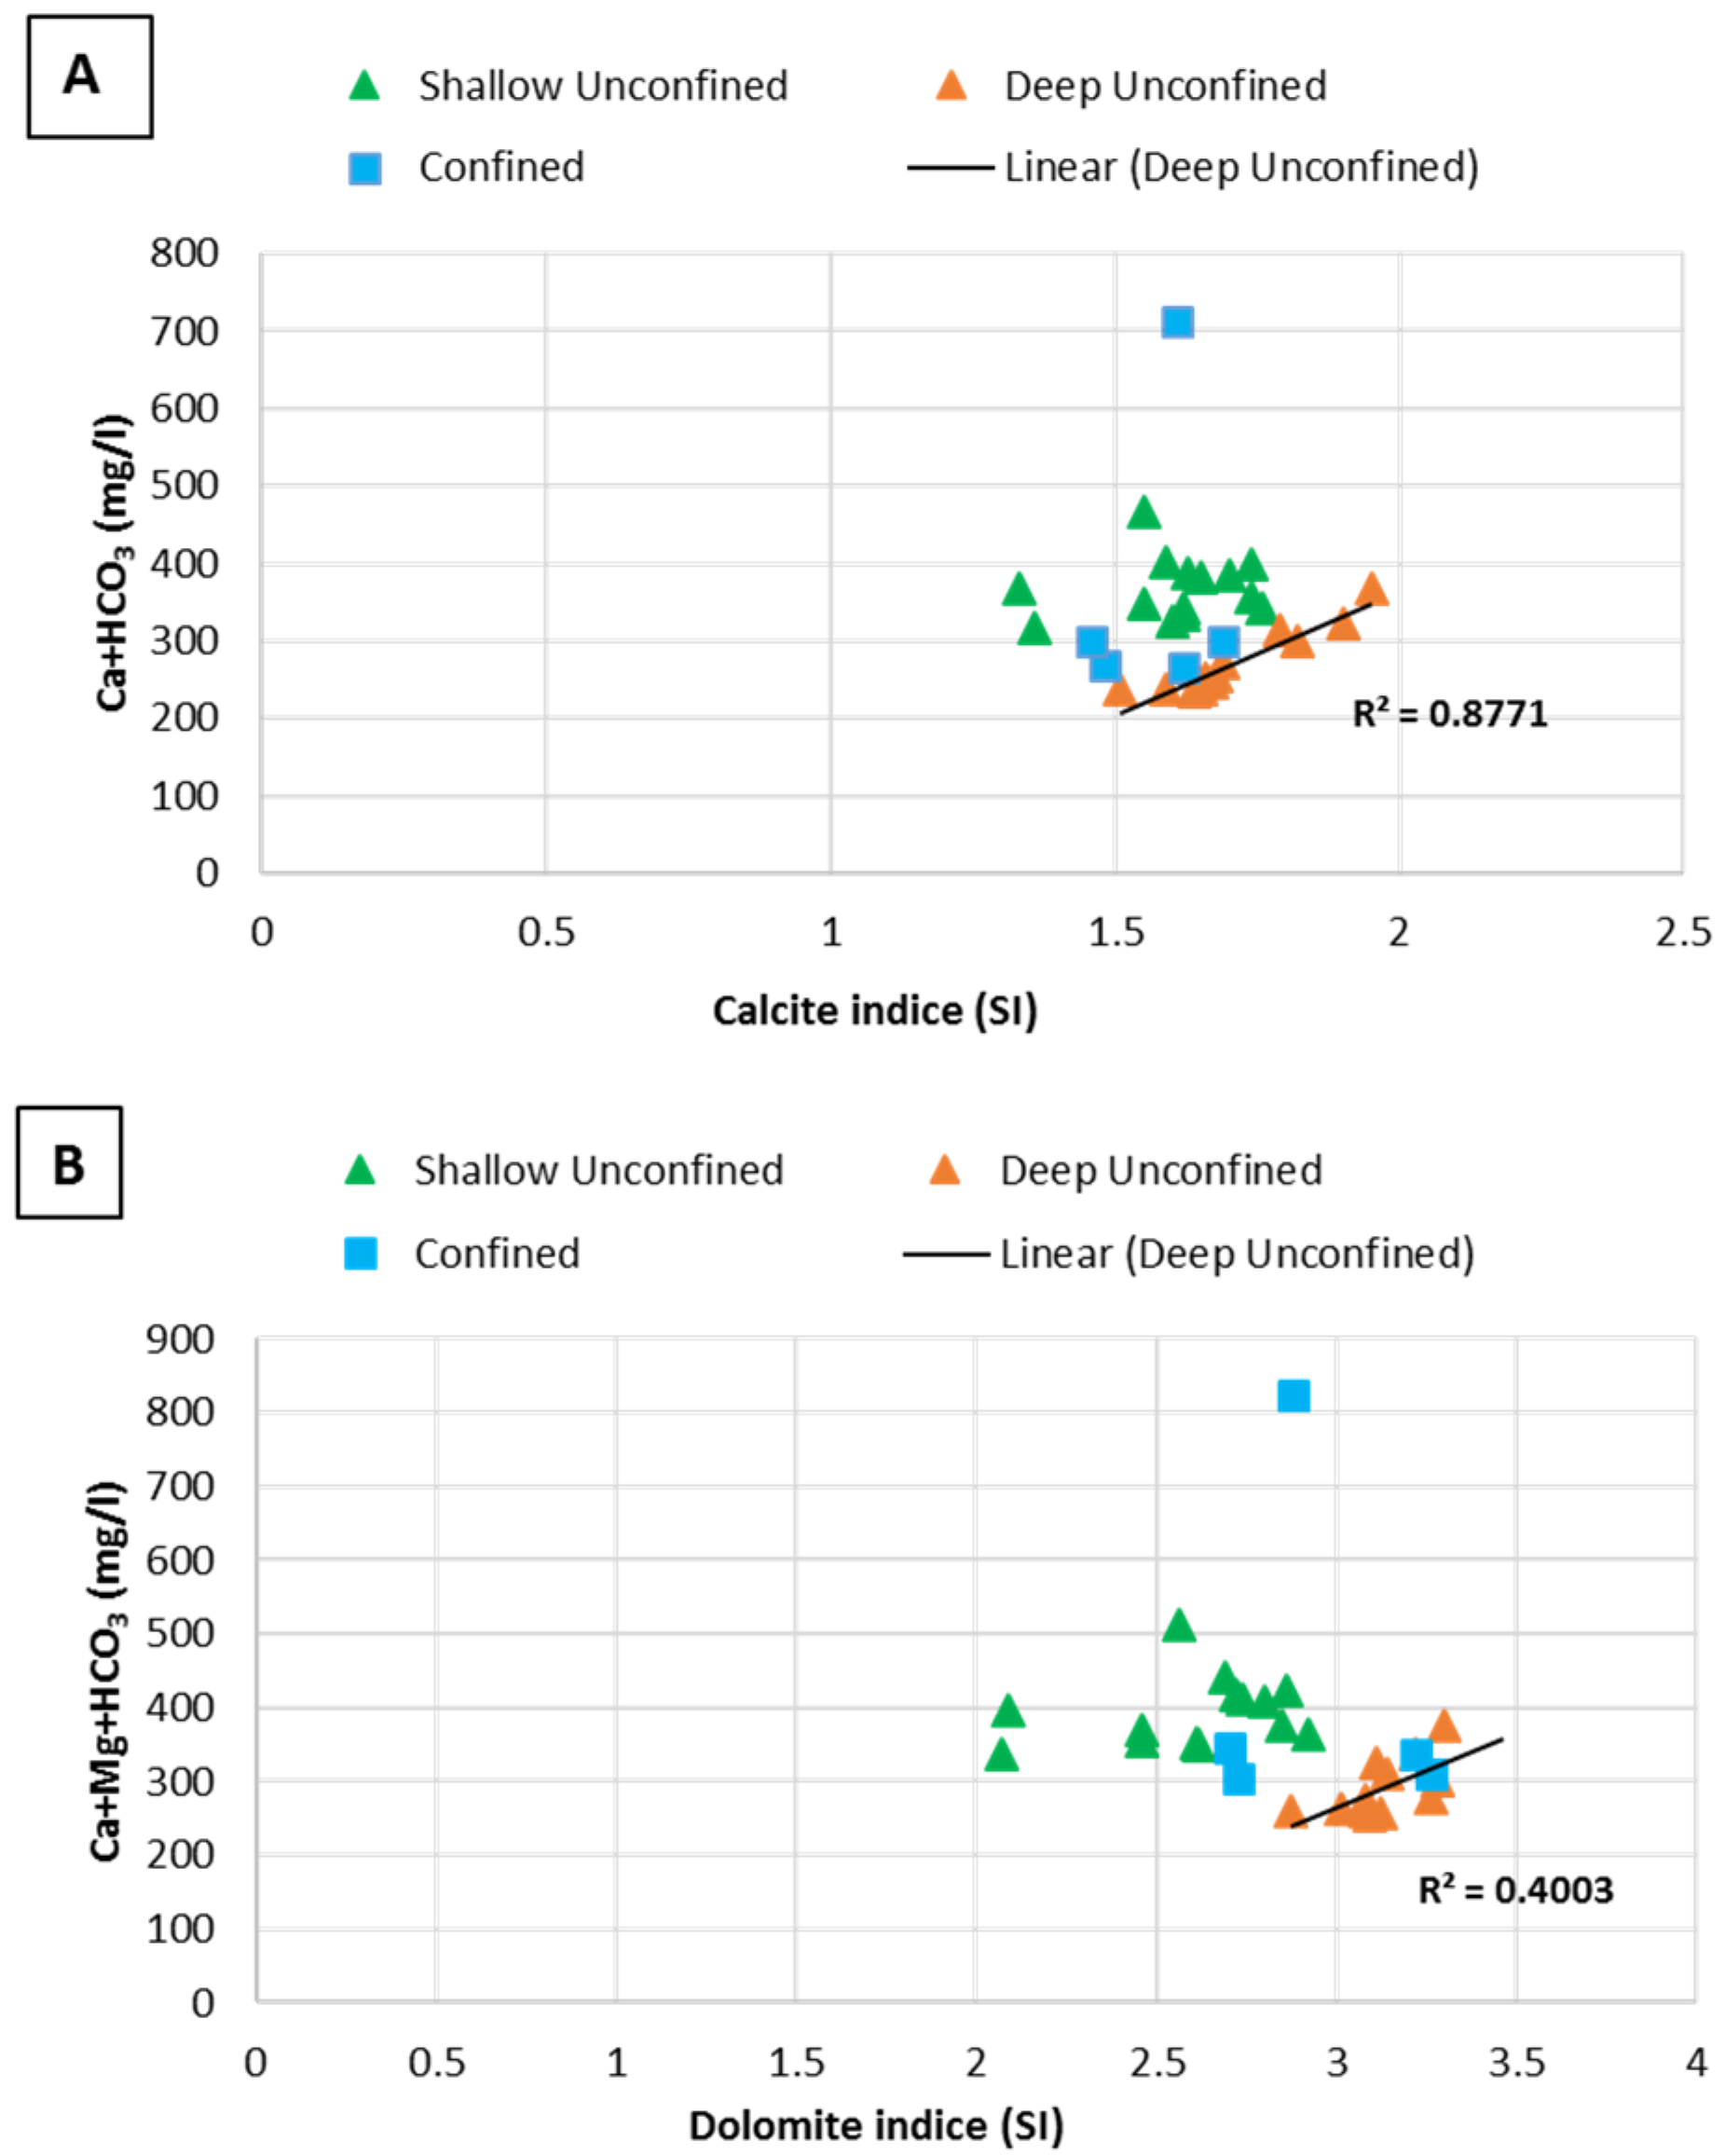
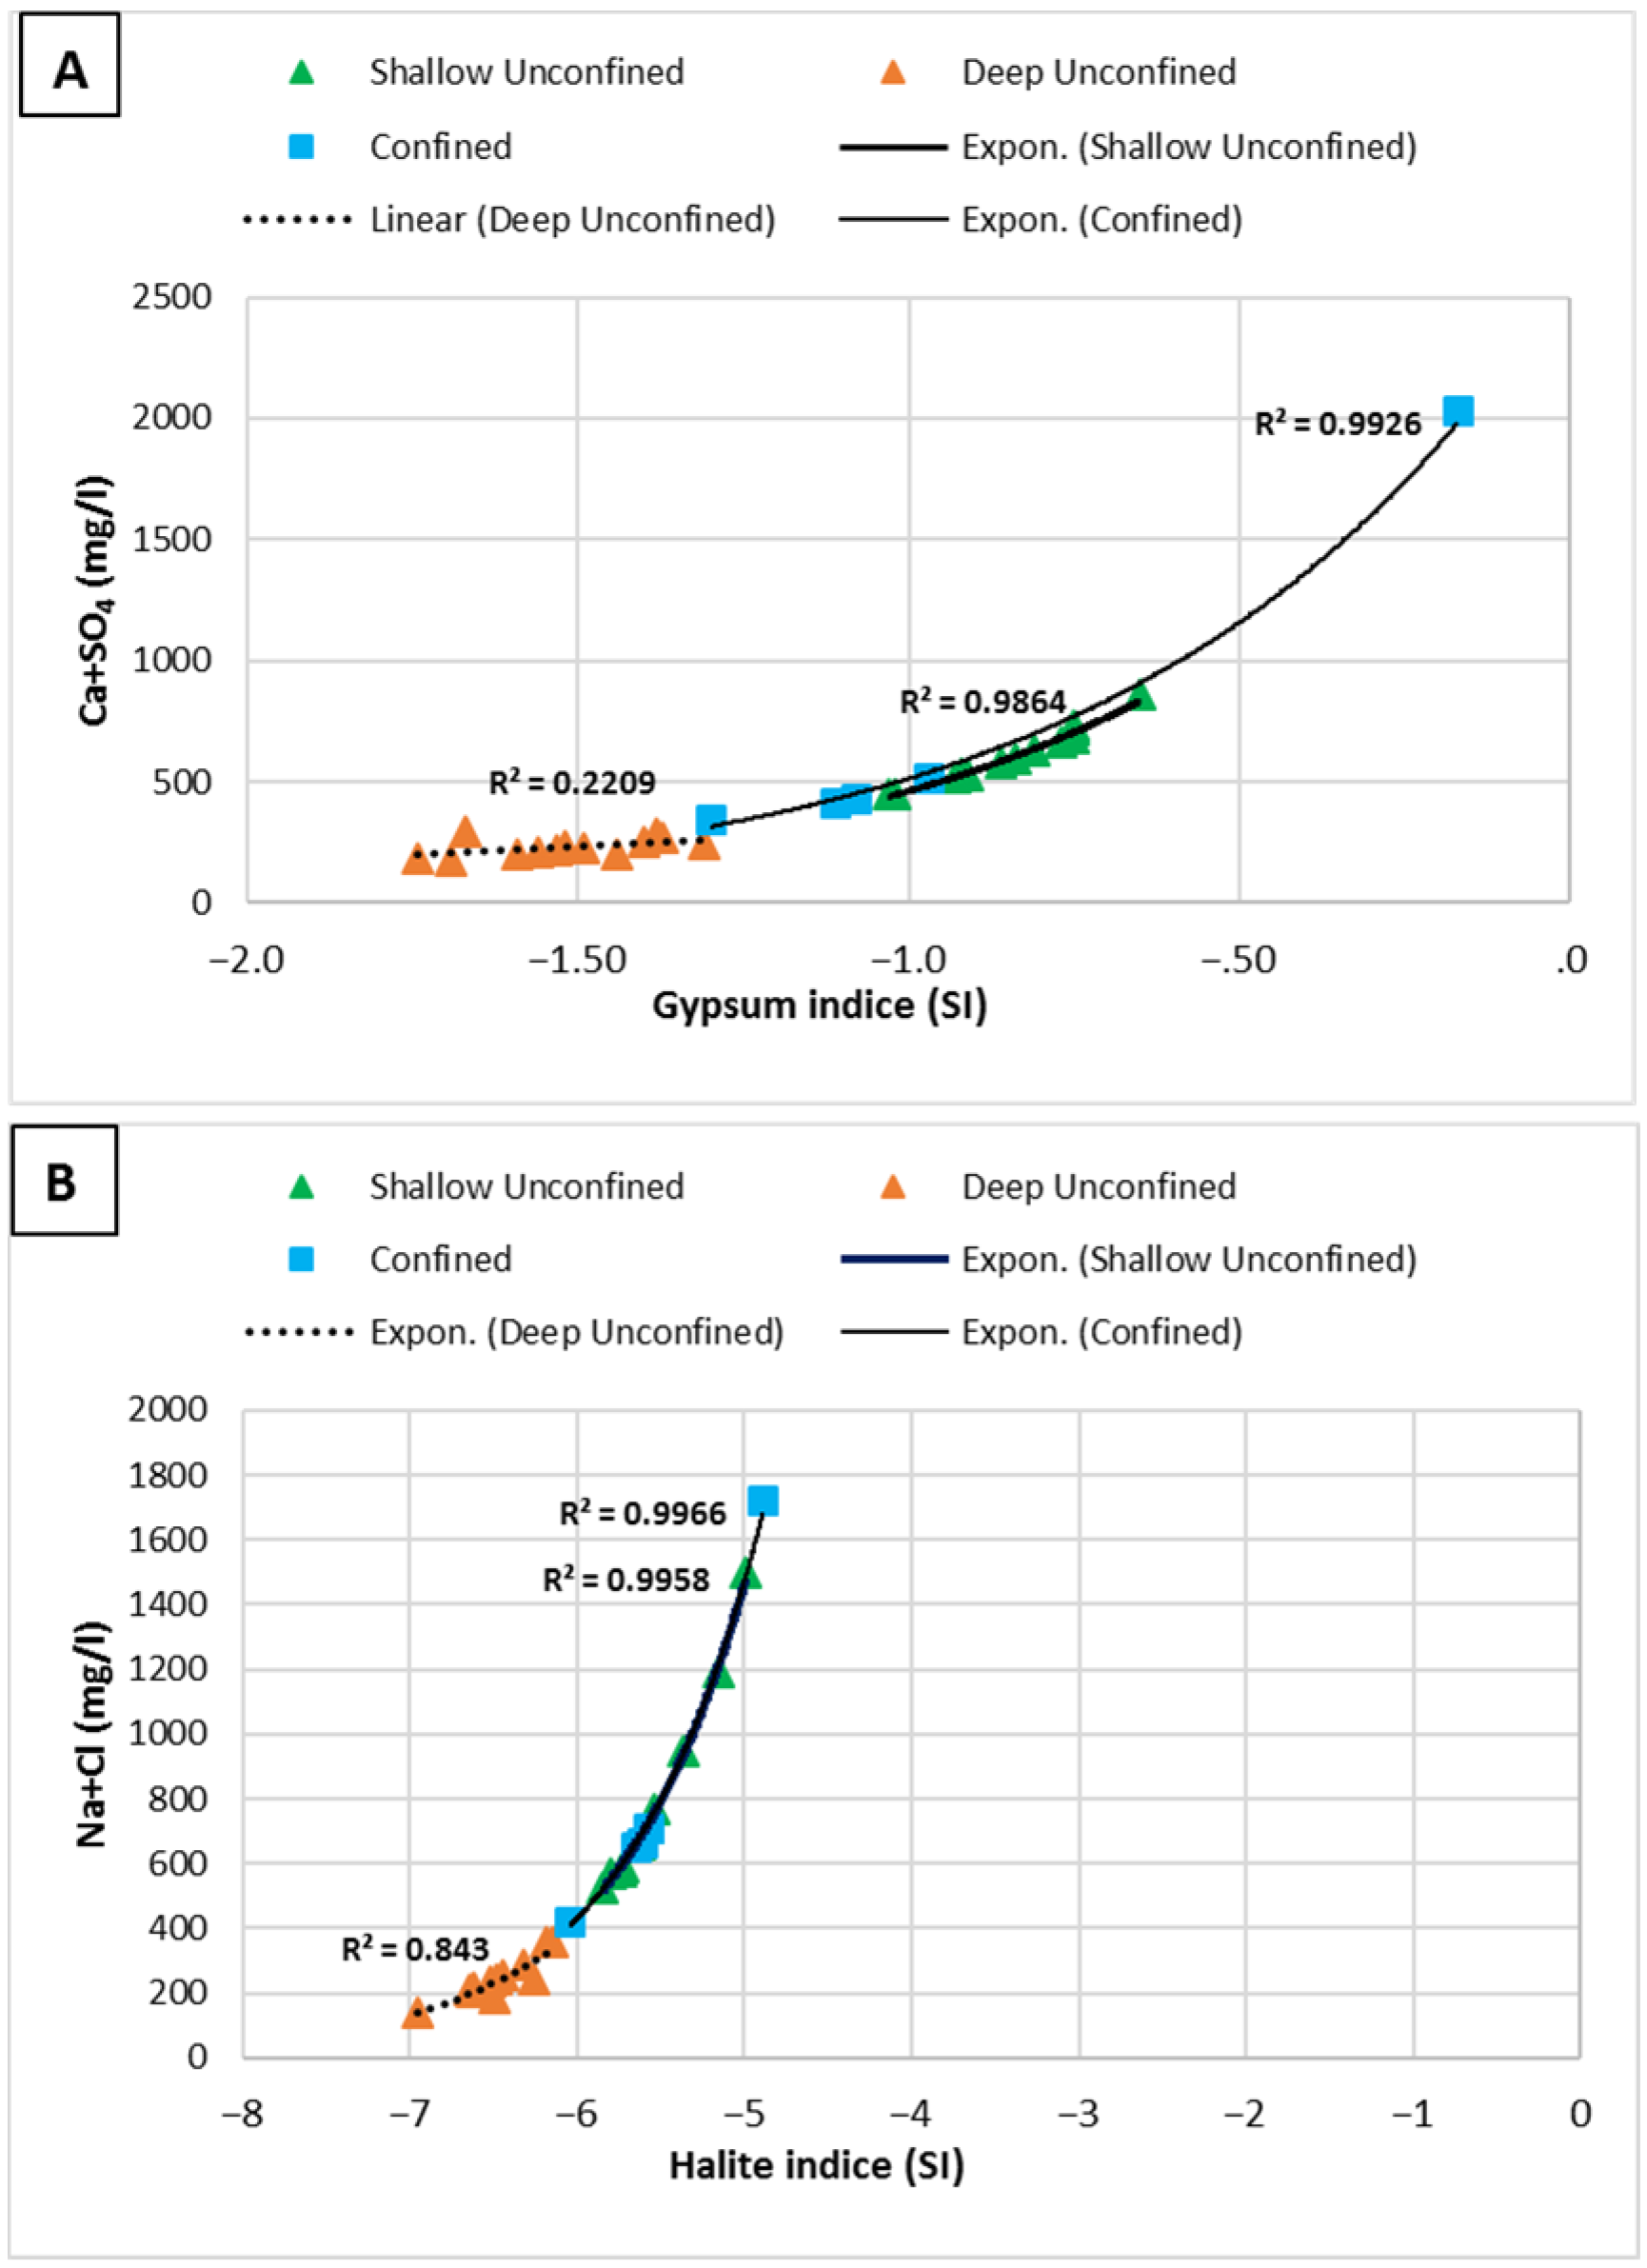
4.2. Saturation Indices
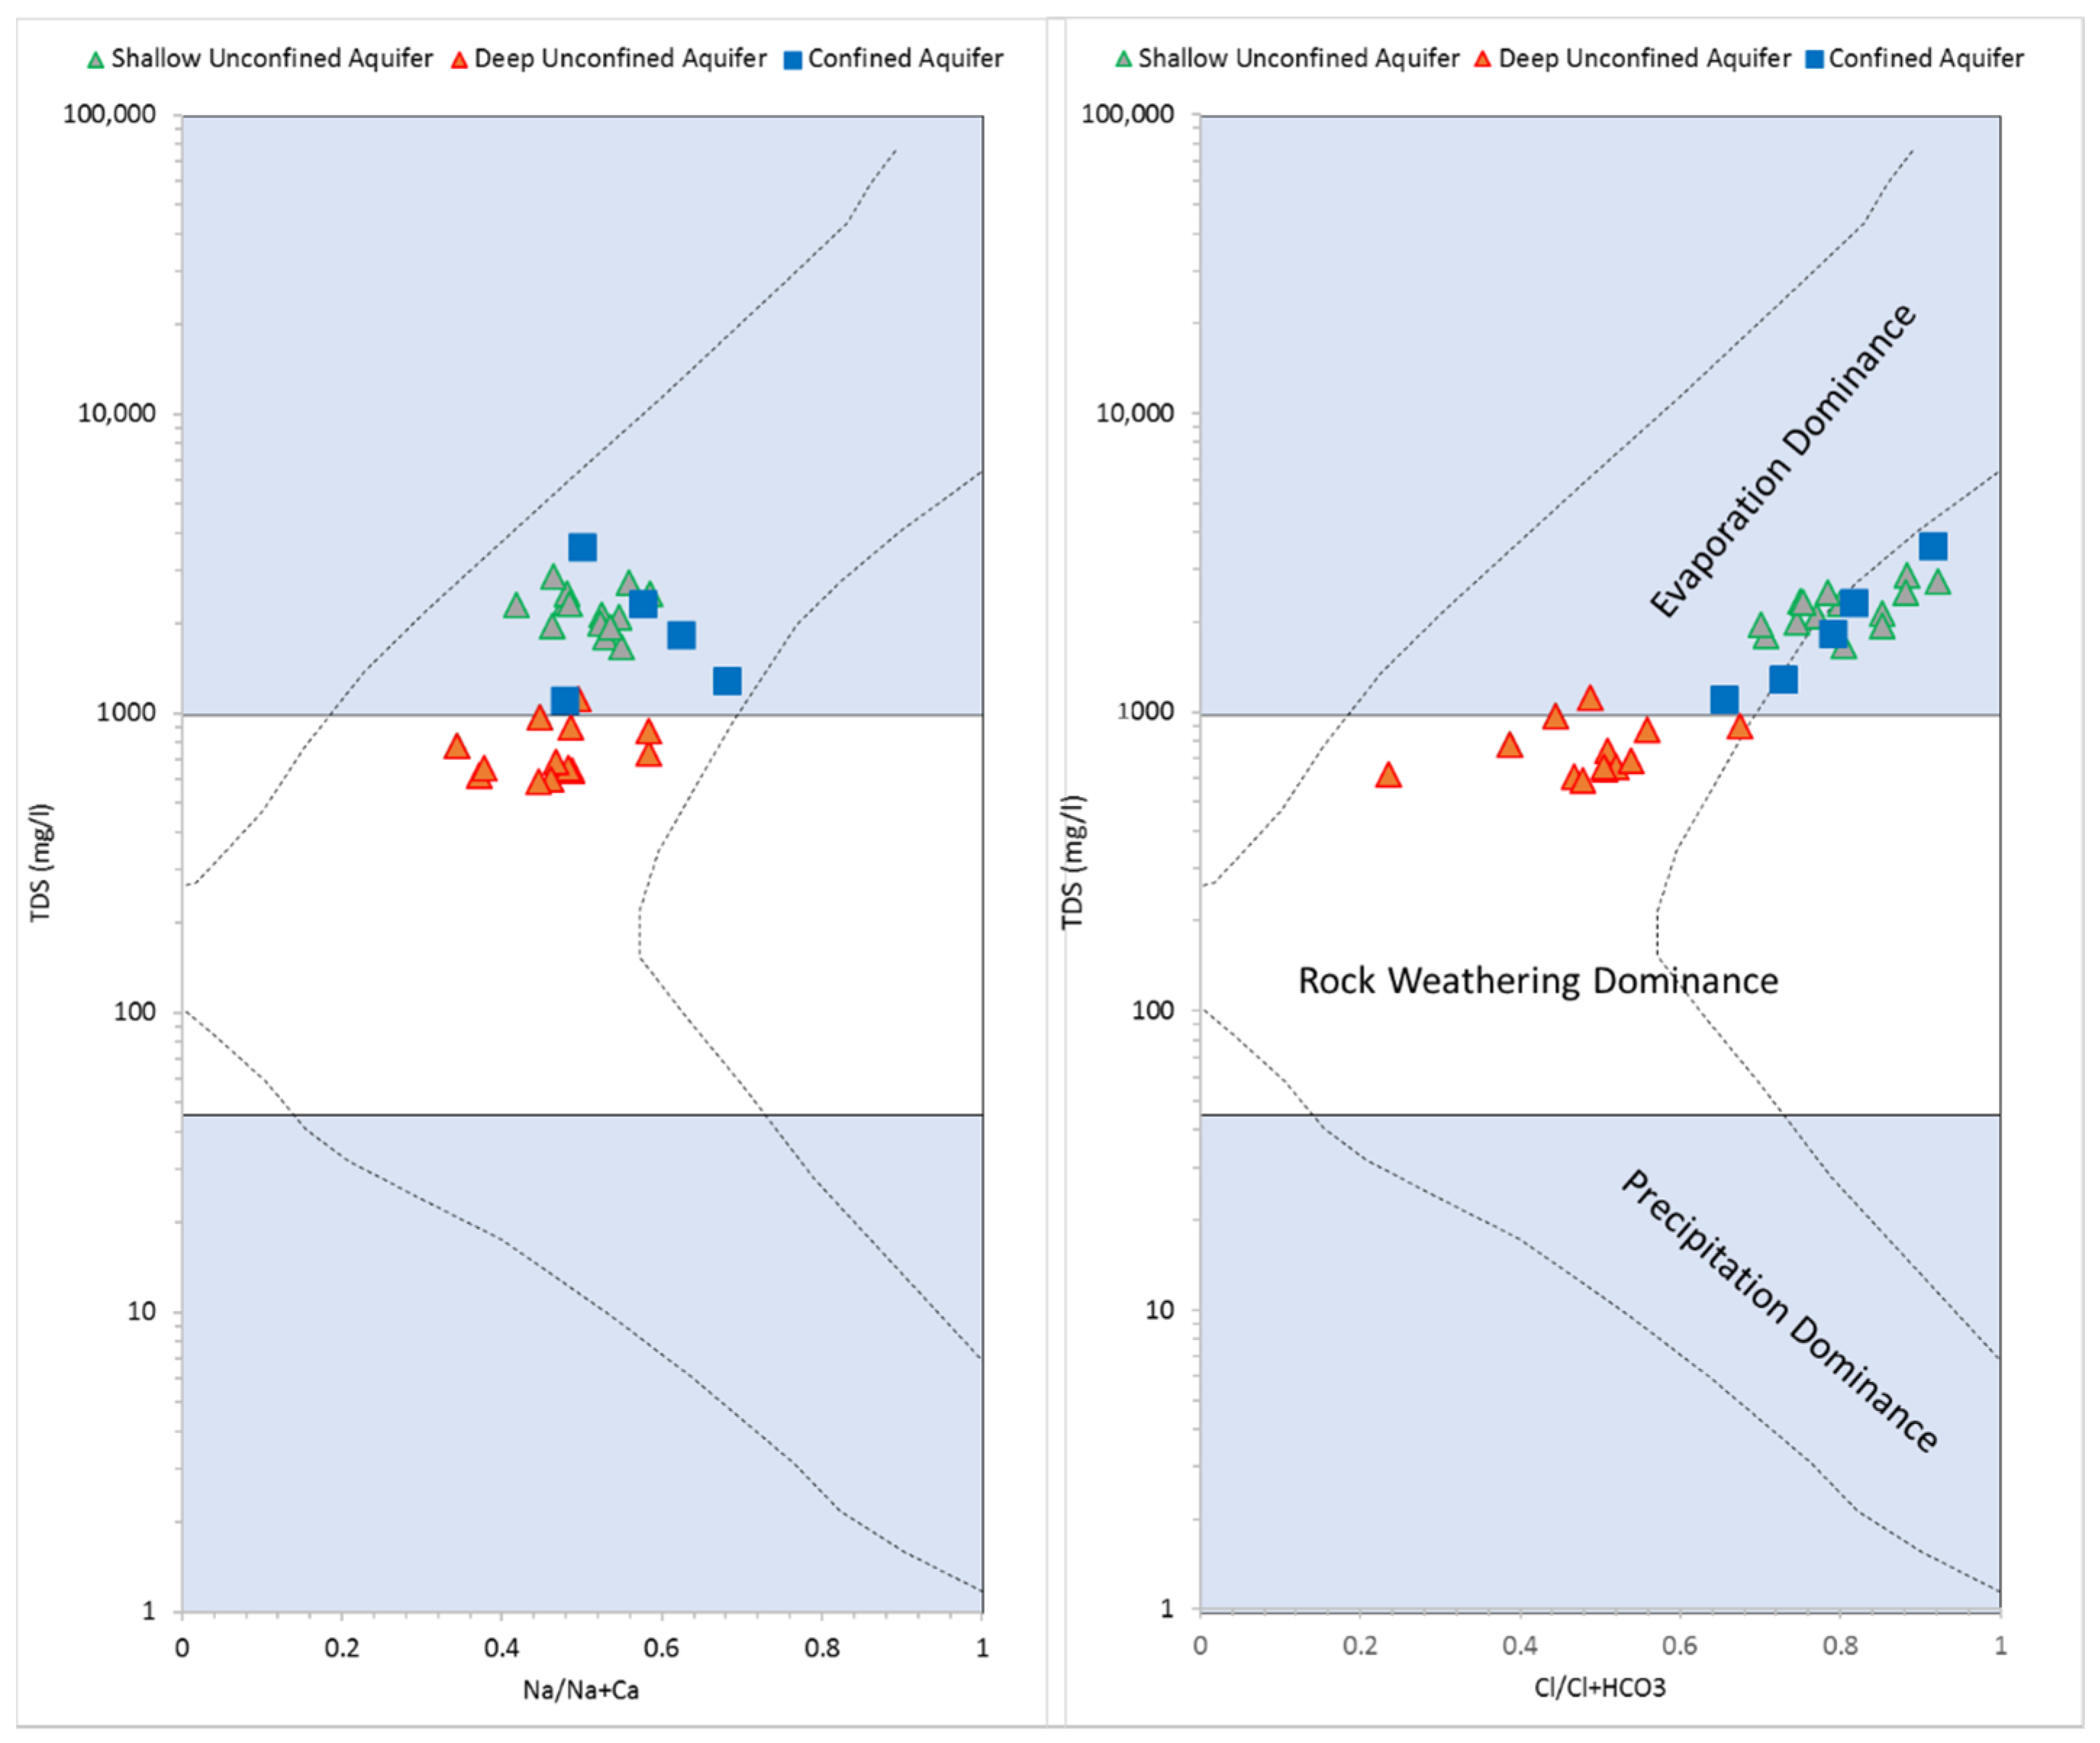
4.3. Groundwater Origin
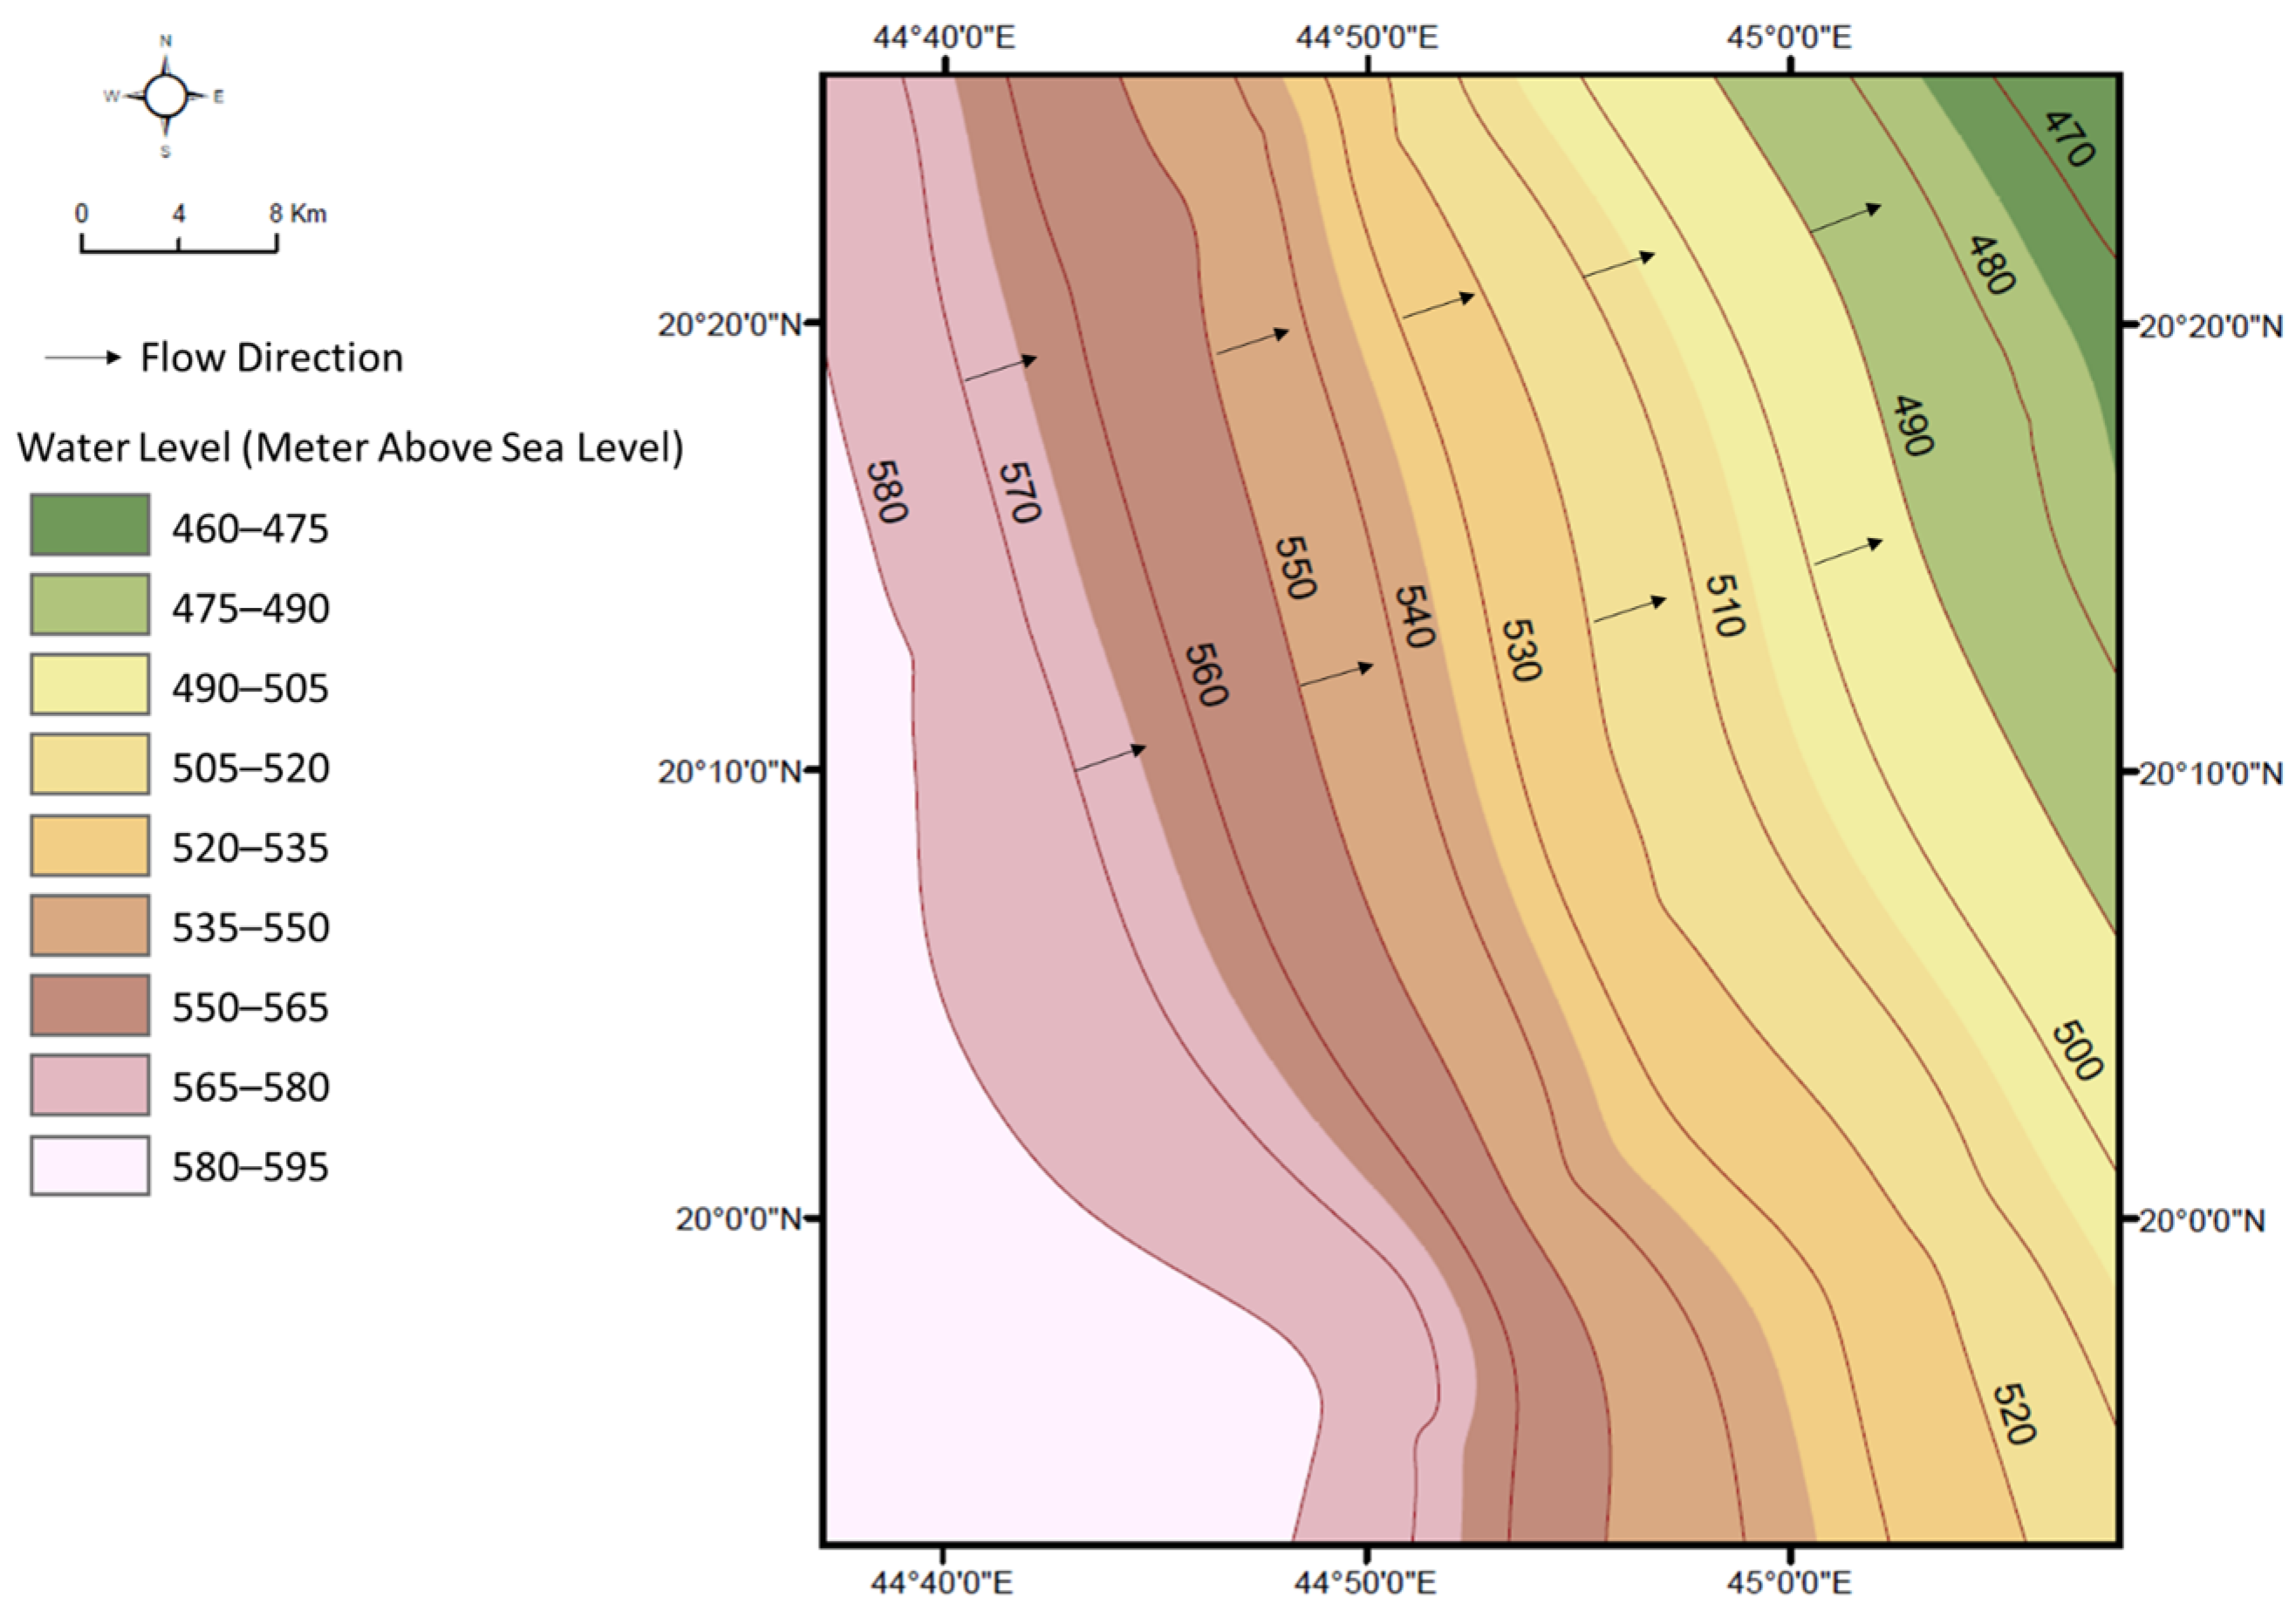
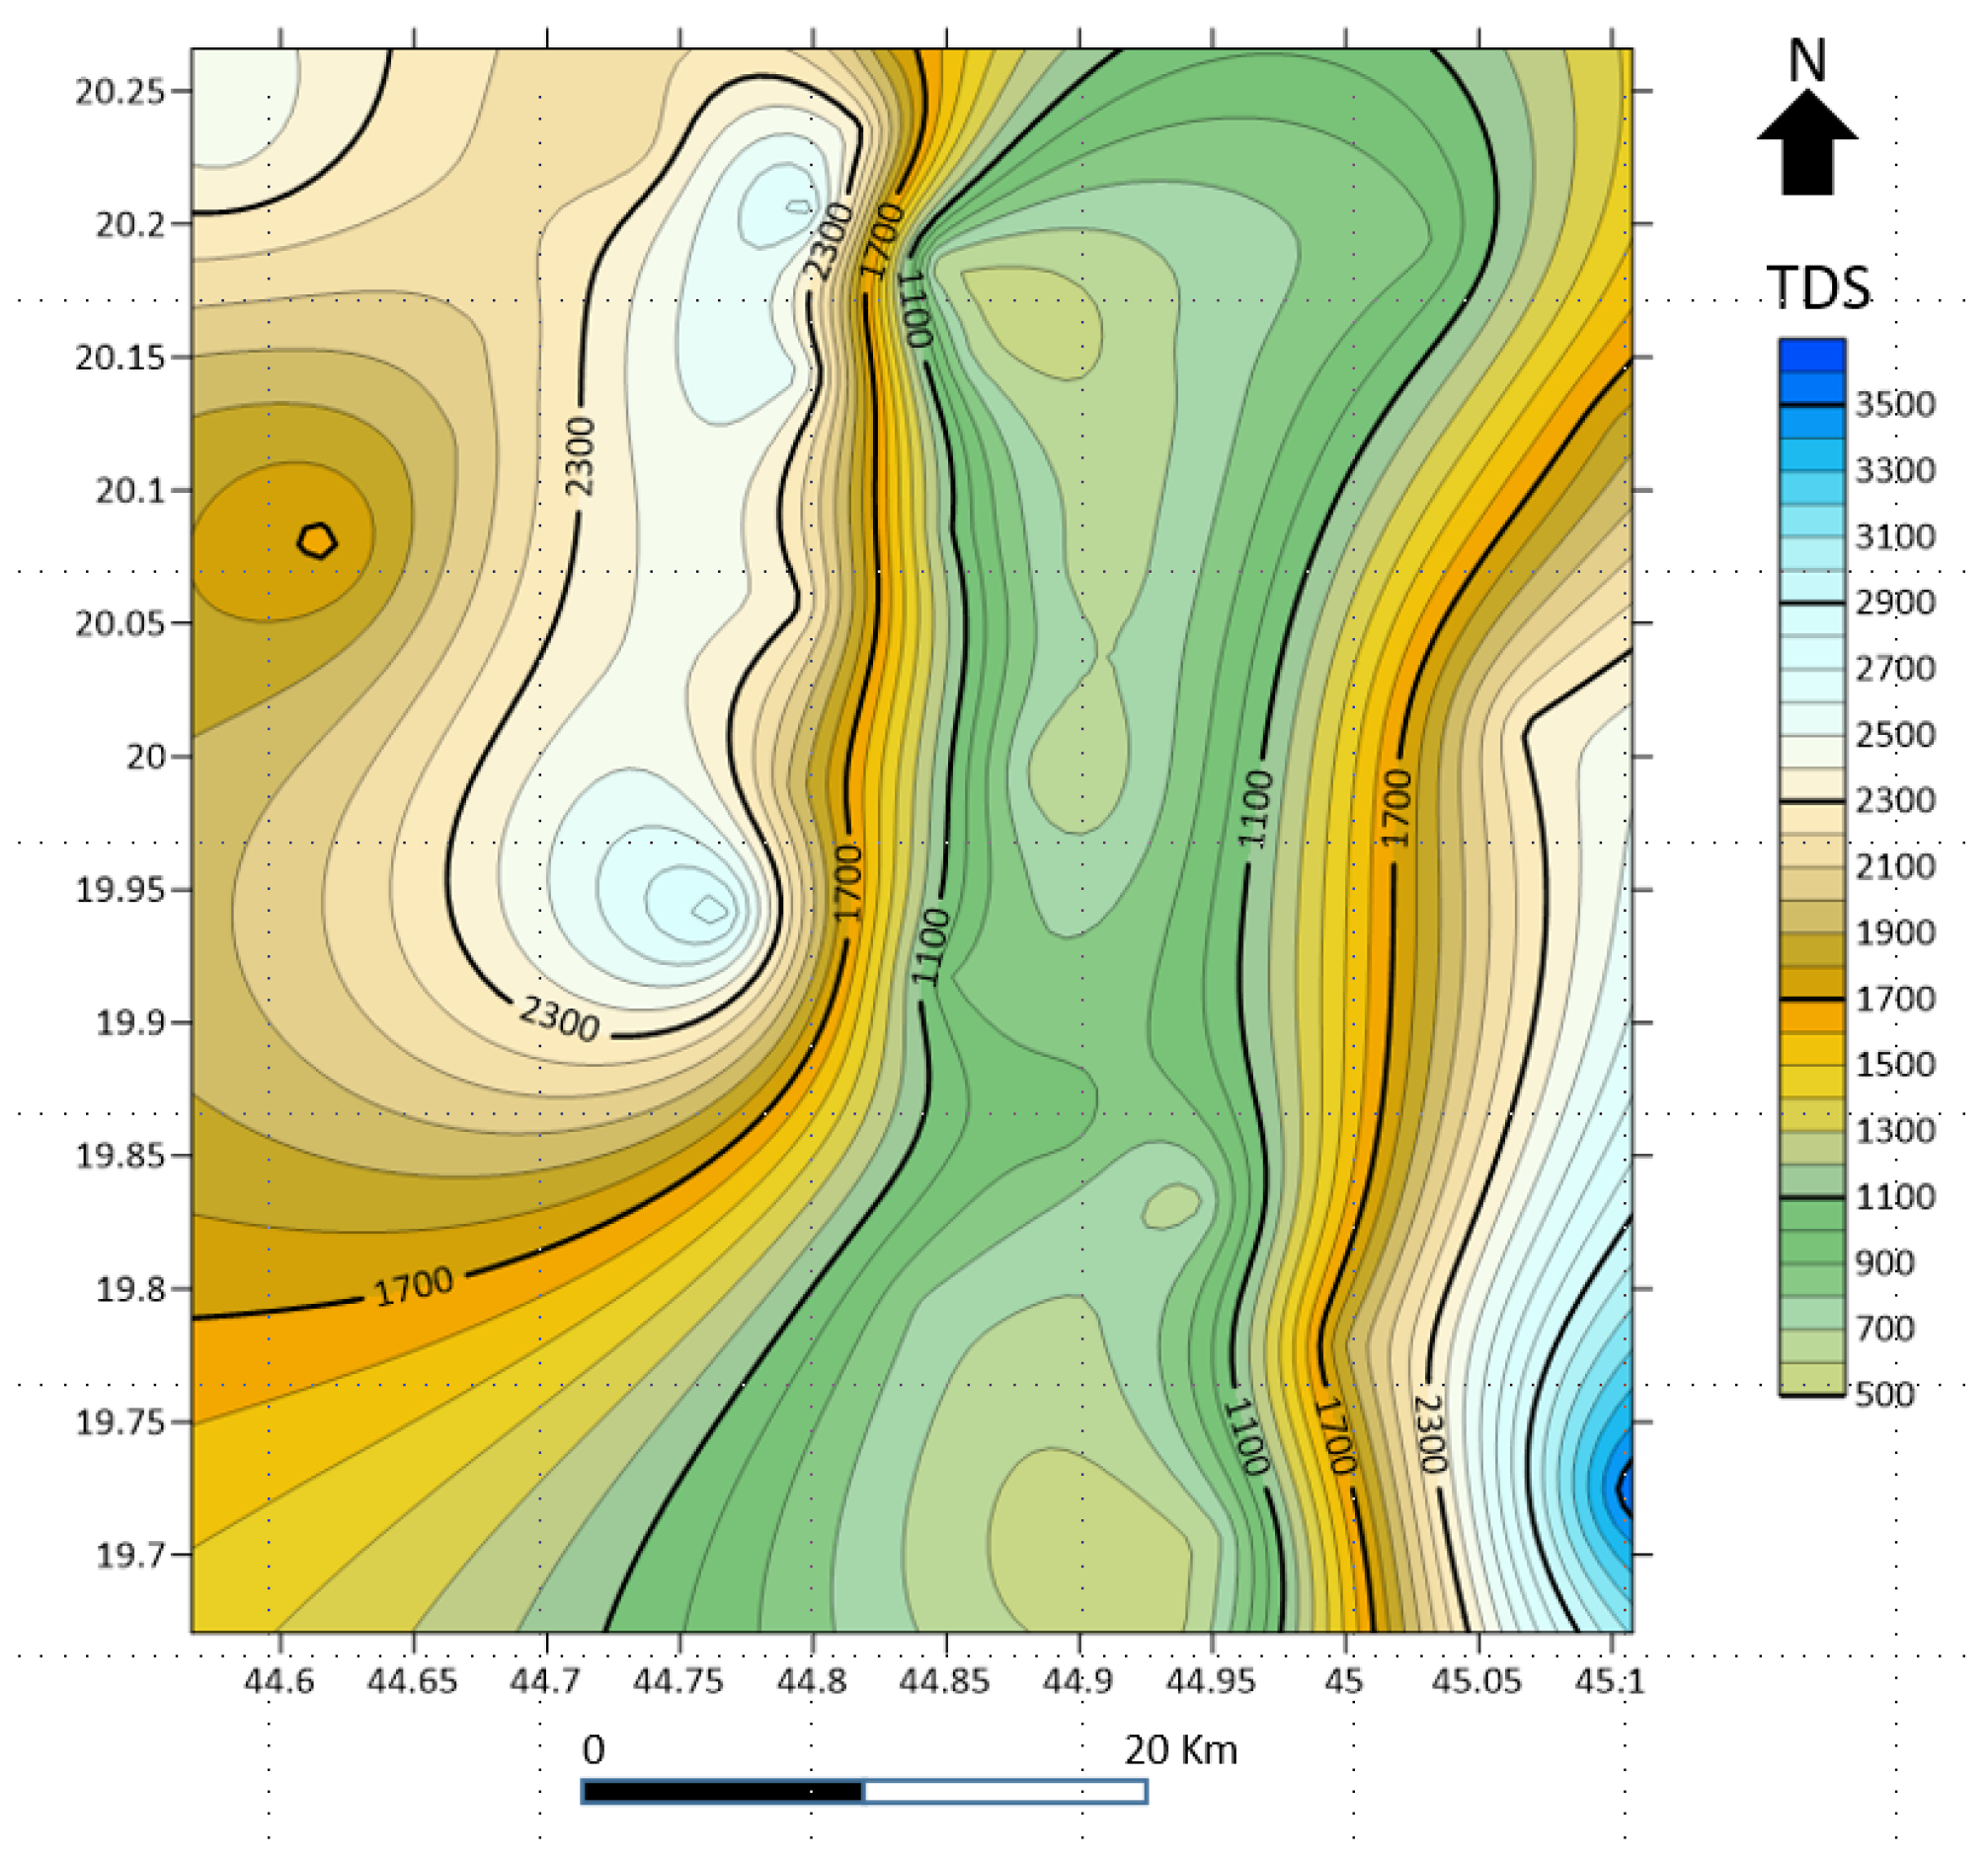
4.4. Spatial Distribution of Salinity
5. Conclusions
Author Contributions
Funding
Institutional Review Board Statement
Informed Consent Statement
Data Availability Statement
Acknowledgments
Conflicts of Interest
References
- Ministry of Water & Electricity (MoWE). Ministry of Water & Electricity: Detailed Water Resources Studies of Wajid and Overlying Aquifers; Association with GTZ/DCO—Gesellschaft für Technische Zusammenarbeit & Dornier Consulting; MoWE: Riyadh, Saudi Arabia, 2010; Volume 16, unpublished. [Google Scholar]
- Zhou, P.; Li, M.; Lu, Y. Hydrochemistry and isotope hydrology for groundwater sustainability of the coastal multilayered aquifer system (Zhanjiang, China). Geofluids 2017, 2017. [Google Scholar] [CrossRef] [Green Version]
- Powers, R.W.; Ramirez, L.F.; Redmond, C.D.; Elberg, E.L.J. Geology of the Arabian Peninsula Sedimentary Geology of Saudi Arabia. U.S. Geol. Surv. Prof. Pap. 1966, 560-D, 154. [Google Scholar]
- Kellogg, K.S.; Fourniguet, J.; Janjou, J.; Minoux, L. Geologic Map of the Wadi Tathlith Quadrangle; Sheet-20G, Saudi Arabian Deputy Ministry for Mineral Resources, Map GM-103 A, Scale; Saudi Arabian Deputy Ministry for Mineral Resources: Riyadh, Saudi Arabia, 1986.
- Edgell, H.S. Aquifers of Saudi Arabia and their geological framework. Arab. J. Sci. Eng. 1997, 22, 3–31. [Google Scholar]
- Wagner, W. Groundwater in the Arab Middle East, 1st ed.; Springer: Berlin/Heidelberg, Germany, 2011. [Google Scholar]
- Al Ajmi, H. Matrix versus fracture permeability in a regional sandstone aquifer (Wajid sandstone, SW Saudi Arabia). Grundwasser 2014, 19, 151–157. [Google Scholar] [CrossRef]
- Piper, A.M. A graphic procedure in the geochemical interpretation of water-analyses. Trans. Am. Geophys. Union 1944, 25, 914. [Google Scholar] [CrossRef]
- Datta, P.; Tyagi, S. Major ion chemistry of groundwater in Delhi area: Chemical weathering processes and groundwater flow regime. J. Geol. Soc. India 1996, 47, 179–188. [Google Scholar]
- Moshrif, M.A.; El-Hiti, A. Lithofacies and petrography of Wajid sandstone (Cambrian-Ordovician) Saudi Arabia. J. Afr. Earth Sci. 1989, 9, 401–412. [Google Scholar] [CrossRef]
- Babalola, L.O. Depositional Environments and Provenance of the Wajid Sandstone, Abha-Khamis Mushayt Area, Southwestern Saudi Arabia. Master’s Thesis, King Fahd University of Petroleum and Minerals, Dhahran, Saudi Arabia, 1999. [Google Scholar]
- Babalola, O.; Hussain, M.; Hariri, M. Origin of iron-rich beds in the basal Wajid Sandstone, Abha-Khamis Mushayt area, southwest Saudi Arabia. Arab. J. Sci. Eng. 2003, 28, 1–24. [Google Scholar]
- Wanas, H.A.; Abdel-Maguid, N.M. Petrography and geochemistry of the Cambro-Ordovician Wajid Sandstone, southwest Saudi Arabia: Implications for provenance and tectonic setting. J. Asian Earth Sci. 2006, 27, 416–429. [Google Scholar] [CrossRef]
- Siddiqi, S.A.T.A. Depositional Environments and Facies Reservoir Properties of the Khusayyayan Member, Wajid Sandstone, Saudi Arabia. Master’s Thesis, King Fahd University of Petroleum and Minerals, Dhahran, Saudi Arabia, 2007. [Google Scholar]
- Mergany, M. Geological and Statistical Reservoir Characteristics of the Late Carboniferous-Permian Juwayl Member (Wajid Sandstone), Southwestern Saudi Arabia. Master’s Thesis, King Fahd University of Petroleum and Minerals, Dhahran, Saudi Arabia, 2007. [Google Scholar]
- Bassis, A.; Hinderer, M.; Meinhold, G. Petrography and geochemistry of Palaeozoic quartz-rich sandstones from Saudi Arabia: Implications for provenance and chemostratigraphy. Arab. J. Geosci. 2016, 9, 400. [Google Scholar] [CrossRef] [Green Version]
- Benaafi, M.; Hariri, M.; Al-Shaibani, A.; Abdullatif, O.; Makkawi, M. Integrated geomechanical, petrographical and petrophysical study of the sandstones of the Wajid Group, SW Saudi Arabia. J. Afr. Earth Sci. 2018, 143, 162–177. [Google Scholar] [CrossRef]
- Schoeller, H. Geochemistry of Groundwater. In Groundwater Studies—An International Guide for Research and Practice; UNESCO: Paris, France, 1977. [Google Scholar]
- Schoeller, H. Qualitative Evaluation of Groundwater Resources. In Methods and Techniques of Groundwater Investigations and Development; United Nations Educational, Scientific and Cultural Organization (UNESCO): Paris, France, 1965; pp. 54–83. [Google Scholar]
- Parkhurst, D.L.; Appelo, C.A.J. Description of Input and Examples for Phreeqc Version 3: A Computer Program for Speciation, Batch-Reaction, One-Dimensional Transport, and Inverse Geochemical Calculations; US Geological Survey Publications: Austin, TX, USA, 2013.
- Appelo, C.; Postma, D. Geochemistry Groundwater and Pollution, 2nd ed.; Balkema Publication: Rotterdam, The Netherlands, 2005. [Google Scholar]
- Han, D.M.; Song, X.F.; Currell, M.J.; Yang, J.L.; Xiao, G.Q. Chemical and isotopic constraints on evolution of groundwater salinization in the coastal plain aquifer of Laizhou Bay, China. J. Hydrol. 2014, 508, 12–27. [Google Scholar] [CrossRef]
- Mook, W.G.; Rozanski, K. Environmental Isotopes in the Hydrological Cycle: Principles and Applications; International Atomic Energy Agency: Vienna, Austria; UNESCO: Paris, France, 2000. [Google Scholar]
- Michelsen, N.; Reshid, M.; Siebert, C.; Schulz, S.; Knöller, K.; Weise, S.; Rausch, R.; Al-Saud, M.; Schüth, C. Isotopic and chemical composition of precipitation in Riyadh, Saudi Arabia. Chem. Geol. 2015, 5, 413. [Google Scholar] [CrossRef]
- Zeeb, C.; Göckus, D.; Bons, P.; Al Ajmi, H.; Rausch, R.; Blum, P. Fracture flow modelling based on satellite images of the Wajid Sandstone, Saudi Arabia. Hydrogeol. J. 2010, 18, 1699–1712. [Google Scholar] [CrossRef]
- Benaafi, M.; Hariri, M.; Abdullatif, O.; Makkawi, M.; Al-Shaibani, A. Analysis of lineaments within the Wajid Group, SW Saudi Arabia, and their tectonic significance. Arab. J. Geosci. 2017, 10. [Google Scholar] [CrossRef]


| Ca2+ (mg/L) | Mg2+ (mg/L) | Na+ (mg/L) | K+ (mg/L) | HCO3– (mg/L) | Cl– (mg/L) | SO42– (mg/L) | NO32– (mg/L) | TDS (mg/L) | pH | ||
|---|---|---|---|---|---|---|---|---|---|---|---|
| Shallow unconfined aquifer | Maximum | 380.00 | 44.70 | 481.00 | 13.10 | 147.90 | 1020.00 | 561.00 | 108.00 | 2868 | 8.1 |
| Minimum | 195.69 | 14.29 | 179.31 | 0.00 | 67.14 | 344.96 | 240.14 | 8.69 | 1670 | 7.0 | |
| Average | 255.10 | 25.60 | 272.13 | 3.43 | 113.08 | 494.96 | 372.90 | 31.31 | 2226 | 7.6 | |
| Deep unconfined aquifer | Maximum | 124.66 | 28.00 | 136.00 | 16.90 | 278.42 | 242.00 | 189.00 | 18.60 | 1116 | 8.0 |
| Minimum | 80.00 | 7.78 | 52.13 | 2.29 | 117.00 | 85.69 | 90.27 | 2.20 | 591 | 7.0 | |
| Average | 98.42 | 18.36 | 87.84 | 7.48 | 171.68 | 161.70 | 131.67 | 6.86 | 755 | 7.4 | |
| Confined aquifer | Maximum | 610.50 | 110.70 | 608.70 | 12.40 | 156.00 | 1115.00 | 1427.00 | 122.50 | 3600 | 8.0 |
| Minimum | 110.80 | 35.31 | 135.70 | 1.52 | 97.59 | 286.00 | 236.00 | 6.40 | 1109 | 6.9 | |
| Average | 247.41 | 54.02 | 306.05 | 7.85 | 122.09 | 528.85 | 501.52 | 36.29 | 2028 | 7.5 |
| Sample Number | Aquifer | Oxygen-18 | Deuterium |
|---|---|---|---|
| UW−01 | Shallow Unconfined Aquifer | −4.46 | −24.99 |
| UW−04 | −3.93 | −20.06 | |
| UW−05 | −4.03 | −21.62 | |
| UW−06 | −4.53 | −28.18 | |
| UW−09 | −4.79 | −30.13 | |
| UW−10 | −5.09 | −34.08 | |
| UW−11 | −5.51 | −38.53 | |
| UW−12 | −3.77 | −25.17 | |
| UW−13 | −3.34 | −19.44 | |
| UW−14 | −3.93 | −26.49 | |
| Min | −5.51 | −38.53 | |
| Max | −3.34 | −19.44 | |
| Average | −4.34 | −26.87 | |
| UW−02 | Deep Unconfined Aquifer | −5.71 | −31.69 |
| UW−03 | −4.40 | −21.96 | |
| UW−07 | −4.49 | −20.94 | |
| UW−08 | −3.28 | −10.57 | |
| UW−20 | −5.35 | −28.20 | |
| Min | −5.71 | −31.69 | |
| Max | −3.28 | −10.57 | |
| Average | −4.65 | −22.67 | |
| UW−15 | Unconfined Aquifer | −4.01 | −25.82 |
| UW−16 | −3.73 | −25.14 | |
| UW−17 | −5.71 | −37.50 | |
| UW−18 | −5.25 | −34.40 | |
| UW−19 | −3.54 | −18.40 | |
| Min | −5.71 | −37.50 | |
| Max | −3.54 | −18.40 | |
| Average | −4.45 | −28.25 |
| Sample ID | Aquifer | Calcite SI | Dolomite SI | Gypsum SI | Anhydrite SI | Halite SI |
|---|---|---|---|---|---|---|
| UW−02 | Deep unconfined aquifer | 1.95 | 3.3 | −1.69 | −1.87 | −6.95 |
| UW−03 | 1.9 | 3.22 | −1.67 | −1.85 | −6.96 | |
| UW−07 | 1.82 | 3.14 | −1.31 | −1.49 | −6.26 | |
| UW−08 | 1.79 | 3.11 | −1.44 | −1.62 | −6.49 | |
| UW−17 | 1.66 | 3.26 | −1.52 | −1.7 | −6.32 | |
| UW−18 | 1.64 | 3.09 | −1.56 | −1.74 | −6.52 | |
| UW−19 | 1.64 | 3.08 | −1.53 | −1.72 | −6.48 | |
| UW−20 | 1.67 | 3.01 | −1.49 | −1.68 | −6.44 | |
| UW−21 | 1.65 | 3.12 | −1.59 | −1.78 | −6.63 | |
| UW−22 | 1.59 | 2.87 | −1.37 | −1.56 | −6.18 | |
| UW−23 | 1.68 | 3.08 | −1.4 | −1.59 | −6.62 | |
| UW−24 | 1.51 | 3.46 | −1.74 | −1.93 | −6.64 | |
| UW−25 | 1.69 | 3.28 | −1.38 | −1.57 | −6.15 | |
| UW−01 | Shallow unconfined aquifer | 1.76 | 2.92 | −1.03 | −1.22 | −5.74 |
| UW−04 | 1.74 | 2.86 | −0.92 | −1.11 | −5.64 | |
| UW−05 | 1.55 | 2.46 | −0.91 | −1.1 | −5.8 | |
| UW−06 | 1.65 | 2.74 | −0.84 | −1.03 | −5.62 | |
| UW−09 | 1.62 | 2.61 | −0.93 | −0.93 | −5.63 | |
| UW−10 | 1.36 | 2.07 | −0.77 | −0.77 | −5.61 | |
| UW−11 | 1.62 | 2.46 | −0.81 | −0.81 | −5.72 | |
| UW−12 | 1.7 | 2.8 | −0.86 | −0.86 | −5.66 | |
| UW−13 | 1.74 | 2.85 | −1.02 | −1.02 | −5.85 | |
| UW−14 | 1.33 | 2.09 | −0.75 | −0.75 | −5.54 | |
| UW−26 | 1.6 | 2.62 | −0.75 | −0.94 | −5.58 | |
| UW−27 | 1.63 | 2.72 | −0.75 | −0.95 | −5.36 | |
| UW−28 | 1.59 | 2.69 | −0.65 | −0.85 | −5.16 | |
| UW−29 | 1.55 | 2.56 | −0.65 | −0.85 | −4.99 | |
| UW−15 | Confined aquifer | 1.48 | 2.73 | −1.08 | −1.26 | −5.62 |
| UW−16 | 1.46 | 2.7 | −0.97 | −1.14 | −5.58 | |
| UW−30 | 1.62 | 3.26 | −1.3 | −1.48 | −5.65 | |
| UW−31 | 1.69 | 3.22 | −1.11 | −1.29 | −6.05 | |
| UW−32 | 1.61 | 2.88 | −0.17 | −0.35 | −4.89 |
Publisher’s Note: MDPI stays neutral with regard to jurisdictional claims in published maps and institutional affiliations. |
© 2021 by the authors. Licensee MDPI, Basel, Switzerland. This article is an open access article distributed under the terms and conditions of the Creative Commons Attribution (CC BY) license (https://creativecommons.org/licenses/by/4.0/).
Share and Cite
Benaafi, M.; Al-Shaibani, A. Hydrochemical and Isotopic Investigation of the Groundwater from Wajid Aquifer in Wadi Al-Dawasir, Southern Saudi Arabia. Water 2021, 13, 1855. https://doi.org/10.3390/w13131855
Benaafi M, Al-Shaibani A. Hydrochemical and Isotopic Investigation of the Groundwater from Wajid Aquifer in Wadi Al-Dawasir, Southern Saudi Arabia. Water. 2021; 13(13):1855. https://doi.org/10.3390/w13131855
Chicago/Turabian StyleBenaafi, Mohammed, and Abdulaziz Al-Shaibani. 2021. "Hydrochemical and Isotopic Investigation of the Groundwater from Wajid Aquifer in Wadi Al-Dawasir, Southern Saudi Arabia" Water 13, no. 13: 1855. https://doi.org/10.3390/w13131855