Article

Seasonal Variations of Dissolved Iron Concentration in Active Layer and Rivers in Permafrost Areas, Russian Far East

1
United Graduate School of Agricultural Science, Tokyo University of Agriculture and Technology, Tokyo 183-8509, Japan
2
Institute of Agriculture, Tokyo University of Agriculture and Technology, Tokyo 183-8509, Japan
3
Institute of Low Temperature Science, Hokkaido University, Hokkaido 060-0819, Japan
4
Faculty of Applied Biological Sciences, Gifu University, Gifu 501-1193, Japan
5
Separate Subdivision Federal State Budgetary Institution of Science Khabarovsk Federal Research Center of the Far Eastern Branch of the Russian Academy of Sciences, Institute of Water and Ecology Problems of the Far Eastern Branch of the Russian Academy of Sciences, 680000 Khabarovsk, Russia
*
Author to whom correspondence should be addressed.
Water 2020, 12(9), 2579; https://doi.org/10.3390/w12092579
Submission received: 20 August 2020 / Revised: 11 September 2020 / Accepted: 11 September 2020 / Published: 15 September 2020

Abstract

:
Dissolved iron (dFe) in boreal rivers may play an important role in primary production in high-latitude oceans. However, iron behavior in soils and dFe discharge mechanism from soil to the rivers are poorly understood. To better understand iron dynamics on the watershed scale, we observed the seasonal changes in dFe and Dissolved Organic Carbon (DOC) concentrations in the river as well as dFe concentration in soil pore waters in permafrost watershed from May to October. During snowmelt season, high dFe production (1.38–4.70 mg L 1 ) was observed in surface soil pore waters. Correspondingly, riverine dFe and DOC concentrations increased to 1.10 mg L 1 and 32.3 mg L 1 , and both were the highest in the year. After spring floods, riverine dFe and DOC concentrations decreased to 0.15 mg L 1 and 7.62 mg L 1 , and dFe concentration in surface soil pore waters also decreased to 0.20–1.28 mg L 1 . In late July, riverine dFe and DOC concentrations increased to 0.33 mg L 1 and 23.6 mg L 1 in response to heavy rainfall. In August and September, considerable increases in dFe concentrations (2.00–6.90 mg L 1 ) were observed in subsurface soil pore waters, probably because infiltrated rainwater developed reducing conditions. This dFe production was confirmed widely in permafrost wetlands in valley areas. Overall, permafrost wetlands in valley areas are hotspots of dFe production and greatly contribute to dFe and DOC discharge to rivers, especially during snowmelt and rainy seasons.

1. Introduction

Iron is an essential trace element for the growth of all organisms. It plays an important role in in vivo metabolic processes, including photosynthesis, electron transfer, nitrate reduction, and nitrogen fixation [1]. Martin and Fitzwater [2] revealed that iron limits phytoplankton growth in a high-nutrient low-chlorophyll (HNLC) region where the reason for the relatively low phytoplankton productivity despite the abundance of nutrients having long been unclear. Subsequent studies confirmed that dissolved iron (dFe) concentrations in many ocean areas are too low to fully utilize nutrients [3,4,5,6,7,8]. The main iron source for the ocean was thought to be aeolian dust [2]. However, recent studies suggested that riverine dFe is also an important source to support primary production in the coastal area and the ocean [9,10,11], stimulating interests in iron dynamics in terrestrial environments.
The characteristic behavior of riverine iron transport is that most of the dFe is complexed with humic substances such as humic acids and fulvic acids [10]. It was reported that most of riverine dFe coagulates and precipitates in brackish zones because of high salinity [12]. However, a part of organically complexed iron can remain dissolved and be utilized by phytoplankton [13,14,15]. Therefore, there were some attempts to reveal the connection between terrestrial natural environments and marine biological productivity from the perspective of iron cycle [9,16,17,18].
The Sea of Okhotsk is one of the oceans with the richest marine resources in the world. As regards the reason, some studies indicated that abundant dFe derived from forests and wetlands in the Amur River basin contributes to the creation of high biological productivity in the Sea of Okhotsk [11,19]. Based on these findings, it was suggested that land use change, e.g., reclamation of wetlands for agriculture, influences dFe discharge to the Amur River [20]. In fact, it was reported that the Naoli River, where 87% of wetlands in the basin disappeared from 1949 to 2000 due to large-scale development of farmland, showed a sharp decrease in dFe concentration during this period [21].
On the contrary, a sharp increase in dFe concentration in the Amur River was observed from 1995 to 1998, which could not be explained by the increase in inflow of groundwater for irrigation due to agricultural development [22]. Another reason for this unidentified high dFe concentration in the Amur River, Shamov et al. (2014) [22] pointed out that permafrost thawing due to high summer temperatures in the 1990s has promoted wet and reducing conditions in the active layer, resulting in more dFe production in soils. In order to discuss the possibility that the extent of soil thaw dynamics has an effect on dFe concentration in a river, we need to better understand iron behavior in soils and discharge mechanism from soil to river in the permafrost watershed.
Nowadays, there has been increasing interest in iron behavior in Arctic peat soil because iron potentially controls the degradation of soil organic matter and the emissions of CO 2 and CH 4 [23,24,25]. In Arctic peat soils that contain large amounts of organic carbon and are generally waterlogged, CH 4 production is suppressed by anaerobic iron respiration because Fe(III) reducing bacteria outcompete methanogens for carbon substrates [26,27]. Recently, studies were conducted to investigate Fe species and their concentrations in soils of the active layer (soil layer which thaws from spring to autumn and freezes during winter) [28,29,30,31,32]. For instance, Herndon et al. [31] showed that the concentrations of dFe(II) were high in deep mineral soil horizon, whereas those of Fe(III) were high in organic soil horizon, suggesting that produced Fe(II) diffuses upward in the soil profile and is oxidized to Fe(III) oxyhydroxides and organically complexed Fe(III). It was also reported that the reduction of iron oxides occurs even in shallow peat soil (0–10 cm) from summer to autumn [30]. However, the overall view of the iron cycle is still poorly understood because iron behavior varies spatially and seasonally in soils of the active layer. Furthermore, little is known about the seasonal change in iron discharge mechanism from the active layer to rivers in permafrost watershed. Bagard et al. [33] reported that seasonal soil thaw dynamics of the active layer in a catchment causes a shift in the source of colloidal trace elements including Fe from organic soil horizon in spring to mineral soil horizon in late summer. It is thus expected that seasonal soil thaw dynamics influences not only iron behavior in soils, but also dFe concentrations and chemical species in permafrost-affected rivers.
The aims of this study were (1) to identify the spatial and seasonal variability of iron behavior in soils of the active layer, with focus on the time and depth of dFe production by iron reduction, and (2) to gain an insight into the influence of seasonal soil thaw dynamics on dFe and DOC discharge mechanism and these concentrations in rivers. We conducted an observation of dFe and DOC concentrations in river and dFe concentration in soil pore waters in a permafrost-affected watershed from May (beginning of soil thawing) to October (beginning of soil freezing). To our knowledge, this study is the first to investigate the watershed-scale iron cycle through the seasons in a permafrost region.

2. Materials and Methods
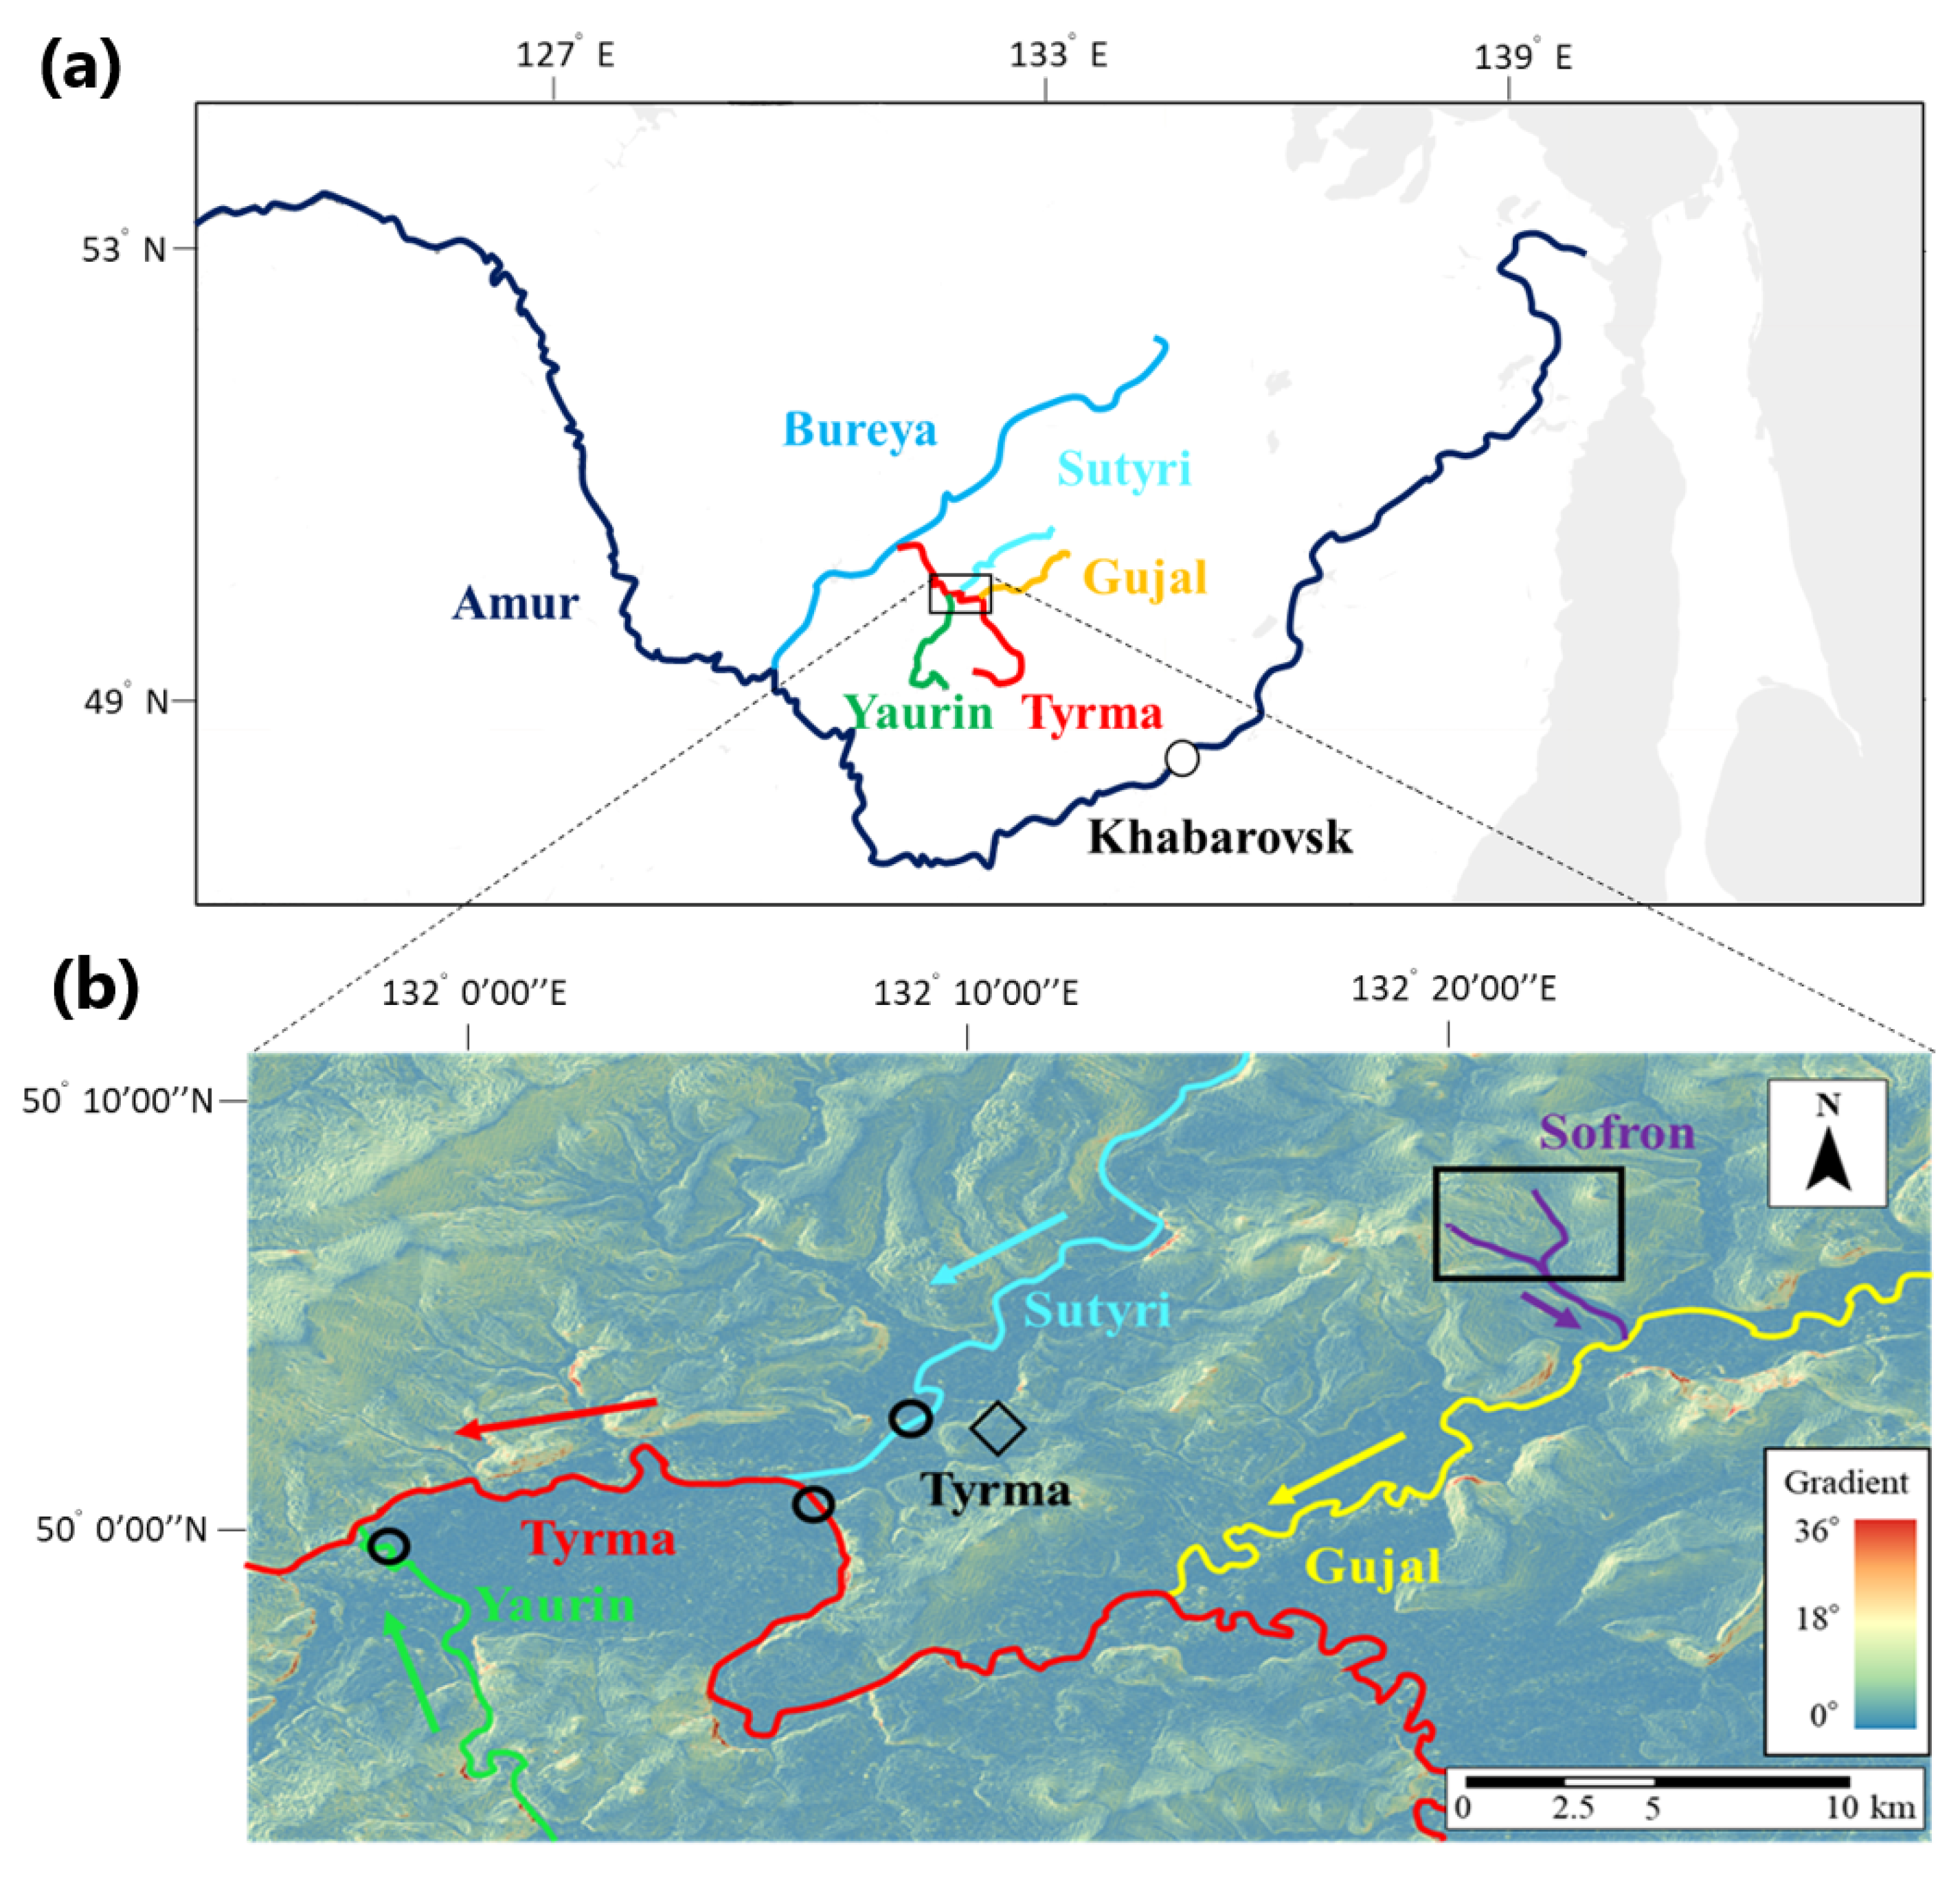
2.1. Study Site

A field survey was conducted in the Tyrma region, which is approximately 270 km northwest of Khabarovsk in the Russian Far East. Mean annual air temperature is −1.96 ° C and annual precipitation is 654.6 mm. The Tyrma region is situated in a sporadic permafrost area [22]. Three large rivers, namely, the Sutyri River, the Yaurin River, and the Gujal River, join the Tyrma River, and eventually join the Bureya River, which is one of the largest tributaries of the Amur River (Figure 1). We fixed the Sofron River watershed (50 ° 5 42.86 N,132 ° 22 1.20″ E), which is a tributary of the Gujal River, as the intensive experimental site (Figure 1b and Figure 2a). The Sofron River is a second-order stream with a sub-catchment area of approximately 23 km 2 (Figure 2). River width is approximately 10 m and central water depth is usually 10–20 cm at the sampling point without rain.
Vegetation in the Tyrma region is roughly divided into two types: the forest areas on the ridges and hillslopes are characterized by spruces (Picea ajanensis) and white birches (Betula platyphylla), and the wetlands in the flat valleys are characterized by shrubs, such as bog blueberry (Vaccinium uliginosum), cowberry (Vaccinium vitis-idaea L.), and ledum (Ledum decumbens). In the wetlands, Sphagnum species widely exist on the ground surface and larches (Larix gmelinii var. gmelinii) are scattered. Topsoil layers in the forests and the wetlands are composed of peat soils. In particular, thick peat soil layers are formed in the wetlands due to long-term accumulation of sphagnum biomass. This type of wetland, called Mari, is a typical landscape in the flat valleys in the Tyrma region. Mari can be seen not only in the flat valleys, but also on the ridges and hillslopes with a gentle slope. In the Tyrma region, permafrost generally exists underneath Mari. The vegetation and permafrost distribution in the Sofron basin are consistent with these typical features as described above.

2.2. Soil Pore Water Sampling and Soil Characteristic Measurement along a Transect

In September 2016, we established a long transect of nine sampling points for pore waters from N1 near the Sofron River to N9 in the adjacent basin (Figure 2). Permafrost wetland Mari is seen not only at N1–N3 and N9 in valley, but also at N7 on ridge and N8 on gentle hillslope. On the other hand, permafrost does not exist at N5 on steep hillslope and N6 on ridge. We dug 1.8 cm diameter holes using a manual drill (DAIKI, DIK-1721, Konosu city, Saitama, Japan) in the ground of each sampling point and installed ceramic cups with a polyvinyl chloride pipe at 20 cm and 40 cm depths for pore water sampling (N4 has different depths as described below and N5 has only 40 cm depth). In April 2017, we installed the ceramic pipes at 5 cm and 10 cm depths at N4 and 10 cm and 25 cm depths at N6 for soil pore water sampling during snowmelt season. Because 10 cm of snow remained at N4 and N6 on this installation, both points were suitable to observe dFe concentration variations in response to snow melting. The frozen ground at that time existed at 10–15 cm depth at N4 and N6; thus, we used an electric drill to install a ceramic cup at 25 cm depth at N6. All the soil pore water sampling depths at each point are compiled in Table 1.
At N4 and N6, the soil pore waters (except 20 cm and 40 cm at N6) were collected four times in May. From June, all pore waters at the nine sampling points were collected twice a month until October (see Table 1). The soil pore waters were sucked up overnight by 50 mL disposable syringes (TERUMO, SS-50ESZ, Shibuya ku, Tokyo, Japan) and filtered in situ through 0.45 μ m disposable filters made of cellulose acetate (ADVANTEC, DISMIC 25CS045AS, Chiyoda ku, Tokyo, Japan). The filtered waters were preserved in acid-washed 50 mL polypropylene bottles and kept in a refrigerator at 4 ° C until analysis.
The peat layer thickness (PLT) and the active layer thickness (ALT) at the nine sampling points were measured in September 2016 by digging a pit down to the permafrost table and examining the soil profile (Table 1). To confirm the ALT data, we checked that the soil temperature of permafrost table was 0 ° C. The absence of permafrost at N5 and N6 was judged from the absence of a continuous decline in soil temperatures over 10 cm intervals from the surface. Soils for the analysis of organic carbon content and moisture content were collected in polyethylene freezer bags from 0–10 cm, 10–20 cm, and 20–30 cm depths of the soil profile at the nine sampling points and stored in a freezer until analysis.
When we dug a soil profile at each point in September 2016, we installed geothermal loggers (Onset, U22-001, Bourne, Massachusetts, America) to observe the seasonal thaw dynamics of soil at two depths at N1 (10 cm and 25 cm), three depths at N4 (10 cm, 25 cm, and 50 cm), and three depths at N6 (10 cm, 25 cm, and 50 cm). The soil temperatures were recorded until October 2017.

2.3. River Water Sampling and Hydrological Observation

During snowmelt season from late April to mid May, the water samples were collected from the Sofron River twice a week. From June to October, the water samples were collected twice in a month on the same days as soil pore waters. Two hundred milliliters of water was sampled using a disposable syringe (TERUMO, SS-50ESZ, Shibuya ku, Tokyo, Japan) and immediately filtered through 0.45 μ m disposable filters made of cellulose acetate (ADVANTEC, DISMIC 25CS045AS, Chiyoda ku, Tokyo, Japan). One hundred milliliters of the filtered water was preserved in an acid-washed propylene bottle for dFe measurement and the other 100 mL was preserved in a propylene bottle for dissolved organic carbon (DOC) measurement, and both were kept in a refrigerator until analysis.
For the observation of water level of the Sofron River, we installed a water pressure logger (Onset, HOBO U-20-001-04, Bourne, Massachusetts, America) at the river bed of the water sampling point and an air pressure logger (Onset, HOBO U-20-001-04, Bourne, Massachusetts, America) nearby in mid June 2017 when the river bed adequately thawed. In addition, daily precipitation data in the Tyrma region from June to October were obtained from the weather site in Russia (http://ru8.rp5.ru/Weather_archive_in_Tyrma_(Sutyr)).
Water samples were also collected from the Sutyri River (catchment area: 2129 km 2 ), the Tyrma River (6168 km 2 ), and the Yaurin River (3175 km 2 ) (Figure 1b). The frequency, date, and way of sampling were same as those for the Sofron River.

2.4. Chemical Analyses

All the analyses were done in the Institute of Mining in Khabarovsk. The dFe concentrations were measured for soil pore waters and river waters. Prior to Fe analysis, the samples were acidified (~pH 2) with HNO 3 , and Fe concentration was determined with Agilent 7500cx Inductively Coupled Plasma-Mass Spectrometer (ICP-MS) using helium modes to diminish the interferences. The detection limit for Fe by ICP-MS was 10 ng L 1 , and an uncertainty was 5–10%. Standard solutions for Fe analysis were prepared by using Environmental Calibration Standard (Agilent Technologies). In this paper, we define dFe as Fe that passed through 0.45 μ m disposable filter in samples. Moreover, for the river water samples, DOC concentrations were also determined with a TOC analyzer (SHIMADZU TOC-LCSH) using the catalytic combustion oxidation method. The detection limit for TOC by TOC analyzer was 0.1 mg L 1 , and an uncertainty was less than 1.5%. Standard solutions for DOC analysis were prepared by using Potassium Hydrogen Phthalate (C 6 H 4 (COOK)(COOH)) (Nacalai tesque). For the data of DOC and dFe concentrations in the Sofron River, simple liner regression analysis and Student’s t-test were performed.
Soil organic carbon content was measured by Tyurin’s method (wet combustion) based on Bel’chikova (1975) [34]. Weight moisture content was determined from the difference in mass before and after drying soil.

3. Results

3.1. Seasonal Variations in dFe and DOC Concentrations in Sofron River and Large Rivers

The dFe concentration in the Sofron River showed substantial seasonal variation, ranging from 0.10 mg L 1 to 1.10 mg L 1 (Figure 3a). During snowmelt season, dFe concentration increased rapidly within two weeks from 0.27 mg L 1 to the annual highest value of 1.10 mg L 1 . Although it once dropped through June, a relatively high dFe concentration was recorded again in late July and late September. The annual lowest level of 0.10 mg L 1 was noted in October, immediately before soil freezing. DOC concentration in the Sofron River showed a similar seasonal variation to dFe concentration. DOC concentration rapidly increased during snowmelt season from 17.0 mg L 1 to the annual highest value of 32.3 mg L 1 . After that, it increased again in late July and late September, when dFe concentration also increased.
The water level of the Sofron River showed frequent increases accompanied with heavy rainfall of over 10 mm from July to mid August (Figure 3b). The highest water level of 36 cm was recorded in early August. The increases in dFe and DOC concentrations in late July and late September were associated with the water level risings, that is, the seasonal variations in dFe and DOC concentrations almost synchronized with the change in water level throughout the year. Whereas dFe concentration greatly increased from 0.15 mg L 1 to 1.07 mg L 1 during the period affected by snow melting, the degrees of increases associated with heavy rainfall in late July and late September were relatively small. In the separated periods before and after July, two distinct positive correlations were found between dFe concentration and DOC concentration (r 2 = 0.51, p = 0.056 from April to June, and r 2 = 0.75, p < 0.01 from July to October) (Figure 3c), suggesting a difference in the discharge mechanisms of these two substances among seasons.
The seasonal variations in dFe and DOC concentrations in the large rivers (Sutyri, Tyrma, and Yaurin) were almost consistent with those in the Sofron River throughout the year (Figure 4a,b). During snowmelt season, similar large increases in dFe and DOC concentrations were also observed. The increases in DOC concentrations corresponding to rainfall as seen in the Sofron River were also observed in the large rivers in late July and late September. Although the increases in dFe concentrations during these storm events were not clearly observed in the large rivers, these concentration levels matched those of the Sofron River. In a rainless season (from June to early July and from September to October), however, it appeared that dFe concentrations in the large rivers were generally higher than those in the Sofron River. This difference between the Sofron River and the large rivers was more clearly seen in the seasonal change in dFe/DOC ratio (Figure 4c).

3.2. Organic Carbon Contents and Weight Moisture Contents of Soils along a Transect

Organic carbon contents and weight moisture contents of soils at the nine sampling points in the research site are shown in Table 2. The organic carbon contents at the uppermost layer at points located in valley (N1–3 and N9) were 144–478 gC kg 1 , whereas those at points located on hillslope and ridge (N4–8) were 48–358 gC kg 1 , slightly lower than those at valley points. Interestingly, permafrost wetlands Mari in valley had high organic carbon contents of 100–474 gC kg 1 even at 20–30 cm depths, whereas Mari on ridge (N7) and gentle hillslope (N8) had low organic carbon contents of 52 and 23 gC kg 1 , respectively. Although N5 on steep hillslope and N6 on ridge are both no-permafrost points, the organic carbon contents were relatively high at N6 and low at N5.
The weight moisture contents showed similar spatial variations to the organic carbon contents. Weight moisture contents were remarkably high, i.e., 92.7–99.8%, at the uppermost layer at points located in valley (N1–3 and N9), but were relatively low, i.e., 49.4–92.4% on hillslope and ridge (N4–8). In short, wetlands Mari in valley had the highest organic carbon and moisture contents within the watershed. However, Mari on ridge (N7) and gentle hillslope (N8) had relatively low weight moisture contents of 49.4% and 68.1% even at the uppermost layer relative to Mari in valley points. At hillslope and ridge points, weight moisture contents decreased significantly with depths. At N6 that had contained relatively high organic carbon contents among hillslope and ridge points, weight moisture contents were also high.

3.3. Seasonal Soil Thaw Dynamics in Different Terrain Types

The seasonal variations in soil temperature at several depths at N1, N4, and N6 are shown in Figure 5. In addition, the thawing date for each depth and the thawing rate, which is calculated simply by dividing the difference in depth by the number of required days for thawing, are shown in Table 3. The thawing of 10 cm depth at N1, which is the closest point to the river in valley, was completed on 24 May, approximately one month later than that at N4 on the boundary between valley and hillslope and that at N6 on ridge. The 25 cm depth at N1 thawed on 15 June, which was also the latest among the same depths.
The 10 cm and 25 cm depths at N4 and N6 showed remarkable rises of soil temperatures after thawing. Soil temperatures as of July 1 for 10 cm and 25 cm were 9.1 ° C and 4.2 ° C at N4 and 8.5 ° C and 3.3 ° C at N6, which were considerably higher than those at N1 of 2.4 ° C and 0.6 ° C. At N6, where permafrost does not exist, soil temperatures always tended to be higher than those at N1 and N4. In fact, the annual highest soil temperatures at N6 (10 cm: 13.1 ° C, 25 cm: 9.6 ° C, 50 cm: 7.9 ° C) were the highest compared with those at N1 (10 cm: 10.9 ° C, 25 cm: 6.9 ° C) and N4 (10 cm: 11.5 ° C, 25 cm: 8.2 ° C, 50 cm: 5.2 ° C). Moreover, the thawing rate from 25 cm to 50 cm depth at N6 was 1.6 times faster than that for the same depth at N4. Therefore, the seasonal downward thawing of soil from spring to summer was fastest at N6 on ridge, followed by N4 on boundary between valley and hillslope, and the slowest at N1 in valley. This order agreed with the difference in active layer thickness at those points (N1: 64 cm, N4: 102 cm, N6: No permafrost) (Table 1). Combined with organic carbon content data and weight moisture content data (Table 2), permafrost wetland Mari in valley area is characterized by an environment with the highest organic matter content and the highest moisture content, and the lowest soil temperature within the watershed.

3.4. Seasonal Changes in dFe Concentrations in Soil Pore Waters along a Transect

Seasonal changes in dFe concentration in soil pore waters at N4 and N6, the observations of which only started from snowmelt season, are shown in Figure 6. In early May, when snowmelt was in progress, dFe concentrations in the surface soil pore waters were 1.38–4.70 mg L 1 , clearly higher than those in summer and autumn. These remarkably high dFe concentrations in the soil pore waters were consistent with the increases in dFe concentration in the Sofron River and the large rivers during snowmelt (Figure 4a). From spring to summer, dFe concentrations at N4 (5 cm and 10 cm depths) and N6 (10 cm and 25 cm depths) decreased.
Seasonal changes in dFe concentrations in soil pore waters at the transect points where the observation started after snowmelt season are shown in Figure 7. The sampling depths at these points were 20 cm and 40 cm, which were larger than the depths at N4 and N6 observed in snowmelt season. dFe concentrations for both depths at each point except N3, were less than 1.00 mg L 1 for two months from the start of observation. However, from August to September, dFe concentrations at 20 cm and 40 cm depths in permafrost wetland Mari (N1–3 and N7–9) increased rapidly to 2.00–6.90 mg L 1 . In contrast, these increases in dFe concentrations were not observed at N6, where permafrost does not exist. According to the changes in soil temperature (Figure 5), it appears that the seasonal downward thawing of soil from 20 cm to 40 cm took place in May on ridge and hillslope and in June in valley. Thus, dFe production in these depths occurred two or three months after thawing. After that, these dFe concentrations in the soil pore waters decreased to less than 1.00 mg L 1 in October, when soil started to freeze from the top layer.

4. Discussion

4.1. dFe Production in Uppermost Soils and Its Discharge into Rivers during Snowmelt Season

From late April to mid May, when snow was melting, dFe and DOC concentrations in the Sofron River rapidly increased, reaching the highest concentration in the year (Figure 3a). In accordance with this, surface soil pore waters also showed the highest dFe concentrations in this period (Figure 6). These elevated dFe concentrations in the Sofron River and the soil pore waters can be explained by snow melting and the existence of frozen ground at shallow depths. According to the seasonal changes in soil temperature (Figure 5), frozen ground existed at approximately 0–10 cm depth in valley and 10–25 cm depth in hillslope and ridge. It is known that frozen ground impedes downward infiltration of snowmelt water [35,36], resulting in a waterlogged condition near the soil surface. This was actually the case at N4 and N6 where soil pore waters were collected during this period. In soil saturated with snowmelt water, anoxic conditions could develop through dissolved oxygen consumption by microbial respiration [37,38]. Under such conditions, Fe(III) can be utilized as an electron acceptor by anaerobic microorganisms, and produced Fe(II) is probably complexed with DOC that seeps from ambient organic-rich soils (Table 2). Although we did not observe DOC concentrations in surface soil pore waters, the positive correlation between DOC and dFe concentrations in the Sofron River during snowmelt season (Figure 3c) suggests that exported dFe is mainly associated with organic compounds, as reported in other boreal regions [39,40,41,42]. The large amount of organically complexed iron produced in this way should be responsible for the high dFe concentrations in the uppermost soil pore waters (Figure 6) and the Sofron River (Figure 3a).
During snowmelt season, elevated dFe concentrations in surface soil pore waters were observed not only at N4 located on the boundary between valley and hillslope but also at N6 located on the ridge (Figure 6). In hillslope and ridge without permafrost, soil water usually infiltrates downward easily, and thus the uppermost soil is unlikely to be saturated. However, the seasonally frozen ground at a shallow depth would have led to waterlogging and dFe production in soil pore waters even in these terrains. It is thus expected that dFe production in waterlogged surface soils in this period may occur over a wide range of areas in these terrains where soil freezes and snow falls in winter.
However, in case frozen ground is formed with low water content in winter, snowmelt water may be able to infiltrate it because of discontinuous frozen soil [43,44]. It is therefore likely that, on ridge and hillslope, where the water content before freezing was relatively low (Table 2), snowmelt water probably flowed out while infiltrating frozen ground. Thus, even if snowmelt water on ridge and hillslope once had high dFe concentration, its contribution to the increase in dFe concentration in rivers would be minor. In contrast, in the valley, where the surface soils retained high water content before freezing (Table 2), snowmelt water would have flowed into the rivers over continuous frozen ground without infiltration. Consequently, the valley area most likely contributed to the rapid increase in dFe concentration in the rivers during the snowmelt season.
The rapid increases in dFe and DOC concentrations were also observed in the large rivers during snowmelt season (Figure 4a,b). It is thus suggested that the small watershed dominated by permafrost wetlands Mari like the Sofron river greatly contributes to the terrestrial DOC and dFe transport in this period. Moreover, both DOC and dFe concentrations in the large rivers during snowmelt season had the highest values in the year, similarly to those in the Sofron River, strongly indicating that snowmelt season is the most important period for transporting large amounts of DOC and dFe. Elevated dFe concentrations during snowmelt season were also observed in large tributaries of the Amur River [45,46], and other boreal rivers [39,40,41,47]. To our knowledge, the present study is the first to corroborate this large-scale dFe transport that resulted from the high dFe concentrations in the uppermost soil pore waters.

4.2. Seasonal Changes in Iron Behavior in Thawed Active Layer after Snowmelt Season

The dFe concentrations in surface soil pore waters at N4 and N6 declined after snowmelt season (Figure 6). As soil thawed downward towards summer, the surface soils most likely changed gradually to oxygenated conditions because of the decline of groundwater level. Such a situation that produces Fe(II) in pore waters should be oxidized chemically and/or biologically to insoluble Fe oxides [48], possibly resulting in the declines in dFe concentrations. The early declines in dFe concentrations of soil pore waters at N6 relative to that at N4 are explainable by the faster downward thawing of soil at N6 than N4 from spring to summer (Figure 5 and Table 2).
The dFe concentrations at 20 cm and 40 cm depths at the transect points, where observation was started in June, were less than 1 mg L 1 until August except N3, but increased markedly to 2–7 mg L 1 from August to September (Figure 7). This abrupt increase in dFe concentration would be associated with heavy rainfall from July to August (Figure 3b). The total amount of rainfall in July and August was 298.4 mm, which is equivalent to 45.6% of the annual average precipitation of 654.6 mm. Abundant rainfall would make subsurface (20–40 cm) soils saturated as permafrost would prevent infiltration of soil water. Under this situation, such electron acceptors as NO 3 , Mn 4 + , and humic substances would be utilized by being utilized for microbial anaerobic respiration [30,49,50,51,52]. As a result, microbial iron reduction was likely activated from August to September and large amounts of Fe(II) were produced in soil pore waters at 20 cm and 40 cm depths. Street et al. [53] observed that the redox potential (Eh) of soil in the active layer did not change markedly for one month after thawing but started to decline after the rainy season in summer, in agreement with our interpretation. Moreover, it was reported that iron reduction was facilitated in peat soils with artificial flooding relative to soils without this treatment [29]. It is thus likely that dFe production in soil prevails widely in permafrost wetland Mari after the rainy season. Only N6 did not show the increase in dFe concentrations in late summer, probably because the thawing of seasonally frozen soil at N6 was faster than at the other points in permafrost wetland Mari, leading to infiltration of soil water and an unsaturated condition even after abundant rainfall.
The elevated dFe concentrations in late summer subsequently decreased to approximately 1 mg L 1 towards October. The possible reason for this would be the decline of groundwater level in soils of the active layer in September when there was little heavy rainfall. Soil conditions probably changed to oxidative during this rainless season, and most of the produced Fe(II) in soil pore waters should have been oxidized to insoluble Fe oxyhydroxides by incoming oxygen and/or iron-oxidizing bacteria [54,55]. It was reported that reducible Fe oxyhydrox-ides exist in abundance in soils where oxidizing and reducing conditions are repeated [28,56], and the newly formed Fe oxyhydroxides will be reduced again by iron-reducing bacteria when reducing conditions are developed.

4.3. Seasonal Changes in dFe Discharge Mechanism Associated with Downward Shift of Flow Path after Snowmelt Season

After snowmelt season, groundwater table most likely declined as frozen ground thawed downward with rising air temperature. With this hydrological change from spring to summer, both dFe and DOC concentrations in the Sofron River and the large rivers decreased (Figure 4a,b). This agrees with the decline in dFe concentration in surface soil pore waters after snowmelt season (Figure 6). In addition, because the riverine dFe/DOC ratio also decreased in this period (Figure 4c), the decreases in dFe concentrations in the rivers after snowmelt season probably implies the decrease in discharge of organically complexed iron from the peat soil layer with the downward shift of flow path. This is supported by previous studies reporting that the discharge of DOC derived from humic substances decreased from spring to summer in the boreal region [57,58,59].
In the Sofron River, increases in dFe and DOC concentrations were observed in response to rising water levels due to heavy rainfall in late July and late September (Figure 3a,b). The elevated DOC concentrations were as high as those during snowmelt season, but the degree of these increases in dFe concentrations was less. Although storm events often increase dFe discharge from the upper organic-rich soil in boreal region [60], this result emphasizes the importance of snowmelt flooding to terrestrial dFe transport. The most likely explanation for the smaller increases in riverine dFe concentration due to heavy rainfall compared to snowmelt season is short period of waterlogged conditions in surface soils. It was reported that a high water level after heavy rainfall (~10 mm) lasts for only 1–2 days in permafrost peatland [61], whereas the waterlogged conditions due to snowmelt lasted for at least two weeks in this study. It is therefore suggested that summer rainfall causes the flushing of dFe into river, but, unlike the snowmelt season, it does not contribute to the develop of reducing conditions in surface peat soils. As mentioned in Section 4.2, the summer heavy rainfall probably contributed to the large amount of dFe production in subsurface soil pore waters in late summer (Figure 7), but, nevertheless, dFe concentration in the Sofron River hardly increased (Figure 3a). This finding is consistent with that of Street et al. [53], i.e., deep soil methane concentration in the active layer increased over time through the season but did not appear to influence stream methane concentration. Possible interpretation for the luck of increase in dFe concentration in the Sofron river in late summer would be a low discharge rate of subsurface soils. According to Quinton et al. [62], the hydraulic conductivity of peat soils below 20 cm depth is approximately less than one tenth of surface peat soils; therefore, even though a large amount of dFe is produced in subsurface soil pore waters, there might be little immediate influence on riverine dFe concentration.
Seasonal changes in dFe and DOC concentrations in the large rivers showed similar patterns to those in the Sofron River throughout the year; DOC variations in particular were exact matches (Figure 4a,b). In addition to snowmelt season, DOC and dFe concentrations in the large rivers during rainfall were also consistent with the elevated concentrations of both in the Sofron River. It is therefore suggested that small watershed with permafrost wetlands Mari like the Sofron River greatly contribute to terrestrial transport of DOC and dFe to the large rivers throughout the year, especially during snowmelt season as well as during the rainy season.
Interestingly, however, dFe concentration and dFe/DOC ratio in the large rivers after September, when there was less rainfall, were higher than those in the Sofron River (Figure 1a,c). The reason for this remains unclear, but likely explanation is the inflow of mineral-rich deep groundwater into overlying river through unfrozen ground (taliks) that commonly lies underneath the large rivers [33,63]. As river discharge decreases in rainless September, the contribution of such groundwater to river water might increase, which could explain the high dFe concentrations and the increases in dFe/DOC ratio in the large rivers in this period. dFe flowing into river in this way is believed to be Fe-bearing organic colloids produced in the hyporheic zone, where Fe(II)-rich groundwater and organic-rich river water are mixed [64,65]. It is therefore suggested that, for small rivers like the Sofron River, such deep ground water may not be important to chemical composition because of no talik. More studies are needed about why dFe concentrations in the large rivers are higher than those in the small river after September because it may be an important mechanism to support terrestrial dFe transport even in rainless periods when dFe concentrations in small rivers are low.

5. Conclusions

In this study, we observed dFe and DOC concentrations in rivers as well as dFe concentration in the soil pore waters during the water active period (from May to October) to understand the spatial and seasonal iron behavior on the watershed scale. To our knowledge, this study is the first to investigate the seasonal changes in dFe concentration in both river and soil pore water. The results highlight the following conclusions:
  • In snowmelt season, high dFe production occur in the waterlogged surface soils, which leads to the largest terrestrial dFe transport in the year.
  • Summer rainfall not only increases in dFe and DOC concentrations in river but probably has the effect of promoting dFe production in subsurface soils of permafrost wetlands in valley area.
  • Overall, permafrost wetlands in valley areas are important environment in which dFe production occurs in response to seasonal hydrological events (spring snowmelt and summer rainfall) and soil thaw depth, and play a significant role in supplying dFe and DOC to rivers.

Author Contributions

Conceptualization, M.Y., T.S., T.O., V.S., and Y.Y.; methodology, M.Y., T.S., and T.O.; formal analysis, V.S. and Y.Y.; investigation, Y.T., M.Y., and T.O.; data curation, Y.T.; writing—original draft preparation, Y.T.; writing—review and editing, M.Y., T.S., and T.O.; visualization, Y.T.; supervision, T.S., V.S., and V.K.; project administration, T.S., V.S., and V.K.; funding acquisition, T.S. All authors have read and agreed to the published version of the manuscript.

Funding

This research was funded by the Japan Society for the Promotion of Science (JSPS) KAKENHI Grant No. JP15H05208.

Acknowledgments

We would like to thank S. I. Levshina, A. L. Antonov, D. V. Matveenko, and R. S. Kozyrev for supporting field research and sample analyses in the laboratory. We are also grateful to D. N. Markina for mediating this work as an interpreter. We thank N. P. Mihailov and V. G. Stebunov for their help in field research as a guide and for the regular sampling of soil pore waters and river waters in the Tyrma region.

Conflicts of Interest

The authors declare no conflict of interest.

References

  1. Sunda, W.G. Feedback interactions between trace metal nutrients and phytoplankton in the ocean. Front. Microbiol. 2012, 3, 204. [Google Scholar] [CrossRef] [PubMed] [Green Version]
  2. Martin, J.H.; Fitzwater, S.E. Iron deficiency limits phytoplankton growth in the North-east Pacific subarctic. Nature 1988, 336, 403–405. [Google Scholar] [CrossRef]
  3. Martin, J.H.; Gordon, R.M.; Fitzwater, S.E.; Broenkow, W.W. Vertex: Phytoplankton/iron studies in the Gulf of Alaska. Deep Sea Res. Part A 1989, 36, 649–680. [Google Scholar] [CrossRef]
  4. Martin, J.H.; Gordon, R.; Fitzwater, S.E. Iron in Antarctic waters. Nature 1990, 345, 156–158. [Google Scholar] [CrossRef]
  5. Martin, J.H.; Coale, K.H.; Johnson, K.S.; Fitzwater, S.E.; Gordon, R.M.; Tanner, S.J.; Hunter, C.N.; Elrod, V.A.; Nowick, J.L.; Coley, T.L.; et al. Testing the iron hypothesis in ecosystems of the equatorial Pacific Ocean. Nature 1994, 371, 123–129. [Google Scholar] [CrossRef]
  6. Price, N.M.; Ahner, B.A.; Morel, F.M.M. The equatorial Pacific Ocean: Grazer-controlled phytoplankton populations in an iron-limited ecosystem. Limnol. Oceanogr. 1994, 39, 520–534. [Google Scholar] [CrossRef]
  7. Takeda, S.; Obata, H. Response of equatorial Pacific phytoplankton to subnanomolar Fe enrichment. Mar. Chem. 1995, 50, 219–227. [Google Scholar] [CrossRef]
  8. Bruland, K.W.; Lohan, M.C. Controls of Trace Metals in Seawater. Treatise Geochem. 2003, 6, 23–47. [Google Scholar]
  9. Matsunaga, K.; Nishioka, J.; Kuma, K.; Toya, K.; Suzuki, Y. Riverine input of bioavailable iron supporting phytoplankton growth in Kesennuma Bay (Japan). Water Res. 1998, 32, 3436–3442. [Google Scholar] [CrossRef]
  10. Laglera, L.M.; Vandenberg, C.M.G. Evidence for geochemical control of iron by humic substances in seawater. Limnol. Oceanogr. 2009, 54, 610–619. [Google Scholar] [CrossRef]
  11. Nishioka, J.; Nakatsuka, T.; Ono, K.; Volkov, Y.N.; Scherbinin, A.; Shiraiwa, T. Quantitative evaluation of iron transport processes in the Sea of Okhotsk. Prog. Oceanogr. 2014, 126, 180–193. [Google Scholar] [CrossRef]
  12. Boyle, E.A.; Edmond, J.M.; Sholkovitz, E.R. The mechanism of iron removal in estuaries. Geochim. Cosmochim. Acta 1977, 41, 1313–1324. [Google Scholar] [CrossRef]
  13. Morel, F.M.M.; Kustka, A.B.; Shaked, Y. The role of unchelated Fe in the iron nutrition of phytoplankton. Limnol. Oceano. 2008, 53, 400–404. [Google Scholar] [CrossRef] [Green Version]
  14. Kranzler, C.; Lis, H.; Shaked, Y.; Keren, N. The role of reduction in iron uptake processes in a unicellular, planktonic cyanobacterium. Environ. Microbiol. 2011, 13, 2990–2999. [Google Scholar] [CrossRef]
  15. Morrissey, J.; Bowler, C. Iron utilization in marine cyanobacteria and eukaryotic algae. Front. Microbiol. 2012, 3, 1–13. [Google Scholar] [CrossRef] [PubMed] [Green Version]
  16. Krachler, R.; Jirsa, F.; Ayromlou, S. Factors influencing the dissolved iron input by river water to the open ocean. Biogeosciences 2005, 2, 311–315. [Google Scholar] [CrossRef] [Green Version]
  17. Krachler, R.; Krachler, R.F.; Von Der Kammer, F.; Süphandag, A.; Jirsa, F.; Ayromlou, S.; Hofmann, T.; Keppler, B.K. Science of the Total Environment Relevance of peat-draining rivers for the riverine input of dissolved iron into the ocean. Sci. Total Environ. 2010, 408, 2402–2408. [Google Scholar] [CrossRef] [PubMed]
  18. Klunder, M.B.; Bauch, D.; Laan, P.; De Baar, H.J.W.; Van Heuven, S.; Ober, S. Dissolved iron in the Arctic shelf seas and surface waters of the central Arctic Ocean: Impact of Arctic river water and ice-melt. J. Geophys. Res. Ocean. 2012, 117, 1–18. [Google Scholar] [CrossRef]
  19. Suzuki, K.; Hattori-Saito, A.; Sekiguchi, Y.; Nishioka, J.; Shigemitsu, M.; Isada, T.; Liu, H.; McKay, R.M.L. Spatial variability in iron nutritional status of large diatoms in the Sea of Okhotsk with special reference to the Amur River discharge. Biogeosciences 2014, 11, 2503–2517. [Google Scholar] [CrossRef] [Green Version]
  20. Shiraiwa, T. “Giant Fish-Breeding Forest”: A New Environmental System Linking Continental Watershed with Open Water. In The Dilemma of Boundaries; Taniguchi, M., Shiraiwa, T., Eds.; Springer: Tokyo, Japan, 2012; pp. 73–85. [Google Scholar]
  21. Pan, X.F.; Yan, B.X.; Yoh, M. Effects of land use and changes in cover on the transformation and transportation of iron: A case study of the Sanjiang Plain, Northeast China. Sci. China Earth Sci. 2011, 54, 686–693. [Google Scholar] [CrossRef]
  22. Shamov, V.V.; Onishi, T.; Kulakov, V.V. Dissolved Iron Runoff in Amur Basin Rivers in the Late XX Century. Water Resour. 2014, 41, 201–209. [Google Scholar] [CrossRef]
  23. Gu, B.; Schmitt, J.; Chen, Z.; Liang, L.; McCarthy, J.F. Adsorption and desorption of natural organic matter on iron oxide: Mechanisms and models. Environ. Sci. Technol. 1994, 28, 38–46. [Google Scholar] [CrossRef] [PubMed]
  24. Gu, B.; Schmitt, J.; Chen, Z.; Liang, L.; McCarthy, J.F. Adsorption and desorption of different organic matter fractions on iron oxide. Geochim. Cosmochim. Acta 1995, 59, 219–229. [Google Scholar] [CrossRef]
  25. Baldock, J.A.; Skjemstad, J.O. Role of the soil matrix and minerals in protecting natural organic materials against biological attack. Org. Geochem. 2000, 31, 697–710. [Google Scholar] [CrossRef]
  26. Roden, E.E.; Wetzel, R.G. Kinetics of microbial Fe (III) oxide reduction in freshwater wetland sediments. Limnol. Oceanogr. 2002, 47, 198–211. [Google Scholar] [CrossRef]
  27. Miller, K.E.; Lai, C.T.; Friedman, E.S.; Angenent, L.T.; Lipson, D.A. Methane suppression by iron and humic acids in soils of the Arctic Coastal Plain. Soil Biol. Biochem. 2015, 83, 176–183. [Google Scholar] [CrossRef]
  28. Lipson, D.A.; Jha, M.; Raab, T.K.; Oechel, W.C. Reduction of iron (III) and humic substances plays a major role in anaerobic respiration in an Arctic peat soil. J. Geophys. Res. Biogeosci. 2010, 115, 1–13. [Google Scholar] [CrossRef]
  29. Lipson, D.A.; Zona, D.; Raab, T.K.; Bozzolo, F.; Mauritz, M.; Oechel, W.C. Water-table height and microtopography control biogeochemical cycling in an Arctic coastal tundra ecosystem. Biogeosciences 2012, 9, 577–591. [Google Scholar] [CrossRef] [Green Version]
  30. Lipson, D.A.; Raab, T.K.; Goria, D.; Zlamal, J. The contribution of Fe(III) and humic acid reduction to ecosystem respiration in drained thaw lake basins of the Arctic Coastal Plain. Glob. Biogeochem. Cycles 2013, 27, 399–409. [Google Scholar] [CrossRef]
  31. Herndon, E.M.; Yang, Z.; Bargar, J.; Janot, N.; Regier, T.Z.; Graham, D.E.; Wullschleger, S.D.; Gu, B.; Liang, L. Geochemical drivers of organic matter decomposition in arctic tundra soils. Biogeochemistry 2015, 126, 397–414. [Google Scholar] [CrossRef]
  32. Herndon, E.; Albashaireh, A.; Singer, D.; Roy, T.; Gu, B.; Graham, D. Influence of iron redox cycling on organo-mineral associations in Arctic tundra soil. Geochim. Cosmochim. Acta 2017, 207, 210–231. [Google Scholar] [CrossRef] [Green Version]
  33. Bagard, M.L.; Chabaux, F.; Pokrovsky, O.S.; Viers, J.; Prokushkin, A.S.; Stille, P.; Rihs, S.; Schmitt, A.; Dupré, B. Seasonal variability of element fluxes in two Central Siberian rivers draining high latitude permafrost dominated areas. Geochim. Cosmochim. Acta 2011, 75, 3335–3357. [Google Scholar] [CrossRef]
  34. Bel’chikova, N.P. Determination of humus in soil by I.V. Tyurin method. In Agrochemical Methods of Soil Studies; Sokolov, A.V., Ed.; Nauka: Moscow, Russia, 1975; pp. 56–62. (In Russian) [Google Scholar]
  35. Thunholm, B.; Lundln, L.; Lindell, S.; Meteorological, S. Infiltation into a Frozen Heavy Clay Soil. Hydrol. Res. 1989, 20, 153–166. [Google Scholar] [CrossRef]
  36. Stähli, M.; Jansson, P.E.; Lundin, L.C. Preferential water flow in a frozen soil—A two-domain model approach. Hydrol. Process. 1996, 10, 1305–1316. [Google Scholar] [CrossRef]
  37. Seto, M.; Akagi, T. Influence of snow on iron release from soil. Geochem. J. 2005, 39, 173–183. [Google Scholar] [CrossRef] [Green Version]
  38. Morse, J.L.; Durán, J.; Groffman, P.M. Soil Denitrification Fluxes in a Northern Hardwood Forest: The Importance of Snowmelt and Implications for Ecosystem N Budgets. Ecosystems 2015, 18, 520–532. [Google Scholar] [CrossRef]
  39. Rember, R.D.; Trefry, J.H. Increased concentrations of dissolved trace metals and organic carbon during snowmelt in rivers of the alaskan arctic. Geochim. Cosmochim. Acta 2004, 68, 477–489. [Google Scholar] [CrossRef]
  40. Andersson, K.; Dahlqvist, R.; Turner, D.; Stolpe, B.; Larsson, T.; Ingri, J.; Andersson, P. Colloidal rare earth elements in a boreal river: Changing sources and distributions during the spring flood. Geochim. Cosmochim. Acta 2006, 70, 3261–3274. [Google Scholar] [CrossRef]
  41. Ingri, J.; Malinovsky, D.; Rodushkin, I.; Baxter, D.C. Iron isotope fractionation in river colloidal matter. Earth Planet. Sci. Lett. 2006, 245, 792–798. [Google Scholar] [CrossRef]
  42. Björkvald, L.; Buffam, I.; Laudon, H.; Mörth, C.M. Hydrogeochemistry of Fe and Mn in small boreal streams: The role of seasonality, landscape type and scale. Geochim. Cosmochim. Acta 2008, 72, 2789–2804. [Google Scholar] [CrossRef]
  43. Iwata, Y.; Hasegawa, S.; Suzuki, S.; Nemoto, M.; Hirota, T. Effects of soil frost depth and soil temperature on downward soil water movement during snowmelt period. J. Jpn. Soc. Soil Phys. 2011, 117, 11–21. (In Japanese) [Google Scholar]
  44. Ågren, A.; Buffam, I.; Berggren, M.; Bishop, K.; Jansson, M.; Laudon, H. Dissolved organic carbon characteristics in boreal streams in a forest-wetland gradient during the transition between winter and summer. J. Geophys. Res. Biogeosci. 2008, 113, 1–11. [Google Scholar] [CrossRef]
  45. Nagao, S.; Motoki, T.; Kodama, H.; Kim, V.I.; Shesterkin, P.V.; Makhinov, A.N. Migration Behavior of Fe in the Amur River Basin. Rep. Amur Okhotsk Proj. 2007, 4, 37–48. [Google Scholar]
  46. Guan, J.; Yan, B.; Yuan, X. Variations of total dissolved iron and its impacts during an extreme spring flooding event in the Songhua River. J. Geochem. Explor. 2016, 166, 27–32. [Google Scholar] [CrossRef]
  47. Ingri, J.; Conrad, S.; Lidman, F.; Nordblad, F.; Engström, E.; Rodushkin, I.; Porcelli, D. Iron isotope pathways in the boreal landscape: Role of the riparian zone. Geochim. Cosmochim. Acta 2018, 239, 49–60. [Google Scholar] [CrossRef]
  48. Weber, K.A.; Achenbach, L.A.; Coates, J.D. Microorganisms pumping iron: Anaerobic microbial iron oxidation and reduction. Nat. Rev. Microbiol. 2006, 4, 752–764. [Google Scholar] [CrossRef] [Green Version]
  49. Lovley, D.R.; Coates, J.D.; Blunt-Harris, E.L.; Phillips, E.J.P.; Woodward, J.C. Humic substances as electron acceptors for microbial respiration. Nature 1996, 382, 445–448. [Google Scholar] [CrossRef]
  50. Benz, M.; Schink, B.; Brune, A. Humic acid reduction by Propionibacterium freudenreichii and other fermenting bacteria. Appl. Environ. Microbiol. 1998, 64, 4507–4512. [Google Scholar] [CrossRef] [Green Version]
  51. Coates, J.D.; Ellis, D.J.; Roden, E.; Gaw, K.; Blunt-Harris, E.L.; Lovley, D.R. Recovery of humics-reducing bacteria from a diversity of sedimentary environments. Appl. Environ. Microbiol. 1998, 64, 1504–1509. [Google Scholar] [CrossRef] [Green Version]
  52. Kappler, A.; Benz, M.; Schink, B.; Brune, A. Electron shuttling via humic acids in microbial iron(III) reduction in a freshwater sediment. FEMS Microbiol. Ecol. 2004, 47, 85–92. [Google Scholar] [CrossRef] [Green Version]
  53. Street, L.E.; Lessels, J.S.; Subke, J.; Tetzlaff, D.; Wookey, P.A. Redox dynamics in the active layer of an Arctic headwater catchment; examining the potential for transfer of dissolved methane from soils to stream water. J. Geophys. Res. Biogeosci. 2016, 121, 2776–2792. [Google Scholar] [CrossRef]
  54. Fuss, C.B.; Driscoll, C.T.; Johnson, C.E.; Petras, R.J.; Fahey, T.J. Dynamics of oxidized and reduced iron in a northern hardwood forest. Biogeochemistry 2010, 104, 103–119. [Google Scholar] [CrossRef]
  55. Lüdecke, C.; Reiche, M.; Eusterhues, K.; Nietzsche, S.; Küsel, K.; Schiller, F. Acid-tolerant microaerophilic Fe(II)-oxidizing bacteria promote Fe(III)-accumulation in a fen. Environ. Microbiol. 2010, 12, 2814–2825. [Google Scholar] [CrossRef] [PubMed]
  56. Poulton, S.W.; Canfield, D.E. Development of a sequential extraction procedure for iron: Implications for iron partitioning in continentally derived particulates. Chem. Geol. 2005, 214, 209–221. [Google Scholar] [CrossRef]
  57. Ågren, A.; Buffam, I.; Jansson, M.; Laudon, H. Importance of seasonality and small streams for the landscape regulation of dissolved organic carbon export. J. Geophys. Res. Biogeosci. 2007, 112, 1–11. [Google Scholar] [CrossRef] [Green Version]
  58. Prokushkin, A.S.; Pokrovsky, O.S.; Shirokova, L.S.; Korets, M.A.; Viers, J.; Prokushkin, S.G.; Amon, R.M.W.; Guggenberger, G.; McDowell, W.H. Sources and the flux pattern of dissolved carbon in rivers of the Yenisey basin draining the Central Siberian Plateau. Environ. Res. Lett. 2011, 6, 1–14. [Google Scholar] [CrossRef] [Green Version]
  59. Koch, J.C.; Runkel, R.L.; Striegl, R.; McKnight, D.M. Hydrologic controls on the transport and cycling of carbon and nitrogen in a boreal catchment underlain by continuous permafrost. J. Geophys. Res. Biogeosci. 2013, 118, 698–712. [Google Scholar] [CrossRef]
  60. Abesser, C.; Robinson, R.; Soulsby, C. Iron and manganese cycling in the storm runoff of a Scottish upland catchment. J. Hydrol. 2006, 326, 59–78. [Google Scholar] [CrossRef] [Green Version]
  61. Quinton, W.L.; Baltzer, J.L. The active-layer hydrology of a peat plateau with thawing permafrost (Scotty Creek , Canada). Hydrogeol. J. 2013, 21, 201–220. [Google Scholar] [CrossRef]
  62. Quinton, W.L.; Hayashi, M.; Carey, S.K. Peat hydraulic conductivity in cold regions and its relation to pore size and geometry. Hydrol. Process. 2008, 22, 2829–2837. [Google Scholar] [CrossRef]
  63. Watson, V.; Kooi, H.; Bense, V. Potential controls on cold-season river flow behavior in subarctic river basins of Siberia. J. Hydrol. 2013, 489, 214–226. [Google Scholar] [CrossRef]
  64. Ilina, S.M.; Poitrasson, F.; Lapitskiy, S.A.; Alekhin, Y.V. Extreme iron isotope fractionation between colloids and particles of boreal and temperate organic-rich waters. Geochim. Cosmochim. Acta 2013, 101, 96–111. [Google Scholar] [CrossRef]
  65. Pokrovsky, O.S.; Manasypov, R.M.; Loiko, S.V.; Krickov, I.A.; Kopysov, S.G.; Kolesnichenko, L.G.; Vorobyev, S.V.; Kirpotin, S.N. Trace element transport in western Siberian rivers across a permafrost gradient. Biogeosciences 2016, 13, 1877–1900. [Google Scholar] [CrossRef] [Green Version]
Figure 1. (a) map of the Amur River basin; (b) map of the Tyrma region with the large rivers where water samples were collected. This map is colored by a gradient (degree) to clearly show terrain characteristics. As for the symbols in map (b), the black rectangle denotes the Sofron River watershed where intensive research was conducted; black circles denote the river water sampling sites of the Sturi, Tyrma, and Yaurin Rivers; and black diamond denotes the Tyrma village. This map was created by the authors based on 30 m resolution digital elevation model (DEM) provided by the Japan Aerospace Exploration Agency (JAXA).
Water 12 02579 g001
Figure 2. (a) nine sampling points for soil pore waters (N1–N9) in the Sofron River and neighboring area. This map is colored by gradient (degree) to clearly show terrain characteristics. Area enclosed with a black line shows the Sofron watershed, and the white arrow denotes the sampling site of the Sofron River. This map was created by the authors based on a 30 m resolution digital elevation model (DEM) provided by the Japan Aerospace Exploration Agency (JAXA); (b) topographic profile through the sampling points for soil pore waters.
Water 12 02579 g002
Figure 3. (a) seasonal changes in dFe and DOC concentrations in the Sofron River; (b) daily change in water level of the Sofron River and daily amount of rainfall in the Tyrma region; (c) liner regression plot of DOC and dFe concentrations in the Sofron River. Blue circles show the data from April to June (first seven samples in (a)), and red triangles show the data from July to October (late nine samples in (a)). The regression lines were calculated by the least squares method.
Water 12 02579 g003
Figure 4. Seasonal changes in dFe and DOC concentrations in the Sofron River and the large rivers (Sturi, Tyrma, and Yaurin) [(a) dFe concentration; (b) DOC concentration; (c) dFe/DOC molar ratio].
Water 12 02579 g004
Figure 5. Seasonal changes in daily mean soil temperatures at N1, N4, and N6.
Water 12 02579 g005
Figure 6. Seasonal changes in dFe concentrations in surface soil pore waters at N4 and N6, observed from the snowmelt season.
Water 12 02579 g006
Figure 7. Seasonal changes in dFe concentrations in soil pore waters of 20 cm and 40 cm depths at the points along a transect. Note that the observation at these points started after snowmelt season. There is no result for N5, which is located on steep hillslope because the soil pore water could not be collected throughout the year.
Water 12 02579 g007
Table 1. Terrain type, sampling depth of soil pore waters, active layer thickness (ALT), and peat layer thickness (PLT) at nine sampling points of the research site in September 2016 (Tyrma, Khabarovsk, Russia). Pore waters at marked (*) depths at N4 and N6 were collected four times in May and twice a month from June to October. Other soil pore waters at nine sampling points were collected twice a month from June to October.
Point NumberTerrain TypeSampling Depth (cm)ALT (cm)PLT (cm)
N1Valley20, 4064>64
N2Valley20, 4060>60
N3Valley20, 4082>82
N4Boundary between valley and hillslope5 *, 10 *10212
N5Steep hillslope40No permafrost7
N6Ridge10 *, 25 *, 20, 40No permafrost42
N7Ridge20, 407540
N8Gentle hillslope20, 4012745
N9Valley20, 4053>53
Table 2. Organic carbon contents and weight moisture contents at each point of the research site in September 2016 (Tyrma, Khabarovsk, Russia).
Point NumberTerrain TypeOrganic Carbon Content (gC kg 1 )Weight Moisture Content (%)
0–10 cm10–20 cm20–30 cm0–10 cm10–20 cm20–30 cm
N1Valley40545133192.793.089.8
N2Valley47840347499.799.098.4
N3Valley41131110099.592.190.3
N4Boundary between valley and hillslope3581432992.445.832.4
N5Steep hillslope142626190.064.458.3
N6Ridge35526219774.375.969.3
N7Ridge3311625249.442.640.5
N8Gentle hillslope482482368.148.738.7
N9Valley14429329799.899.578.0
Table 3. Thawing dates for each depth at N1, N4, and N6, and thawing rates between depths. Thawing dates were defined as the day when the average daily soil temperature exceeded 0 degree. Thawing rate was calculated by dividing the difference in depth by the number of required days for thawing.
Depth (cm)N1N4N6
Thawing Date105/244/294/18
(mm/dd)256/155/186/5
50 7/17/2
Thawing Rate10→250.680.790.31
(cm  day 1 )25→50 0.570.93

