Communication

Genetic Structure and Population Demography of White-Spotted Charr in the Upstream Watershed of a Large Dam

1
Laboratory of Ecosystem Management, Graduate School of Agriculture, Hokkaido University, Kita-ku, Sapporo, Hokkaido 060-8589, Japan
2
Kawatabi Field Science Center, Graduate School of Agricultural Science, Tohoku University, Yomogida, Naruko-onsen, Osaki, Miyagi 989-6711, Japan
*
Author to whom correspondence should be addressed.
Water 2020, 12(9), 2406; https://doi.org/10.3390/w12092406
Submission received: 14 July 2020 / Revised: 19 August 2020 / Accepted: 24 August 2020 / Published: 27 August 2020
(This article belongs to the Special Issue Endangered Freshwater Ecosystems: Threats and Conservation Needs)

Abstract

:
White-spotted charr (Salvelinus leucomaenis leucomaenis) is an anadromous fish that has been severely harmed by human land-use development, particularly through habitat fragmentation. However, the anthropogenic impacts on populations of this species have not been evaluated, except those on small dammed-off populations. Using multiplexed ISSR genotyping by sequencing, we investigated the genetic structure of white-spotted charr in four tributaries in the upper section of the Kanayama Dam in the Sorachi River, Hokkaido Island, Japan. There were no distinct genetic structures (FST = 0.014), probably because some active individuals migrate frequently among tributaries. By model-flexible demographic simulation, historical changes in the effective population size were inferred. The result indicates that the population size has decreased since the end of the last glacial period, with three major population decline events, including recent declines that were probably associated with recent human activities. Nevertheless, populations in the watershed upstream of the Kanayama Dam are still expected to be at low risk of immediate extinction, owing to the large watershed size and the limited number of small check dams. An effective conservation measure for sustaining the white-spotted charr population is to maintain high connectivity between tributaries, such as by providing fishways in check dams during construction.

1. Introduction

Anthropogenic impacts on freshwater ecosystems are numerous and include flow alteration, pollution, species invasion, water abstraction, fisheries activities, and climate change [1,2]. Since the latter half of the 20th century, human land-use activities and resource exploitation have had substantial effects on stream-dwelling organisms [3]. Habitat fragmentation caused by dams has created numerous isolated populations that often suffer from reduced population size and are at high risk of extinction due to demographic and environmental stochasticity [4,5]. Currently, freshwater ecosystems are one of the most threatened ecosystems in the world [6]. In the case of migratory fishes, such as salmonids, the effects of impassable barriers are particularly severe because they cannot complete their life cycles within isolated stream fragments [7].
White-spotted charr (Salvelinus leucomaenis) is a cold-water adapted salmonid fish that is commonly distributed in mountain streams of Far East Asia [8]. White-spotted charr is classified into four subspecies, and three of them, S. leucomaenis pluvius, S. leucomaenis japonicus, and S. leucomaenis imbrius, mostly have a fluvial (nonmigratory) life history, probably since the time of postglacial global warming [9,10,11]. The other subspecies, S. leucomaenis leucomaenis, inhabits higher-latitude regions and generally has an anadromous life history [12,13]. However, this subspecies is easily landlocked in rivers following the construction of barriers that prevent upstream migration [14]. In Hokkaido, S. leucomaenis leucomaenis have inhabited the upper reaches of many rivers, except extremely cold-water streams where Dolly Varden (S. malma) dominate [15]. Since such migratory cold-water fish are vulnerable to anthropogenic impacts and ongoing global warming [16], strategic conservation plans are required.
Genetic approaches are useful for conservation because they can be tools for estimating dispersal patterns [17], defining management units based on population structure [18], or understanding the current status of populations by estimating the effective population size [7,19]. Although white-spotted charr is one of the less-studied species among salmonids [8], several population genetic studies have been conducted on a large scale (e.g., [11,20]) and at the local scale (e.g., [13,21]). However, studies aiming to understand the current vulnerability of S. l. leucomaenis populations are limited to studies in small dammed-off habitats with watershed areas of approximately < 50 km2 [7,22]. These studies have shown remarkable declines in effective population size in the upper reaches of small dams, resulting in local extinctions in some rivers. On the other hand, for populations upstream of large dams with lakes, population structure has not been investigated and the potential impacts on upper populations remain unknown. Furthermore, while habitat degradation due to human activities is a more ubiquitous problem [1], its actual impacts on populations have been poorly studied.
Advances in molecular ecology methods allow us to access higher resolution information on population demographic history as well as population structure [23]. Although population demography does not directly elucidate the causes of impacts, it is an essential parameter in population health and viability, and the inference of demographic history can potentially yield important insights in rapidly changing ecosystems [24,25]. In this study, using genome-wide single nucleotide polymorphism (SNP) data and a model-flexible simulation approach based on the site frequency spectrum (SFS), we estimate the genetic structure and population demography of white-spotted charr in the upper section of the Sorachi River, Hokkaido Island, Japan. The aims of this study are (i) to evaluate the local genetic structure of above-dam white-spotted charr, (ii) to explore population demographic history using SFS, and (iii) to discuss the relationship between inferred population dynamics and recent human land-use development and resource exploitation, including dam construction.

2. Materials and Methods

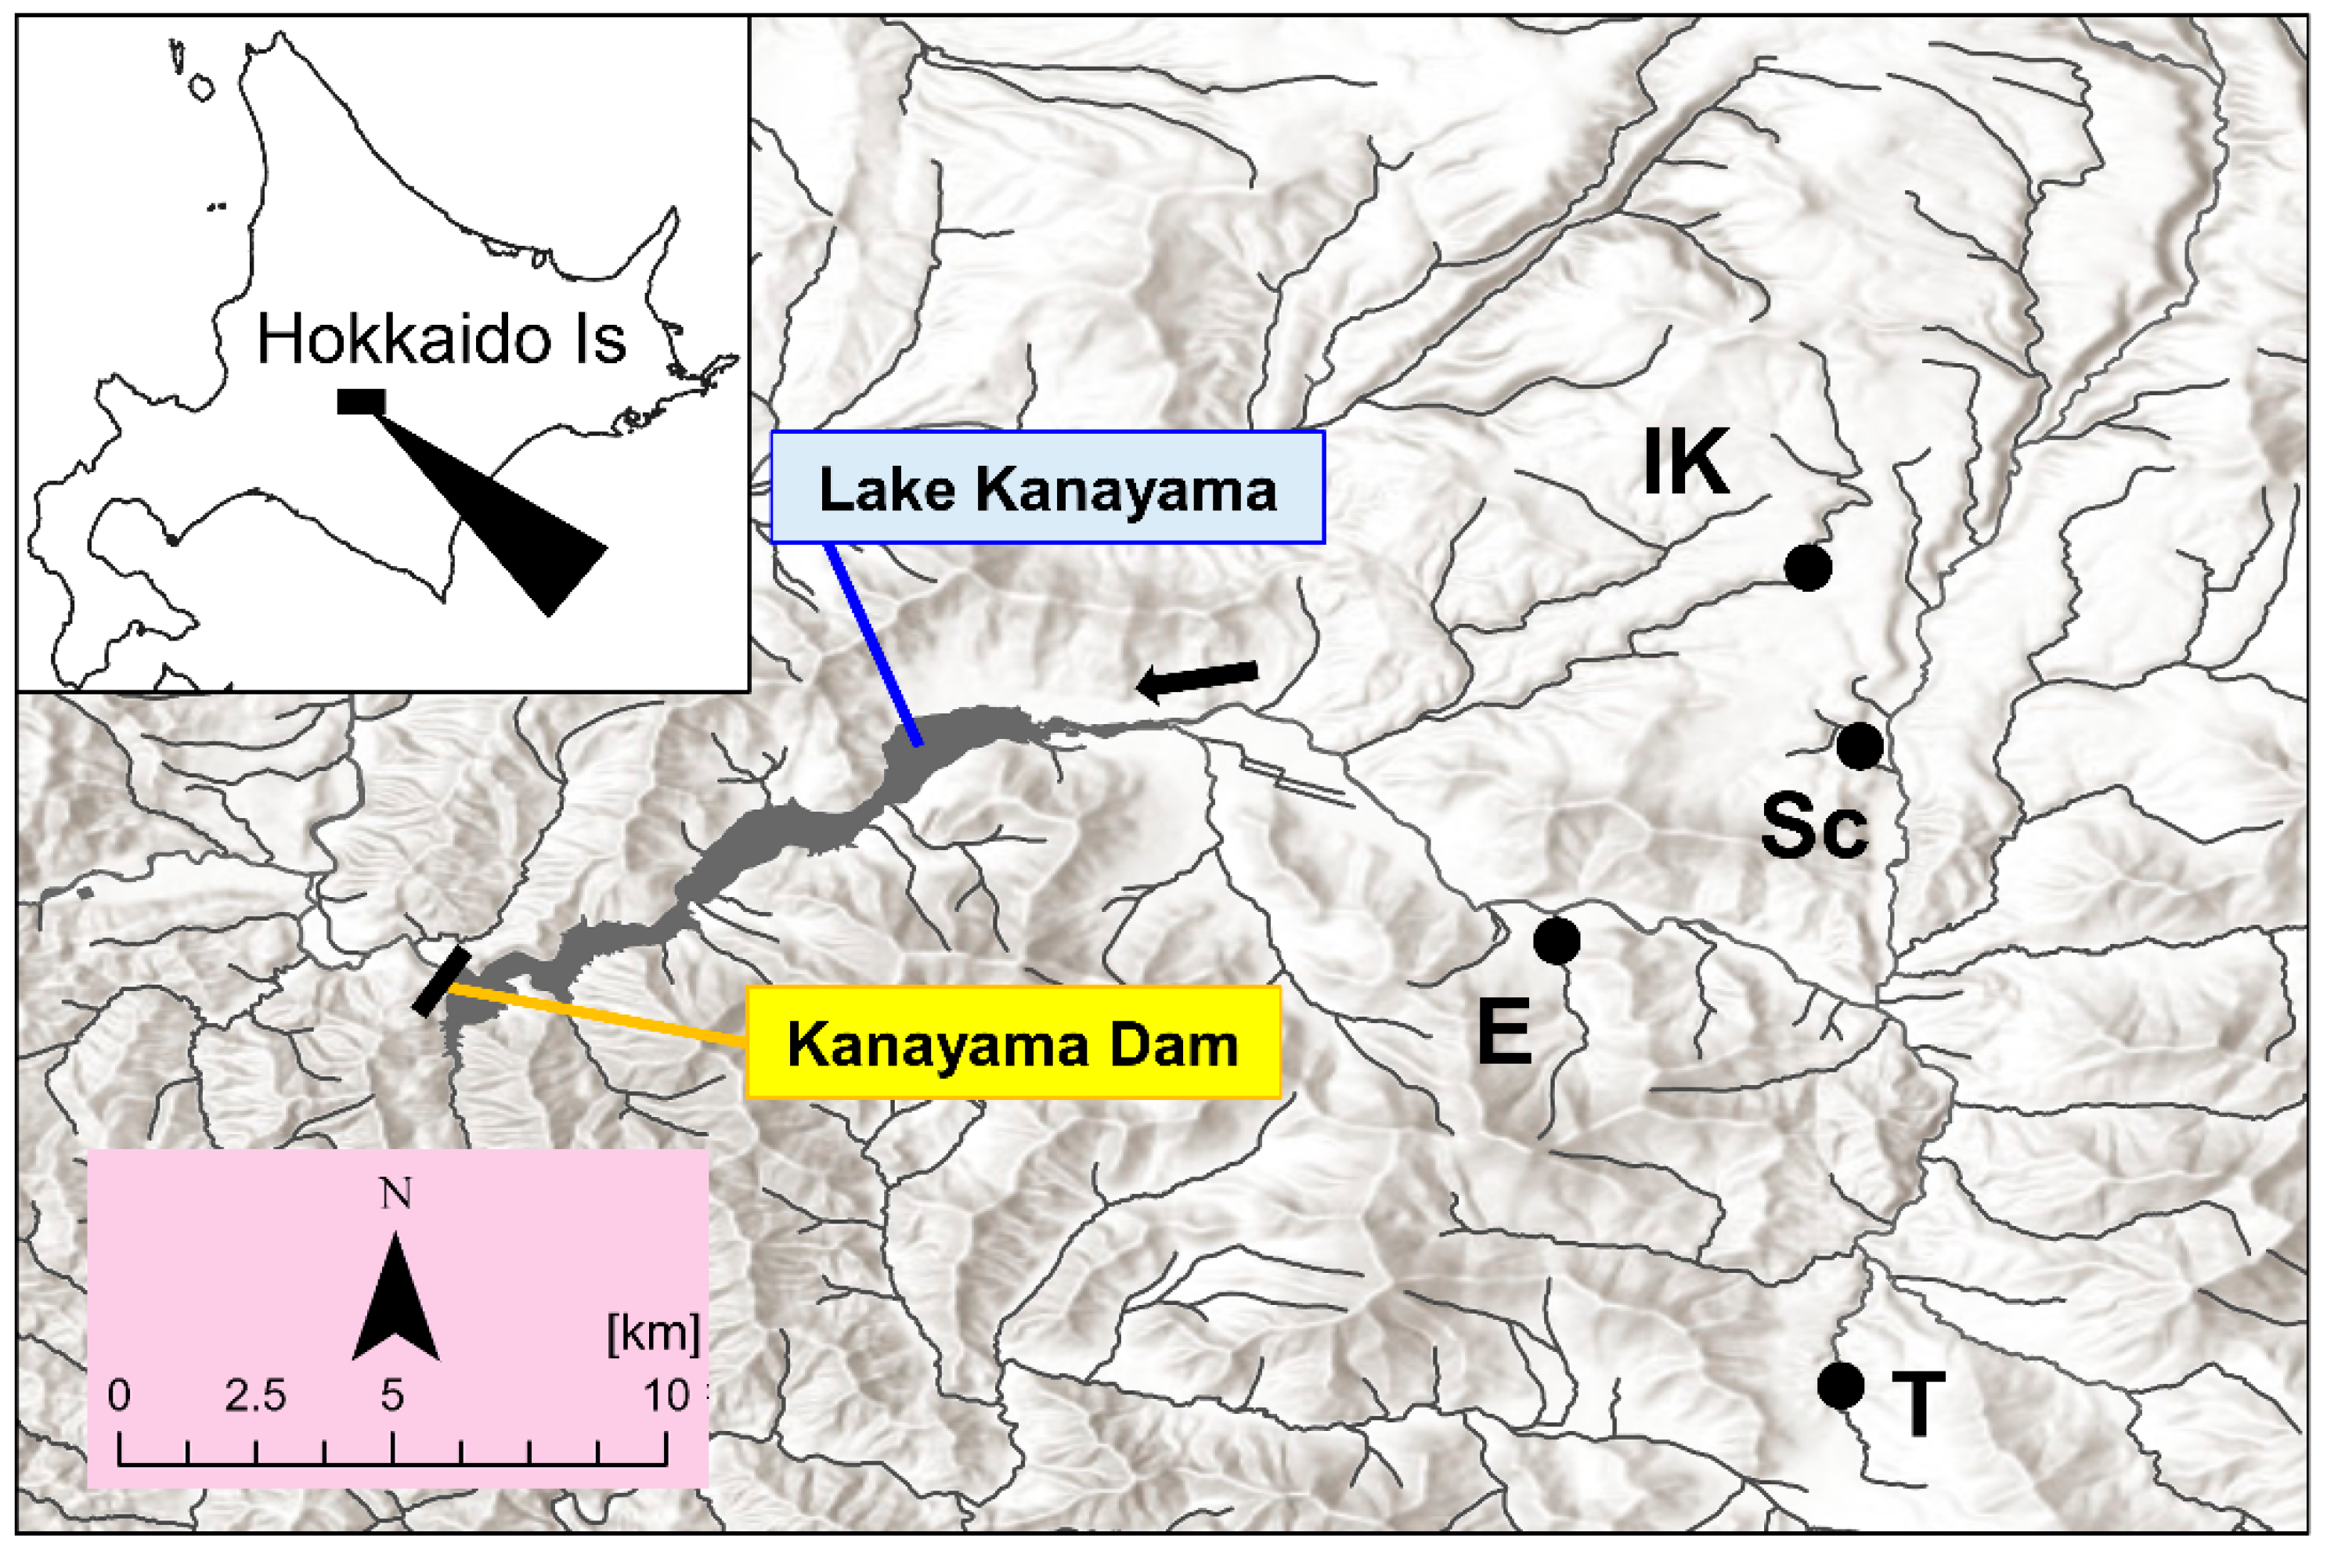
2.1. Study Area and Field Sampling

This study was conducted in the upper section of the Sorachi River in the Ishikari River system, which is the second largest watershed in Japan (Figure 1). All the study sites are located upstream of Lake Kanayama, which was formed by the construction of the Kanayama Dam in the 1960s [26]. The watershed area of the Kanayama Dam is 470 km2 [27], and there is a relatively small number of artificial barriers in this watershed. The fish compositions among tributaries are different due to their heterogeneous environment, but overall, Salvelinus malma krascheninnikovi, Cottus nozawae, Barbatula oreas, and Parahucho perryi inhabit this watershed. There were no records of white-spotted charr being artificially released in this area, so we considered all caught individuals to be native.
A total of 55 Salvelinus leucomaenis leucomaenis were caught at four sites in the upper section of the Sorachi River system by electrofishing (model 12-B Backpack Electrofisher; Smith-Root Inc., Vancouver, USA) from 10 July to 1 September in 2019. After measuring standard lengths, small pieces of fin tissue were clipped, placed in 99.5% ethanol, and stored at −20 °C in the laboratory until DNA extraction. Total DNA was extracted using a QIAGEN DNeasy Blood and Tissue Kit (Qiagen Inc., Hilden, Germany).

2.2. DNA Amplification and Sequencing

To obtain genome-wide SNP data, we used multiplexed ISSR genotyping by sequencing (MIG-seq) [28]. A MIG-seq library was prepared following the protocol outlined in Suyama and Matsuki [28], with the exception of the minor modifications outlined below. The first PCR was conducted using eight ISSR primer sets with tail sequences at an annealing temperature of 38 °C. The second PCR was conducted using primer pairs including tail sequences, adapter sequences for Illumina sequencing, and five-base (forward) and nine-base (reverse) barcode sequences to identify each individual sample. The second PCR conditions were 12 cycles of denaturation at 98 °C for 10 s, annealing at 54 °C for 15 s, and extension at 68 °C for 1 min. Fragments in the size range of 400–800 bp in the purified library were isolated. After library quantification, the products were sequenced on an Illumina MiSeq platform (Illumina) using the MiSeq Reagent Kit v3 following the manufacturer’s protocol. The sequence data are available from the Figshare (https://doi.org/10.6084/m9.figshare.12547250).

2.3. SNP Detection for Genetic Diversity and Population Structure Analysis

After removing the primer regions and low-quality reads according to Suyama and Matsuki [28], 4,073,256 reads were obtained. SNP selection was performed by the STACKS 2.41 pipeline [29] with the following parameters: minimum depth option creating a stack (m) = 3, maximum distance between stacks (M) = 2, maximum mismatches between loci when building the catalog (n) = 2, and number of mismatches allowed to align secondary reads (N) = 4. Only SNPs recorded at a rate of more than 60% among all samples were extracted, and sites showing excess heterozygosity (>0.6) were removed. For genetic diversity and population structure analysis, the minimum allele count was set to two, and the output was limited to one SNP per locus. After filtering, three individuals with many (>50%) missing data were removed, and the above filtering procedure was performed again for 52 retained individuals, to increase the number of loci as much as possible. After filtering on the 52 individuals, 343 SNPs were retained.

2.4. Genetic Diversity, Divergence, and Population Structure

For each population, observed heterozygosity (HO), expected heterozygosity (HE), fixation index (FIS), and their standard errors were calculated using the ‘populations’ commands in STACKS. Genetic differentiation among populations was evaluated by calculating FST. Pairwise FST values were also calculated with a significance test. To test ‘isolation by distance’ pattern, a Mantel test between the waterway distance and the FST matrix was performed with 10,000 permutations. To identify major patterns of genetic variation, principal coordinates analysis (PCoA) was conducted. These analyses were conducted using GenAlEx 6.5 [30]. Then, the population structure was examined using STRUCTURE 2.3.4 [31], a Bayesian clustering method using multilocus allele frequency data. The settings in STRUCTURE were an admixture model and the correlated allele frequency model. We did not use location information as a prior to ensure that clustering would be determined solely by genetic variation. The algorithm was run 20 times for each K from 1 to 4 with a burn-in of 20,000 and following 30,000 MCMC replicates. The program CLUMPAK [32] was used to compile the results of multiple runs for each K, and STRUCTURE HARVESTER [33] was used to calculate the probability of the data (LnP(K) [31]) and Evanno’s delta K [34]. Finally, to estimate sibling relationships among individuals, a pairwise comparison was made using the software ML-RELATE [35] based on the maximum-likelihood method.

2.5. SNP Detection for SFS

For identified full sibling pairs, one individual of the pair was removed to exclude sampling bias as in Faulks and Ostman [36]. Using the remaining 47 individuals, SNPs recorded at a rate of more than 60% among all samples were extracted, and sites showing excess heterozygosity (>0.6) were removed. The minimum allele frequency was set to 0.00, and the output was not limited to one SNP per locus. From 126,897 sites, 573 SNPs on 399 loci were obtained.

2.6. Inference of Population Demographic History

Population demography was inferred by Stairway plot 2.1 [37], a model-flexible method of inferring historical changes in population size. According to the results of the former analysis, we treated the 47 individuals as one population and made a folded site frequency spectrum (folded SFS) using easySFS [38], a Python script. To account for missing data, the population was downsampled to 28 individuals with relative SNP proportions to make the SFS. The parameter settings were as follows: 67% of sites for training; random break point at 14, 28, 42, and 56; years per generation was assumed to be four temporarily (discussed later). Mutation rate is difficult to determine for SNP data. Here, we assumed it as 1.0 × 10⁻⁸, a value most frequently used in studies on fish [39,40,41,42,43]. Confidence intervals were generated among the 500 bootstrapped folded SFS.

3. Results

3.1. Genetic Diversity and Divergence

Both observed heterozygosity and expected heterozygosity were similar across the four sites (Table 1). The overall FST = 0.014 (p < 0.05) and pairwise FST ranged from 0.004 to 0.022 (Table 2). Three of the six pairs showed significant pairwise FST value. From the Mantel test, there was no significance but a high correlation between waterway distance and FST (r = 0.84; p = 0.08).

3.2. Population Genetic Structure

In the STRUCTURE analysis, a weak pattern appeared (Figure 2A). For K = 2, the Tomamu River (T) appeared to make up one cluster, and for K = 3, two individuals in one population were assigned to another cluster. However, the probability of the data (LnP(K)) decreased even during K = 1 and 2, and higher variance in LnP(K) among runs was apparent when K ≥ 2 (Figure 2B). Because ΔK is based on the rate of change in LnP(K) [34], only ΔK when K = 2 and 3 were calculated in this situation. ΔK for K = 2 was higher than that for K = 3 (Figure 2B). The PCoA also indicated that there was no clear grouping by population (Figure 2C).

3.3. Sibling Relationships

The maximum likelihood designation of ML-RELATE identified some degree of sibling relationship within and between sampling sites (Table 3). Although half siblings were detected in both the same-tributary pairs and the different-tributary pairs, full siblings were detected only in the same-tributary pairs.

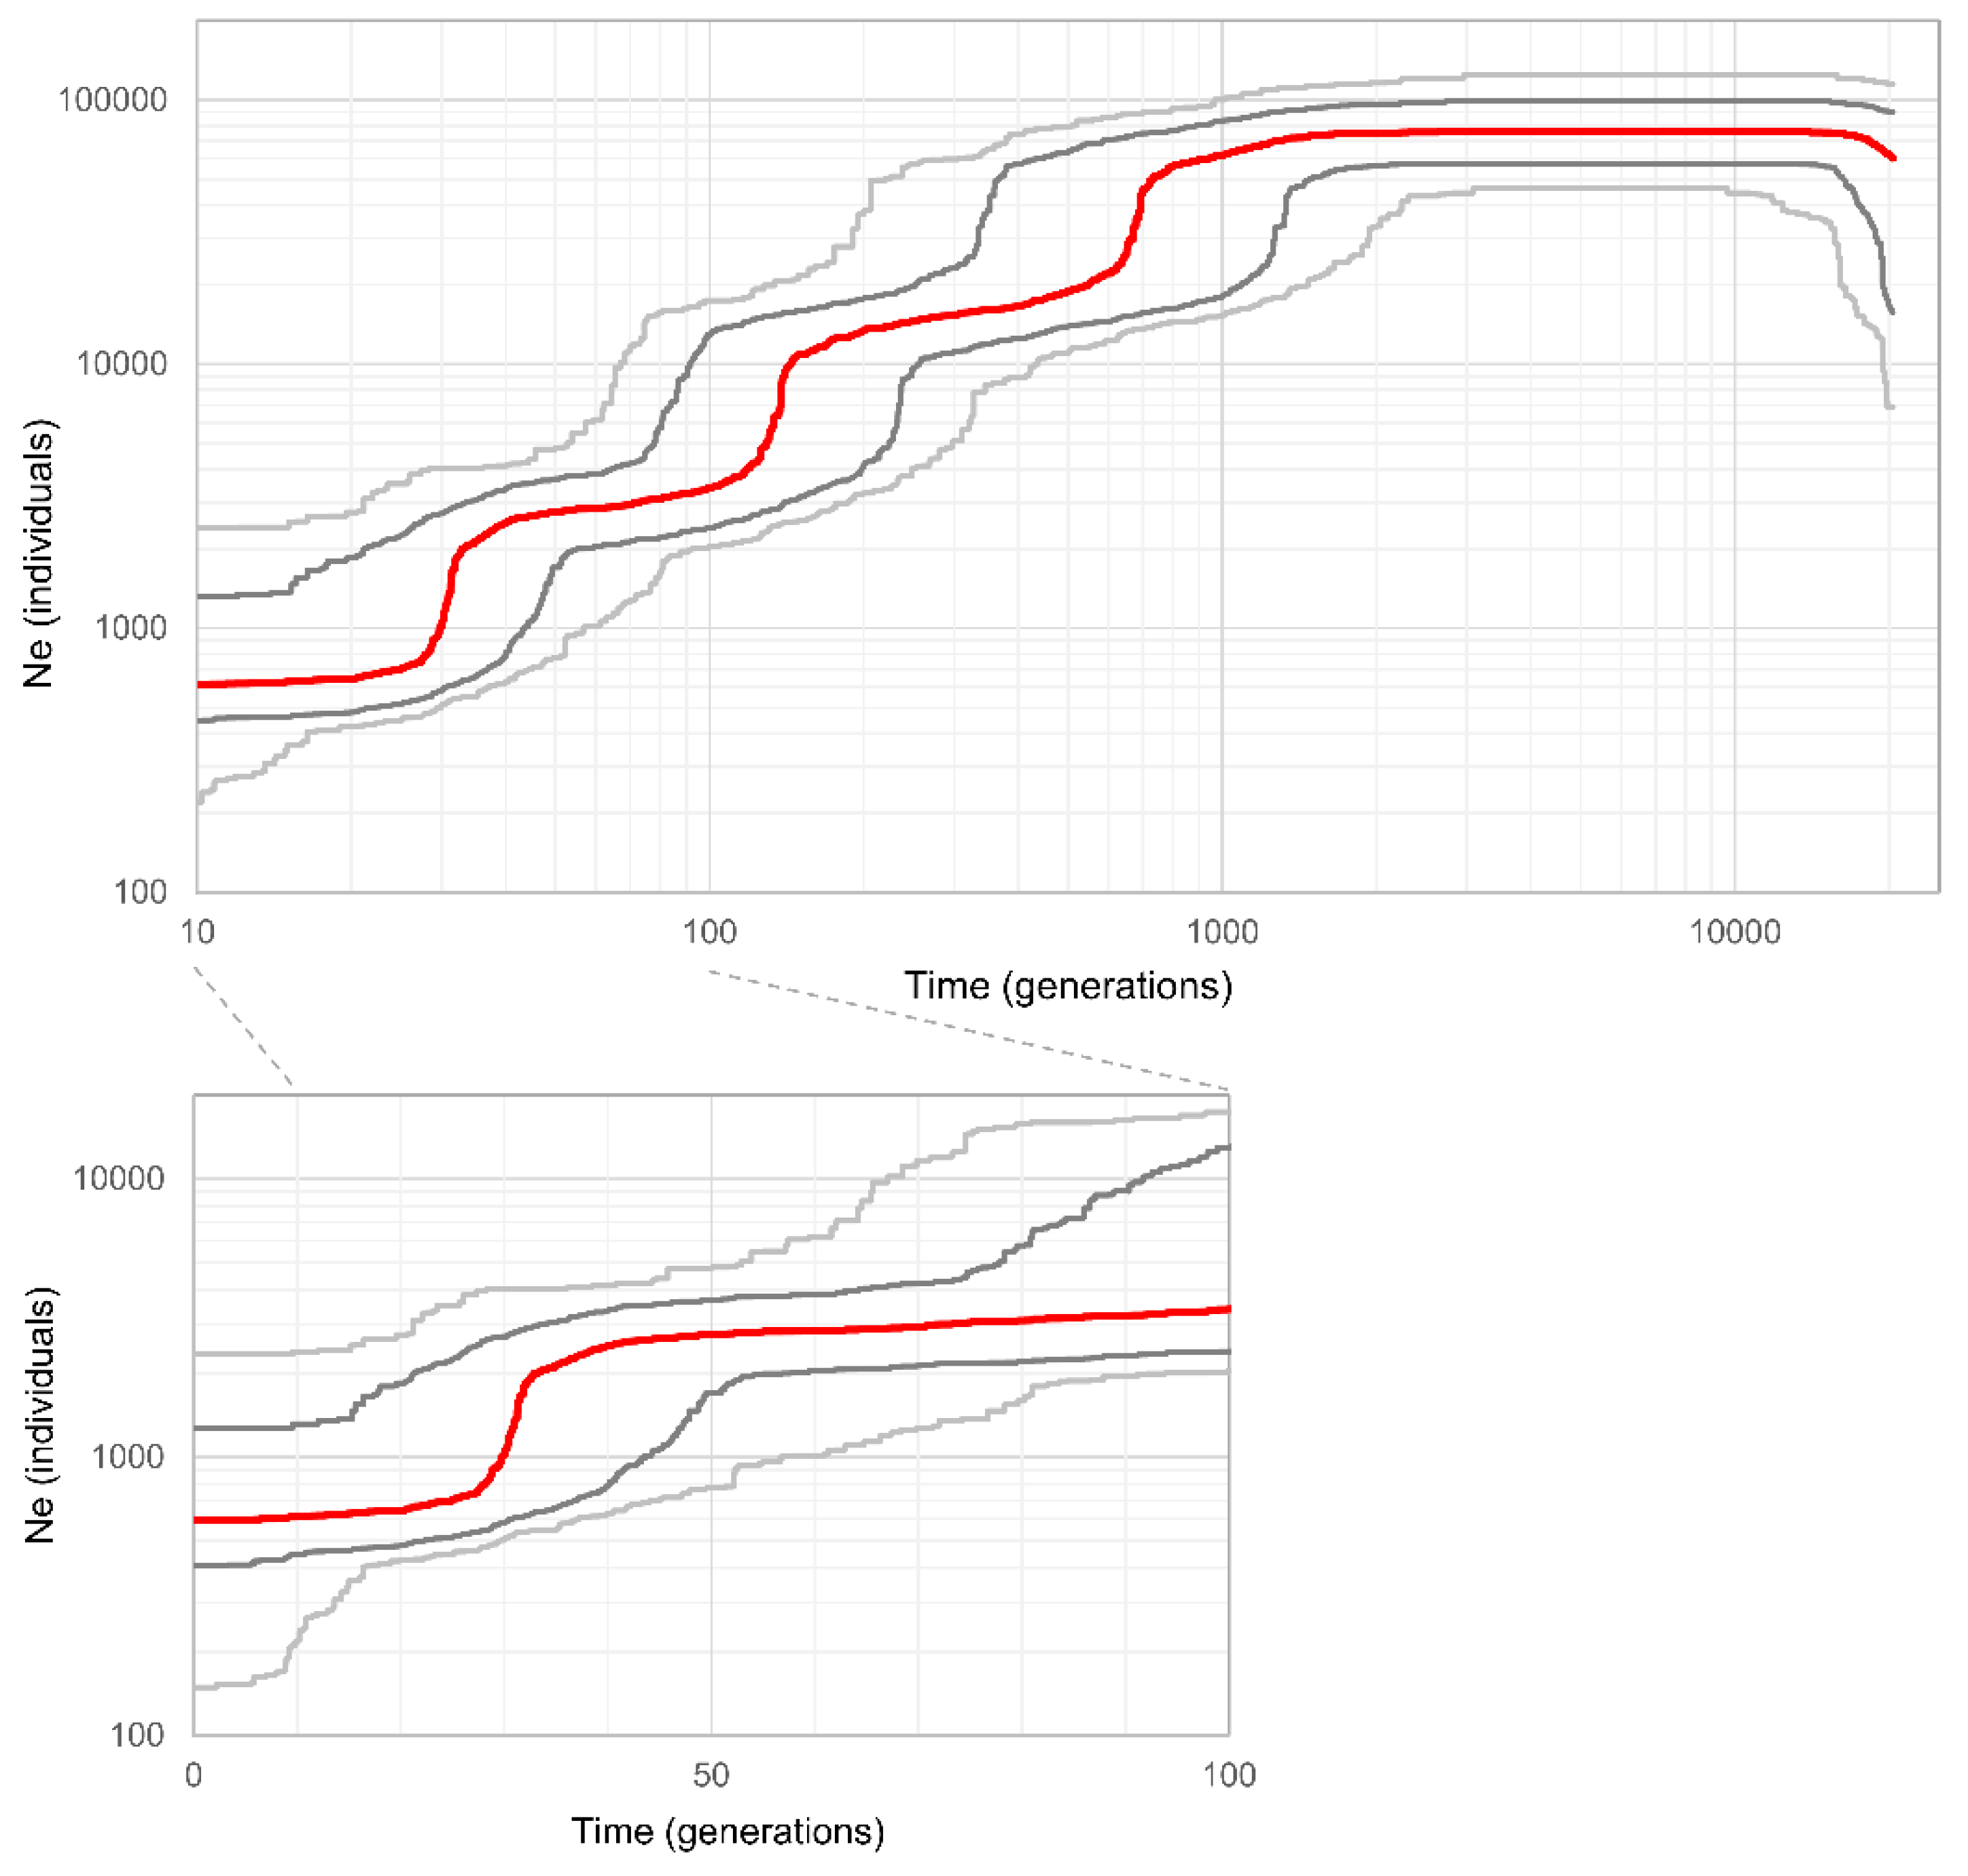
3.4. Population Demographic History

The stairway plot suggested that the effective population size has declined, starting from approximately 2000 generations ago, and has now reached 595 (Figure 3). The population decline trend was characterized by three large population shrinking events. Focusing on the median, the earliest shrinking event was inferred to have occurred approximately 700 generations ago, the second shrinking event approximately 150 generations ago, and the most recent event approximately 30 generations ago, with wide confidence intervals.

4. Discussion

This study revealed the population structure and demographic history in the upper section of a large dam. White-spotted charr in the watershed had a moderate level of genetic diversity and the differences among sites were small (HE = 0.20–0.21). As we obtained SNP data, it is difficult to compare genetic diversity with many previous studies using microsatellites [44,45]. Comparing values with previous studies that investigate native salmonids using genome-wide SNP data (but not by MIG-seq), the level of genetic diversity is comparable. For lake trout (Salvelinus namaycush): HE = 0.07–0.22 in lakes in Québec [46,47]; Brook charr (Salvelinus fontinalis): HE = 0.22–0.37 in North America (anadromous) [48] and 0.16–0.21 in lakes in Québec [49]; Brown trout (Salmo trutta): HE = 0.09–0.14 in lakes in Finland [45]; Atlantic salmon (Salmo salar): 0.12–0.30 in Europe and North America (anadromous) and 0.10–0.17 in Europe (landlocked) [50]. Thus, from a conservation perspective, efforts should be made with the intent of maintaining this extant genetic variation.
The genetic divergence among populations was low and the genetic structure was weak. The low FST values between connected sites within a single watershed are consistent with a previous study [21]. In the STRUCTURE analysis, although a dominant cluster for the Tomamu River (T) is visible (Figure 2), the mean LnP(K) of K = 1 was higher than that of K = 2, and its deviations were large at K ≥ 2, suggesting that K = 1 is the appropriate K. Since genetic variation was much higher between individuals than between populations, the confounding effect of kinship structure may have been detected as noise. In addition to the low FST values, relationship analyses detected lots of half sibling pairs within and among sampling tributaries, indicating that some actively migrating individuals (male or female) move freely between tributaries and participate in reproduction.
However, the genetic composition was not completely mixed. The weak genetic structure pattern was drawn by FST, STRUCTURE, and the Mantel test. Some previous studies identified ‘isolation by distance’ pattern between adjacent rivers [51,52], which was probably formed by homeward migration and some individuals straying into neighboring rivers [53]. These are observations of genetic structure formed by migration through the ocean, but the principles that site fidelity and straying created the genetic structure would be the same as in our study.
An important point is the strength of the genetic structure. Since salmonids have a complex life history, their population structure depends on species, localities, or landscapes. At similar spatial scales as the present study, some studies show a distinct genetic structure within watersheds [54,55], and others do not [36,56]. Thus, the genetic structure pattern observed in this study would be an important case study. One possible explanation for the low genetic differentiation is the occurrence of an admixture event. Faulks and Ostman [36], who investigated other Salvelinus species around a Swedish alpine lake and displayed low FST values similar to the present study, suggested that habitat loss and introduced species might have disrupted and mixed past spawning units. In the present study, it is quite possible that fragmentation and the subsequent alterations in life history induced admixture.
The stairway plot suggested three population contraction events (Figure 3). In demographic analysis, considering the uncertainty represented by the confidence intervals (CIs) for the demographic parameters is important [57]. Thus, we discuss the results based on the 75% CI here. The most recent contraction was inferred to have occurred approximately 15–50 generations ago, the second approximately 80–250 generations ago, and the earliest approximately 300–1500 generations ago. Converting the generation time to years is a difficult problem [57]. In white-spotted charr, the generation time varies depending on their life history, but a study conducted in the southern part of Hokkaido reported that above-dam female charr mature at three years [58]. However, when populations can migrate to the ocean, sexual maturity occurs 1–3 years later [14]. Thus, it is reasonable to consider the generation time as five years until the dam construction began. Assuming the generation time after and before 60 years ago as three and five years, respectively, the most recent population decline was inferred to have occurred approximately 45–210 years ago. In the median trajectory, the major decline occurred approximately 110 years ago, beginning 150 years ago. This period coincides with the beginning of active human land-use development and resource exploitation. Since the upper section of the Sorachi River was known as a good place to collect gold dust in the late 19th century [59], the human population increased, and the following land-use activities, such as farmland development, forestry activities, and road construction as well as mining activities, became prominent [60]. Generally, these anthropogenic land-use development and resource exploitation activities have significant impacts on freshwater ecosystems by polluting the water or providing fine sediment [3,61,62]. From about 1900 to 1920, human immigration, placer mining, and farmland development reached their peak [60], corresponding to the time of the detected major decline. The beginning of the construction of the Kanayama Dam in 1961 would have also had considerable impacts on the white-spotted charr population and brought it to its current population size.
Assuming a long-term generation time of five years, the second major decline is inferred to have occurred approximately 400–1300 years ago, and the earliest decline occurred approximately 1500–7500 years ago. Previous studies suggested or predicted that postglacial warming might have reduced the habitat size of white-spotted charr approximately 5000–7000 years ago [9,11,12,20,63], and most of the other three subspecies of white-spotted charr are thought to have become landlocked at this time. The inferred time of the earliest decline roughly matches this period, supporting this scenario. Additionally, the beginning of the overall population decline trend (approximately 2000 generations ago) coincides with the end of the last glacial period about 10,000 years ago. For the second decline event, it is difficult to interpret and identify the direct cause. As with the earliest decline, it refers to a population connected to the ocean and was likely influenced by events on a broader scale than within the Sorachi River. Although there are few records of historical events in Hokkaido [60], one possible explanation of the second decline is a large disaster such as an earthquake or a volcanic eruption. Native Ainu lore suggests that major earthquakes frequently occurred in the 12th–18th centuries [64], which may be related to the population decline. Regardless, it should be noted that the 95% CI for the timescale is larger than 75% CI, and there are various uncertainties in the estimated pattern, including the correct estimation of the mutation rate and generation time, which are directly related to the estimation of time. Nevertheless, stairway plots are thought to produce more accurate estimations than other methods, especially for recent changes in population size [37,65], and our result has meaningful implications.
It is generally accepted that effective population sizes of less than about 50 and 500 are vulnerable to the immediate effects of inbreeding depression and long-term extinction risk, respectively [19,66]. Regarding white-spotted charr in this area, although it was revealed that recent human activities had an impact on the population, the contemporary effective population size was estimated to be around 500 individuals in the stairway plot, implying that the immediate impact is likely low. From a broad perspective, the population in the upper Kanayama Dam basin may be rather valuable. Just below the Kanayama Dam, many non-native charr have been released and hybridized with natural native charr after the construction of the dam [67]. Moreover, the downstream section probably has a higher risk of global warming and contemporary land-use pressure. Perhaps, a population that cannot migrate downstream might be safer than downstream populations. However, an isolated population has no supply of adaptive genetic variation. It is unknown from this study how the population demography will change in the future with global warming, and further study is necessary to predict these changes.
Nowadays, most rivers are highly fragmented, and it is rather rare to find rivers or streams with no barriers [58]. Currently, many check dams are still under construction in Hokkaido, including in the Sorachi River watershed, and the number of artificial barriers is still increasing. Many fragmented streams with small watershed areas are already experiencing localized extinction [7,52]. In the above-dam section of the Kanayama Dam, there is a relatively long section with no barriers. If fish are currently moving dynamically through the upper reaches of the dam and maintaining their genetic diversity, as this study indicates, the most important measure for conservation is maintaining this large habitat without impassable artificial barriers by providing fishways when constructing check dams.
The weakness of the present study was the limited number of sampling sites and individuals, as it merely investigated the tributaries of the largest rivers flowing into one dammed lake. Nevertheless, the analysis yielded meaningful information. Additional research on other above-dam sections and barrier-free sections is needed to obtain more robust and practical conclusions.
In conclusion, despite the small sample size, genome-wide SNP analysis and a demographic simulation based on SFS revealed that (i) the genetic structure of the upper dam lake has been made nearly uniform by some active individuals and (ii) the recent rapid decline in population size, which is probably related to human activities including dam construction, is comparable to that caused by postglacial warming. Since large populations face less-immediate impacts than small populations, the important role of large populations in species persistence tends to be overlooked. Therefore, understanding the current population status and not causing further fragmentation to maintain large populations are very important.

Author Contributions

Conceptualization, S.N. and F.N.; Methodology, S.N., S.K.H., A.M., Y.S. and F.N.; Formal Analysis, S.N. and S.K.H.; Investigation, S.N. and A.M.; Writing—Original Draft Preparation, S.N.; Writing—Review and Editing, S.K.H., A.M., Y.S. and F.N.; Funding Acquisition, F.N. All authors have read and agreed to the published version of the manuscript.

Funding

This study was supported by the research fund for the Ishikari and Tokachi River provided by the Ministry of Land, Infrastructure, Transport, and Tourism (MLIT) of Japan.

Acknowledgments

We are grateful to Kenichiro Morita and Taihei Yamada for valuable advice about the research. We also thank members of the Ecosystem Management Laboratory of Hokkaido University for assistance with the field sampling. We appreciate anonymous reviewers for their valuable comments to the earlier version of the manuscript.

Conflicts of Interest

The authors declare no conflict of interest.

References

  1. Reid, A.J.; Carlson, A.K.; Creed, I.F.; Eliason, E.J.; Gell, P.A.; Johnson, P.T.J.; Kidd, K.A.; MacCormack, T.J.; Olden, J.D.; Ormerod, S.J.; et al. Emerging threats and persistent conservation challenges for freshwater biodiversity. Biol. Rev. 2019, 94, 849–873. [Google Scholar] [CrossRef] [PubMed] [Green Version]
  2. Dodds, W.K.; Perkin, J.S.; Gerken, J.E. Human impact on freshwater ecosystem services: A global perspective. Environ. Sci. Technol. 2013, 47, 9061–9068. [Google Scholar] [CrossRef] [PubMed]
  3. Yamada, H.; Nakamura, F. Effects of fine sediment accumulation on the redd environment and the survival rate of masu salmon (Oncorhynchus masou) embryos. Landsc. Ecol. Eng. 2009, 5, 169–181. [Google Scholar] [CrossRef] [Green Version]
  4. Lande, R. Anthropogenic, Ecological and Genetic Factors in Extinction and Conservation. Res. Popul. Ecol. 1998, 40, 259–269. [Google Scholar] [CrossRef]
  5. Haddad, N.M.; Brudvig, L.A.; Clobert, J.; Davies, K.F.; Gonzalez, A.; Holt, R.D.; Lovejoy, T.E.; Sexton, J.O.; Austin, M.P.; Collins, C.D.; et al. Habitat fragmentation and its lasting impact on Earth’s ecosystems. Sci. Adv. 2015, 1, 1–10. [Google Scholar] [CrossRef] [PubMed] [Green Version]
  6. WWF. Living Planet Report 2018: Aiming Higher; Grooten, M., Almond, R.E.A., Eds.; World Wildlife Fund: Gland, Switzerland, 2018. [Google Scholar]
  7. Morita, K.; Sahashi, G.; Miya, M.; Kamada, S.; Kanbe, T.; Araki, H. Ongoing localized extinctions of stream-dwelling white-spotted charr populations in small dammed-off habitats of Hokkaido Island, Japan. Hydrobiologia 2019, 840, 207–213. [Google Scholar] [CrossRef]
  8. Dunham, J.; Baxter, C.; Fausch, K.; Fredenberg, W.; Kitano, S.; Koizumi, I.; Morita, K.; Nakamura, T.; Rieman, B.; Savvaitova, K.; et al. Evolution, ecology, and conservation of Dolly Varden, white spotted char, and bull trout. Fisheries 2008, 33, 537–550. [Google Scholar] [CrossRef]
  9. Kikko, T.; Kai, Y.; Nakayama, K. Relationships among tributary length, census population size, and genetic variability of white-spotted charr, Salvelinus leucomaenis, in the Lake Biwa water system. Ichthyol. Res. 2009, 56, 100–104. [Google Scholar] [CrossRef]
  10. Nakano, S.; Koji, M.; Yamamoto, S. Change of the life cycle of Japanese charr following artificial lake construction by damming. Nippon Suisan Gakkaishi 1990, 56, 1901–1905. [Google Scholar] [CrossRef]
  11. Yamaguchi, K.; Nakajima, M.; Taniguchi, N. Loss of genetic variation and increased population differentiation in geographically peripheral populations of Japanese char Salvelinus leucomaenis. Aquaculture 2010, 308, S20–S27. [Google Scholar] [CrossRef]
  12. Fausch, K.D.; Nakano, S.; Ishigaki, K. Distribution of two congeneric charrs in streams of Hokkaido Island, Japan: Considering multiple factors across scales. Oecologia 1994, 100, 1–12. [Google Scholar] [CrossRef]
  13. Kikko, T.; Kai, Y.; Kuwahara, M.; Nakayama, K. Genetic diversity and population structure of white-spotted charr, Salvelinus leucomaenis, in the Lake Biwa water system inferred from AFLP analysis. Ichthyol. Res. 2008, 55, 141–147. [Google Scholar] [CrossRef]
  14. Morita, K.; Yamamoto, S.; Hoshino, N. Extreme life history change of white-spotted char (Salvelinus ieucomaenis) after damming. Can. J. Fish. Aquat. Sci. 2000, 57, 1300–1306. [Google Scholar] [CrossRef]
  15. Yamada, T.; Koizumi, I.; Urabe, H.; Nakamura, F. Temperature-dependent swimming performance differs by species: Implications for condition-specific competition between stream salmonids. Zoolog. Sci. 2020, 37, 1–5. [Google Scholar] [CrossRef]
  16. Woodward, G.; Perkins, D.M.; Brown, L.E. Climate change and freshwater ecosystems: Impacts across multiple levels of organization. Philos. Trans. R. Soc. B Biol. Sci. 2010, 365, 2093–2106. [Google Scholar] [CrossRef] [PubMed] [Green Version]
  17. Lamphere, B.A.; Blum, M.J. Genetic estimates of population structure and dispersal in a benthic stream fish. Ecol. Freshw. Fish 2012, 21, 75–86. [Google Scholar] [CrossRef]
  18. Jiang, S.; Luo, M.X.; Gao, R.H.; Zhang, W.; Yang, Y.Z.; Li, Y.J.; Liao, P.C. Isolation-by-environment as a driver of genetic differentiation among populations of the only broad-leaved evergreen shrub Ammopiptanthus mongolicus in Asian temperate deserts. Sci. Rep. 2019, 9, 1–14. [Google Scholar] [CrossRef]
  19. Palstra, F.P.; Ruzzante, D.E. Genetic estimates of contemporary effective population size: What can they tell us about the importance of genetic stochasticity for wild population persistence? Mol. Ecol. 2008, 17, 3428–3447. [Google Scholar] [CrossRef]
  20. Yamamoto, S.; Morita, K.; Kitano, S.; Watanabe, K.; Koizumi, I.; Maekawa, K.; Takamura, K. Phylogeography of white-spotted charr (Salvelinus leucomaenis) inferred from mitochondrial DNA sequences. Zoolog. Sci. 2004, 21, 229–240. [Google Scholar] [CrossRef] [Green Version]
  21. Yamamoto, S.; Morita, K.; Koizumi, I.; Maekawa, K. Genetic differentiation of white-spotted charr (Salvelinus leucomaenis) populations after habitat fragmentation: Spatial-temporal changes in gene frequencies. Conserv. Genet. 2004, 5, 529–538. [Google Scholar] [CrossRef]
  22. Yamamoto, S.; Kubota, H.; Hasegawa, K.; Nakamura, T. Census and effective population sizes of white-spotted charr (Salvelinus leucomaenis) in a fragmented landscape. Ecol. Freshw. Fish 2016, 25, 612–621. [Google Scholar] [CrossRef]
  23. Yamamoto, T.; Tsuda, Y.; Takayama, K.; Nagashima, R.; Tateishi, Y.; Kajita, T. The presence of a cryptic barrier in the West Pacific Ocean suggests the effect of glacial climate changes on a widespread sea-dispersed plant, Vigna marina (Fabaceae). Ecol. Evol. 2019, 9, 8429–8440. [Google Scholar] [CrossRef]
  24. Nunziata, S.O.; Lance, S.L.; Scott, D.E.; Lemmon, E.M.; Weisrock, D.W. Genomic data detect corresponding signatures of population size change on an ecological time scale in two salamander species. Mol. Ecol. 2017, 26, 1060–1074. [Google Scholar] [CrossRef] [PubMed]
  25. Shafer, A.B.A.; Wolf, J.B.W.; Alves, P.C.; Bergström, L.; Bruford, M.W.; Brännström, I.; Colling, G.; Dalén, L.; De Meester, L.; Ekblom, R.; et al. Genomics and the challenging translation into conservation practice. Trends Ecol. Evol. 2015, 30, 78–87. [Google Scholar] [CrossRef] [PubMed] [Green Version]
  26. Minami-Furano-cho Historical Record Compilation committee. Minami-Furano-cho Historical Record; Minami-Furano Town Office: Minami-Furano, Japan, 1991; Book 2. (In Japanese) [Google Scholar]
  27. Kanayama dam management branch, Hokkaido Regional Development Bureau, MLIT, Japan. Available online: https://www.hkd.mlit.go.jp/sp/sorati_kasen/kluhh400000062t2.html (accessed on 6 June 2020). (In Japanese).
  28. Suyama, Y.; Matsuki, Y. MIG-seq: An effective PCR-based method for genome-wide single-nucleotide polymorphism genotyping using the next-generation sequencing platform. Sci. Rep. 2015, 5, 1–12. [Google Scholar] [CrossRef] [PubMed] [Green Version]
  29. Catchen, J.; Hohenlohe, P.A.; Bassham, S.; Amores, A.; Cresko, W.A. Stacks: An analysis tool set for population genomics. Mol. Ecol. 2013, 22, 3124–3140. [Google Scholar] [CrossRef] [Green Version]
  30. Peakall, R.; Smouse, P.E. GenAlEx 6.5: Genetic analysis in Excel. Population genetic software for teaching and research-an update. Bioinformatics 2012, 28, 2537–2539. [Google Scholar] [CrossRef] [Green Version]
  31. Pritchord, J.K.; Stephens, M.; Donnelly, P. Inference of population structure using multilocus genotype data. Genetics 2000, 155, 945–959. [Google Scholar] [CrossRef]
  32. Kopelman, N.M.; Mayzel, J.; Jakobsson, M.; Rosenberg, N.A.; Mayrose, I. Clumpak: A program for identifying clustering modes and packaging population structure inferences across K. Mol. Ecol. Resour. 2015, 15, 1179–1191. [Google Scholar] [CrossRef] [Green Version]
  33. Earl, D.A.; vonHoldt, B.M. Structure Harvester: A website and program for visualizing STRUCTURE output and implementing the Evanno method. Conserv. Genet. Resour. 2012, 4, 359–361. [Google Scholar] [CrossRef]
  34. Evanno, G.; Regnaut, S.; Goudet, J. Detecting the number of clusters of individuals using the software STRUCTURE: A simulation study. Mol. Ecol. 2005, 14, 2611–2620. [Google Scholar] [CrossRef] [PubMed] [Green Version]
  35. Kalinowski, S.T.; Wagner, A.P.; Taper, M.L. ML-RELATE: A computer program for maximum likelihood estimation of relatedness and relationship. Mol. Ecol. Notes 2006, 6, 576–579. [Google Scholar] [CrossRef]
  36. Faulks, L.; Östman, Ö. Genetic diversity and hybridisation between native and introduced salmonidae fishes in a Swedish alpine lake. PLoS ONE 2016, 11, e0152732. [Google Scholar] [CrossRef] [PubMed] [Green Version]
  37. Liu, X.; Fu, Y.X. Exploring population size changes using SNP frequency spectra. Nat. Genet. 2015, 47, 555–559. [Google Scholar] [CrossRef] [Green Version]
  38. easySFS. Available online: https://github.com/isaacovercast/easySFS (accessed on 6 June 2020).
  39. Jacobs, A.; Hughes, M.R.; Robinson, P.C.; Adams, C.E.; Elmer, K.R. The genetic architecture underlying the evolution of a rare piscivorous life history form in brown trout after secondary contact and strong introgression. Genes 2018, 9, 280. [Google Scholar] [CrossRef] [Green Version]
  40. Delrieu-Trottin, E.; Hubert, N.; Giles, E.C.; Chifflet-Belle, P.; Suwalski, A.; Neglia, V.; Rapu-Edmunds, C.; Mona, S.; Saenz-Agudelo, P. Coping with Pleistocene climatic fluctuations: Demographic responses in remote endemic reef fishes. Mol. Ecol. 2020, 29, 2218–2233. [Google Scholar] [CrossRef]
  41. Souissi, A.; Bonhomme, F.; Manchado, M.; Bahri-Sfar, L.; Gagnaire, P.A. Genomic and geographic footprints of differential introgression between two divergent fish species (Solea spp.). Heredity 2018, 121, 579–593. [Google Scholar] [CrossRef] [Green Version]
  42. Tine, M.; Kuhl, H.; Gagnaire, P.A.; Louro, B.; Desmarais, E.; Martins, R.S.T.; Hecht, J.; Knaust, F.; Belkhir, K.; Klages, S.; et al. European sea bass genome and its variation provide insights into adaptation to euryhalinity and speciation. Nat. Commun. 2014, 5, 5770. [Google Scholar] [CrossRef] [Green Version]
  43. Le Moan, A.; Gagnaire, P.A.; Bonhomme, F. Parallel genetic divergence among coastal-marine ecotype pairs of European anchovy explained by differential introgression after secondary contact. Mol. Ecol. 2016, 25, 3187–3202. [Google Scholar] [CrossRef]
  44. Fischer, M.C.; Rellstab, C.; Leuzinger, M.; Roumet, M.; Gugerli, F.; Shimizu, K.K.; Holderegger, R.; Widmer, A. Estimating genomic diversity and population differentiation-an empirical comparison of microsatellite and SNP variation in Arabidopsis halleri. BMC Genomics 2017, 18, 1–15. [Google Scholar] [CrossRef] [Green Version]
  45. Lemopoulos, A.; Prokkola, J.M.; Uusi-Heikkilä, S.; Vasemägi, A.; Huusko, A.; Hyvärinen, P.; Koljonen, M.L.; Koskiniemi, J.; Vainikka, A. Comparing RADseq and microsatellites for estimating genetic diversity and relatedness-Implications for brown trout conservation. Ecol. Evol. 2019, 9, 2106–2120. [Google Scholar] [CrossRef] [PubMed]
  46. Bernatchez, S.; Laporte, M.; Perrier, C.; Sirois, P.; Bernatchez, L. Investigating genomic and phenotypic parallelism between piscivorous and planktivorous lake trout (Salvelinus namaycush) ecotypes by means of RADseq and morphometrics analyses. Mol. Ecol. 2016, 25, 4773–4792. [Google Scholar] [CrossRef] [PubMed]
  47. Ferchaud, A.L.; Laporte, M.; Perrier, C.; Bernatchez, L. Impact of supplementation on deleterious mutation distribution in an exploited salmonid. Evol. Appl. 2018, 11, 1053–1065. [Google Scholar] [CrossRef] [PubMed]
  48. Narum, S.R.; Gallardo, P.; Correa, C.; Matala, A.; Hasselman, D.; Sutherland, B.J.G.; Bernatchez, L. Genomic patterns of diversity and divergence of two introduced salmonid species in Patagonia, South America. Evol. Appl. 2017, 10, 402–416. [Google Scholar] [CrossRef] [PubMed]
  49. Lamaze, F.C.; Sauvage, C.; Marie, A.; Garant, D.; Bernatchez, L. Dynamics of introgressive hybridization assessed by SNP population genomics of coding genes in stocked brook charr (Salvelinus fontinalis). Mol. Ecol. 2012, 21, 2877–2895. [Google Scholar] [CrossRef] [PubMed]
  50. Bourret, V.; Kent, M.P.; Primmer, C.R.; Vasemägi, A.; Karlsson, S.; Hindar, K.; McGinnity, P.; Verspoor, E.; Bernatchez, L.; Lien, S. SNP-array reveals genome-wide patterns of geographical and potential adaptive divergence across the natural range of Atlantic salmon (Salmo salar). Mol. Ecol. 2013, 22, 532–551. [Google Scholar] [CrossRef]
  51. Yamaguchi, K.; Nakajima, M.; Taniguchi, N. Population structure and conservation genetics of anadromous white-spotted char (Salvelinus leucomaenis) on Hokkaido Island: Detection of isolation-by-distance. Environ. Biol. Fishes 2016, 99, 513–525. [Google Scholar] [CrossRef]
  52. Yamamoto, S.; Morita, K.; Sahashi, G. Spatial and temporal changes in genetic structure and diversity of isolated white-spotted charr (Salvelinus leucomaenis) populations. Hydrobiologia 2019, 840, 35–48. [Google Scholar] [CrossRef]
  53. Morita, K.; Morita, S.H.; Nagasawa, T.; Kuroki, M. Migratory patterns of anadromous white-spotted charr Salvelinus leucomaenis in Eastern Hokkaido, Japan: The solution to a mystery? J. Ichthyol. 2013, 53, 809–819. [Google Scholar] [CrossRef]
  54. Kanno, Y.; Vokoun, J.C.; Letcher, B.H. Fine-scale population structure and riverscape genetics of brook trout (Salvelinus fontinalis) distributed continuously along headwater channel networks. Mol. Ecol. 2011, 20, 3711–3729. [Google Scholar] [CrossRef]
  55. Sandlund, O.T.; Karlsson, S.; Thorstad, E.B.; Berg, O.K.; Kent, M.P.; Norum, I.C.J.; Hindar, K. Spatial and temporal genetic structure of a river-resident Atlantic salmon (Salmo salar) after millennia of isolation. Ecol. Evol. 2014, 4, 1538–1554. [Google Scholar] [CrossRef]
  56. Kitanishi, S.; Ikeda, T.; Yamamoto, T. Short-term temporal instability in fine-scale genetic structure of masu salmon. Freshw. Biol. 2017, 62, 1655–1664. [Google Scholar] [CrossRef]
  57. Tsuda, Y.; Nakao, K.; Ide, Y.; Tsumura, Y. The population demography of Betula maximowicziana, a cool-temperate tree species in Japan, in relation to the last glacial period: Its admixture-like genetic structure is the result of simple population splitting not admixing. Mol. Ecol. 2015, 24, 1403–1418. [Google Scholar] [CrossRef] [PubMed]
  58. Morita, K.; Yokota, A. Population viability of stream-resident salmonids after habitat fragmentation: A case study with white-spotted charr (Salvelinus leucomaenis) by an individual based model. Ecol. Modell. 2002, 155, 85–94. [Google Scholar] [CrossRef]
  59. Otsuka, S. Gold mines in Yubari and Sorachi, Hokkaido. Jour. Tokyo Geogr. Soc. 1898, 10, 324–333. (In Japanese) [Google Scholar] [CrossRef]
  60. Minami-Furano-cho Historical Record Compilation Committee. Minami-Furano-cho Historical Record; Minami-Furano Town Office: Minami-Furano, Japan, 1991; Book 1. (In Japanese) [Google Scholar]
  61. Nagasaka, A.; Nakamura, F. The influences of land-use changes on hydrology and riparian environment in a northern Japanese landscape. Landsc. Ecol. 1999, 14, 543–556. [Google Scholar] [CrossRef]
  62. Buhl, K.J.; Hamilton, S.J. Comparative toxicity of inorganic contaminants released by placer mining to early life stages of salmonids. Ecotoxicol. Environ. Saf. 1990, 20, 325–342. [Google Scholar] [CrossRef]
  63. Yamaguchi, K.; Nakajima, M.; Taniguchi, N. Mitochondrial genetic evidence for recent population expansion of the white-spotted char (Salvelinus leucomaenis) without geographic patterns from Northern Japan to Central Honshu. Fish Genet. Breed. Sci. 2015, 44, 5–16. [Google Scholar]
  64. Niizato, T.; Shigeno, K.; Takashimizu, Y. Ainu oral traditions and historical records on earthquakes in Hokkaido, Japan. Hist. Earthq. 2006, 20, 121–136, (In Japanese with English abstract). [Google Scholar]
  65. Lapierre, M.; Lambert, A.; Achaz, G. Accuracy of demographic inferences from the site frequency spectrum: The case of the yoruba population. Genetics 2017, 206, 139–449. [Google Scholar] [CrossRef] [Green Version]
  66. Frankham, R.; Ballou, J.D.; Briscoe, D.A. A Primer of Conservation Genetics; Cambridge University Press: Cambridge, UK, 2004. [Google Scholar]
  67. Kitano, S.; Ohdachi, S.; Koizumi, I.; Hasegawa, K. Hybridization between native white-spotted charr and nonnative brook trout in the upper Sorachi River, Hokkaido, Japan. Ichthyol. Res. 2014, 61, 1–8. [Google Scholar] [CrossRef] [Green Version]
Figure 1. Locations of the study sites (filled circles). See Table 1 for site IDs (letters). The map was created using the National Land Numerical Information from the MLIT of Japan (nlftp.mlit.go.jp/).
Water 12 02406 g001
Figure 2. The results of individual-based analysis. (A) Population structure inferred by the STRUCTURE algorithm; (B) The values of posterior probability of the data (LnP(K)) from 20 runs for each value of K (1–4) and Evanno’s ΔK in the STRUCTURE analysis; (C) Graphical display of the first two principal coordinates of the principal coordinates analysis (PCoA).
Water 12 02406 g002
Figure 3. Demographic inference by stairway plot. The red line shows the median estimate of the effective population size. Gray lines indicate 75% (dark) and 95% (light) confidence intervals obtained by 500 bootstraps. Below is the semilog graph for the last 100 generations.
Water 12 02406 g003
Table 1. Sampling sites and genetic diversity. Number of individuals after filtering (N), observed heterozygosity (HO), expected heterozygosity (HE), and fixed index (FIS). SE indicates the standard error across loci.
IDNameNHO (SE)HE (SE)FIS (SE)
TTomamu River130.213 (0.010)0.211 (0.009)0.025 (0.113)
ScA tributary of the Seesorapuchi River120.209 (0.011)0.209 (0.009)0.043 (0.100)
EEcchudantai-no-sawa River110.215 (0.010)0.206 (0.008)0.018 (0.094)
IKIkutora River160.203 (0.009)0.204 (0.008)0.031 (0.128)
Table 2. Pairwise FST between sampling sites.
TScEIK
T0.000
Sc0.017 *0.000
E0.0110.0040.000
IK0.022 *0.016 *0.0080.000
* p < 0.05.
Table 3. Percentage of relationships within and between sampling sites estimated by ML-RELATE (1 = 100%). FS: full siblings, HS: half siblings, U: unrelated. Other relationships (e.g., parent–offspring) were not detected.
PairsFSHSU
Within
T0.0510.0770.872
Sc0.0150.1060.879
E0.0000.0360.964
IK0.0080.0920.900
Between
T-Sc0.0000.0260.974
T-E0.0000.0140.986
T-IK0.0000.0140.986
Sc-E0.0000.0150.985
Sc-IK0.0000.0160.984
E-IK0.0000.0340.966

