Moving beyond the Mirage: Water Scarcity and Agricultural Use Inefficiency in USA

Global Studies and School of Freshwater Sciences, University of Wisconsin, Milwaukee, WI 53211, USA
Water 2020, 12(8), 2290; https://doi.org/10.3390/w12082290
Submission received: 26 June 2020
/
Revised: 5 August 2020
/
Accepted: 6 August 2020
/
Published: 14 August 2020
(This article belongs to the Special Issue Agriculture Water Management and Water Saving Strategies)
Abstract
:The purpose of this article is to examine water scarcity and food security in the United States, the world’s largest grain producer, and to provide empirical evidence that high volumes of water-intensive crops are grown in water-scarce regions. The primary methodology is to analyze data using Geographic Information System (GIS) and to visually represent the results through statistical mapping of water stress overlaid with the amount of production of different commodities. The article concludes by discussing strategies to restructure agriculture to improve water efficiency and to maintain regional agricultural economies that depend on the sustainability of water resources.
1. Problem Specification
Water scarcity and food security are inextricably linked with environmental sustainability. Agriculture is the largest water user, requiring approximately 70% of all water used in the United States [1] for human production and consumption. With such a high percentage of all water flowing to one sector, we cannot advance environmental sustainability without addressing water inefficiencies in the agricultural sector.
Agriculture generates over USD 60 billion per year for the U.S. economy [2]. Yet, food insecurity is worsening at an unprecedented pace, largely as a function of water scarcity and use inefficiency. The main factor of food insecurity in the U.S. is the large quantity of water-intensive crops grown in regions with extreme levels of water stress. This is arguably the most widespread inefficient use of water in agriculture as it spans across the country and includes the crops of the greatest production volume and highest monetary value. It is also the least environmentally sustainable inefficiency; growing water-intensive crops in water stressed regions obviously further exacerbates existing water scarcity.
Significant segments of the U.S. agricultural production system are no longer environmentally or economically sustainable, they need to be reorganized to reduce water stress, increase food security, maintain economic viability, and to preserve the water resources and ecosystem services upon which the agricultural system ultimately depends. As several of the most extremely water-stressed regions of the U.S. are pressed to produce the most water-intensive crops, mighty rivers such as the Colorado and expansive aquifers such as the Ogallala are being depleted at non-renewable rates. The purpose of this research is to provide empirical evidence that agriculture needs to be restructured to adjust for water inefficiencies that are not environmentally sustainable and will eventually lead to the economic collapse of regions that depend on high-volume, high-value cash crops. This research identifies water-use inefficiencies for the four major agricultural crops of highest volume and value for the U.S. economy: wheat, soybeans, corn, and cotton, all of which are highly water intensive crops. The data are used to locate areas where water-intensive crops are grown in large quantities in water stressed regions. The data results are represented in Geographic Information System (GIS) maps of graduated levels of water stress overlaid with the quantity of water-intensive commodities produced in that region, followed by analysis and discussion.
2. Water Use and the Current U.S. Agricultural Landscape
The current patterns of water consumption in the U.S. agricultural landscape are a complex web of regulations, subsidies, market pressures, perverse incentives and regional water stress. The specific problem we are analyzing and exposing with empirical evidence is that, in the current U.S. agricultural landscape, many water-intensive crops are grown in the most water-stressed regions, which is not environmentally or economically sustainable. Water stress decreases food supply and increases food price, including an average 40% increase in the price of staples every five years beginning in the years 2008–2013 [3]. Extreme droughts are also more frequent and more severe, such as the recent “500-year scale” droughts in California and Texas, two of the USA’s largest food producers. Water-use for food production in these regions is already highly inefficient, and is worsening in most regions, rather than improving in efficiency, as water stress expands.
The problem is also a function of short-term economic planning for rapid growth and shortsighted use of methods exceeding ecological limits. These dynamics result in water inefficiency [4], hide the actual quantity of water exports [5,6], and jeopardize long-term agricultural capacity, but can be corrected. The U.S. needs to develop a spectrum of policy options [7], based on ecological and political economy factors, to incentivize the transition to water efficiency in agriculture. The primary obstacles to this transition are the lack of empirical evidence, which this study is trying to overcome, and the legacy of subsidies for water and energy that has been distorted to support inefficiency and exacerbate water stress.
2.1. The Persistence of Perverse Subsidies
The agricultural subsidies, including water and energy, that were originally designed and ratified to support small and medium family farms, have been distorted. Irrigation water and the energy required to pump irrigation water across great distances are heavily subsidized by the government, subsidies which were originally developed to support small and medium scale family farms in the region so that they would be able to provide food for the region without being disadvantaged by the arid climate. Those farms, however, have largely been pushed out and replaced by large-scale corporate producers that moved into the area to utilize the subsidies for water and energy to grow large volumes of crops to export out of the region. The largest distortion is this: If not for the water and energy subsidies, large-scale agriculture would not have located in water-scarce areas, it would not have been cost-effective for them to locate large-scale operations in arid areas where they would need to pay for energy to pump water across vast distances and from great depths for massive irrigation efforts to green the desert. The water and energy subsidies now persist in supporting large-scale agriculture in producing water-intensive crops in water-stressed areas. Water-scarce areas extract high costs for water diversion infrastructure and high costs for energy to pump and transport water great distances but the subsidies offset these costs, thus making it profitable for large-scale agriculture to green the desert. In actuality, water-use inefficiencies in agriculture have been exacerbated by water and energy subsidies that create inverse incentives to produce water-intensive crops in water-scarce regions.
2.2. The Double-Edged Inefficiency
Another complicating factor in the current U.S. agricultural landscape is double-edged water inefficiency. The double-edge is that it takes more water overall to produce water-intensive crops in water-scarce regions. This means, in a water scarce region, it takes more water to produce the same crop. For example, it requires twice as much water to produce grain in a water-scarce region as in a water-rich region: producing 1 kg of grain in favorable climactic and water conditions requires up to 2000 kg of water; the same amount in an arid region requires up to 5000 kg [8]. The difference is due to high temperature, high evapotranspiration, soil conditions and other climate factors. These dynamics will become more consequential as water scarcity increases and water prices increase.
3. Methodology
The methodological objective of this research is to provide empirical evidence that water-intensive crops are being grown in the most water-scarce regions, and to demonstrate the magnitude of the problem of water scarcity and food insecurity in the agricultural sector.
Water stress is measured as a ratio of water availability to water consumption.
Water availability is defined as the hydrological capacity of the region, it determines if it is a dry, arid region, and it is measured for this study as the amount of water in cubic feet per acre (the amount of surface and ground water in cubic feet per acre) as this is the most appropriate measure for a study of water use in agricultural production [9]. This is an important clarification because water availability is defined and measured in many different ways for many different studies; for example, urban v. rural water provision, food v. energy water consumption, human v. nature consumption, and a myriad of different ways availability is measured for different purposes. For this study on agricultural water efficiency, water availability is measured as the amount of surface and ground water in cubic feet per acre.
Water consumption is the amount of water withdrawn for agricultural use; it is measured as the amount of water extracted from surface water and ground water in cubic feet per acre (converted from gallons; gallons are used for this study because the data for the USA are recorded in gallons) [9]. This is also an important distinction because there are many definitions and measures of water consumption for many different purposes; for example, ‘consumptive use’ is the amount of water that is use and not returned to the hydrological cycle due containment for pollution or diverted to another region. For this study on agricultural production and water efficiency, water consumption is measured as the amount of surface and ground water withdrawn for agricultural, used and documented through irrigation practices, in cubic feet per acre [9].
To indicate the most substantial agricultural crops in the U.S., we use the four crops with the highest production volume and highest monetary value in the US economy: wheat, soybeans, corn, and cotton. The highest monetary value means they generate the highest monetary revenue in dollars, annually (on average over five years), and the highest production volume is measured as the tons sold (on average over five years). It is important to note that although we do our due diligence in this calculation, using an average over five years in order to avoid outliers and temporary distortions in production or price shocks, there is very little variation in the crops that top the list each year over the past decades: meaning that the top four crops in value and volume for the USA have not changed much during the past decades; corn, wheat, soybeans and cottons have been the dominant crops in the USA for a long time. This is not surprising as the USA is the largest producer and exporter of these three grains in the world, and a large domestic consumer of the cotton. What is surprising, however, is that this cannot persist economically or environmentally if the USA continues to grow its most water-intensive crops in its most water-stressed regions; it is, by definition, not sustainable. The maps generated for this study intend to provide empirical evidence that the USA is growing its highest volume and value crops, which are some of its most water-intensive crops, in the most water-stressed regions. To indicate the quantity of the crop for the map overlay, we use the average tonnage over five years. The four major crops, wheat, soybeans, corn and cotton, are all water intensive. The data sources for agricultural production are the Agriculture and Food Statistics: Charting Essentials, a collection of key statistics on food security, food prices, natural resources, and other information; and the Agricultural Baseline Database, a database, report and projection of major field crops including corn, wheat, soybeans, cotton, and others, from the United States Department of Agriculture [3,10].
To indicate the level of water-stress in each region, we use a ratio of water use to water availability. To generate the water stress level, we create a ratio of water use (water consumption for agricultural use in cubic acre feet, see above) to water availability (ground and surface water available by cubic acre feet, see above), then transfer the ratio to Geographic Information System (GIS) and map it to represent the data as graduated levels of water stress by county from low to high. The primary data source for the statistical mapping of water stress is the U.S. Geological Survey National Water Information System and it is verified against, and constitutes no data inconsistency [9,11], and U.S. Drought Monitor [9,12]. We statistically mapped the graduated levels of water stress, and then overlaid them with the quantity of the water-intensive commodities produced in that region. The overlay is designed to create cognitive dissonance between seeing high levels of water stress in areas where the US grows large quantities of its main crops. These data show where the four major crops are grown in large quantities in water stressed regions. The size of the overlay circle, or “crop circle,” is determined by the quantity of the crop grown. The size of the overlay circle indicates if the amount of that crop grown is minimal, low, medium, high, maximum, and it is measured in tons, at the state level, averaged over five years to eliminate outliers such as localized short term droughts or flood events. The overlay of the water-stress map and the quantity of crop production exposes the regions in which most water-intensive crops are grown in the most water-scarce areas. A detailed description of how to replicate this study, including data collection and sources, definitions, measurements, calculation of water stress levels, determining the size of crop circles, superimposition of the overlay, and other elements of the analysis are included in the Appendix A.
As an extension of the primary research, we distinguish between the use of blue water and green water in the second part of the analysis in order to statistically map the water footprint [13]. Prominent water scholars Hoekstra A.Y. and P.Q. Hung note that “The distinction between the blue and green water footprint is important because the hydrological, environmental, and social impacts, as well as the economic opportunity costs, of surface and groundwater use for production differ distinctively from the impacts and costs of rainwater use” [14]. Blue water is the volume of freshwater consumed from surface and groundwater sources. Green water is the volume of freshwater consumed as precipitation or stored in the soil. The difference is important to understand because areas that are dependent on blue water are more susceptible to aquifer depletion whereas areas that are dependent on green water are more vulnerable to climactic factors such as precipitation.
It is also important to note that although grey water is outside the scope of this paper, which focuses on blue and green water for growing and irrigating crops, grey water is a crucial part of the other end of the equation of sustainability in agriculture: it is a crucial part of the outputs, particularly as a negative externality. Grey water includes the run-off from agricultural production and is often heavily laden with chemical pesticides and fertilizers. It is a critical externality of agricultural production and the broader discussion of sustainability; grey water is an output, and a negative and highly consequential output.
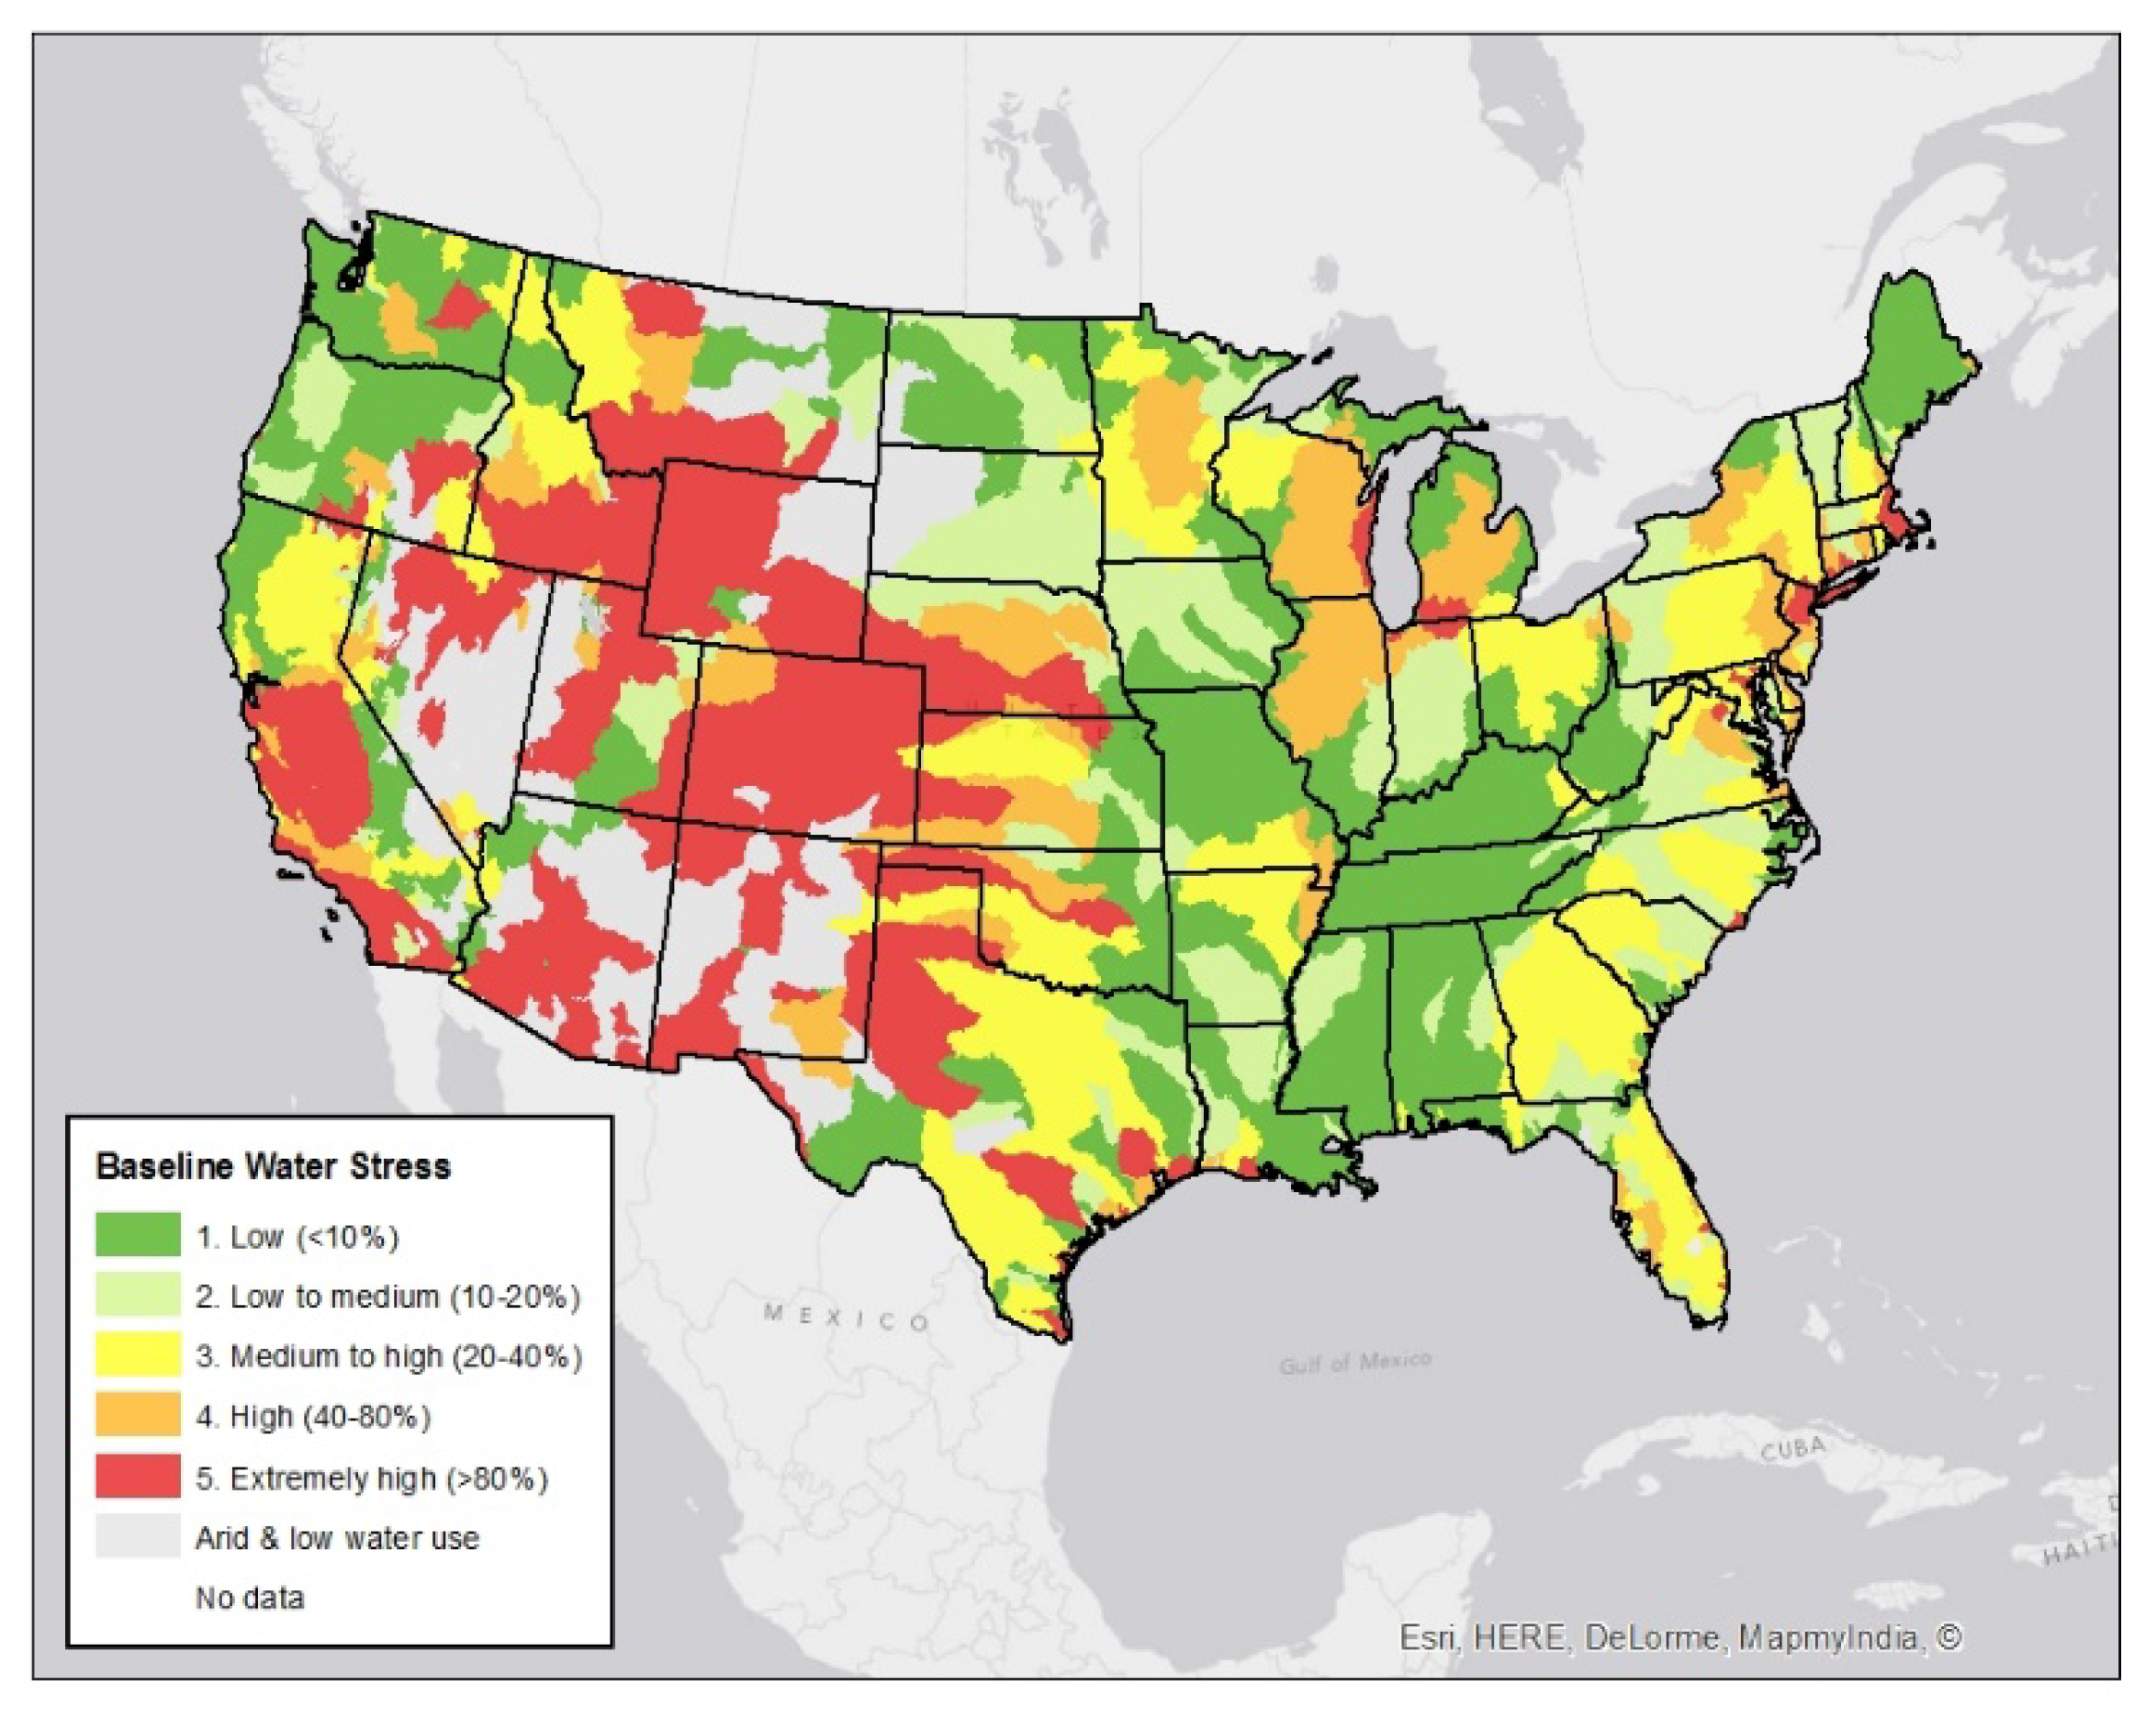
The most important element of the methodology is to provide empirical evidence that high volumes of the most water-intensive crops are being grown in regions with the most extreme water-stress, for which the data are visually represented using Geographic Information Systems to overlay graded maps of water stress with the volume of water-intensive crop production. The baseline GIS water stress map of the United States is statistically mapped in Figure 1. The measure of water stress is a ratio of water availability and water consumption, the data is sourced from U.S. Geological Survey National Water Information System.
4. Results and Analysis
The analysis of the most severe and immediate problems of water inefficiency in agriculture by crop and by state are summarized here.
Wheat: The highest volume of water-intensive wheat is grown in states with the most extreme water stress. There is extreme water stress and a high volume of wheat produced in Colorado, Montana, Kansas, Nebraska, and Oklahoma. The overlay of water stress and wheat production is statistically mapped in Figure 2. There is high to moderate water stress and high wheat production in Illinois, Minnesota, and Indiana. The extremely water stressed states of California and Texas also produce relatively moderate amounts of water-intensive wheat.
The greatest problem in water inefficiency and water stress in wheat production in the US is in the states that are dependent on the Ogallala Aquifer for water security, Colorado, Montana, Kansas, Nebraska, and Oklahoma. As the Ogallala Aquifer gets depleted due to over-extraction, the feasibility of continuing to produce large quantities of water-intensive wheat in the extremely water-stressed region will decrease. The loss of the capacity to produce a high volume and value of this mega cash crop will jeopardize the economic viability of the agricultural sector in the multi-state Ogallala region.
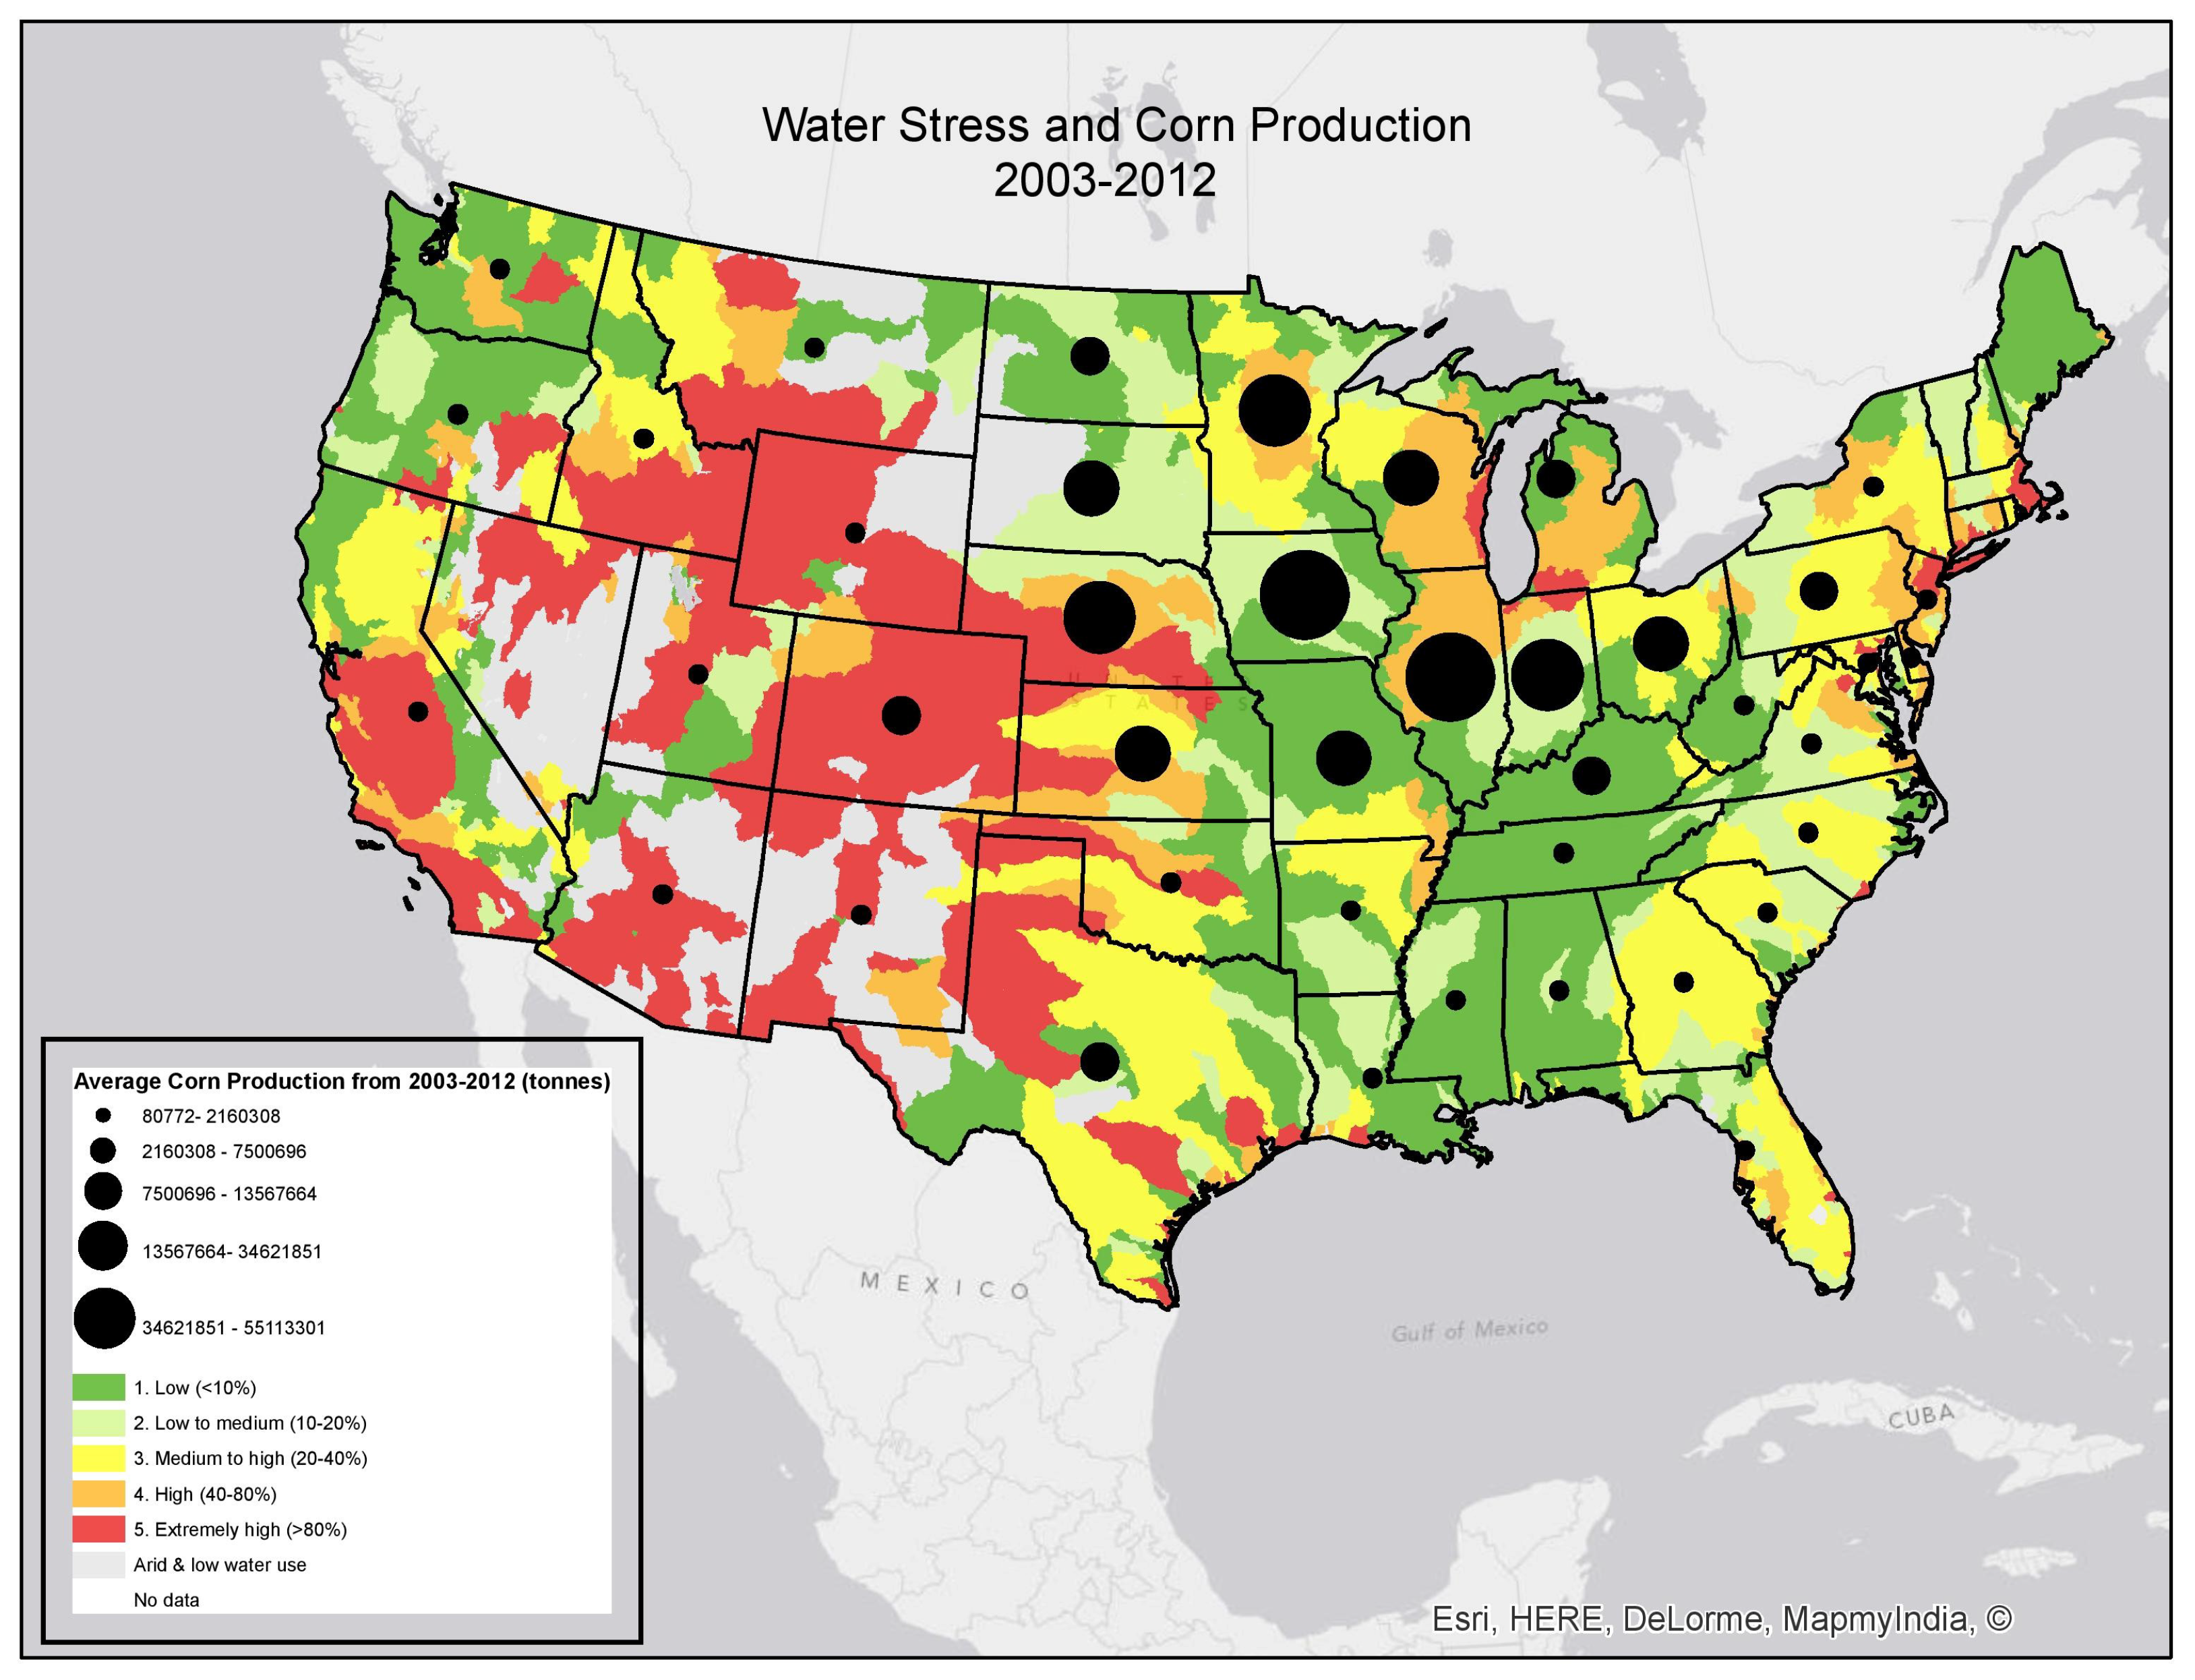
Corn: There is extreme water stress and a high volume of water-intensive corn grown in Nebraska and Colorado. There is high water stress and large quantities of corn grown in Illinois, Minnesota, Wisconsin, and Kansas. The overlay of water stress and corn production is statistically mapped in Figure 3. As corn is largely rain-fed in some areas with relatively high levels of precipitation, water efficiency in corn production is most balanced in Iowa, Mississippi, Indiana, Ohio, and Kentucky. Corn production is highly concentrated in the Midwest and Great Lakes regions, little corn is grown elsewhere in the United States.
Soybeans: There is extreme water stress and a high volume of water-intensive soybeans grown in Nebraska and Kansas. The overlay of water stress and soybean production is statistically mapped in Figure 4. There is high water stress and a high volume of soybeans Illinois and Minnesota, and high water stress with a relatively moderate quantity of soybeans grown in Wisconsin and Michigan. The problem of high water stress and water-intensive soybean production is consolidated in the Midwest Great Lakes region.
Cotton: There is extreme water stress and a high volume of water-intensive cotton grown in California, Arizona and Texas. The overlay of water stress and cotton production is statistically mapped in Figure 5. There is high water stress and a high volume of cotton in Georgia and Arkansas. There are moderate water efficiency problems growing a moderate amount of cotton in North Carolina and South Carolina.
5. Conclusions
Greening the desert is one of the least environmentally sustainable practices in the United States. Growing large amounts of water-intensive crops in extremely water-stressed areas, or greening the desert, is no longer environmentally or economically sustainable and needs to be restructured to reduce water stress, increase food security, and maintain economic stability. Our research has provided systematic, empirical data and evidence that wheat, soybeans, corn, and cotton, all high volume and water-intensive and crops, are grown in water stressed areas in the U.S. The data are visually represented by statistically mapping the graded levels of water stress and statically mapping the quantities of the crops produced, which are then overlaid, all diagramed using Geographic Information Systems and sourced from U.S. Geological Survey National Water Information System. The statistical mapping exposes extreme water inefficiencies in the agricultural sector.
The impacts of water-use inefficiency are already urgent and consequential for production, consumption, and prices of U.S. agriculture. The most severe problems are evident in the American West, Southwest and Great Plains. The economies of these regions are almost entirely dependent on agriculture [10], and are in jeopardy of economic collapse if their water sources run dry, and yet they are producing highly water-intensive crops in a highly inefficient way.
To address these water inefficiencies through policy, agricultural and water-use policies need to provide incentives to grow crops based on water-use efficiency, promote drought-tolerant crop species in water-stressed regions, transfer water-intensive crops to water-abundant regions, compensate producers for fallowing fields in severely water-stressed regions, improve irrigation techniques and technologies to increase water-use efficiency.
This study also anticipates a large transition of intensive agriculture to the Great Lakes region, the largest source of surface freshwater on the planet, which is being commercially advertised to large-scale growers as an abundant and free source of freshwater to attract business. The Great Lakes might consider putting policies in place to manage this anticipated growth with water-efficiency in the interest of sustainable development.
As drought conditions worsen, the consequences of growing water-intensive crops in water-stressed regions becomes more urgent; disrupting food supply chains, exporting tremendous amounts of water from dry regions, skyrocketing food prices, increasing energy dependence in agriculture to move irrigation water across vast distances and pump water up from great depths, thus further depleting the rivers and aquifers. The U.S. is facing a 1200YR megadrought, which many hydrologists and climatologists indicate could subject the entire U.S. West to extreme drought conditions across 70% of its land and could last at that level of severity for 20 years [15]. It is time to restructure agriculture from a water-efficiency perspective.
This study has demonstrated the empirical reality, environmental risk, economic risk, and, arguably, the depravity of continuing to grow water-intensive crops in highly water-stressed regions. The research has been conducted with rigor in the interest of advancing work to restructure agriculture in the U.S. to improve water efficiency, promote environmental sustainability, assure economic prosperity and highlight its interdependence with water security.
Funding
This research received no external funding.
Acknowledgments
Thank you to the anonymous reviewers who contributed to the improvement and explanatory value of this paper, any remaining omissions or glitches are the author(s)’s alone.
Conflicts of Interest
The author declares no conflict of interest.
Appendix A
To replicate this study and the visual represntation of information, use the statistical mapping program Geographic Information System (GIS) and use data from United States Geological Survey (USGS) National Water Information System (NWIS) and United States Department of Agriculture. You can use the National Drought Monitor as a second source to crossreference and verify the water stress information.
In USGS NWIS, select the variables and timeframes. For this analysis, the author(s) created a ratio to represent the level of water stress. The data are available at the county level. Use counties as the measure for this work because the data are more reliable, more complete, and agricultural practices and policies in the US revolve around information at the county level.
To create a ratio for water stress, use the county level data on water availability and water consumption. Divide water availability by water consumption, that will indicate the level of water stress. This will provide a conservative estimate and it will not show water stress as simply the lack of water. If there is little water but little consumption, it is not a water stressd region.
Use the following definitions and measurements: Water availability is defined as the hydrological capacity of the region and it is measured as the amount of water in cubic feet per acre (the amount of surface and ground water in cubic feet per acre); water consumption is defined as the amount of water withdrawn for agricultural use and it is measured as the amount of water extracted from surface water and ground water in cubic feet per acre.
Create the ratio for water stress, then transfer the ratio into the GIS sytem and use GIS to map the level of water stress in a graded map: Use the standard international gradation colours; red is extremely high water stress, green is low water stress, and use the standard GIS colour gradations between high and low.
Superimpose the overlay. The overlay of the water-stress map and the quantity of crop production exposes the regions in which most water-intensive crops are grown in the most water-scarce areas. It is a simplistic representation of the amount of that specific crop grown in that region. It is designed to create cognitive dissonance between seeing high levels of water stress in areas where the US grows large quantities of its main crops. After the water stress level is transferred to GIS and mapped, as described above, then determine the size of the overlay circle, or “crop circle,” if you will. The size of the overlay circle indicates if the amount of that crop grown is minimal, low, medium, high, maximum, and it is measured in tonnes, at the state level, averaged over five years to eliminate outliers such as localized short term droughts or flood events. Unfortunately, the data source requests that the amounts not be rounded, except for corn (which has its own politics and economics and guarded data in the US economy) so we use their indications, however, one advantage of reporting the actual number scale is that we can see the huge quantities of the crops produced, some individual states producing tens of millions of tonnes of these grains per year. For example, for soybeans, minimal equals less than 500,000 tonnes, low equals under 2 million tons, medium equals 2–7.6 million tonnes, high, and maximum is around 7.6 million to a billion tonnes. The distinction of tonnage for low, medium and high is different for each crop because a lot of cotton is not necessarily comparable to a lot of wheat. After you have determined the amount of each crop grown in each state, superimpose the crop circles on the respective maps. This will provide visual information, and the sought cognitive dissonance, showing where large quantities of the main crops are grown in high and extremely water-stressed regions. Generate your conclusions and compare and contrast. Please feel free to contact and share with the author(s) your analyses, thoughts and conclusions.
References
- Food and Agriculture Organization of the United Nations FAO/IFAD/UNICEF/WFP/WHO. The State of Food Security and Nutrition in the World: Building Resilience for Peace and Food Security. 2017. Available online: www.fao.org/3/a-17695e (accessed on 10 August 2020).
- Daugherty, K. U.S. Agricultural Trade Data Update. Econ. Res. Serv. 2019, 2. Available online: https://www.ers.usda.gov/data-products/foreign-agricultural-trade-of-the-united-states-fatus/us-agricultural-trade-data-update/ (accessed on 12 February 2019).
- United States Department of Agriculture (USDA). Agricultural Baseline Database. 2020. Available online: https://www.ers.usda.gov/data-products/agricultural-baseline-database/ (accessed on 12 February 2020).
- Boelens, R.; Vos, J. The danger of naturalizing water policy concepts: Water productivity and efficiency discourses from field irrigation to virtual water trade. Agric. Water Manag. 2012, 108, 16–26. [Google Scholar] [CrossRef]
- Antonelli, M.; Greco, F. (Eds.) The Water We Eat: Combining Virtual Water and Water Footprints; Springer International: Berlin/Heidelberg, Germany, 2015. [Google Scholar]
- Antonelli, M.; Rosen, R.; Sartori, M. Systemic Input-Output Computation of Green and Blue Virtual Water ‘Flows” with an Illustration for the Mediterranean Region. Water Resour. Manag. 2012, 26, 4133–4146. [Google Scholar] [CrossRef]
- Boelens, R.; Vos, J. The Politics and Consequences of Virtual Water Exports. In Eating, Drinking: Surviving; Sultana, F., Jackson, P., Spiess, W., Eds.; Springer International: Berlin/Heidelberg, Germany, 2016. [Google Scholar]
- Hoekstra, A.; Hung, P. UNESCO-IHE, Globalisation of water resources: International virtual water flows in relation to crop trade. Glob. Environ. Chang. 2005, 15, 45–56. [Google Scholar] [CrossRef]
- U.S. Geological Survey National Water Information System. 2020. Available online: https://waterdata.usgs.gov/nwis (accessed on 12 February 2020).
- United States Department of Agriculture (USDA). Agriculture and Food Statistics: Charting Essentials. 2020. Available online: https://www.ers.usda.gov/data-products/ (accessed on 12 February 2020).
- Tinker, R. Drought Summary, Classification, and Impact; Climate Prediction Center, NCEP/NWS/NOAA: College Park, MD, USA, 2019.
- U.S. Drought Monitor (USDM). University of Nebraska-Lincoln. 2020. Available online: https://droughtmonitor.unl.edu (accessed on 12 February 2020).
- Kehl, J. After the Sun: Energy use in Blue v. Green Water for Agriculture. Energy Earth Sci. 2020, 3, 11. [Google Scholar] [CrossRef]
- Hoekstra, A.; Chapagain, A.; Aldaya, M.; Mekonnen, M. The Water Footprint Assessment Manual: Setting the Global Standard; Earthscan: London, UK, 2011. [Google Scholar]
- Fuchs, B. National Drought Mitigation Center, U.S. Drought Monitor, Report Released. 23 April 2020. Available online: www.droughtmonitor.unl.edu (accessed on 12 May 2020).
Figure 1.
Baseline Water Stress Map of the United States, Source: U.S. Geological Survey National Water Information System, https://waterdata.usgs.gov/nwis [9].
Figure 1.
Baseline Water Stress Map of the United States, Source: U.S. Geological Survey National Water Information System, https://waterdata.usgs.gov/nwis [9].

Figure 2.
Water Stress and Wheat Production Source: U.S. Geological Survey National Water Information System, https://waterdata.usgs.gov/nwis [9].
Figure 2.
Water Stress and Wheat Production Source: U.S. Geological Survey National Water Information System, https://waterdata.usgs.gov/nwis [9].

Figure 3.
Water Stress and Corn Production Source: U.S. Geological Survey National Water Information System, https://waterdata.usgs.gov/nwis [9].
Figure 3.
Water Stress and Corn Production Source: U.S. Geological Survey National Water Information System, https://waterdata.usgs.gov/nwis [9].

Figure 4.
Water Stress and Soybean Production Source: U.S. Geological Survey National Water Information System, https://waterdata.usgs.gov/nwis [9].
Figure 4.
Water Stress and Soybean Production Source: U.S. Geological Survey National Water Information System, https://waterdata.usgs.gov/nwis [9].

Figure 5.
Water Stress and Cotton Production Source: U.S. Geological Survey National Water Information System, https://waterdata.usgs.gov/nwis [9].
Figure 5.
Water Stress and Cotton Production Source: U.S. Geological Survey National Water Information System, https://waterdata.usgs.gov/nwis [9].

© 2020 by the author. Licensee MDPI, Basel, Switzerland. This article is an open access article distributed under the terms and conditions of the Creative Commons Attribution (CC BY) license (http://creativecommons.org/licenses/by/4.0/).
Share and Cite
MDPI and ACS Style
Kehl, J. Moving beyond the Mirage: Water Scarcity and Agricultural Use Inefficiency in USA. Water 2020, 12, 2290. https://doi.org/10.3390/w12082290
AMA Style
Kehl J. Moving beyond the Mirage: Water Scarcity and Agricultural Use Inefficiency in USA. Water. 2020; 12(8):2290. https://doi.org/10.3390/w12082290
Chicago/Turabian StyleKehl, Jenny. 2020. "Moving beyond the Mirage: Water Scarcity and Agricultural Use Inefficiency in USA" Water 12, no. 8: 2290. https://doi.org/10.3390/w12082290
Note that from the first issue of 2016, this journal uses article numbers instead of page numbers. See further details here.