Article

Operational Performances and Enzymatic Activities for Eutrophic Water Treatment by Vertical-Flow and Horizontal-Flow Constructed Wetlands

1
Jiangsu Engineering Laboratory for Biomass Energy and Carbon Reduction Technology, School of Environment and Civil Engineering, Jiangnan University, Wuxi 214122, China
2
China Ship Scientific Research Center, Wuxi 214082, China
3
Jiangsu Collaborative Innovation Center of Technology and Material of Water Treatment, School of Environmental Science and Engineering, Suzhou University of Science and Technology, Suzhou 215009, China
*
Authors to whom correspondence should be addressed.
Water 2020, 12(7), 2007; https://doi.org/10.3390/w12072007
Submission received: 17 May 2020 / Revised: 22 June 2020 / Accepted: 27 June 2020 / Published: 15 July 2020
(This article belongs to the Special Issue Innovative Technologies for Wastewater and Water Treatment)

Abstract

:
In this study, pilot-scale vertical-flow constructed wetland (VFCW) and horizontal-flow constructed wetland (HFCW) were constructed to treat eutrophic water, and dissolved oxygen (DO) distributions, decontamination performances and key enzymes activities were compared under different influent loads. The influent load increase caused reductions of DO levels and removal efficiencies of chemical oxygen demand (COD), total nitrogen (TN), NH4+−N and organic nitrogen, but it had no remarkable effect on the removal of NO3−N and total phosphorus (TP). The interior DO concentrations of VFCW were higher than those of HFCW, indicating a vertical hydraulic flow pattern was more conducive to atmospheric reoxygenation. The VFCW and HFCW ecosystems possessed comparable removal capacities for TN, NO3−N and TP. VFCW had a remarkable superiority for COD and organic nitrogen degradation, but its effluent NH4+−N concentration was higher, indicating the NH4+−N produced from organic nitrogen degradation was not effectively further removed in the VFCW system. The activities of protease, urease and phosphatase declined with the increasing depth of substrate layers, and they were positively correlated with DO concentrations. The enzymatic activities of VFCW were significantly higher than that of HFCW in the upper layers. Taken together, VFCW and HFCW presented a certain difference in operational properties due to the different hydraulic flow patterns.

1. Introduction

The rapid development of the Chinese economy is associated with the leakage of many contaminants into the environment. A large number of rivers and lakes are polluted, in which the eutrophication of surface water is increasingly serious. This water crisis poses a severe threat to aquatic ecosystems and people’s health [1,2]. Hence, the improvement of surface water quality has been paid much more attention to in recent years. As a naturalized purification system, a constructed wetland can effectively remove nitrogen, phosphorus, pathogenic microorganisms and other organic contaminants from wastewater [3,4]. Compared with physical and chemical technologies, ecological technology possesses the superiorities of low-energy consumption, excellent purification capacity and simple operation, which has great potential in the treatment of eutrophic rivers and lakes [5,6].
Based on the operational properties of a wetland ecosystem, a constructed wetland purifies polluted water through the interaction of microorganisms, plants and filler [7,8]. Microbial consortia are the dominant contributors for contaminant removal (especially nitrogen and organic matter) by participating in adsorption, degradation, plant uptake and other processes [9,10]. The decontamination performance is mostly affected by constructed wetland types and operating conditions (e.g., temperature, dissolved oxygen, carbon source and influent load) [11,12,13,14].
According to the hydraulic flow pattern in the treatment system, constructed wetlands can be classified into three types, namely surface-flow constructed wetland (SFCW), vertical-flow constructed wetland (VFCW) and horizontal-flow constructed wetland (HFCW) [15]. The water flow of SFCW mainly occurs on the system surface, where contaminants are removed mainly by natural sedimentation as well as by the filtration and adsorption by filler and plants [16]. Due to the low contribution of microorganisms, the decontamination capacity of SFCW is usually insufficient for polluted water treatment, especially for nitrogen removal [17]. VFCW and HFCW both belong to subsurface types, with vertical and horizontal water flows respectively [18]. During their operations, contaminants can permeate into the interior of the packing layer where they are efficiently removed by adherent microorganisms and plant roots [19]. Hence, it is usually considered that VFCW and HFCW both have better treatment performance than SFCW, and they are used promisingly in the treatments for many kinds of wastewater [20]. Some studies have proven that constructed wetlands are highly suitable in addressing the restoration of eutrophic water bodies [21,22]. For instance, Li et al. used the pilot scale constructed wetlands to treat the eutrophic water from Taihu Lake in China, with nutrient removal of 20–52% for TN and 35–66% for TP [23]. However, few studies have intensively investigated the distinctions of decontamination performance between VFCW and HFCW until now.
In order to clarify the effects of hydraulic flow patterns on constructed wetland operation, pilot-scale VFCW and HFCW were constructed to treat eutrophic water in this study. The dissolved oxygen (DO) distributions, decontamination performances and key enzymes activities were intensively compared under different influent loads (150, 200, 260 L/day). The operational distinctions between the two types of constructed wetlands were analyzed. The results obtained could provide valuable information on the practical application of constructed wetlands for eutrophic water restoration.

2. Materials and Methods

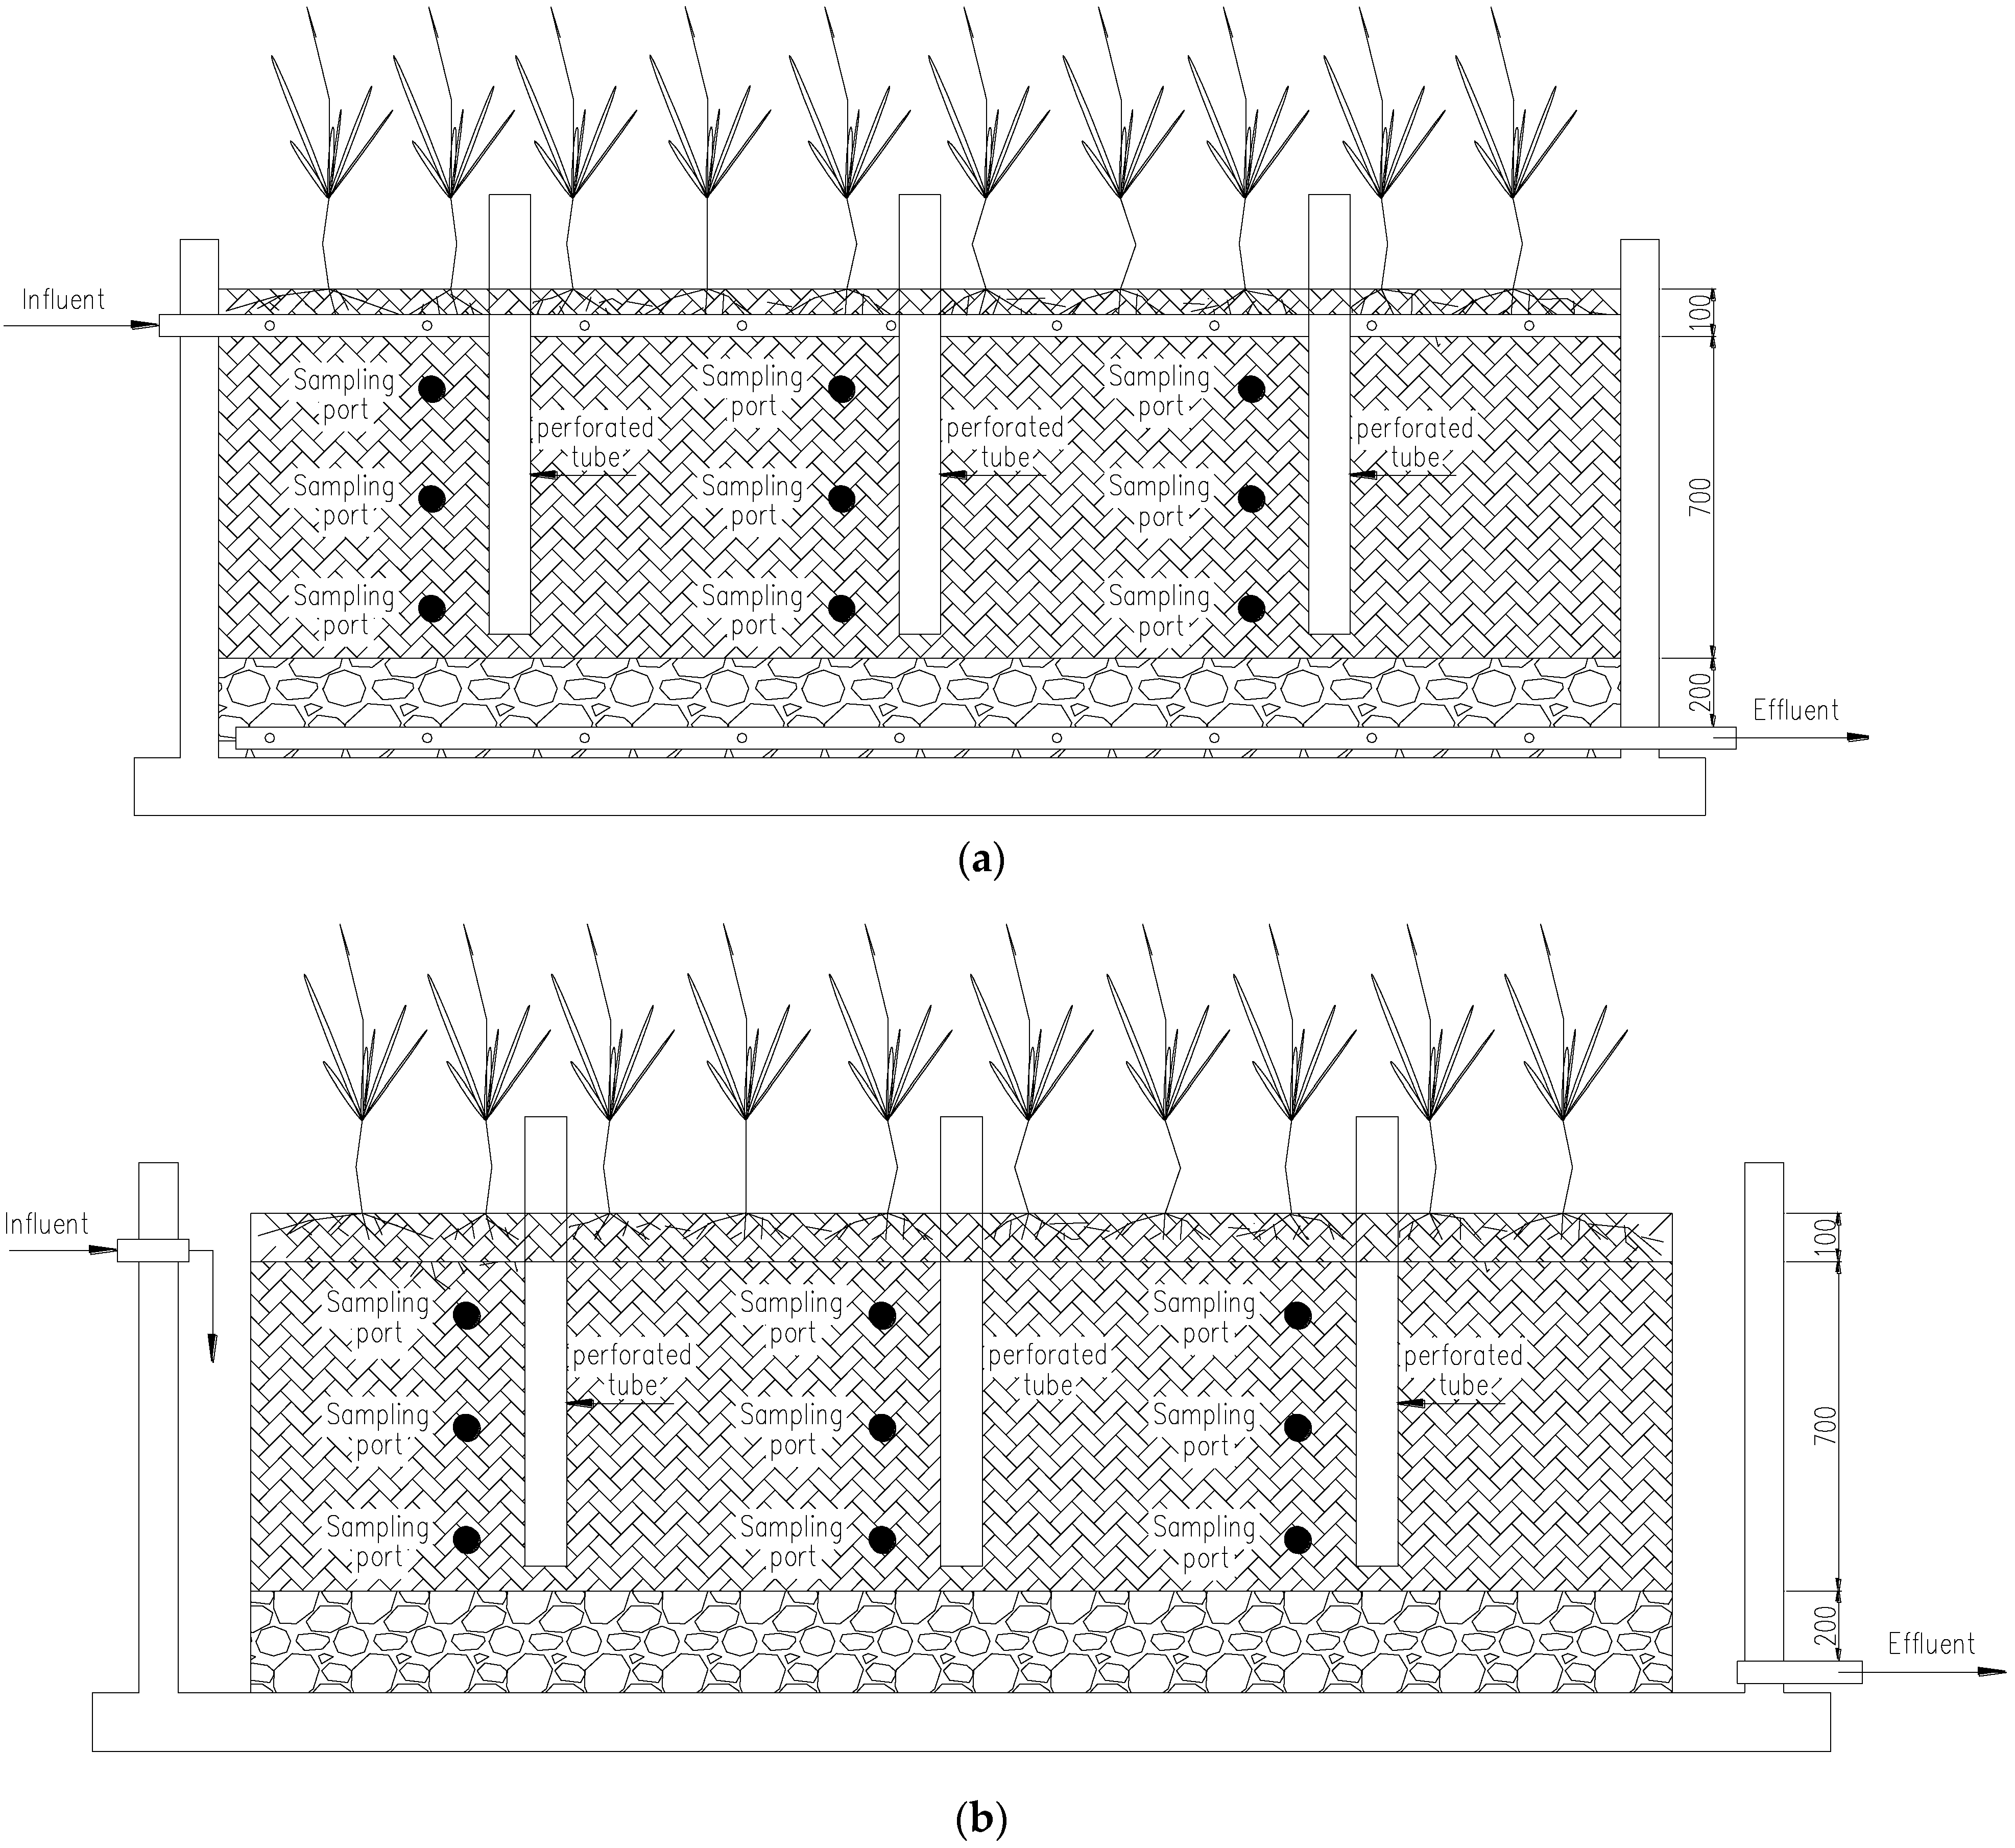
2.1. Design and Construction of Constructed Wetlands

The major structures of the pilot-scale constructed wetlands were made of polyvinyl chloride. The VFCW and HFCW both had substrate-filling area dimensions of 1.5 m (length) × 1.2 m (width) × 1 m (height). The upper layers of the substrate bed, with a thickness of 80 cm, were designed as the primary adsorption and purification area, and were filled with a mixed substrate comprised of ceramsite, zeolite, and coarse sand. The particle sizes of ceramsite, zeolite, and coarse sand were respectively 8–15 mm, 8–10 mm and 10–15 mm, and their mixing ratio was 2:2:1. Gravel with a particle size of 4–6 cm was laid at the bottom of the substrate bed, with a thickness of approximately 20 cm. The gravel layer played a physical support role and could prevent the blockage of effluent collection pipes.
The VFCW system was equipped with a symmetrically arranged influent distribution pipe and effluent collection pipe to provide uniform flow distribution, thus reducing the occurrence of dead flow and short-cut flow (Figure 1a). During VFCW operation, eutrophic water vertically flowed through the substrate bed from the influent distribution pipe and was eventually discharged by an effluent hose. The HFCW system was separated into influent area, substrate area and catchment area by perforated plate and screen cloth (Figure 1b). The perforated plate had a hole size of 10 cm and a hole spacing of 30 cm. The screen cloth had a grid size of 5 mm. Both the VFCW and HFCW were vertically fitted with three perforated tubes that were used to measure interior DO distribution. At the water depths of 15, 40 and 65 cm, the sidewalls of constructed wetlands had six sampling ports respectively for subsequent substrate sampling. The Phragmites australis was used as wetland plant with a density of 16 plants/m2.

2.2. Experimental Condition and Operation

In this study, the influent of constructed wetlands was collected from a lake at Jiangnan University (Wuxi, China). The average water temperature and pH were respectively 25.5 °C and 7.19 during the whole operation. The concentrations of COD, TN, NH4+−N, organic nitrogen and TP were 46.5–66.0 mg/L, 8.56–10.15 mg/L, 5.68–7.19 mg/L, 2.17–3.26 mg/L and 0.39–0.63 mg/L, respectively. The NO3−N concentration was mostly less than 1 mg/L. Obviously, the lake water was severely eutrophic. The HFCW and VFCW were synchronously operated, both maintaining a water height of 90 cm. The two systems were initiated at a low influent load. Subsequently, the wetland ecosystems were operated at the influent flows of 150 L/day (0–28 day), 200 L/day (30–58 day) and 260 L/day (60–90 day).

2.3. Analytical Methods

2.3.1. Water Quality Determination

The concentrations of COD, TN, NH4+−N, TP, NO3−N and organic nitrogen were measured according to the Standard Methods for the Examination of Water and Wastewater of American Public Health Association [24]. The DO concentration was determined using a portable DO meter (SG6-FK2, Mettler Toledo, Zurich, Switzerland). The water temperature and pH were monitored by a pH meter (BPH-610CK, Bell, Dalian, China).

2.3.2. Enzymatic Activity Measurements

The activities of proteases, ureases and phosphatases were measured from the substrates of the HFCW and VFCW at different water depths (15, 40, 65 cm). Each depth had six sampling ports on the sidewalls of the constructed wetlands. The collected substrates were fully mixed and then were immediately used to perform enzymatic activity measurement. The determination methods are described below.
Protease activity was measured using azocasein as zymolyte, which was characterized by determining the amount of tyrosine produced over a certain period. The sample (20 g) was placed into a colorimetric tube, and 2 mL toluene was added for pretreatment for 15 min. Subsequently, after adding 30 mL NaHCO3 solution (pH 7.0) containing 1% azocasein, the tube was sealed and incubated after shaking at 37 °C. After 6 hours incubation, 10 mL reaction solution was sucked out, which was then mixed with 5 mL trichloroacetic acid solution (5%, v/v) to precipitate unhydrolyzed azocasein. The color development of reaction mixture was conducted by adding 5 mL NaOH solution (0.5 mol/L). After centrifugation for 10 min at 8000 g, the tyrosine amount was spectrophotometrically measured at 440 nm (UV-1900, Shimadzu, Kyoto, Japan). One unit of protease activity (U) was defined as the amount of enzyme that produced 1 µg tyrosine per hour.
Urease activity was measured using urea as reaction substrate, and it was characterized by quantifying the amount of NH4+−N generated over a certain period. The sample (20 g) was placed into a colorimetric tube, and 2 mL of toluene was added for pretreatment for 15 min, followed by the addition of 30 mL phosphate buffer (pH 7.0) containing 10% urea. The tube was sealed and incubated after shaking for 6 h at 37 °C. Subsequently, 10 mL reaction solution was sucked out and was centrifuged for 10 min at 8000 g. The NH4+−N amount was determined using the Nessler Method [24]. One unit of urease activity (U) was defined as the amount of enzyme that produced 1 µg NH4+−N per hour.
Phosphatase activity was measured using disodium phenyl phosphate as reaction substrate, which was characterized by determining the amount of phenol that was produced over a certain period. The sample (20 g) was placed in a colorimetric tube, and 2 mL toluene was added for pretreatment for 15 min, followed by the addition of 30 mL Tris buffer (pH 7.0) containing 0.5% disodium phenyl phosphate. The tube was sealed and incubated after shaking at 37 °C. After 6 hours incubation, 10 mL reaction solution was sucked out, and was then thoroughly mixed with 10 mL aluminum sulfate solution (1%). The reaction mixture was centrifuged for 10 min at 8000 g, and 5 mL supernatant was pipetted into a 50 mL volumetric flask. After adding 1 mL 2,6-dibromo-chloro-para-benzoquinone monoamine reagent, the mixture was diluted with Tris buffer (pH 7.0) to a final volume of 50 mL. The phenol amount was spectrophotometrically measured at 660 nm. One unit of phosphatase activity (U) was defined as the amount of enzyme that produced 1 µg phenol per hour.

2.4. Statistical Analysis

The statistical analysis of data was done with Student’s t test in this study. p values < 0.05 were considered statistically significant. The Pearson correlation coefficient between the enzymatic activities and the DO concentrations was calculated with SPSS software (Version 10.0, IBM, New York, NY, USA).

3. Results and Discussion

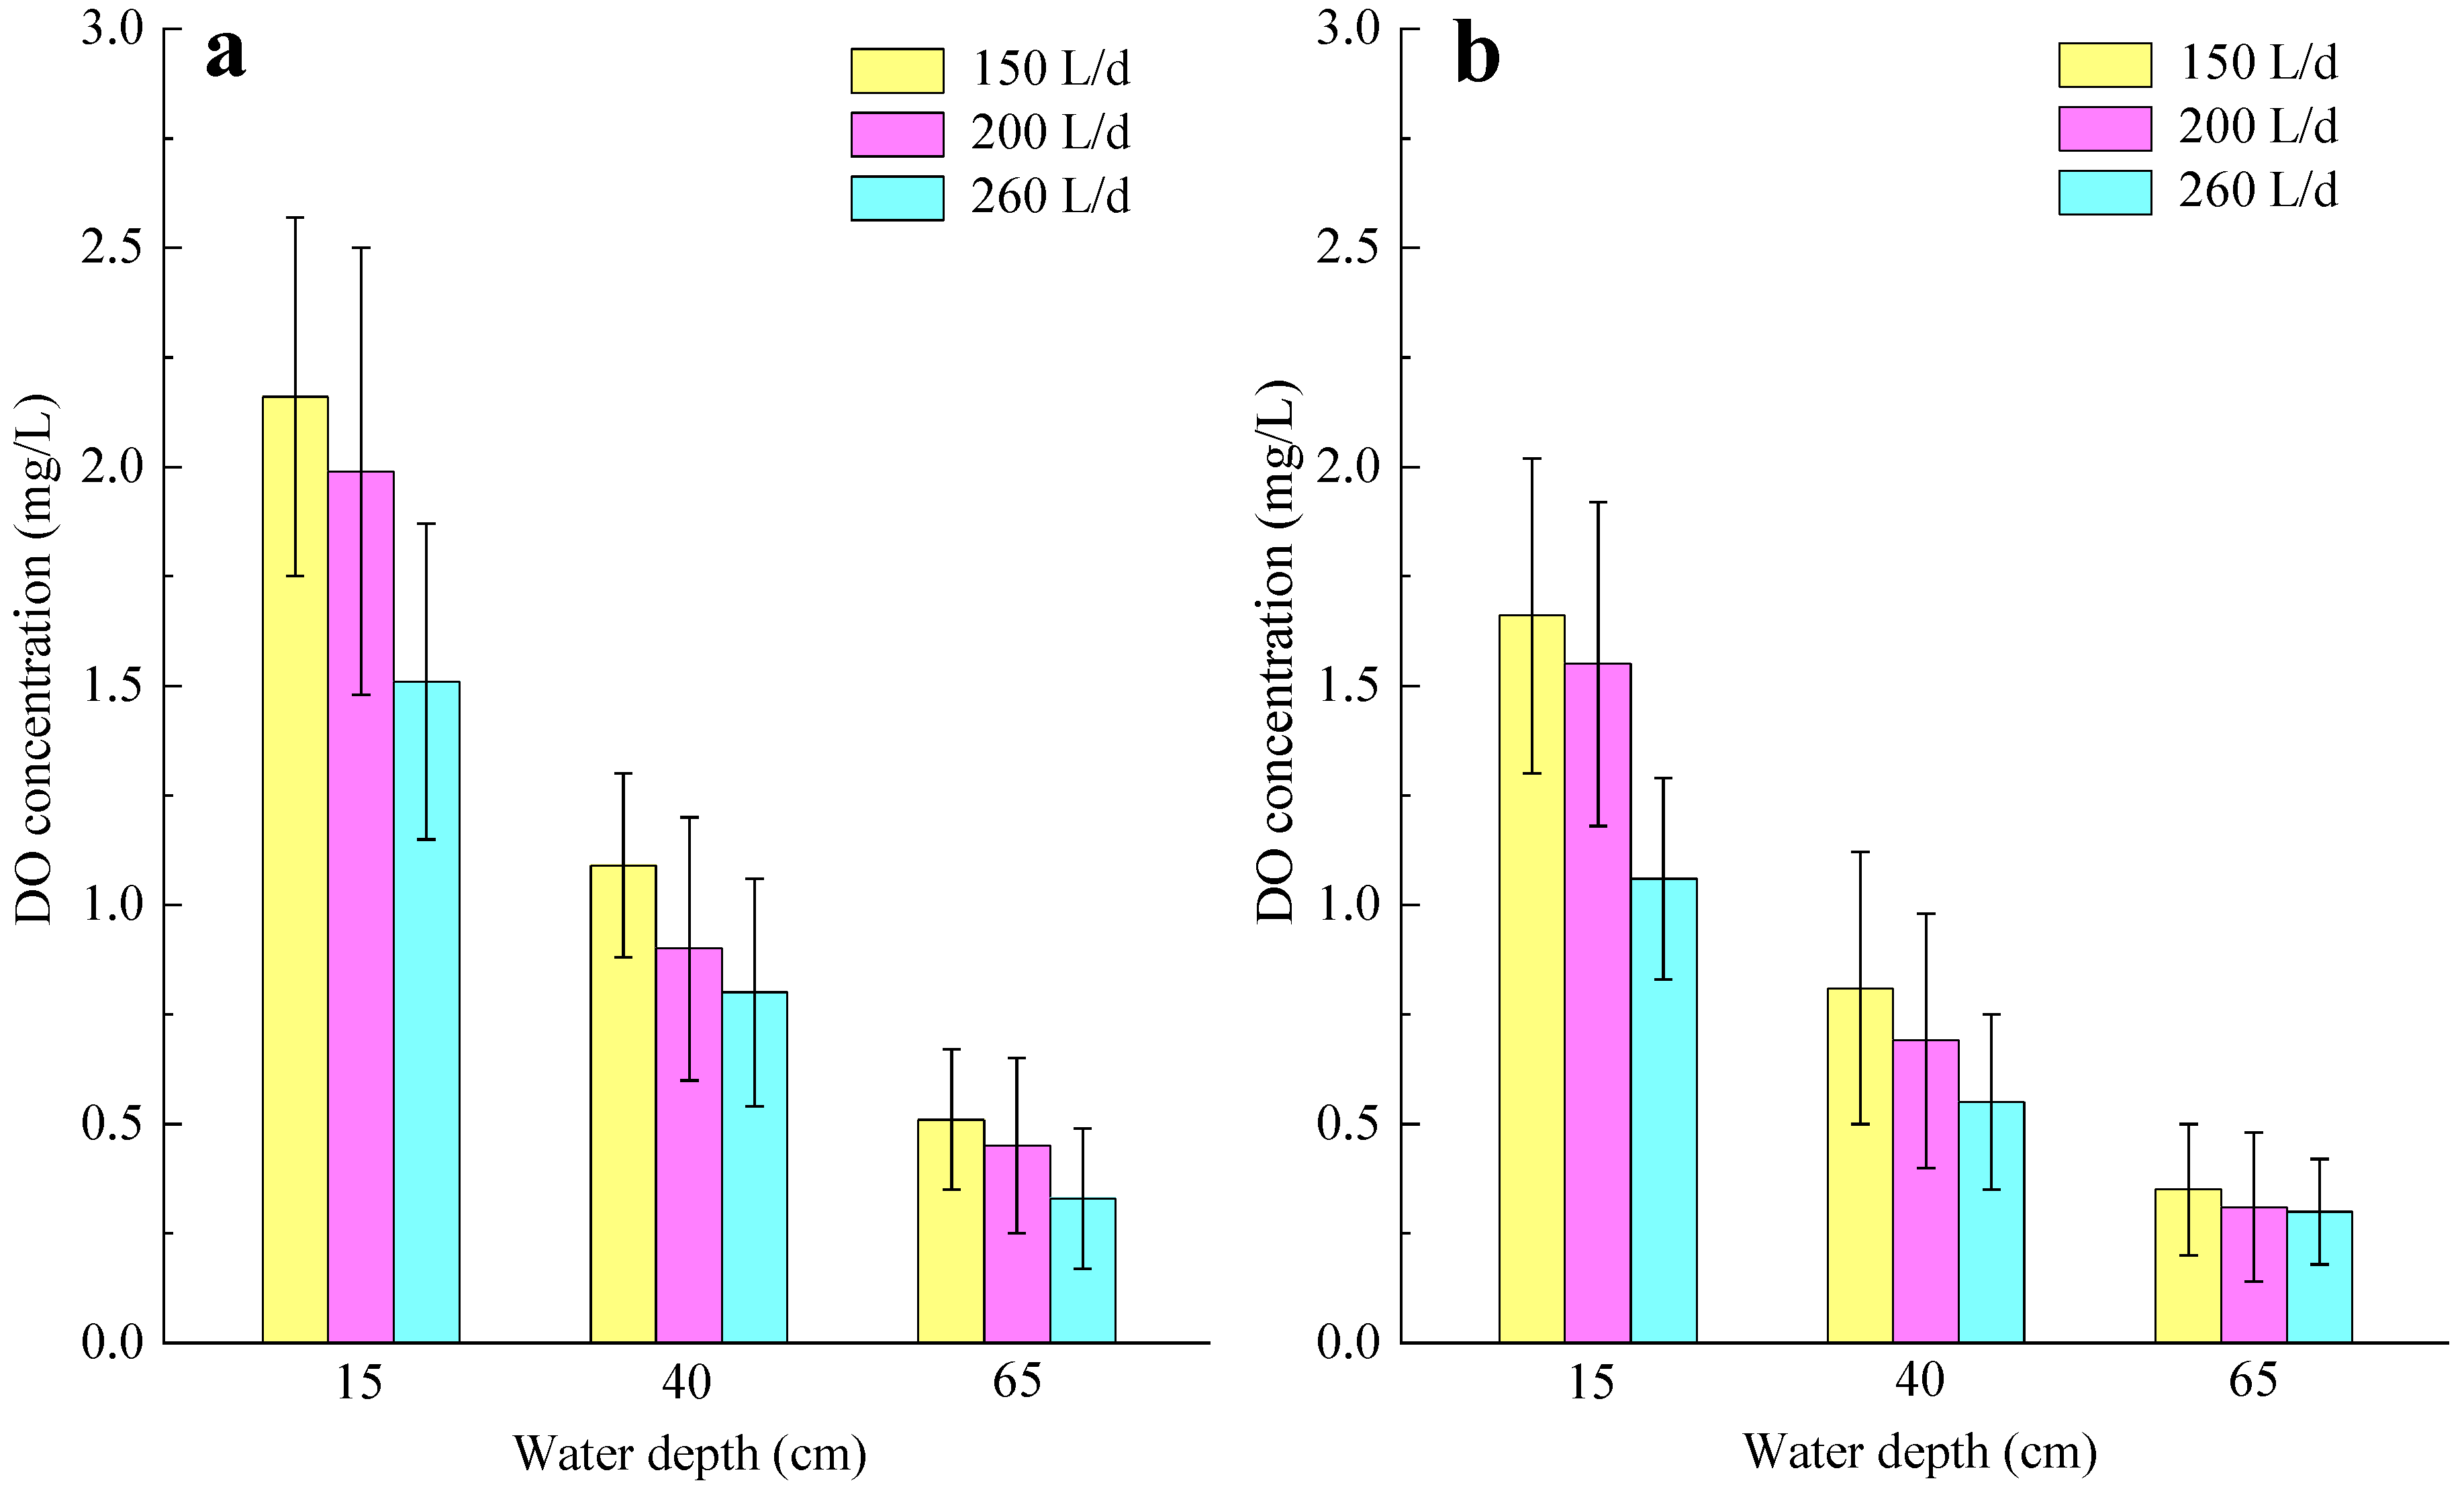
3.1. DO Distributions in VFCW and HFCW Ecosystems

In wetland ecosystems, DO can affect organic matter degradation, nitrogen transformation and microbial phosphorus removal by altering microbial population structure [25,26]. Hence, DO is usually considered as a key factor affecting the decontamination efficiency of constructed wetlands [27]. In general, oxygen within wetland ecosystems can be derived from influent concomitant oxygen, atmospheric reoxygenation and oxygen supplied by plant roots. Among these, atmospheric reoxygenation is the primary approach for constructed wetlands to acquire oxygen [28,29]. Some studies indicate that hydraulic flow pattern has an impact on the diffusion of atmospheric oxygen into liquid phase [30]. Hence, the DO distributions in the VFCW and HFCW were investigated in this study (Figure 2). At the influent loads of 150 L/day (0–28 day), 200 L/day (30–58 day) and 260 L/day (60–90 day), the average DO concentrations in the VFCW at the water depth of 15 cm (upper layer) were respectively 2.16 mg/L, 1.99 mg/L and 1.51 mg/L, indicating an aerobic state. However, they were respectively reduced to 1.09 mg/L, 0.91 mg/L and 0.80 mg/L at the water depth of 40 cm (middle layer), with the declines of 49.5%, 54.3% and 47.0%. At the water depth of 65 cm (lower layer), the average DO concentrations further reduced to 0.51 mg/L (150 L/day), 0.45 mg/L (150 L/day) and 0.33 mg/L (150 L/day), suggesting the formation of anoxic state. In comparison, the DO levels of the HFCW were relatively weaker than that of the VFCW. The average DO concentrations in the upper layer of the HFCW were 1.66 mg/L (150 L/day), 1.54 mg/L (200 L/day) and 1.06 mg/L (260 L/day), respectively. The results demonstrated that the vertical flow pattern was more conducive to atmospheric reoxygenation in subsurface-flow constructed wetlands. In addition, the increasing influent load increased the oxygen consumption of aerobic microorganisms, thus causing the decline of interior DO levels in both VFCW and HFCW ecosystems. Wu et al. investigated the impact of influent strengths on the VFCW treating decentralized domestic wastewater, and they also found that the DO concentration decreased with increasing influent load [31].

3.2. Decontamination Performances of VFCW and HFCW

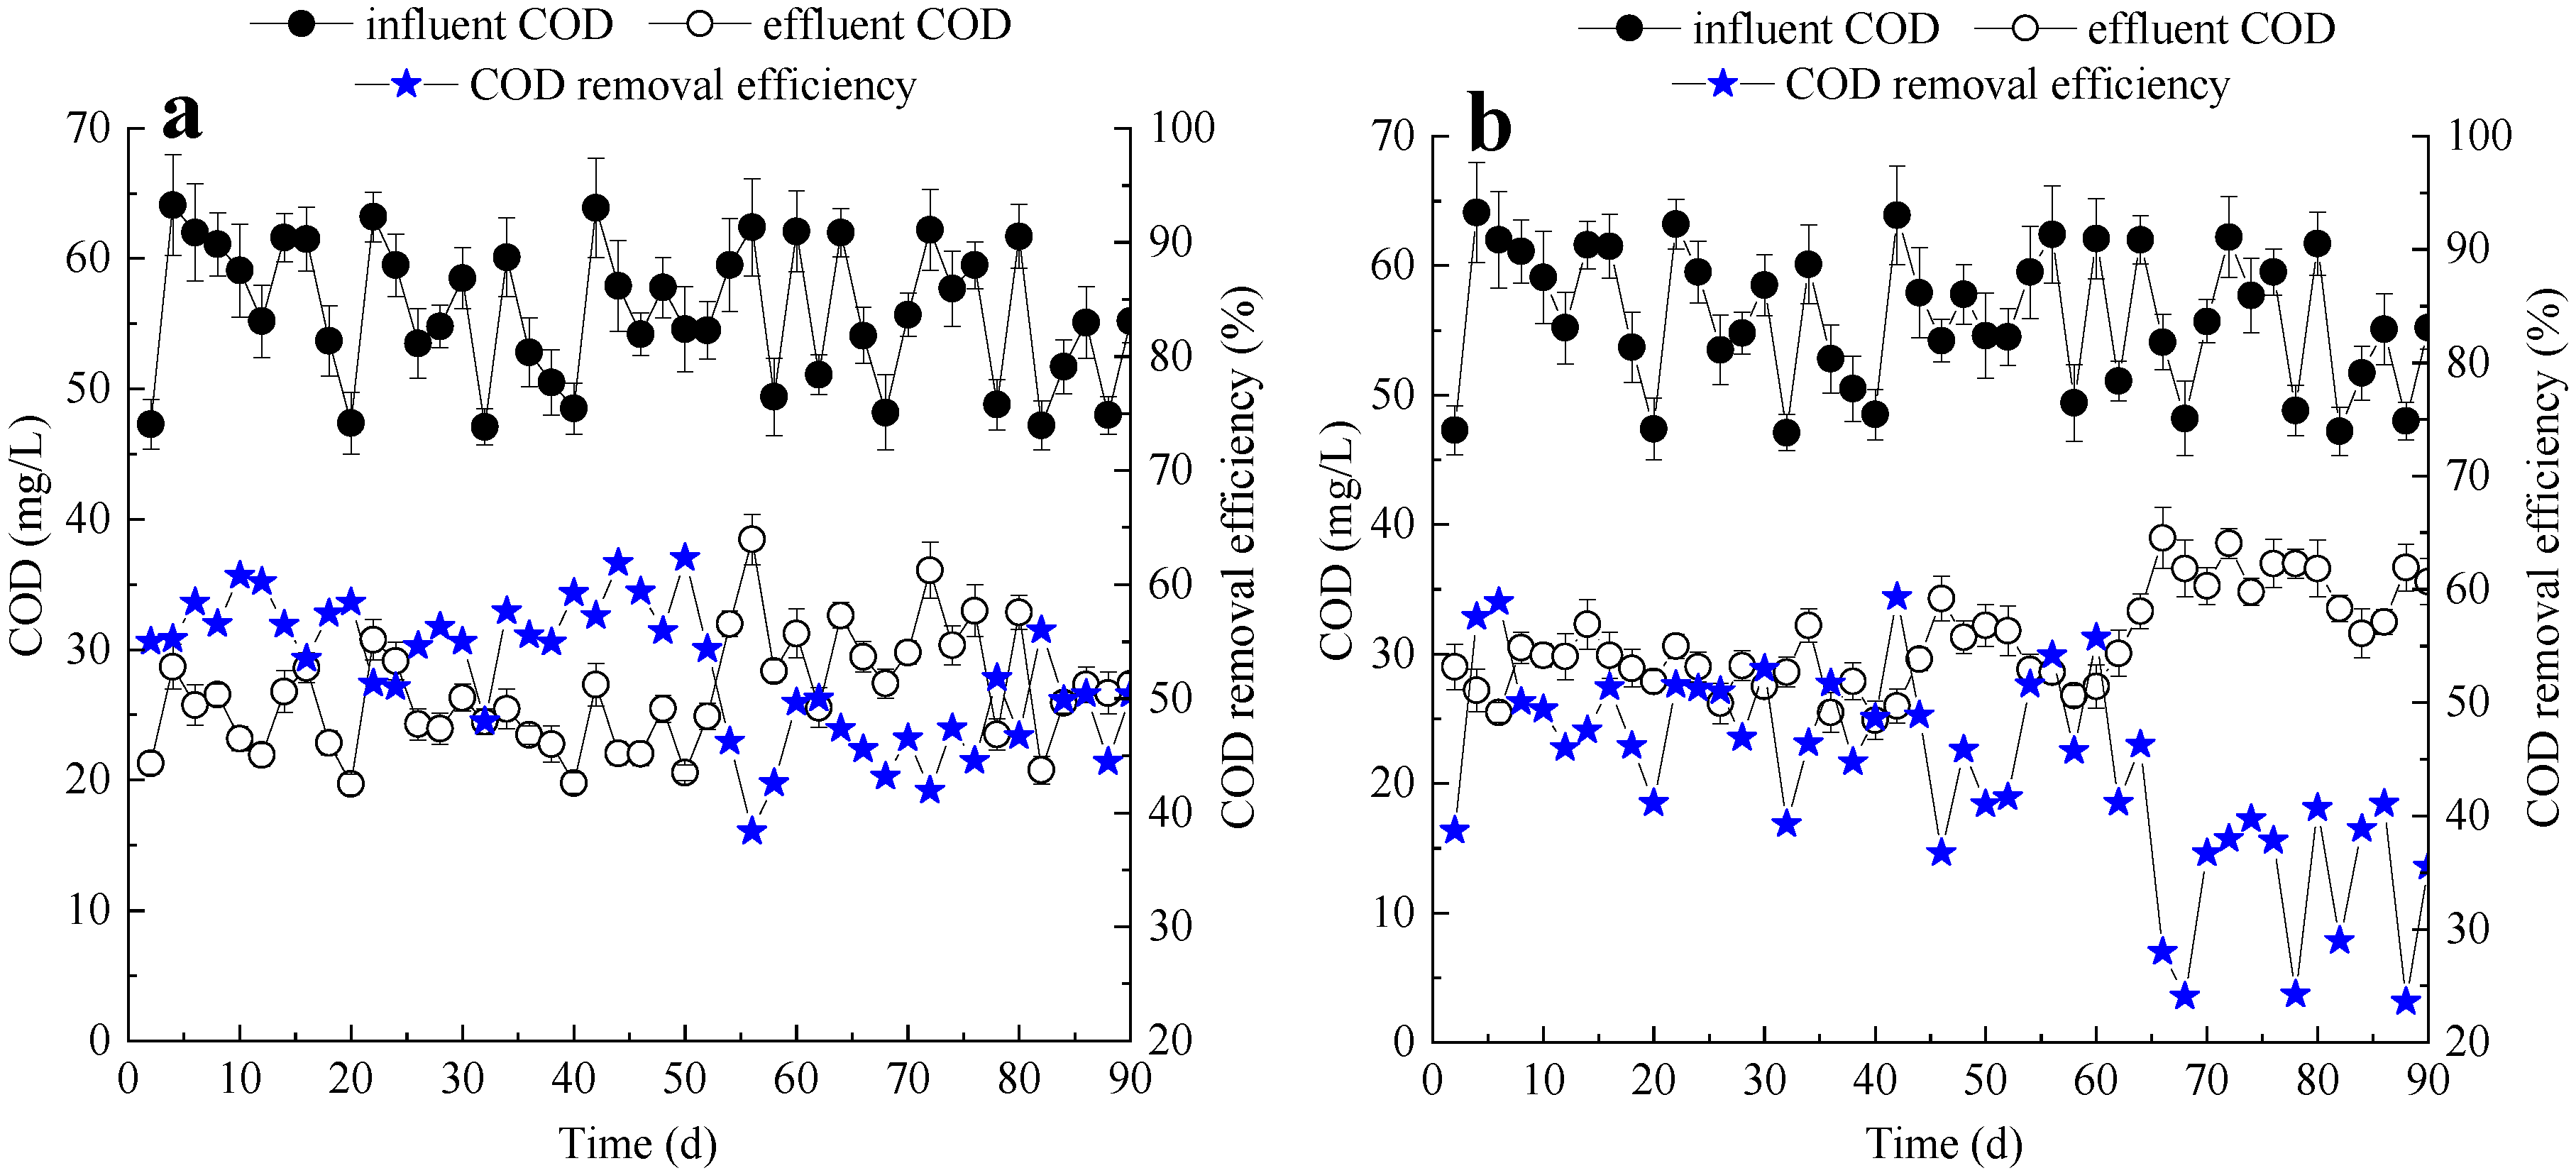
3.2.1. COD Removal Performance

The COD removal efficiencies of VFCW and HFCW under different influent loads are shown in Figure 3. During the whole operation, the influent COD concentrations ranged between 46.5 mg/L and 66.0 mg/L. The average COD concentrations in VFCW effluents were respectively 25.3 mg/L (150 L/day), 25.6 mg/L (200 L/day) and 28.8 mg/L (260 L/day), with corresponding COD removal efficiencies of 56.1%, 53.9% and 47.9% on average. By comparison, the average COD concentrations of HFCW effluents were respectively 29.0 mg/L (150 L/day), 29.1 mg/L (200 L/day) and 34.7 mg/L (260 L/day), and the corresponding COD removal efficiencies were averagely 49.1%, 47.3% and 36.3%. The result demonstrated that the COD removal efficiencies of the VFCW and HFCW both declined with increasing influent loads. Moreover, the VFCW system provided a better COD removal performance than HFCW, especially at the high influent load (p < 0.01). During the entire operation period, the average removal COD efficiencies of the VFCW and HFCW were 52.4% vs. 43.9%. It is known that a good DO condition is beneficial for the microbial degradation of organic matters [32]. As mentioned in Section 3.1, the VFCW system had a relatively higher DO level than the HFCW, thus contributing to a higher COD removal efficiency.

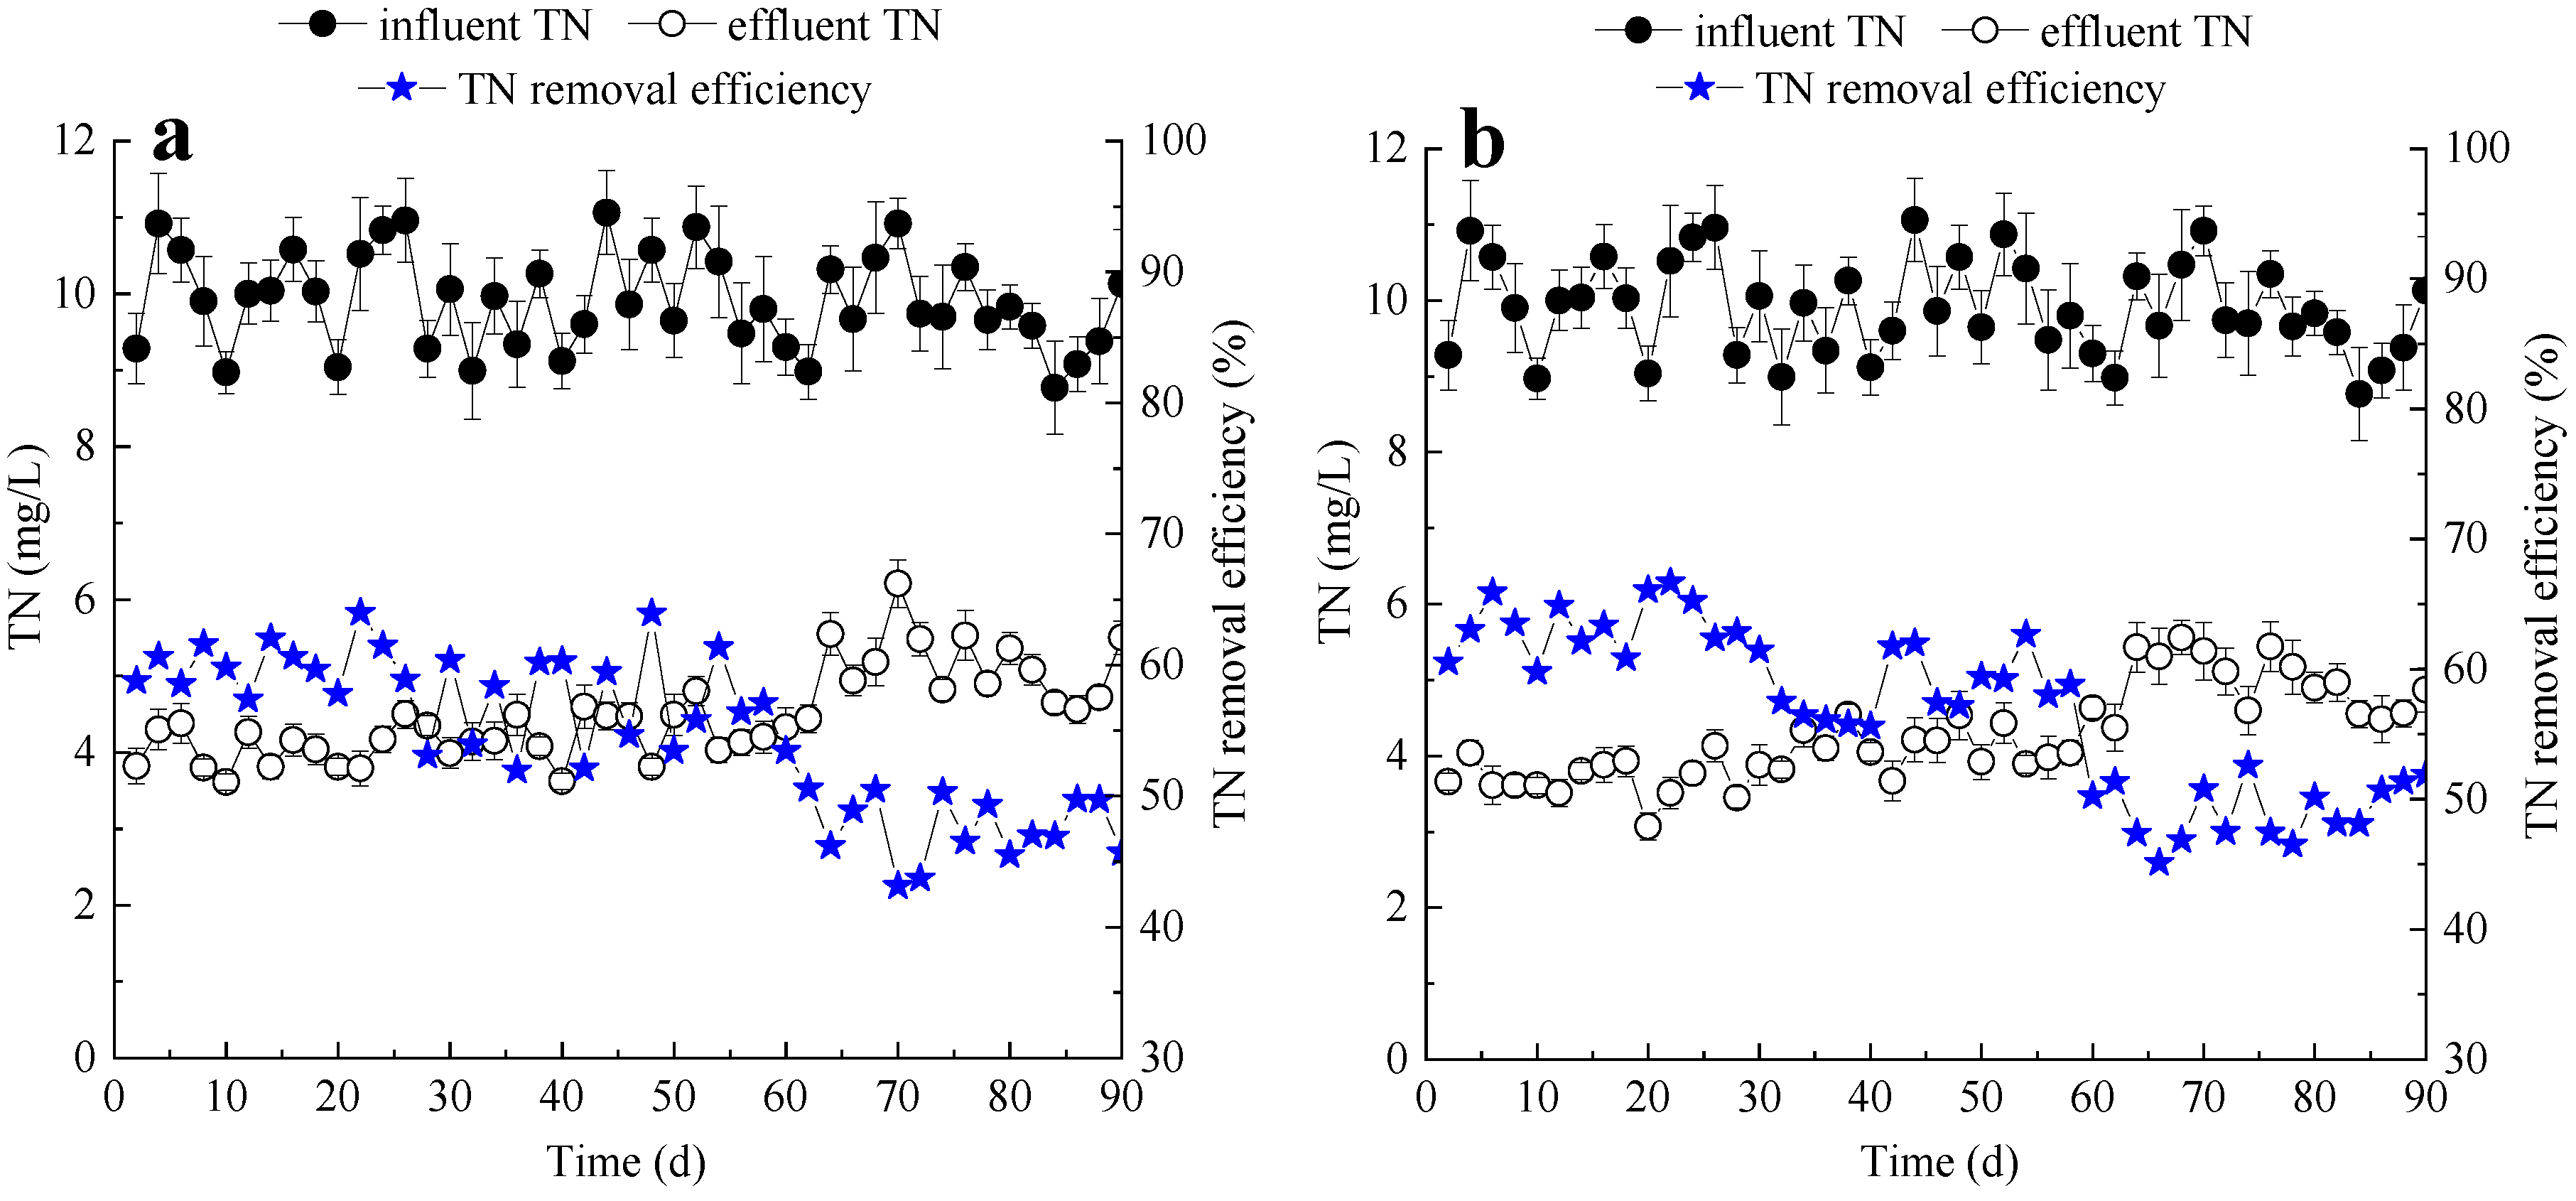
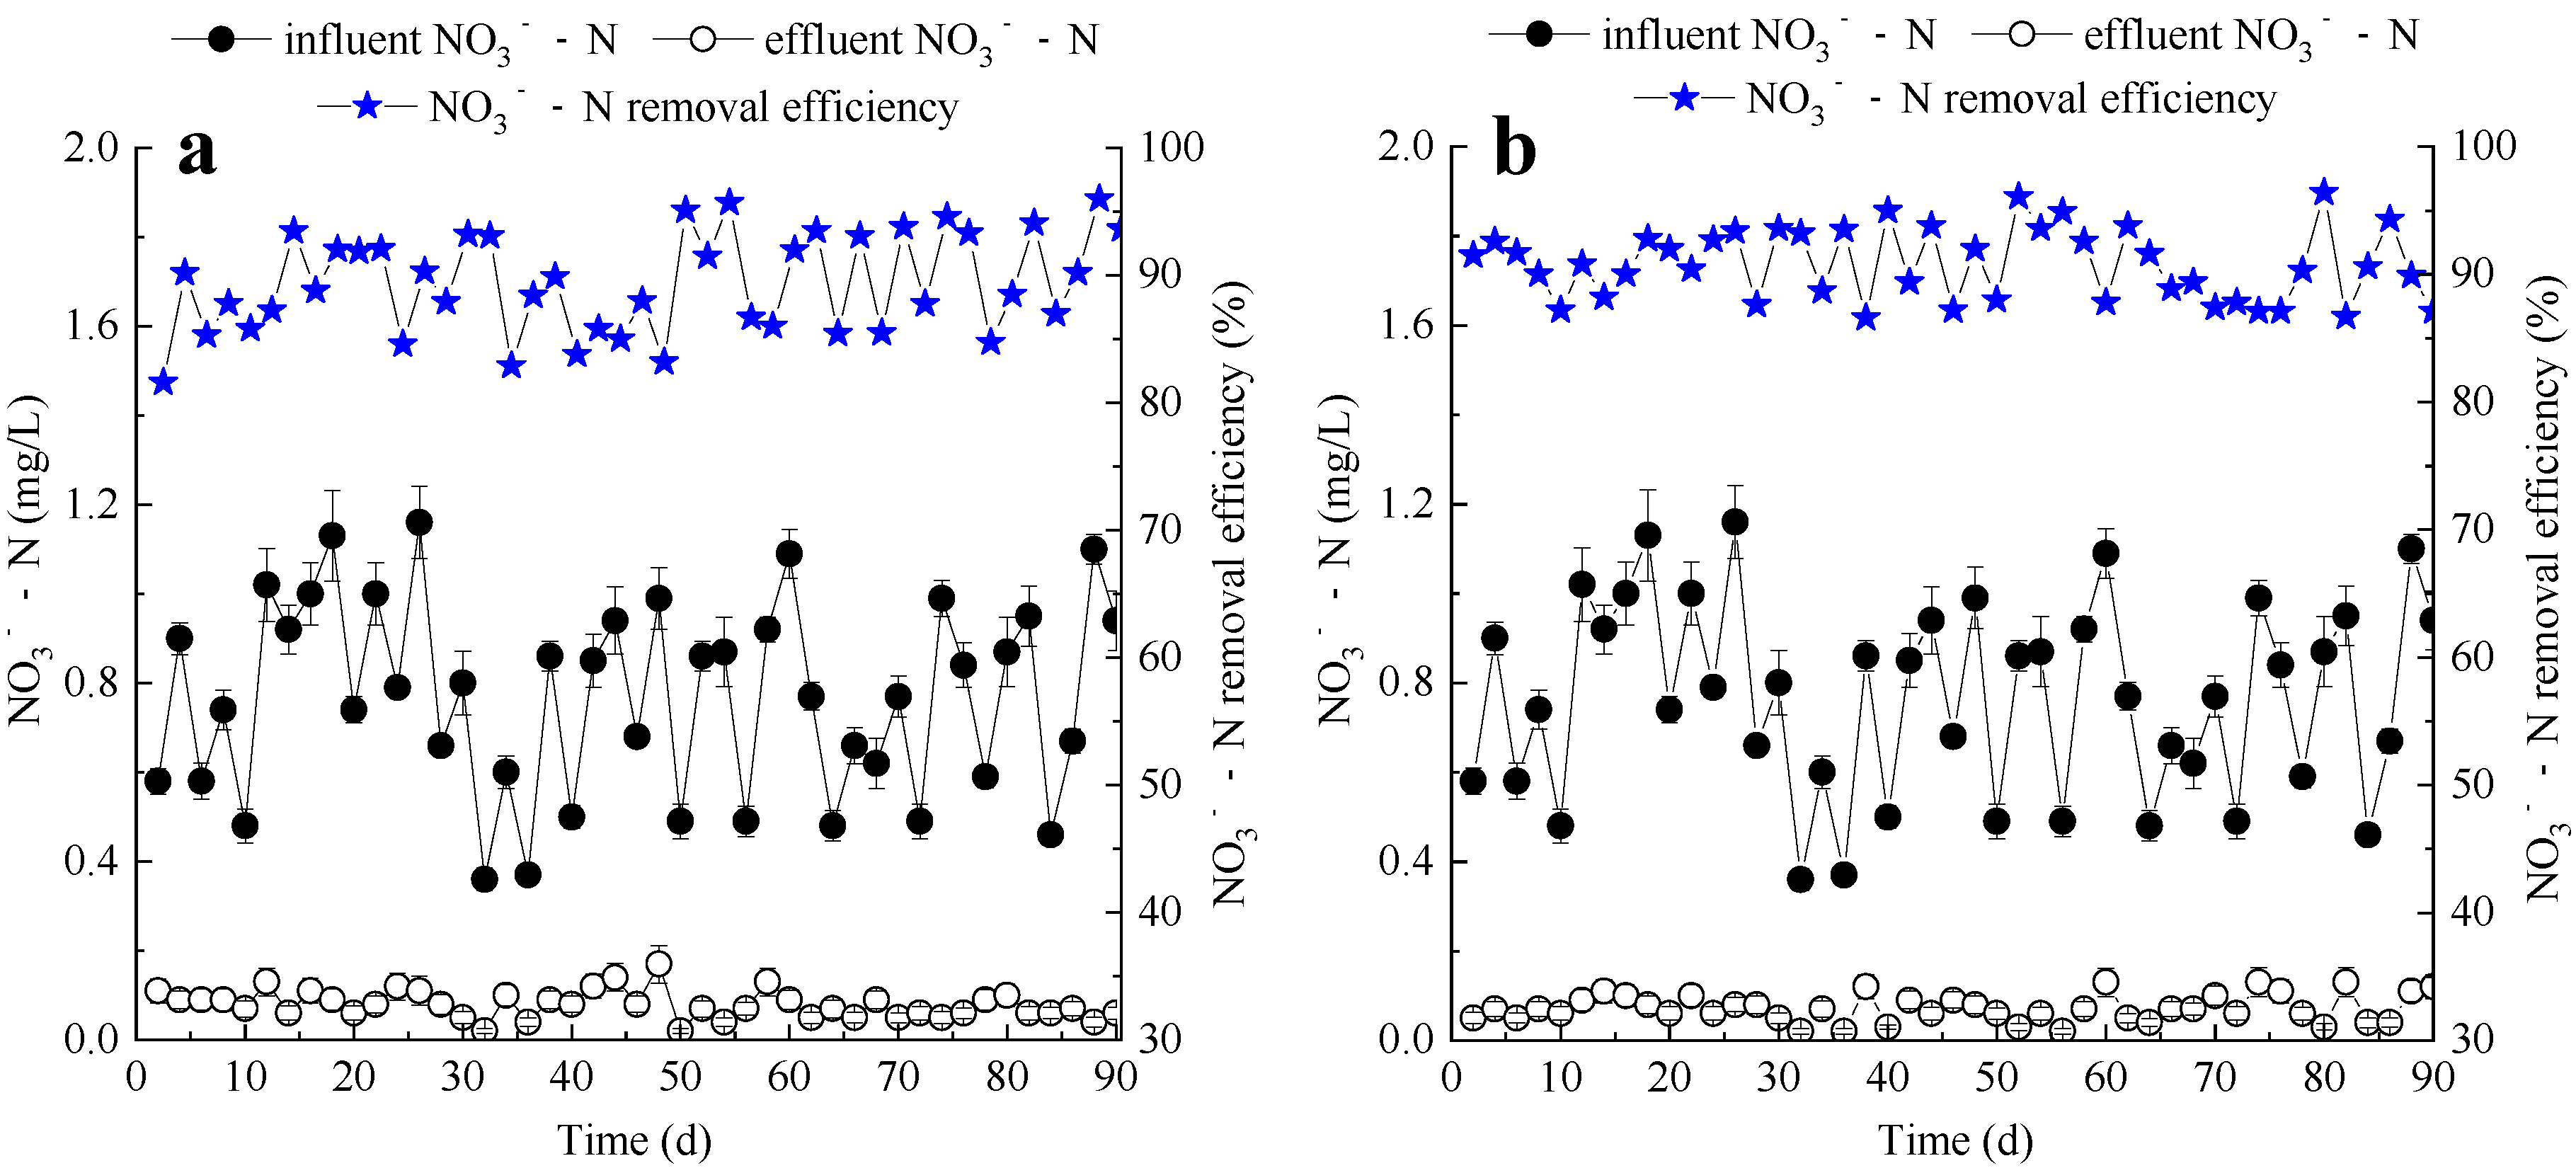
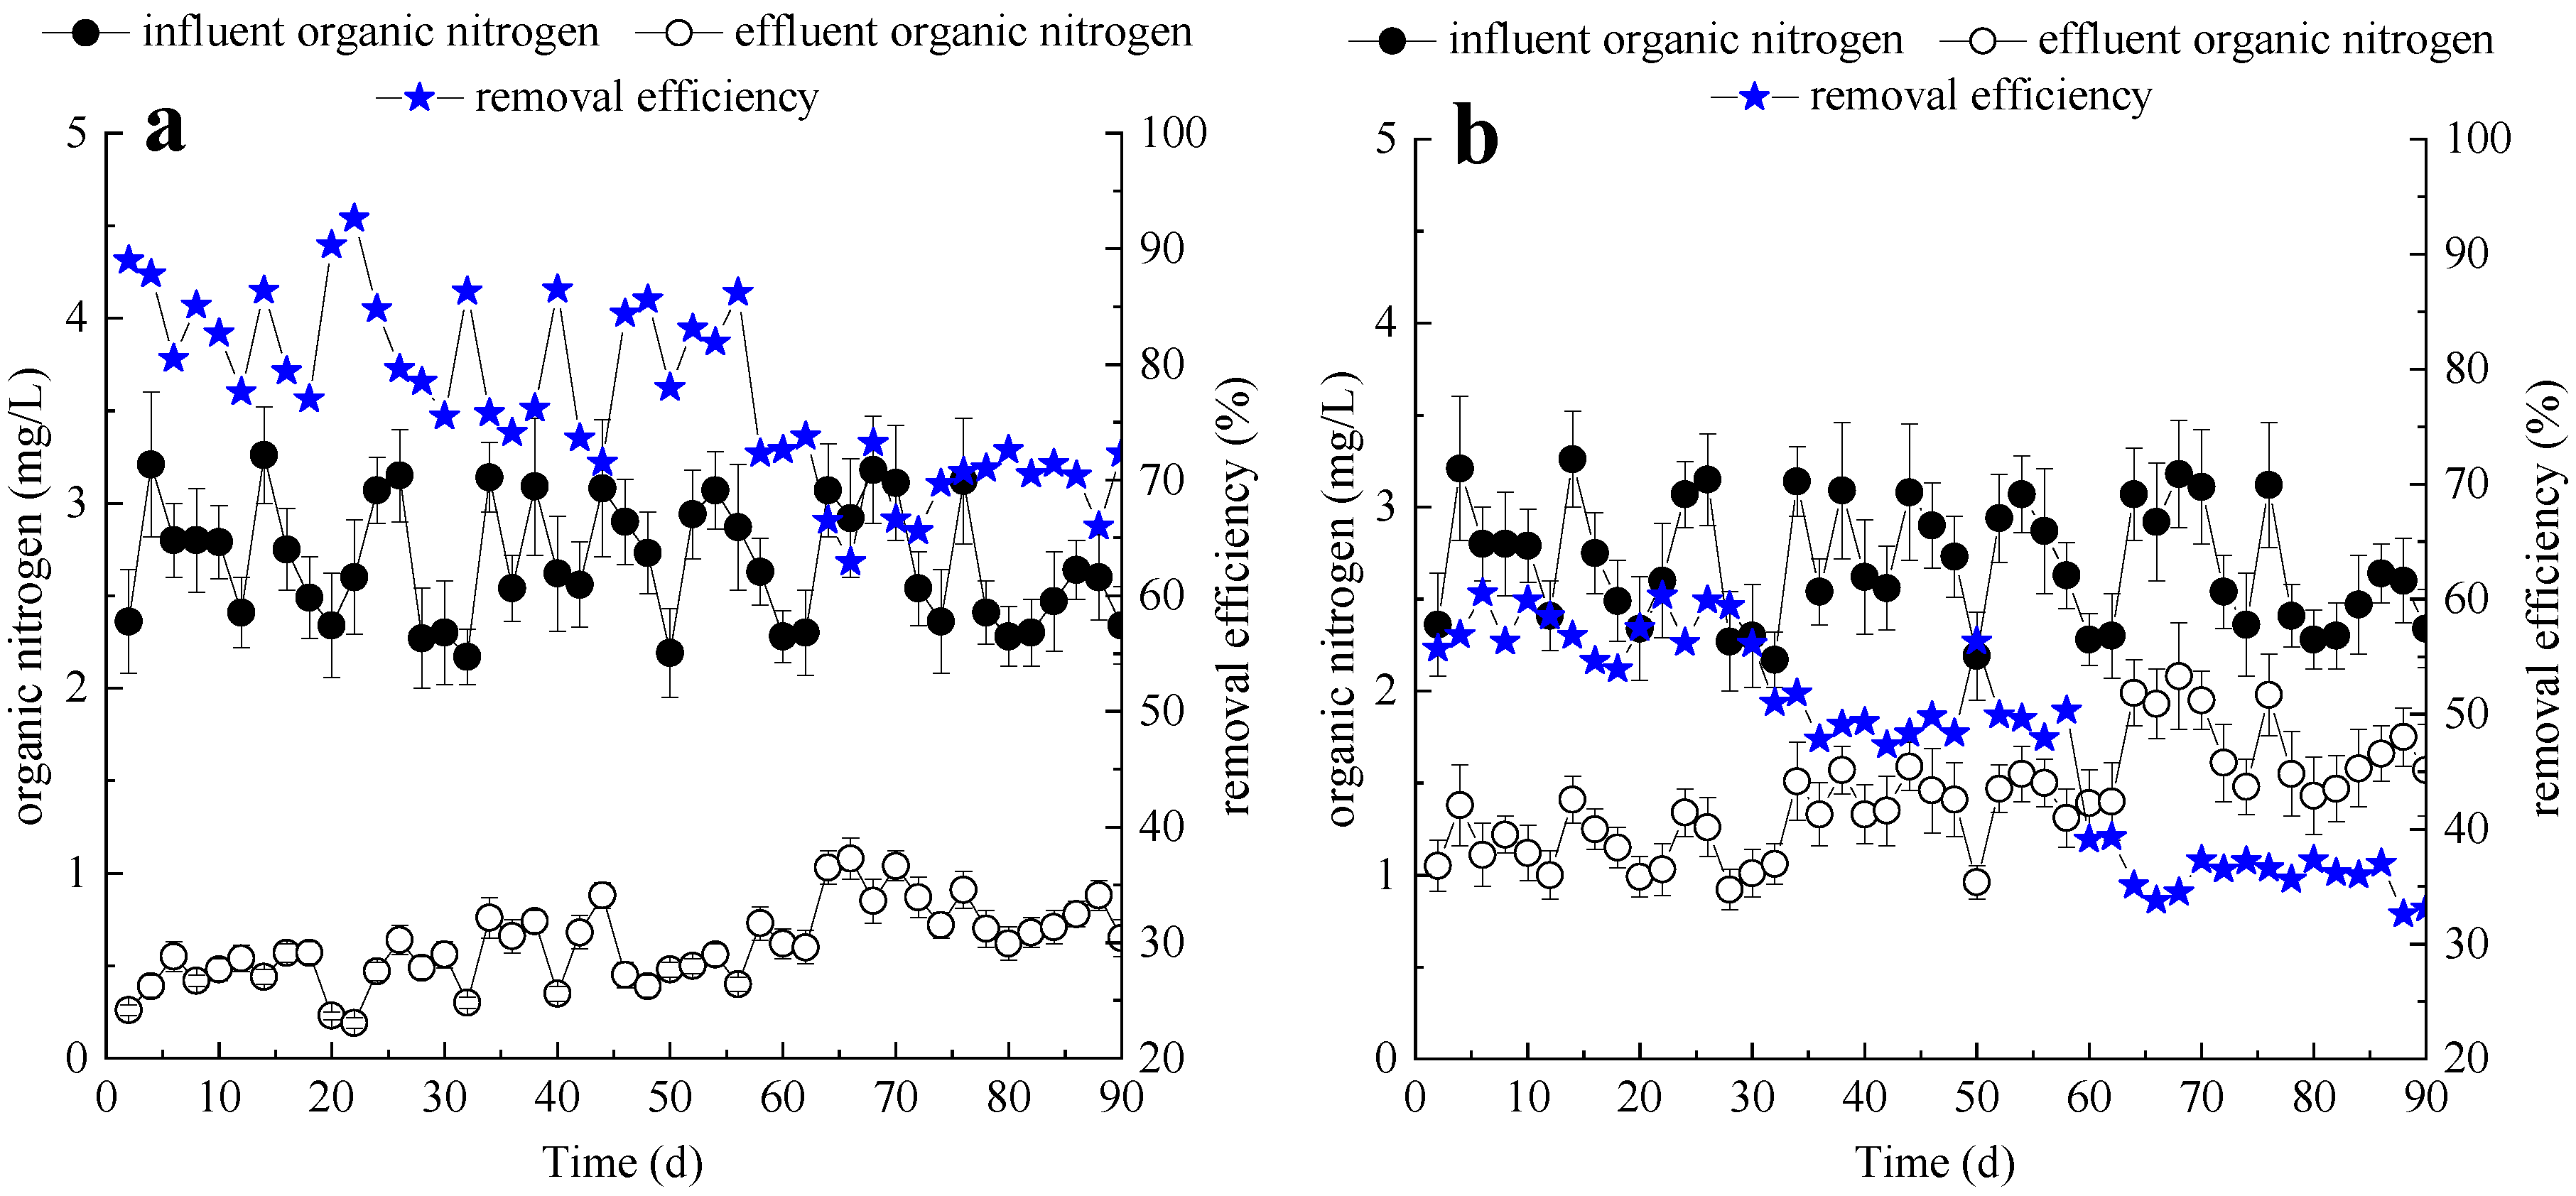
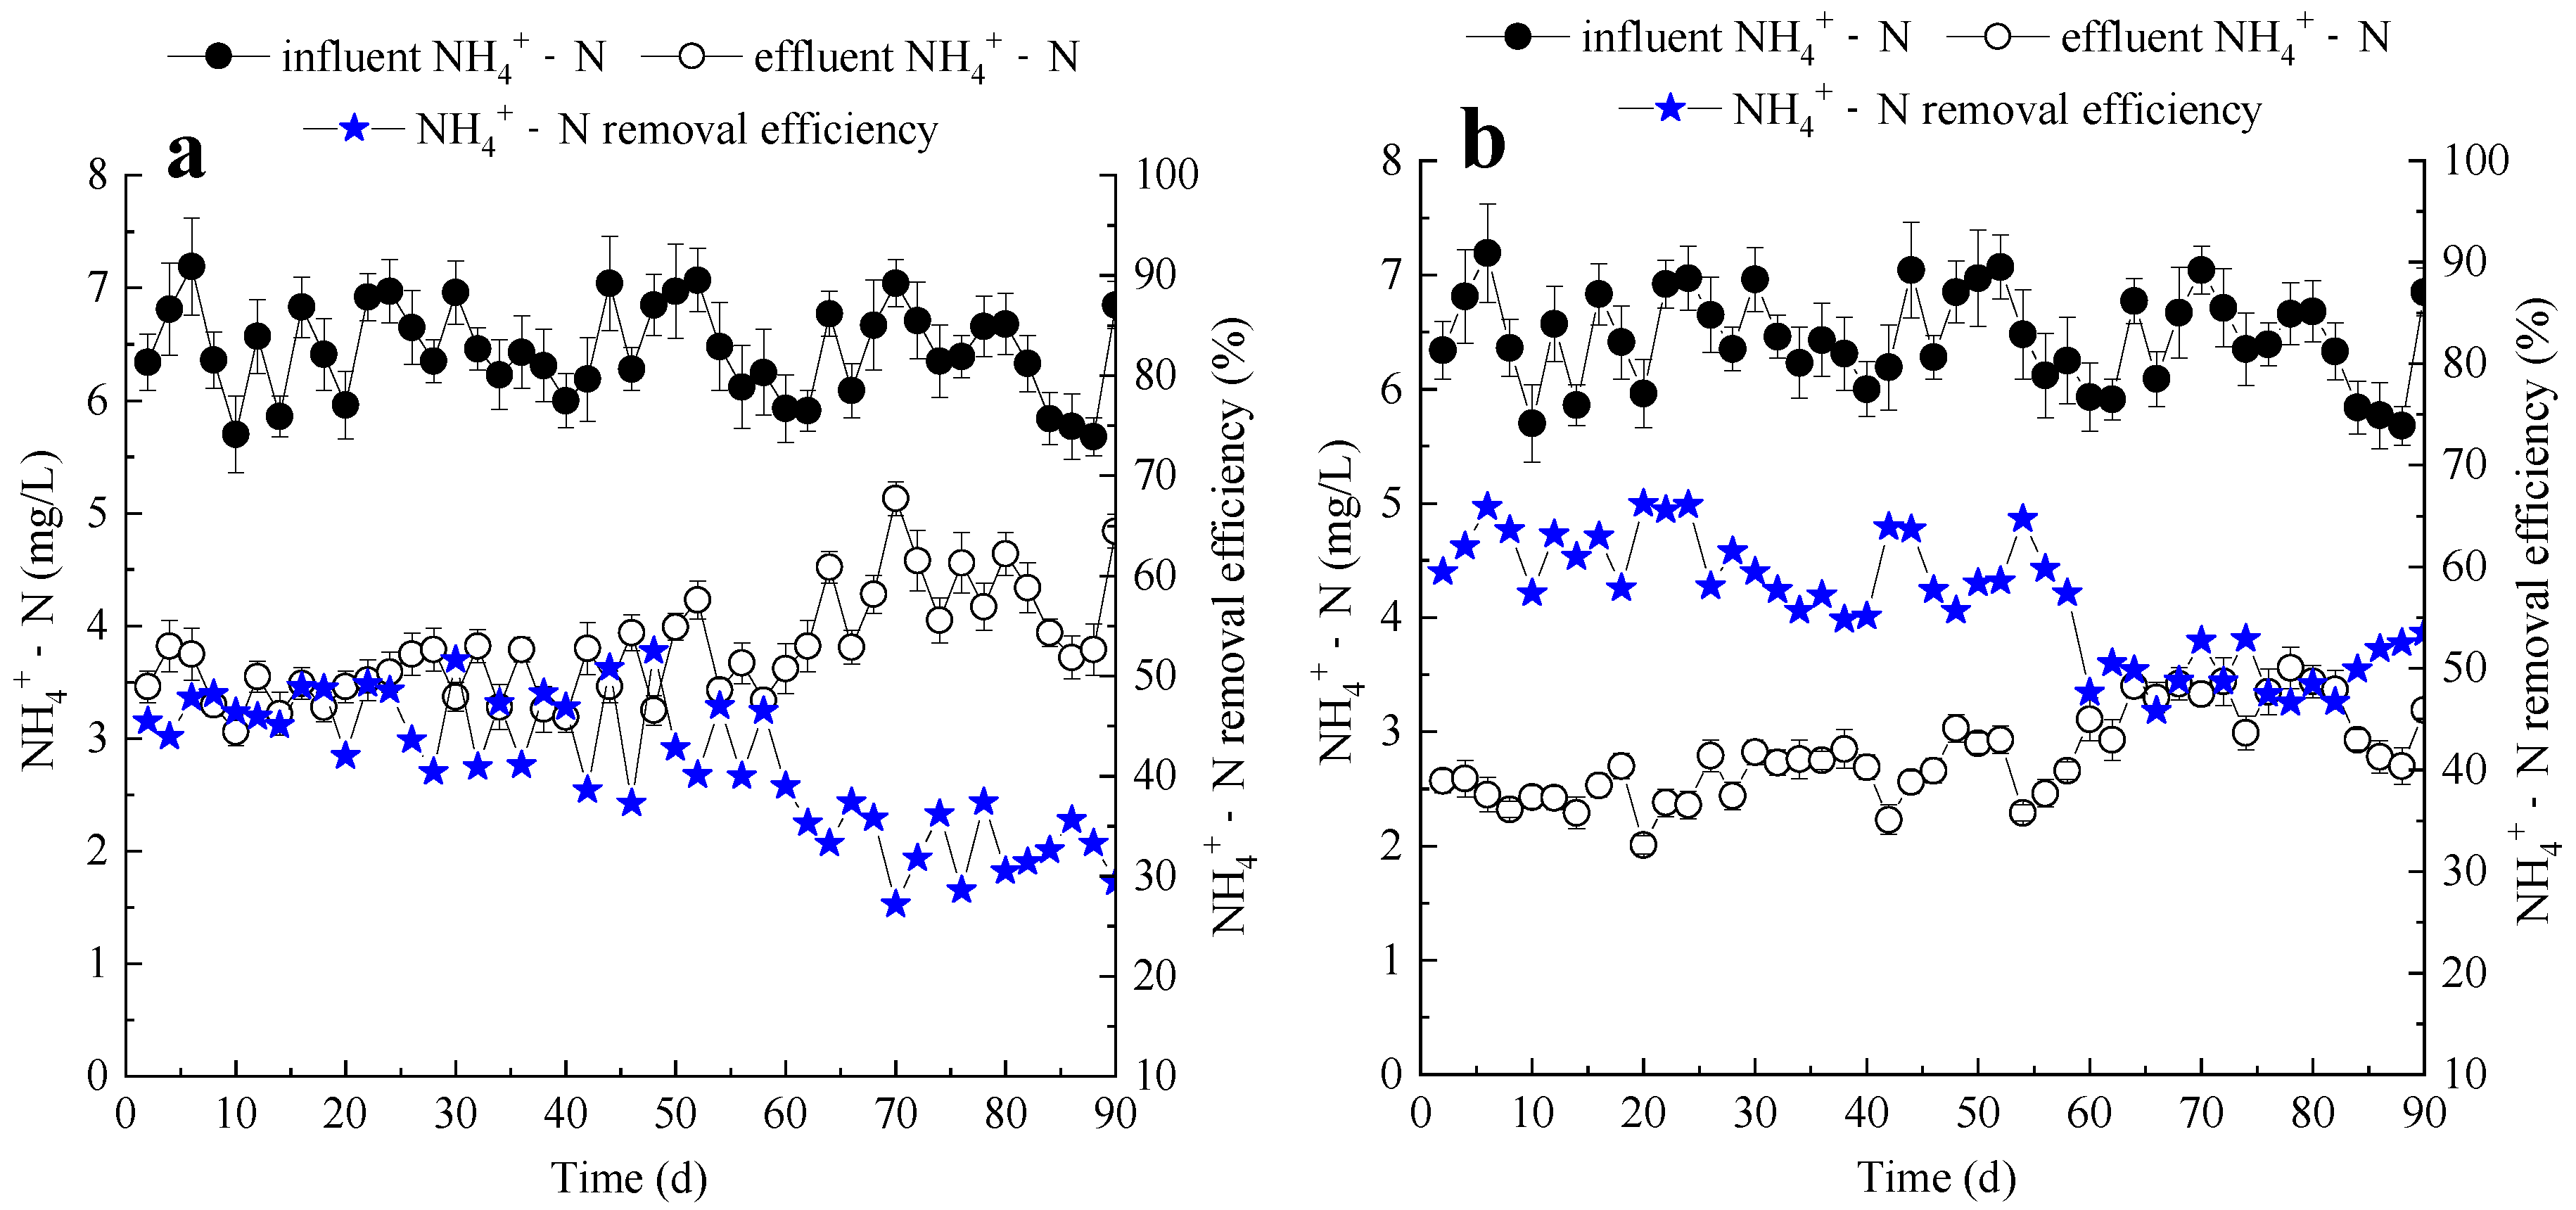
3.2.2. Nitrogen Removal Performance

TN in eutrophic water primarily comprises NH4+−N, NO3−N and organic nitrogen. In this study, the influent TN concentrations ranged between 8.56 mg/L and 10.15 mg/L (Figure 4). During the operation under influent loads of 150 L/day, 200 L/day and 260 L/day, the average TN concentrations in VFCW effluents were respectively 4.06 mg/L, 4.23 mg/L and 5.08 mg/L, with corresponding removal efficiencies of 59.6%, 57.3% and 48.0% on average. The average TN concentrations in HFCW effluents were respectively 3.68 mg/L (150 L/day), 4.11 mg/L (200 L/day) and 4.96 mg/L (260 L/day), and their corresponding removal efficiencies were on average 63.4%, 58.6% and 49.1%. The results demonstrated that there was no significant difference between VFCW and HFCW ecosystems for TN removal (p > 0.05), and increasing influent loads reduced their TN removal efficiencies.
The NO3−N removal performances of VFCW and HFCW ecosystems under different influent loads are shown in Figure 5. The influent NO3−N was mostly less than 1 mg/L, with an average concentration of 0.77 mg/L. The average NO3−N concentrations in the effluents of VFCW and HFCW were both less than 0.1 mg/L during the whole operation, with high removal efficiencies over 88%. It is considered that NO3−N is usually removed through denitrification process in constructed wetlands [33]. As indicated in Section 3.1, the lower layers of VFCW and HFCW substrates were both in low-oxygen status, where denitrifying bacteria were effectively enriched. Thereby, the NO3−N from the influent and nitrification process was potently removed.
Although the VFCW and HFCW ecosystems exhibited similar removal performances for TN and NO3−N, their removal efficiencies of organic nitrogen and NH4+−N were significantly different. As shown in Figure 6, the influent concentration of organic nitrogen ranged between 2.17 mg/L and 3.26 mg/L during the entire operation. At influent loads of 150 L/day, 200 L/day and 260 L/day, the average concentrations of organic nitrogen in VFCW effluents were respectively 0.45 mg/L, 0.56 mg/L and 0.80 mg/L, with corresponding removal efficiencies of 83.7%, 79.4% and 69.7%. By comparison, the effluent concentrations of organic nitrogen in the HFCW system were 1.16 mg/L (150 L/day), 1.36 mg/L (200 L/day) and 1.68 mg/L (260 L/day) on average. The corresponding removal efficiencies were 57.6%, 50.2% and 36.1%, respectively. The results demonstrated that the organic nitrogen removal of the VFCW was significantly better than that of the HFCW (p < 0.01). Besides, organic nitrogen degradations both declined with increasing influent load, and the HFCW system was more sensitive to the load variation.
The NH4+−N detection indicated that the increasing influent loads also caused the decline of NH4+−N elimination during both VFCW and HFCW operations (Figure 7), but the NH4+−N removal efficiency of the VFCW was significantly lower than that of the HFCW (p < 0.01). The influent NH4+−N concentration ranged between 5.68 mg/L and 7.19 mg/L. The average NH4+−N concentrations in the VFCW effluents were respectively 3.50 mg/L (150 L/day), 3.59 mg/L (200 L/day) and 4.24 mg/L (260 L/day), with corresponding removal efficiencies of 46.0%, 44.8% and 33.4%. The average NH4+−N concentrations in the HFCW effluents were respectively 2.45 mg/L (150 L/day), 2.69 mg/L (200 L/day) and 3.20 mg/L (260 L/day), and the corresponding removal efficiencies respectively reached 62.2%, 58.7% and 49.6%.
The results above demonstrated that the influent load increase in this study caused removal efficiencies in the reduction of nitrogen components to varying degrees, no matter whether VFCW or HFCW. Hence, how to enhance the nitrogen removal, especially under a high influent load, is still challenging for constructed wetland operation. During the entire operation period, the average removal efficiencies of organic nitrogen, NH4+−N, TN and NO3−N by VFCW and HFCW were 77.3% vs. 47.5%, 41.1% vs. 56.6%, 54.7% vs. 56.7%, 89.3% vs. 90.8%, respectively. Comparing their performances, except for the comparable removal capacities of TN and NO3−N, the VFCW had a significantly higher organic nitrogen removal efficiency but a significantly lower NH4+−N removal efficiency than the HFCW. The discrepancy indicated that, because ammonia oxidation was the rate-limiting step [34], NH4+−N produced from a better organic nitrogen degradation was not effectively removed during the VFCW operation, thus causing a higher NH4+−N concentration in the effluent.

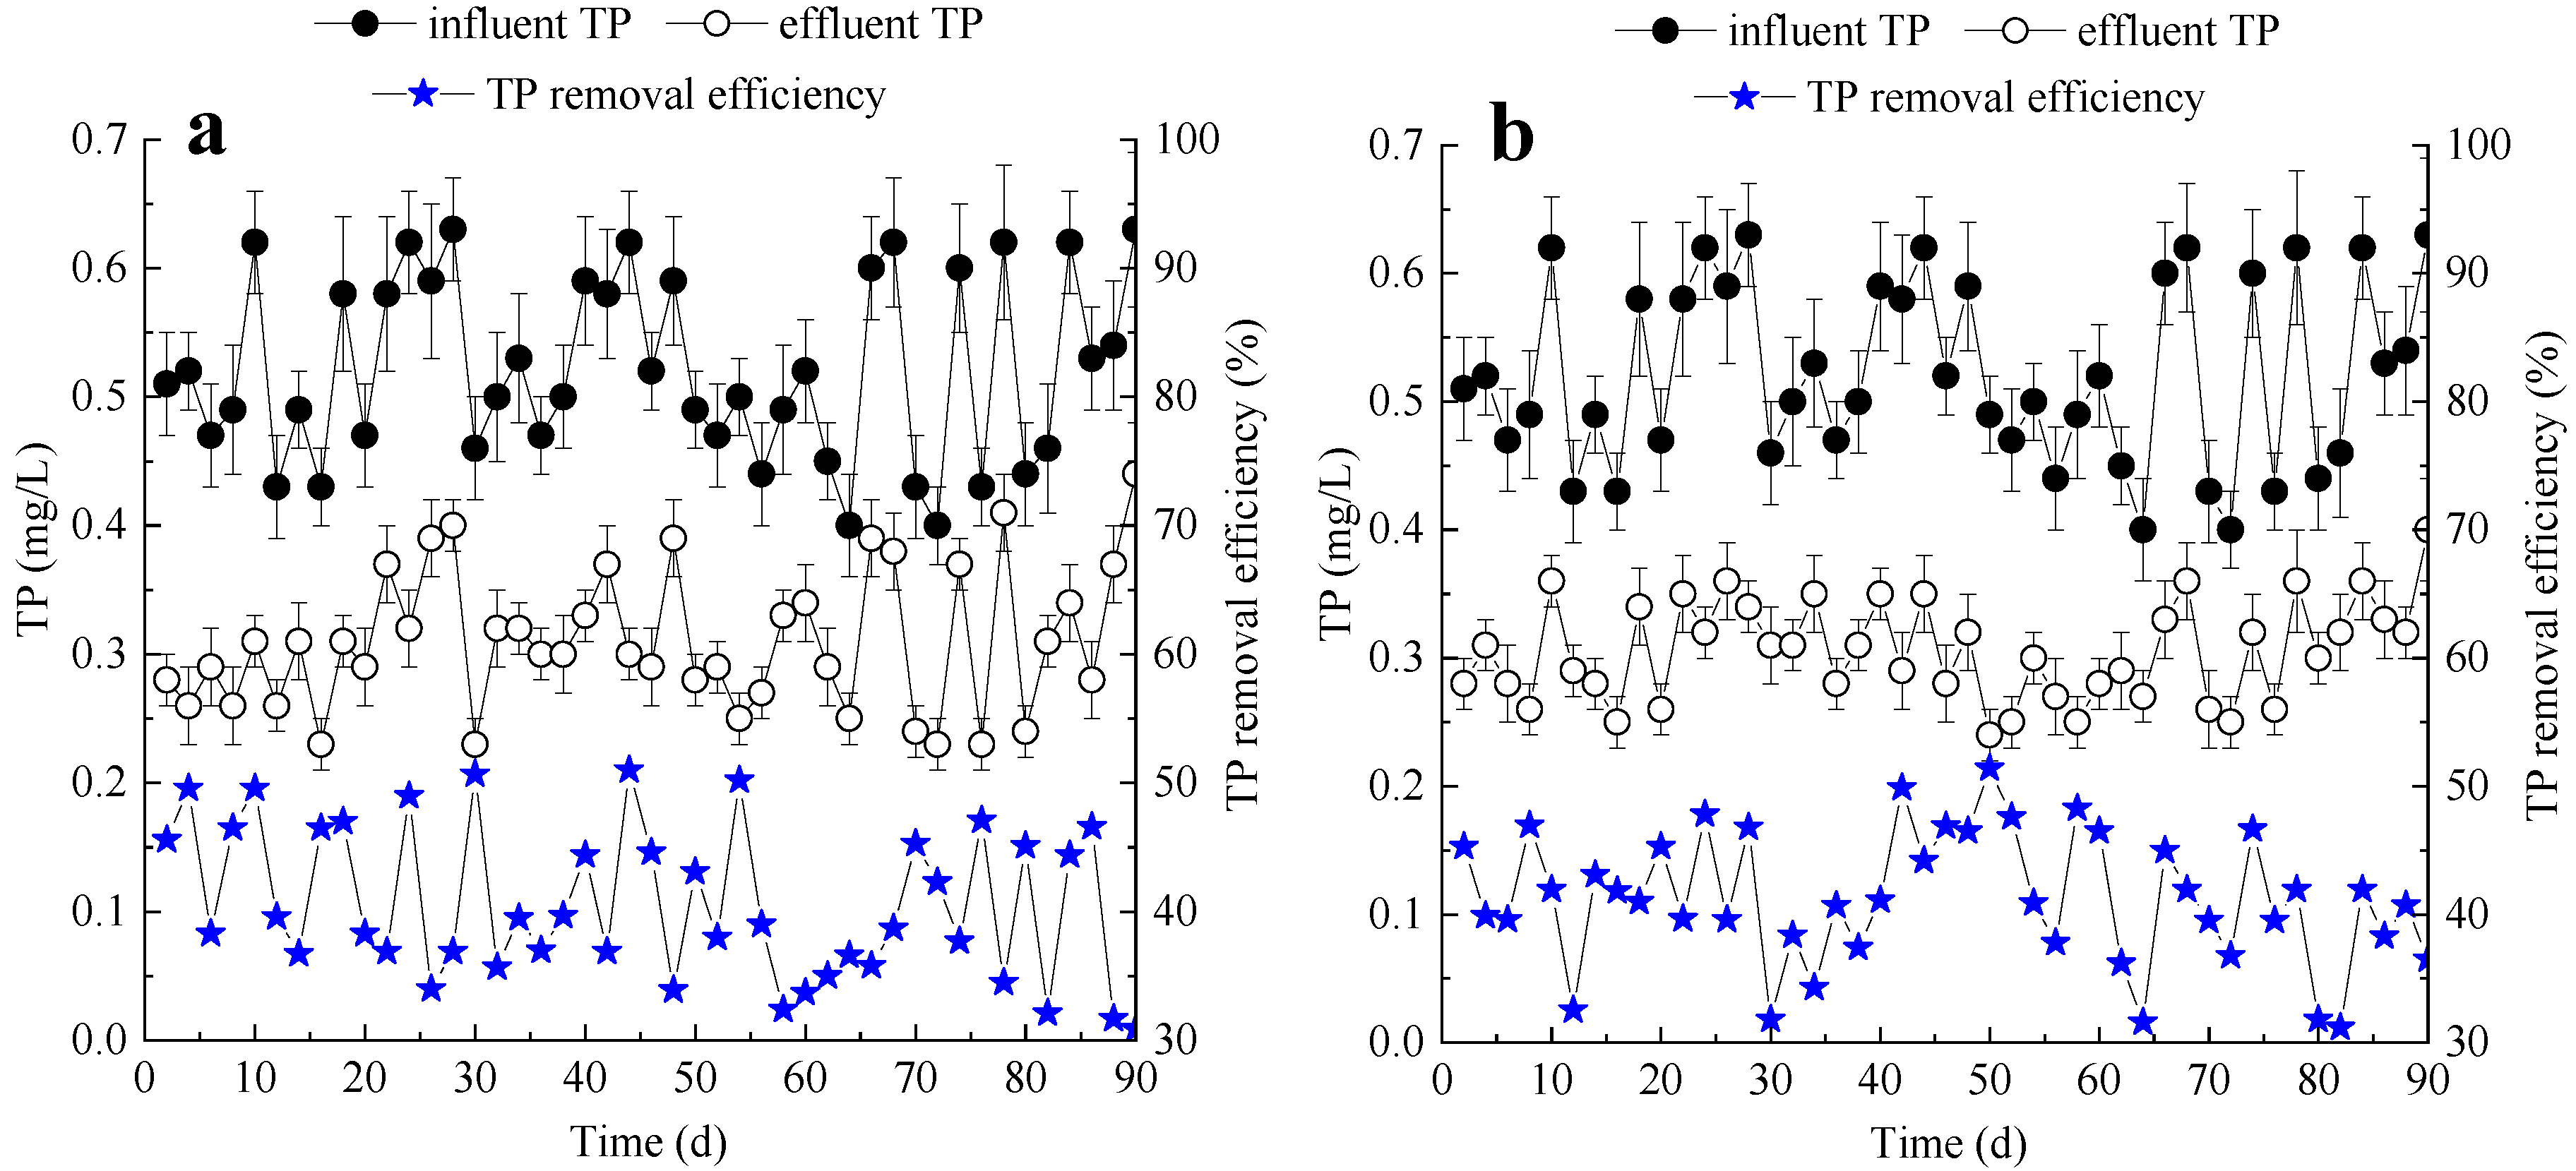
3.2.3. TP Removal Performance

The TP removal performances of the VFCW and HFCW ecosystems are shown in Figure 8. The influent TP concentration ranged between 0.39 and 0.63 mg/L. As the influent loads were increased from 150 L/day to 260 L/day, the TP removal efficiencies of VFCW and HFCW were respectively decreased from 42.5% and 42.2% to 38.6% and 39.1%. During the entire operation period, the effluent TP concentrations from the VFCW and HFCW were respectively between 0.23–0.44 mg/L and 0.24–0.40 mg/L, with average removal efficiencies of 40.6% and 41.2%. The result showed that the VFCW and HFCW had a comparable capacity for TP removal, and the influent load increase had no remarkable effect on TP removal. Phosphorus removal by constructed wetland ecosystems mainly depends on substrate adsorption and plant uptake [22,35]. The pilot-scale HFCW and VFCW in this study used the same substrate and plant, and they were operated synchronously. Hence, their comparable TP removal performance suggested that hydraulic flow pattern should not be a key influence factor for TP removal during the operation of subsurface-flow constructed wetlands.

3.3. Characterization of Enzymatic Activities in VFCW and HFCW Ecosystems

Protease and urease are hydrolytic enzymes that catalyze the degradation of organic nitrogen including protein and urea [36,37], and phosphatase is a key enzyme that catalyzes the removal of phosphate groups from phosphorus-containing organic compounds [38]. To further characterize biochemical differences in VFCW and HFCW ecosystems, the activities of proteases, ureases and phosphatases in their substrates were further analyzed. As shown in Table 1, enzymatic activities declined with increasing depth, and the attenuations were particularly pronounced between the upper and middle layers. In the upper layer of substrates, the enzymatic activities of VFCW were significantly higher than those of HFCW (p < 0.01). At the influent load of 200 L/day, the activities of proteases, ureases and phosphatases in the upper layer of VFCW were respectively 37.61 ± 5.13, 6.97 ± 0.79 and 9.88 ± 1.53 U/g-substrate, while those of HFCW were respectively 29.82 ± 5.61, 5.18 ± 0.75 and 6.37 ± 1.26 U/g-substrate. Moreover, it was found that enzymatic activities were all positively correlated with DO concentrations (r > 0.90), based on the Pearson correlation analysis. Thus, the results demonstrated that DO condition was a key factor for organic matter degradation in constructed wetlands treating eutrophic water, which also clearly explained the superiority of VFCW for COD and organic nitrogen removals.

4. Conclusions

In this study, the pilot-scale VFCW and HFCW were constructed to treat eutrophic water, where DO distributions, decontamination performances and key enzymes activities were compared under different influent loads. The vertical hydraulic flow pattern was more conducive to atmospheric reoxygenation. Although the VFCW and HFCW ecosystems possessed comparable removal capacities for TN, NO3−N and TP, the VFCW had a remarkable superiority for COD and organic nitrogen degradation. The effluent NH4+−N concentrations of the VFCW were respectively 42.9%, 33.5% and 32.5% higher than that of the HFCW at the influent loads of 150, 200 and 260 L/day, indicating the NH4+−N produced from organic nitrogen degradation was not effectively further removed in the VFCW system. The activities of protease, urease and phosphatase declined with the increasing depth of substrate layers, and they were positively correlated with DO concentrations. The three enzymatic activities of the VFCW were respectively 26.1%, 34.6% and 55.1% higher than those of the HFCW in the upper layers. In addition, the increasing influent load reduced the DO levels as well as the removal efficiencies of COD, TN, NH4+−N and organic nitrogen, but it had no remarkable effect on the removal of NO3−N and TP. Taken together, the different hydraulic flow pattern resulted in a certain distinction of operational properties between the VFCW and the HFCW. The enhancement of decontamination performance by the combined application of the two subsurface-flow wetlands, especially under a high influent load, deserves further investigation in future.

Author Contributions

Q.N., Z.H. and W.R. conceived and designed the experiments. Q.N., T.W. and J.L. carried out the experiments, analyzed the data and drafted the paper. W.S., H.M. and P.W. participated in wetlands construction. Z.H. and W.R. revised the manuscript. All authors have read and approved the manuscript.

Funding

This work was supported by Major Science and Technology Program for Water Pollution Control and Treatment (2017ZX07204002), the National Natural Science Foundation of China (51678279, 21506076) and the Fundamental Research Funds for the Central Universities (JUSRP51916B).

Acknowledgments

Thanks for the technical support by Jiangsu Key Laboratory of Anaerobic Biotechnology.

Conflicts of Interest

The authors declare no conflict of interest.

References

  1. Yu, C. China’s water crisis needs more than words. Nature 2011, 470, 307. [Google Scholar] [CrossRef] [PubMed]
  2. Qin, B.; Zhu, G.; Gao, G.; Zhang, Y.; Li, W.; Paerl, H.W.; Carmichael, W.W. A Drinking Water Crisis in Lake Taihu, China: Linkage to Climatic Variability and Lake Management. Environ. Manag. 2010, 45, 105–112. [Google Scholar] [CrossRef]
  3. Kivaisi, A.K. The Potential for Constructed Wetlands for Wastewater Treatment and Reuse in Developing Countries: A Review. Ecol. Eng. 2001, 16, 545–560. [Google Scholar] [CrossRef]
  4. Vymazal, J. Constructed wetlands for treatment of industrial wastewaters: A review. Ecol. Eng. 2014, 73, 724–751. [Google Scholar] [CrossRef]
  5. He, S.B.; Yan, L.; Kong, H.N.; Liu, Z.M.; Wu, D.Y.; Hu, Z.B. Treatment Efficiencies of Constructed Wetlands for Eutrophic Landscape River Water. Pedosphere 2007, 17, 522–528. [Google Scholar] [CrossRef]
  6. Jing, S.R.; Lin, Y.F.; Lee, D.Y.; Wang, T.W. Nutrient removal from polluted river water by using constructed wetlands. Bioresour. Technol. 2001, 76, 131–135. [Google Scholar] [CrossRef]
  7. Saeed, T.; Sun, G. A review on nitrogen and organics removal mechanisms in subsurface flow constructed wetlands: Dependency on environmental parameters, operating conditions and supporting media. J. Environ. Manag. 2012, 112, 429–448. [Google Scholar] [CrossRef]
  8. Nguyen, L.M. Organic matter composition, microbial biomass and microbial activity in gravel-bed constructed wetlands treating farm dairy wastewaters. Ecol. Eng. 2000, 16, 199–221. [Google Scholar] [CrossRef]
  9. Xu, M.; Liu, W.; Li, C.; Xiao, C.; Ding, L.; Xu, K.; Geng, J.; Ren, H. Evaluation of the treatment performance and microbial communities of a combined constructed wetland used to treat industrial park wastewater. Environ. Sci. Pollut. Res. 2016, 23, 10990–11001. [Google Scholar] [CrossRef]
  10. Wu, Y.; Han, R.; Yang, X.; Fang, X.; Chen, X.; Yang, D.; Zhang, R. Correlating microbial community with physicochemical indices and structures of a full-scale integrated constructed wetland system. Appl. Microbiol. Biotechnol. 2016, 100, 6917–6926. [Google Scholar] [CrossRef]
  11. Ghosh, D.; Gopal, B. Effect of hydraulic retention time on the treatment of secondary effluent in a subsurface flow constructed wetland. Ecol. Eng. 2010, 36, 1044–1051. [Google Scholar] [CrossRef]
  12. Oliver, N.; Martín, M.; Gargallo, S.; Hernández-Crespo, C. Influence of operational parameters on nutrient removal from eutrophic water in a constructed wetland. Hydrobiologia 2016, 792, 105–120. [Google Scholar] [CrossRef]
  13. Li, S.M.; Feng, J.; Xu, M.; Miu, B.F. Experimental Research on Fillers Gradation of Horizontal Subsurface Flow Wetlands for Advanced Treatment of Secondary Effluent. Environ. Sci. Technol. 2016, 29, 37–41. [Google Scholar]
  14. Ding, Y.; Wang, W.; Song, X.S.; Wang, G.; Wang, Y.H. Effect of spray aeration on organics and nitrogen removal in vertical subsurface flow constructed wetland. Chemosphere 2014, 117, 502–505. [Google Scholar] [CrossRef] [PubMed]
  15. Hernández-Crespo, C.; Gargallo, S.; Benedito-Durá, V.; Nácher-Rodríguez, B.; Rodrigo-Alacreu, M.A.; Martín, M. Performance of surface and subsurface flow constructed wetlands treating eutrophic waters. Sci. Total Environ. 2017, 595, 584–593. [Google Scholar]
  16. Chen, H. Surface-Flow Constructed Treatment Wetlands for Pollutant Removal: Applications and Perspectives. Wetlands 2011, 31, 805–814. [Google Scholar] [CrossRef]
  17. Kong, L.; Wang, Y.B.; Zhao, L.N.; Chen, Z.H. Enzyme and root activities in surface-flow constructed wetlands. Chemosphere 2009, 76, 601–608. [Google Scholar] [CrossRef]
  18. Neralla, S.; Weaver, R.W.; Lesikar, B.J.; Persyn, R.A. Improvement of domestic wastewater quality by subsurface flow constructed wetlands. Bioresour. Technol. 2000, 75, 19–25. [Google Scholar] [CrossRef]
  19. Burgoon, P.S.; Reddy, K.R.; Debusk, T.A. Performance of subsurface flow wetlands with batch-load and continuous-flow conditions. Water Environ. Res. 1995, 67, 855–862. [Google Scholar] [CrossRef]
  20. Langergraber, G.; Giraldi, D.; Mena, J.; Meyer, D.; Peña, M.; Toscano, A.; Brovelli, A.; Korkusuz, E.A. Recent developments in numerical modelling of subsurface flow constructed wetlands. Sci. Total Environ. 2009, 407, 3931–3943. [Google Scholar] [CrossRef]
  21. Dunne, E.J.; Coveney, M.F.; Marzolf, E.R.; Hoge, V.R.; Conrow, R.; Naleway, R.; Lowe, E.F.; Battoe, L.E.; Inglett, P.W. Nitrogen dynamics of a large-scale constructed wetland used to remove excess nitrogen from eutrophic lake water. Ecol. Eng. 2013, 61, 224–234. [Google Scholar] [CrossRef]
  22. Dunne, E.J.; Coveney, M.F.; Hoge, V.R.; Conrow, R.; Naleway, R.; Lowe, E.F.; Battoe, L.E.; Wang, Y. Phosphorus removal performance of a large-scale constructed wetland receiving eutrophic lake water. Ecol. Eng. 2015, 79, 132–142. [Google Scholar] [CrossRef]
  23. Li, L.; Li, Y.; Biswas, D.K.; Nian, Y.; Jiang, G. Potential of constructed wetlands in treating the eutrophic water: Evidence from Taihu Lake of China. Bioresour. Technol. 2008, 99, 1656–1663. [Google Scholar] [CrossRef] [PubMed]
  24. APHA Standard Methods for the Examination of Water and Wastewater; American Public Health Association/American Water Works Association/Water Environment Federation: Washington, DC, USA, 2012.
  25. Liu, F.F.; Fan, J.; Du, J.; Shi, X.; Zhang, J.; Shen, Y. Intensified nitrogen transformation in intermittently aerated constructed wetlands: Removal pathways and microbial response mechanism. Sci. Total Environ. 2019, 650, 2880–2887. [Google Scholar] [CrossRef]
  26. Dong, H.; Qiang, Z.; Li, T.; Jin, H.; Chen, W. Effect of artificial aeration on the performance of vertical-flow constructed wetland treating heavily polluted river water. J. Environ. Sci.-China 2012, 24, 596–601. [Google Scholar] [CrossRef]
  27. Ding, Y.; Song, X.; Wang, Y.; Yan, D. Effects of dissolved oxygen and influent COD/N ratios on nitrogen removal in horizontal subsurface flow constructed wetland. Ecol. Eng. 2012, 46, 107–111. [Google Scholar] [CrossRef]
  28. Ye, J.; Wang, L.; Li, D.; Han, W.; Ye, C. Vertical oxygen distribution trend and oxygen source analysis for vertical-flow constructed wetlands treating domestic wastewater. Ecol. Eng. 2012, 41, 8–12. [Google Scholar] [CrossRef]
  29. Wu, M.Y.; Franz, E.H.; Chen, S. Oxygen Fluxes and Ammonia Removal Efficiencies in Constructed Treatment Wetlands. Water Environ. Res. 2001, 73, 661–666. [Google Scholar] [CrossRef]
  30. Nivala, J.; Hoos, M.B.; Cross, C.; Wallace, S.; Parkin, G. Treatment of landfill leachate using an aerated, horizontal subsurface-flow constructed wetland. Sci. Total Environ. 2007, 380, 19–27. [Google Scholar] [CrossRef]
  31. Wu, H.; Fan, J.; Zhang, J.; Ngo, H.H.; Guo, W.; Hu, Z.; Liang, S. Decentralized domestic wastewater treatment using intermittently aerated vertical flow constructed wetlands: Impact of influent strengths. Bioresour. Technol. 2015, 176, 163–168. [Google Scholar] [CrossRef]
  32. Zhong, F.; Wu, J.; Dai, Y.R.; Xiang, D.F.; Cheng, S.P.; Ji, H.J. Performance evaluation of wastewater treatment using horizontal subsurface flow constructed wetlands optimized by micro-aeration and substrate selection. Water Sci. Technol. 2015, 71, 1317–1324. [Google Scholar] [CrossRef] [PubMed]
  33. Hang, Q.; Wang, H.; Chu, Z.; Ye, B.; Li, C.; Hou, Z. Application of plant carbon source for denitrification by constructed wetland and bioreactor: Review of recent development. Environ. Sci. Pollut. Res. 2016, 23, 8260–8274. [Google Scholar] [CrossRef] [PubMed]
  34. Huang, J.; Reneau, R.B., Jr.; Hagedorn, C. Nitrogen removal in constructed wetlands employed to treat domestic wastewater. Water Res. 2000, 34, 2582–2588. [Google Scholar] [CrossRef]
  35. Xu, D.; Xu, J.; Wu, J.; Muhammad, A. Studies on the phosphorus sorption capacity of substrates used in constructed wetland systems. Chemosphere 2006, 63, 344–352. [Google Scholar] [CrossRef] [PubMed]
  36. Chang, J.; Deng, S.; Jia, W.; Chen, P.; Wang, Y.; Chen, J. Nitrogen Removal Performance and Enzyme Activities of Baffled Subsurface-Flow Constructed Wetlands with Macrophyte Biomass Addition. Water Air Soil Pollut. 2018, 229, 182–192. [Google Scholar] [CrossRef]
  37. Liang, W.; Wu, Z.B.; Cheng, S.P.; Zhou, Q.H.; Hu, H.Y. Roles of substrate microorganisms and urease activities in wastewater purification in a constructed wetland system. Ecol. Eng. 2003, 21, 191–195. [Google Scholar] [CrossRef]
  38. Wu, J.; Feng, Y.; Dai, Y.; Cui, N.; Anderson, B.; Cheng, S. Biological mechanisms associated with triazophos (TAP) removal by horizontal subsurface flow constructed wetlands (HSFCW). Sci. Total Environ. 2016, 553, 13–19. [Google Scholar] [CrossRef]
Figure 1. Schematic diagrams of pilot-scale vertical-flow constructed wetland (VFCW) (a) and horizontal-flow constructed wetland (HFCW) (b) The Phragmites australis was used as the wetland plant. All the thickness units were mm.
Water 12 02007 g001
Figure 2. Dissolved oxygen (DO) distributions in the VFCW (a) and HFCW (b) ecosystems under different influent loads. The results were the averages and their standard deviations.
Water 12 02007 g002
Figure 3. Chemical oxygen demand (COD) removal performances in the VFCW (a) and HFCW (b) ecosystems under different influent loads. The results were the averages and their standard deviations.
Water 12 02007 g003
Figure 4. TN removal performances in the VFCW (a) and HFCW (b) ecosystems under different influent loads. The results were the averages and their standard deviations.
Water 12 02007 g004
Figure 5. NO3−N removal performances in the VFCW (a) and HFCW (b) ecosystems under different influent loads. The results were the averages and their standard deviations.
Water 12 02007 g005
Figure 6. The removal performances of organic nitrogen in the VFCW (a) and HFCW (b) under different influent loads. The results were the averages and their standard deviations.
Water 12 02007 g006
Figure 7. NH4+−N removal performances in the VFCW (a) and HFCW (b) ecosystems under different influent loads. The results were the averages and their standard deviations.
Water 12 02007 g007
Figure 8. Total phosphorus (TP) removal performances in the VFCW (a) and HFCW (b) ecosystems under different influent loads. The results were the averages and their standard deviations.
Water 12 02007 g008
Table 1. Enzymatic activities in different substrate depths at the influent load of 200 L/day (units: U/g-substrate, mean ± SD, n = 10).
EnzymesVFCWHFCW
Upper LayerMiddle LayerLower LayerUpper LayerMiddle LayerLower Layer
Protease37.61 ± 5.1321.55 ± 3.6216.97 ± 3.5829.82 ± 5.6119.34 ± 4.1117.45 ± 3.23
Urease6.97 ± 0.794.65 ± 0.632.51 ± 0.335.18 ± 0.754.03 ± 0.652.89 ± 0.45
Phosphatase9.88 ± 1.535.03 ± 0.673.17 ± 0.616.37 ± 1.264.72 ± 0.913.39 ± 0.57
DO1.99 ± 0.510.92 ± 0.300.45 ± 0.211.55 ± 0.370.69 ± 0.230.31 ± 0.17

