Article

Comparative Analysis of Drought Indicated by the SPI and SPEI at Various Timescales in Inner Mongolia, China

1
State Key Laboratory of Severe Weather, Chinese Academy of Meteorological Sciences, Beijing 100081, China
2
Collaborative Innovation Centre on Forecast and Evaluation of Meteorological Disasters, Nanjing University of Information Science & Technology, Nanjing 210044, China
3
College of Earth Science, Chengdu University of Technology, Chengdu 610059, China
*
Author to whom correspondence should be addressed.
Water 2020, 12(7), 1925; https://doi.org/10.3390/w12071925
Submission received: 5 June 2020 / Revised: 22 June 2020 / Accepted: 30 June 2020 / Published: 6 July 2020
(This article belongs to the Section Hydrology)

Abstract

:
The global climate is noticeably warming, and drought occurs frequently. Therefore, choosing a suitable index for drought monitoring is particularly important. The standardized precipitation index (SPI) and the standardized precipitation evapotranspiration index (SPEI) are commonly used indicators in drought monitoring. The SPEI takes temperature into account, but the SPI does not. In the context of global warming, what are their differences and applicability in regional drought monitoring? In this study, after calculating the SPI and SPEI at 1-, 3-, 6-, and 12-month timescales at 102 meteorological stations in Inner Mongolia from 1981 to 2018, we compared and analyzed the performances of the SPI and SPEI in drought monitoring from temporal and spatial variations, and the consistency and applicability of the SPI and SPEI were also discussed. The results showed that (1) with increasing timescale, the temporal variations in the SPI and SPEI were increasingly consistent, but there were still slight differences in the fluctuation value and continuity; (2) due to the difference in time series, the drought characteristics identified by the SPI and SPEI were quite different in space at various timescales, and with the increase in timescale, the spatial distributions of the drought trends in Inner Mongolia were basically consistent, except in Alxa; (3) at the shortest timescale, the difference between the SPI and SPEI was the largest, and the drought reflected by the SPI and SPEI may be consistent at long timescales; and (4) compared with typical drought events and vegetation indexes, the SPEI may be more suitable than the SPI for drought monitoring in Inner Mongolia. It should be noted that the adaptability of the SPI and SPEI may be different in different periods and regions, which remains to be analyzed in the future.

1. Introduction

It is undeniable that the global climate is warming, and the accompanying extreme climate events (including high temperatures, rainstorms, and droughts) are becoming increasingly frequent [1,2,3,4]. Drought lasts for a long time and is the most serious meteorological disaster [5]. In recent decades, drought has had a severe impact on the environment and on economies around the world [6,7,8]. Especially in arid and semiarid areas, serious drought even poses a long-term threat to human livelihoods [9,10]. In 2011, the worst drought in nearly 60 years occurred in Eastern Africa, resulting in water and food shortages, and 12.4 million people were affected by the famine, and nearly 30,000 children died in Somalia [11]. However, drought events will noticeably increase in the 21st century [1,12,13,14]. To avoid the occurrence of disasters, improved drought warnings and assessments are urgently needed.
According to its characteristics, there are usually the following types of droughts— meteorological, agricultural, hydrological, and socioeconomic [8,15,16]. Among them, meteorological drought is an extreme climate event, in which the most intuitive cause is the reduction in precipitation, and the other three types of drought have greater human and social aspects. It can be said that meteorological drought leads to the other three types of drought [17,18]. Because of the complexity and severity of drought, it is very challenging to identify and assess drought characteristics [19,20]. Therefore, in recent decades, a large number of drought indexes have been developed to evaluate and monitor drought events [21,22]. These include the standardized precipitation index (SPI) [23], the Palmer drought index (PDSI) [24], the standardized precipitation evapotranspiration index (SPEI) [25], and the composite meteorological drought index (CI) [26]. Among them, both the SPI and SPEI have the characteristics of multiple timescales, which can represent various types of droughts and better reflect the variations in drought characteristics [8]. Therefore, these indexes are widely used throughout the world [27,28]. The theories of the SPI and SPEI are similar, but there are obvious differences between the calculation parameters of the SPI and SPEI. The SPI only considers precipitation, which is easy to calculate, and it has strong adaptability in time and space [29,30], but the SPEI is calculated based on the accumulated difference between precipitation (P) and potential evapotranspiration (PET), which can comprehensively reflect the change in surface water balance [31]. However, the increase in evaporation caused by warming is not negligible for the accurate assessment of drought with the global warming. So the SPEI is notably better than the SPI in drought monitoring [32], but the applicability of the SPEI in arid areas may be limited [33]. In addition, the SPI is still widely used around the world [30,34,35,36,37]. So the difference between the SPI and the SPEI in drought monitoring and their regional applicability with global climate change are still topics worthy of discussion.
Inner Mongolia is located in the Mongolian Plateau. Due to the arid and semiarid natural environment, Inner Mongolia is vulnerable to climate change, and its ecological environment is very fragile [38]. Drought is the most frequent meteorological disaster in Inner Mongolia, and it has the greatest impact on the production of agriculture and animal husbandry [39]. It is important to monitor drought in Inner Mongolia and to grasp the characteristics of drought change over time to scientifically avoid disaster risk. Scholars have performed many related studies on drought evolution in Inner Mongolia by using the SPI or SPEI [17,30,40,41]. However, in the past, to analyze the drought variations in Inner Mongolia, researchers only based the selection of the drought index (SPI or SPEI) on the advantages of the drought index itself or the advantages of the drought index applied in other regions, lacking the comparison of the applicability of the SPI and SPEI. In addition, both the SPI and SPEI have the characteristics of multiple timescale changes. When analyzing the spatial and temporal variations in drought, there were more studies on a single timescale, and the characteristics of multiple timescales in drought monitoring were not sufficiently determined. What are the differences between the SPI and SPEI in describing the characteristics of drought variations in Inner Mongolia? How about their applicability? What are the characteristics of the SPI and SPEI at various timescales? These findings need further analysis.
In this study, after calculating the SPI and SPEI of 102 meteorological stations at 1-, 3-, 6-, and 12-month timescales in Inner Mongolia from 1981 to 2018, we compared and analyzed the performances of the SPI and SPEI in drought monitoring. The main objectives of the study were: (1) to investigate the temporal and spatial differences of drought characteristics identified by the SPI and SPEI at various timescales and (2) to explore the consistency and applicability of the SPI and SPEI in drought monitoring in Inner Mongolia. It is expected that our study will provide a feasible reference and ideas for the comparison and selection of drought indexes in the future.

2. Materials and Methods
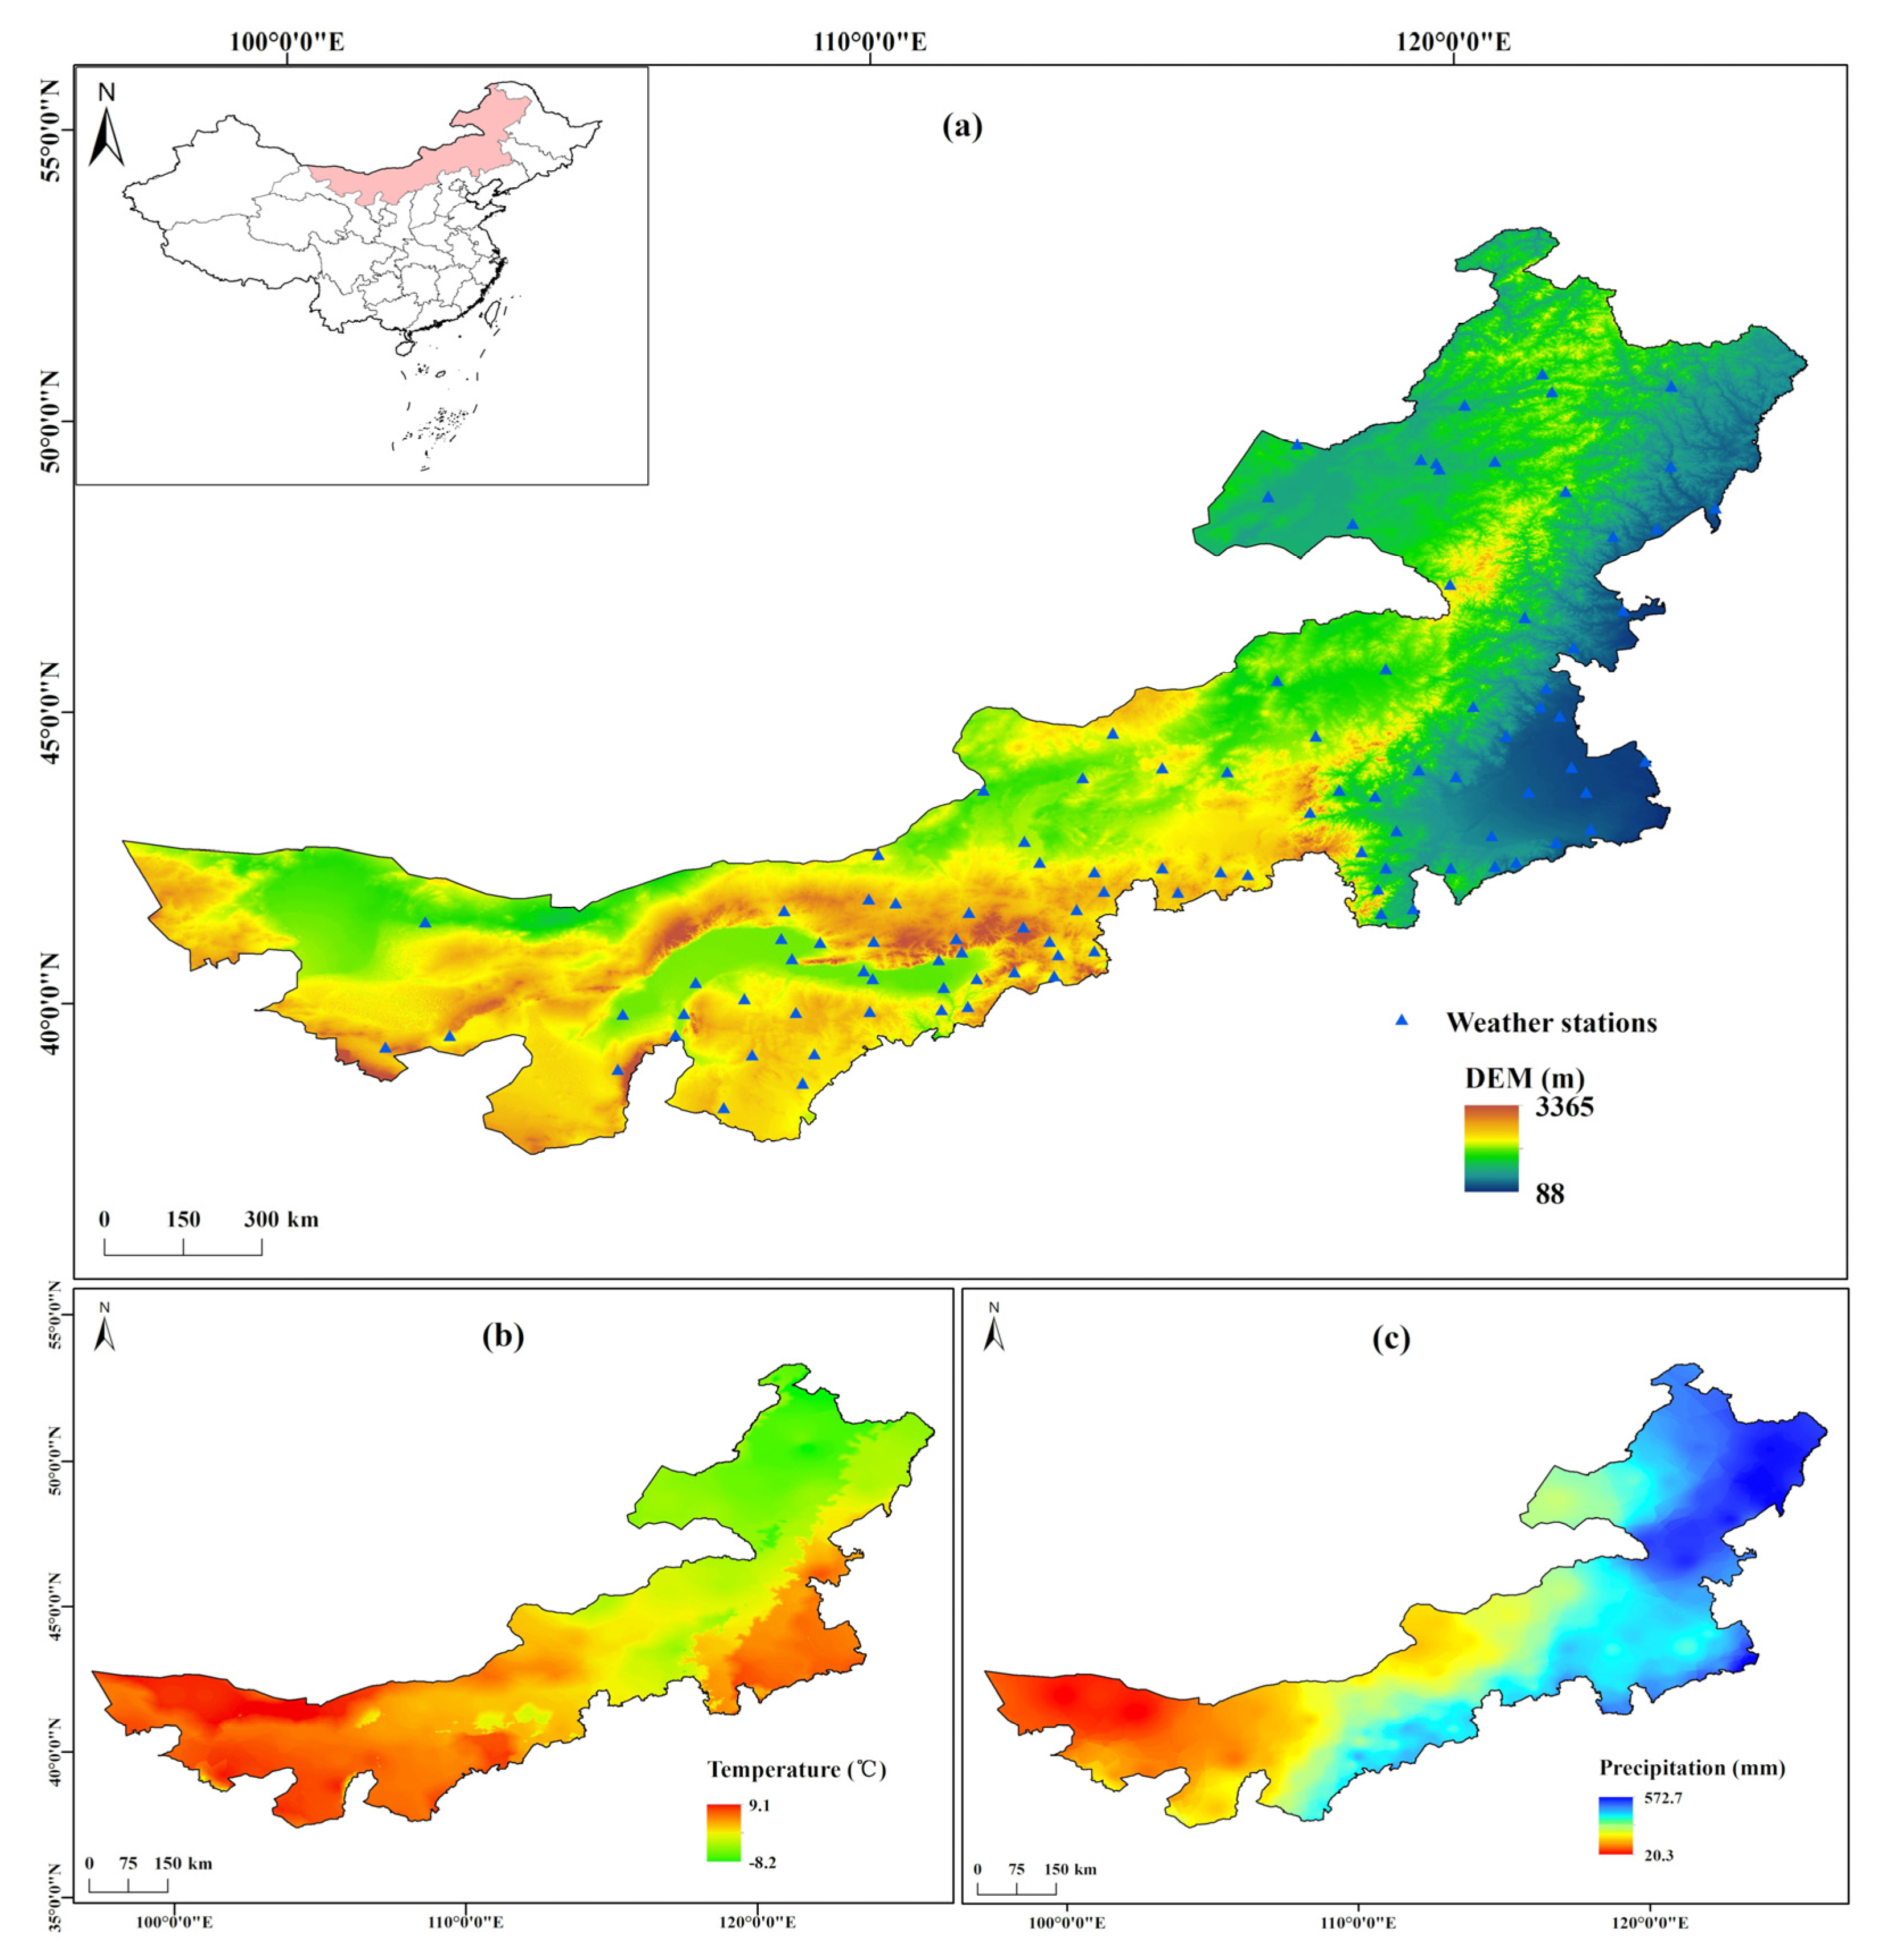
2.1. Study Area

Inner Mongolia Autonomous Region (97°12′ E-126°04′ E, 37°24′ N-53°23′ N) lies in the northern border of China and is part of the Mongolian Plateau. Its terrain is complex and mainly composed of mountains, hills, plateaus, and other geomorphic units, with an average altitude of 1000 m. The terrain of Inner Mongolia gradually inclines from the south to the north and from the west to the east (Figure 1). Inner Mongolia is dominated by a temperate continental monsoon climate; the regional annual precipitation is approximately 20–500 mm, gradually decreasing from east to west, and the temperature gradually increases from east to west. Inner Mongolia has not only typical grassland and farming areas but also a considerable proportion of farming–pastoral ecotone; thus, this area is not only an important base for agricultural and animal husbandry production and grain processing in China but also an ecologically-fragile zone and a barrier zone to control the eastward and southward movement of desertification [42].

2.2. Data Source and Data Processing

To calculate the SPI and SPEI, the monthly meteorological data from 102 meteorological stations (Figure 1) in Inner Mongolia from 1980 to 2018 were obtained. The data included sunshine hours, monthly average wind speed, monthly precipitation, monthly average minimum/maximum/average temperature, monthly average relative humidity, and monthly average pressure. The data quality was strictly controlled, and the missing values were replaced by the average values of the data from the nearby meteorological stations [43]. In addition, to illustrate the applicability of the drought index, the 10 cm soil moisture data of agricultural meteorological stations were also obtained. The data had a time resolution of ten days and were converted into monthly data through averaging calculations. All meteorological observation data were from the China Meteorological Data Network (http://data.cma.cn/).
In the study, the normalized difference vegetation index (NDVI) was also used to analyze the applicability of drought indexes. We obtained the GIMMS NDVI 3 g dataset, which was provided by the Ecological Forecasting Lab of NASA Ames Research Center (http://ecocast.arc.nasa.gov/). The dataset has a time resolution of 15 days, a spatial resolution of 0.0833°, and a coverage period from 1981 to 2015. This dataset is widely used because of its long time series and high quality [44]. To reduce the atmospheric impact, the maximum value composite method (MVC) was used to synthesize the monthly NDVI [44]. In addition, we also calculated the vegetation condition index (VCI) to compare the applicability of drought indexes [45].
The Digital Elevation Model, annual average temperature, annual average precipitation, and other basic data in the study area were provided by the Data Center for Resources and Environmental Sciences, Chinese Academy of Sciences (http://www.resdc.cn/).

2.3. Methods

2.3.1. Calculation of the SPI and SPEI

The SPI was developed by Mc Kee et al. in 1993 [23]. It is one of the indexes that can express the amount of precipitation in a specified time period and recommended by the World Meteorological Organization (WMO) to be used worldwide [35]. The specific calculation method was as follows:
Suppose that the precipitation in a certain period was x , so Γ distribution of probability density function was given by:
f ( x ) = 1 β γ Γ ( γ 0 ) x γ 1 e x / β , x > 0
where β and γ are the scale and shape parameters of Γ distribution function.
The probability that the random variable x is less than x 0 can be calculated for the precipitation x 0 in a certain year:
F ( x < x 0 ) = 0 f ( x ) d x ,
F ( x = 0 ) = m / n ,
where m is the number of samples with precipitation of 0 and n is the total number of samples.
To normal standardized processing of Γ probability distribution, we substituted the result of probability value into the normalized normal distribution function:
F ( x < x 0 ) = 1 2 π 0 e x 2 / 2 d x ,
The solution of the above formula was as follows:
S P I = S t ( c 2 t + c 1 ) + c 0 [ ( d 3 t + d 2 ) t + d 1 ] t + 1 ,
where
t = ln 1 F 2 , c 0 = 2 . 515517 , c 1 = 0.802853 , c 2 = 0.010328 d 1 = 1.432788 , d 2 = 0.189269 , d 3 = 0.001308 ,
where S is the probability density plus or minus coefficient. If F > 0.5 , then S = 1 ; if F 0.5 , then S = 1 .
The SPEI was proposed on the basis of the SPI by Vicente Serrano et al. in 2010 [25]. Based on the principle of water balance, the SPEI uses the difference between precipitation (P) and potential evapotranspiration (PET) as the input condition to evaluate the dry and wet conditions of the area [20]. Vicente-serrano et al. [25] provided a complete description and calculation details of SPEI theory. The climate–water balance was calculated as follows:
D i = P i P E T i ,
where D i is the moisture deficit (mm) at the month i, P i is the precipitation (mm) at the month i, and P E T i is the potential evapotranspiration (mm) at the month i. In this study, the PET was estimated according to the Penman–Monteith method. This method takes into account meteorological factors such as precipitation, temperature, wind speed, air pressure, and relative humidity. Regardless of arid or humid areas, the PET obtained by this method is consistent with the actual reference crop evapotranspiration [39,46].
The D i values were summarized on different time scales:
D n k = i = 0 k = 1 ( P n i P E T n 1 ) , n k ,
where k is the monthly time scale and n is the number of calculations.
A three-parameter log-logistic probability density function was used to fit the established data series, the formula was as follows:
f ( x ) β α ( x γ α ) β 1 [ 1 + ( x γ α ) β ] 2 ,
where α , β , and γ are scale, shape, and origin parameters, respectively.
Thus, the cumulative distribution function of a given time scale was given by:
F ( x ) = [ 1 + ( α x γ ) β ] 1 ,
The SPEI can easily be obtained as the standardized values of F ( x ) , the SPEI is calculated as:
S P E I = w c 0 + c 1 w + c 2 w 2 1 + d 1 w + d 2 w 2 + d 3 w 3
where
w = - 2 ln ( p )
c 0 = 2 . 515517 , c 1 = 0.802853 , c 2 = 0.010328 d 1 = 1.432788 , d 2 = 0.189269 , d 3 = 0.001308 ,
and p is the probability of exceeding a determined D value, p = 1 - F ( x ) . If p > 0.5 , then p is replaced by 1 p and the sign of the resultant SPEI is reversed.
The SPI and SPEI have been widely used around the world. They can be calculated at various timescales, such as 1, 3, 6, 12, and 24 months, which can represent different types of droughts. In drought monitoring, a short timescale (1 month or 3 months) can be used to evaluate meteorological drought; a 3-month or 6-month timescale is usually used for agricultural drought, while a larger time scale, such as 12 or 24 months, is more suitable for describing hydrological drought and water resources [8]. In the study, the SPI and SPEI were computed at 1-, 3-, 6-, and 12-month timescales using the “SPEI” package in R-statistical software.

2.3.2. Calculation of Drought Characteristics

Run theory, which is often used to identify the characteristics of drought, is a method of analyzing time series [31]. Here, run theory was used to analyze the characteristics of drought in Inner Mongolia. According to the type of drought corresponding to the SPI and SPEI values in the literature [30,47], in this study, the truncation level was set to 0; that is, drought was identified when the SPI or SPEI value drops below 0 [48,49].
Drought frequency, drought duration, and drought intensity are usually used to describe drought characteristics. According to the literature [27,31,49], drought frequency refers to the number of droughts in a specific period, which is obtained by the ratio of the number of months of drought occurrence to the total number of months in a specific period. Drought duration is the length of time (such as the number of months) from the beginning to the end of drought. It is the sum of all drought event durations divided by the number of drought events. Drought intensity indicates the severity of drought in the duration of drought, which can be calculated by the accumulated deficit with the SPI or SPEI values continuously lower than 0. Here, we calculated the drought characteristics of Inner Mongolia according to the above methods, and the higher the value of the drought characteristics, the more serious the drought was in this area.

2.3.3. Mann–Kendall Analysis

The Mann–Kendall (M–K) method is a kind of nonparametric statistical test method [43,50] and is recommended by the WMO to analyze meteorological and hydrological variables [50,51,52]. The analysis process is as follows: original hypothesis H 0 : time series data ( x 1 , x 2 , , x n ) are n independent samples with the same distribution of random variables; alternative hypothesis H 1 is a bilateral test. For all i , j n and i j , the distribution of x i and x j is different. The statistical variable S of the test is calculated as follows [53,54]:
S = i = 1 n 1 j = i + 1 n sgn ( x j x i ) ,
sgn ( x j x i ) = { 1 0 1 ( x j x i ) > 0 ( x j x i ) = 0 ( x j x i ) < 0 ,
where S is a normal distribution with a mean value of 0 and a variance of
V a r ( S ) = n ( n 1 ) ( 2 n + 5 ) 18 ,
When n 10 , the standard normal test statistic Z of S is calculated by the following formula:
Z = { S 1 V a r ( S ) S > 0 0 S = 0 S + 1 V a r ( S ) S < 0 ,
In the two-sided trend test, on the basis of the given confidence level α , if | Z | Z ( 1 α / 2 ) , then reject the original hypothesis H 0 ; that is, there is a significant upward or downward trend in the time series data at the confidence level α . A positive value for Z indicates an upward trend, and vice versa.
When the Mann–Kendall test is further used to test the sequence mutation, a rank sequence is constructed:
S k = i = 1 k r i ( k = 1 , 2 , , n ) ,
where r i = { 1 , x i > x j 0 , x i < x j 1 j i
If the time series is random and independent, the statistic U F k is defined:
U F k = [ S k E ( S k ) ] V a r ( S k ) ,
where E ( S k ) and V a r ( S k ) are the mean value and variance, respectively, which are calculated as follows:
E ( S k ) = k ( k 1 ) 4 , V a r ( S k ) = k ( k 1 ) ( 2 k + 5 ) 72 ( 1 k n ) ,
U F k is the standard normal distribution, given the significance level α; if | U F k | > U F α / 2 , it indicates that there is a significant trend change in the sequence. If U F k > 0 , it indicates that the sequence shows an upward trend, and vice versa. When UFk exceeds the critical straight line, it indicates that the upward or downward trend is significant. Arrange the original time series in reverse order, repeat the above process, make U B k = U F k ( k = n + 1 k , k = 1 , 2 , , n ) , and draw the curves of the two. When the intersection of the two curves is within the critical line, it can be considered that the sequence has a mutation, and the corresponding time of the intersection is the start time of the mutation [55].

2.3.4. Other Methods

In the study, the inverse distance weighted interpolation method (IDW) was used for the spatial interpolation of the drought characteristics in Inner Mongolia [56]. The changes in the SPI and SPEI were analyzed by the slope trend analysis method [57], and the lower the value of the trend, the drier it was. The Pearson correlation coefficient (R) was calculated to study the relationships among the drought indexes (the SPI and SPEI), vegetation indexes (the NDVI and VCI), and soil moisture [20,58].

3. Results

3.1. Temporal Variations in the SPI and SPEI

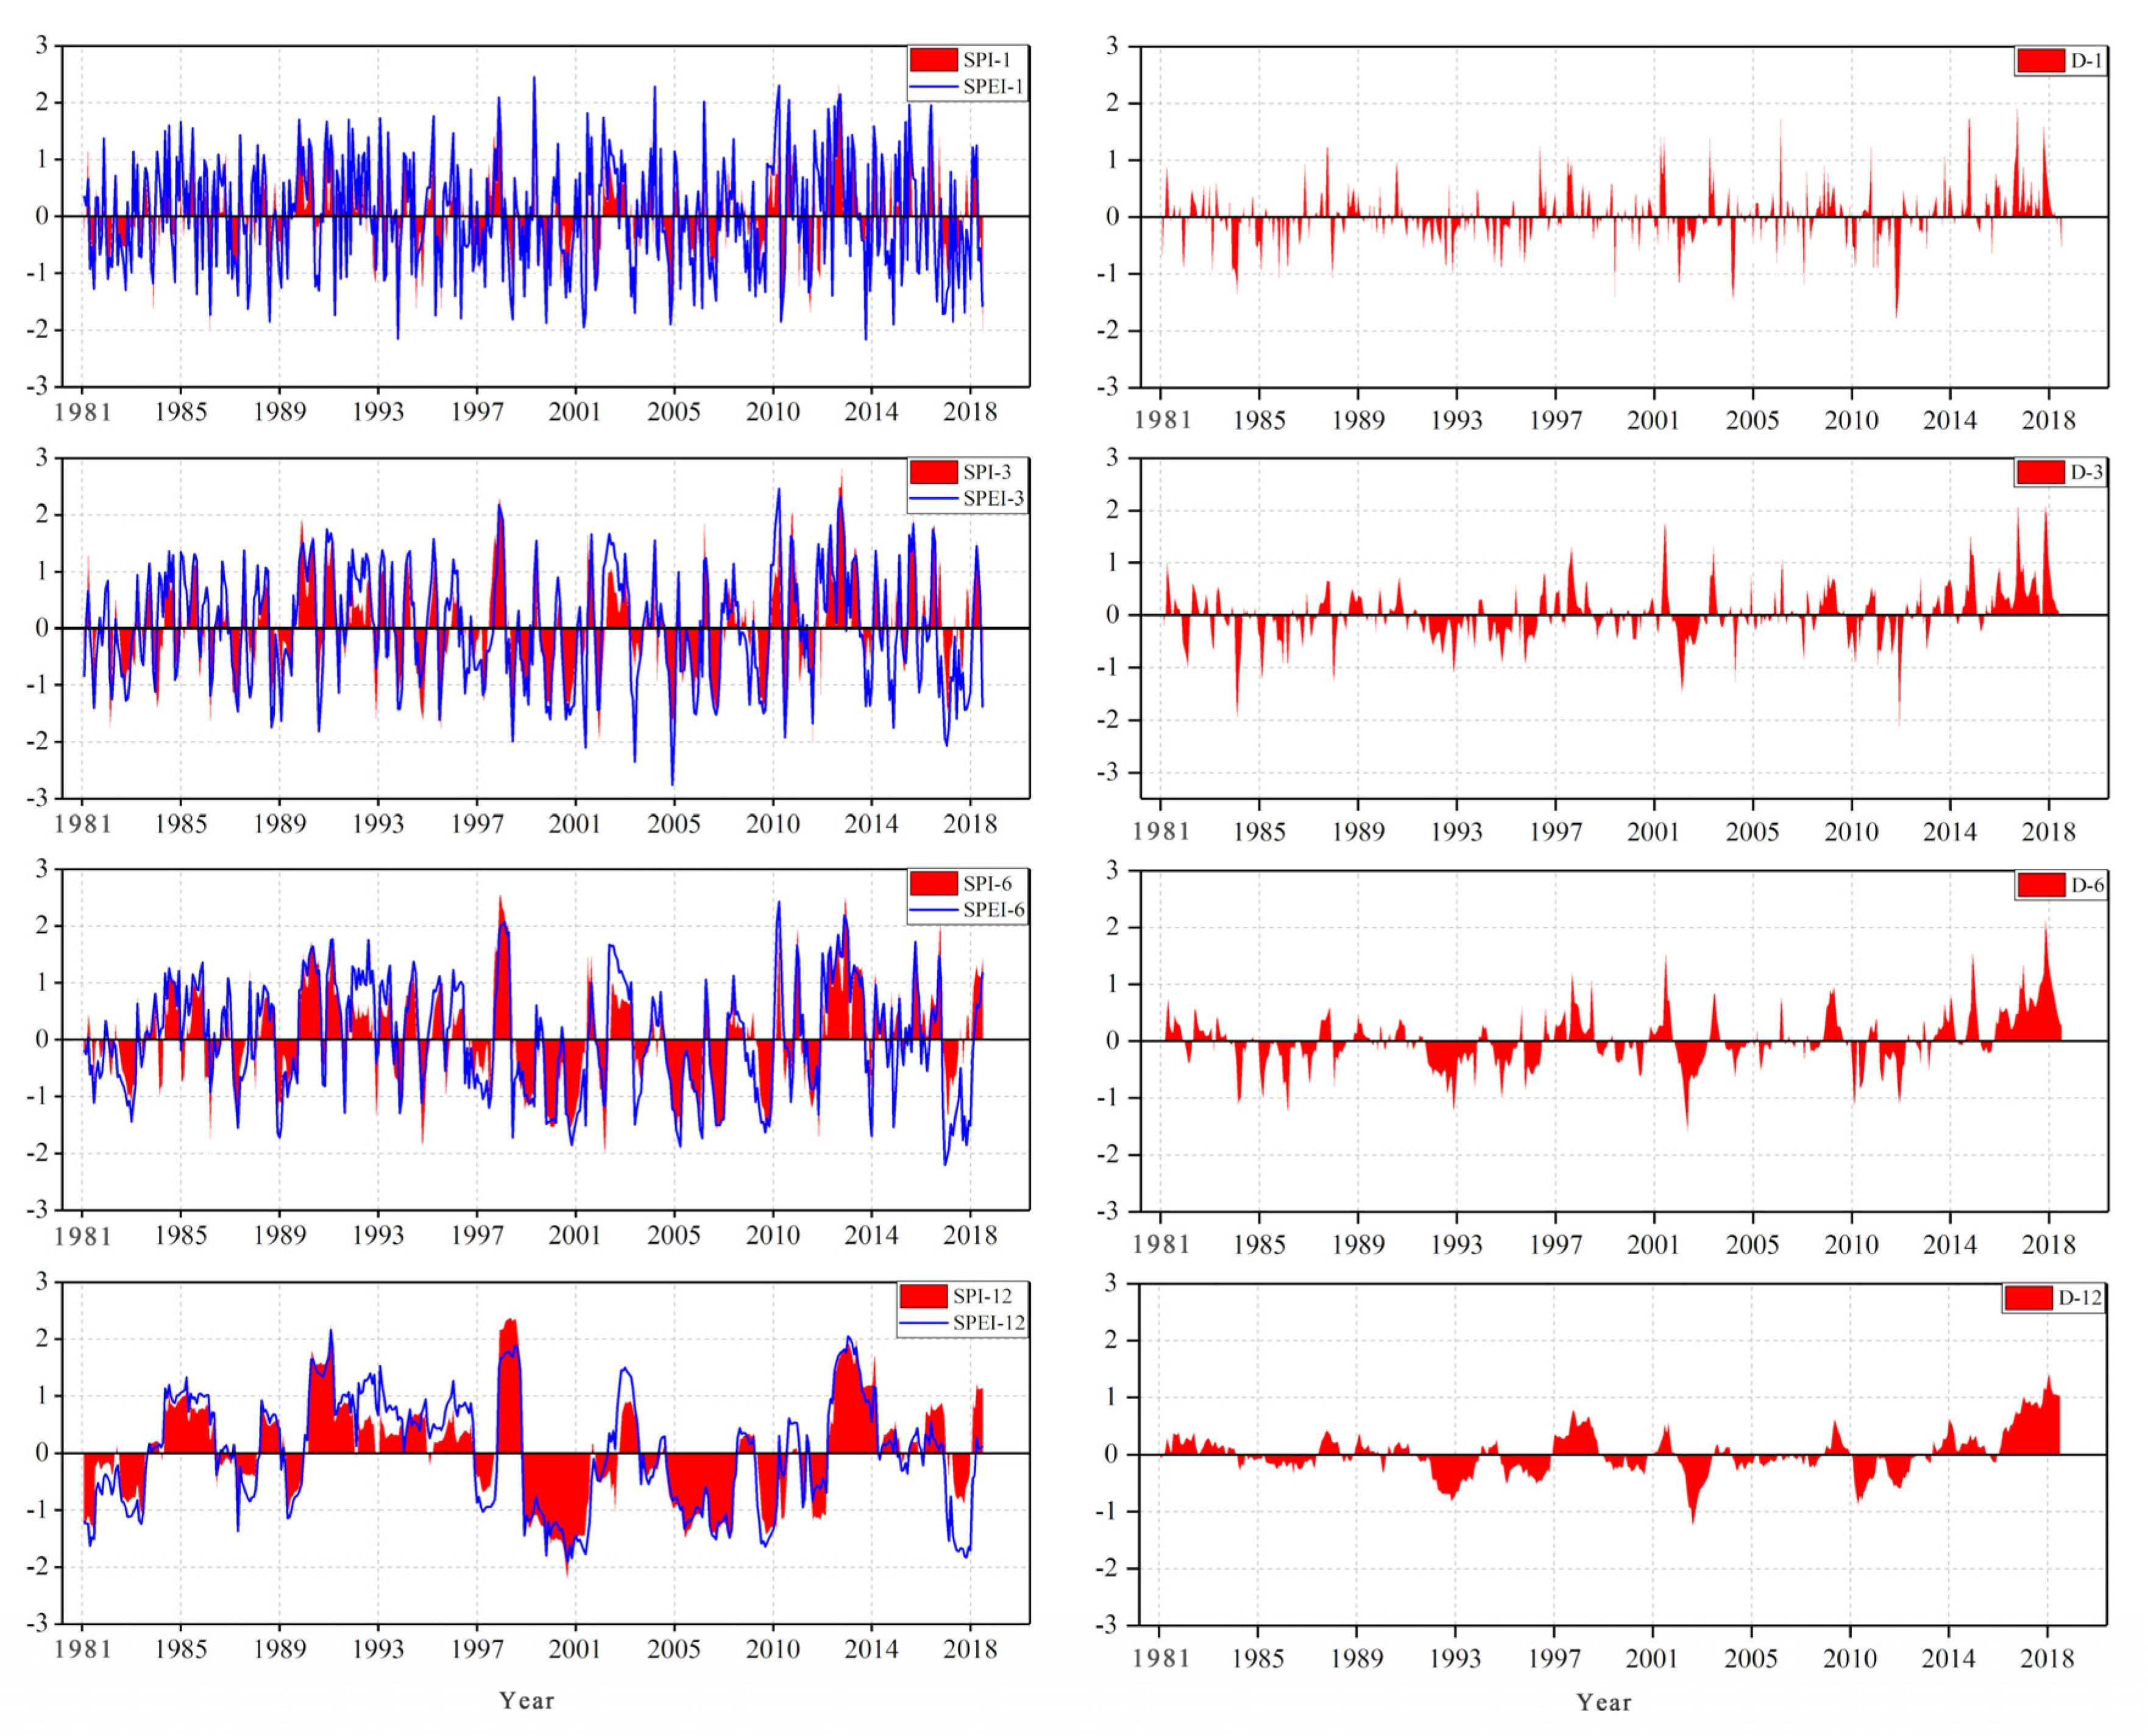
3.1.1. Temporal Evolution of the SPI and SPEI

After entering the 21st century, the frequency and intensity of drought in Inner Mongolia have increased, and the longer the timescale was, the more obvious the drought trend (Figure 2). Due to the impact of short-term climate change, both the SPI and SPEI fluctuated frequently around the value of 0, with a large range, which can clearly reflect the subtle change in water profit and loss at 1-month and 3-month timescales. And with the increase in timescales, the variations in the SPI and SPEI tended to be gentle, the volatility decreased, and the characteristics of interannual and interdecadal changes were obvious, which can reflect the long-term change characteristics of drought. In other words, the variations of the SPI and SPEI were similar at various timescales, but there were still slight differences in the fluctuation value and continuity, that is, they showed different drought frequencies and intensities. The difference decreased with increasing timescale. In addition, it can also be seen that the difference between the SPI and SPEI was increasing in recent years.

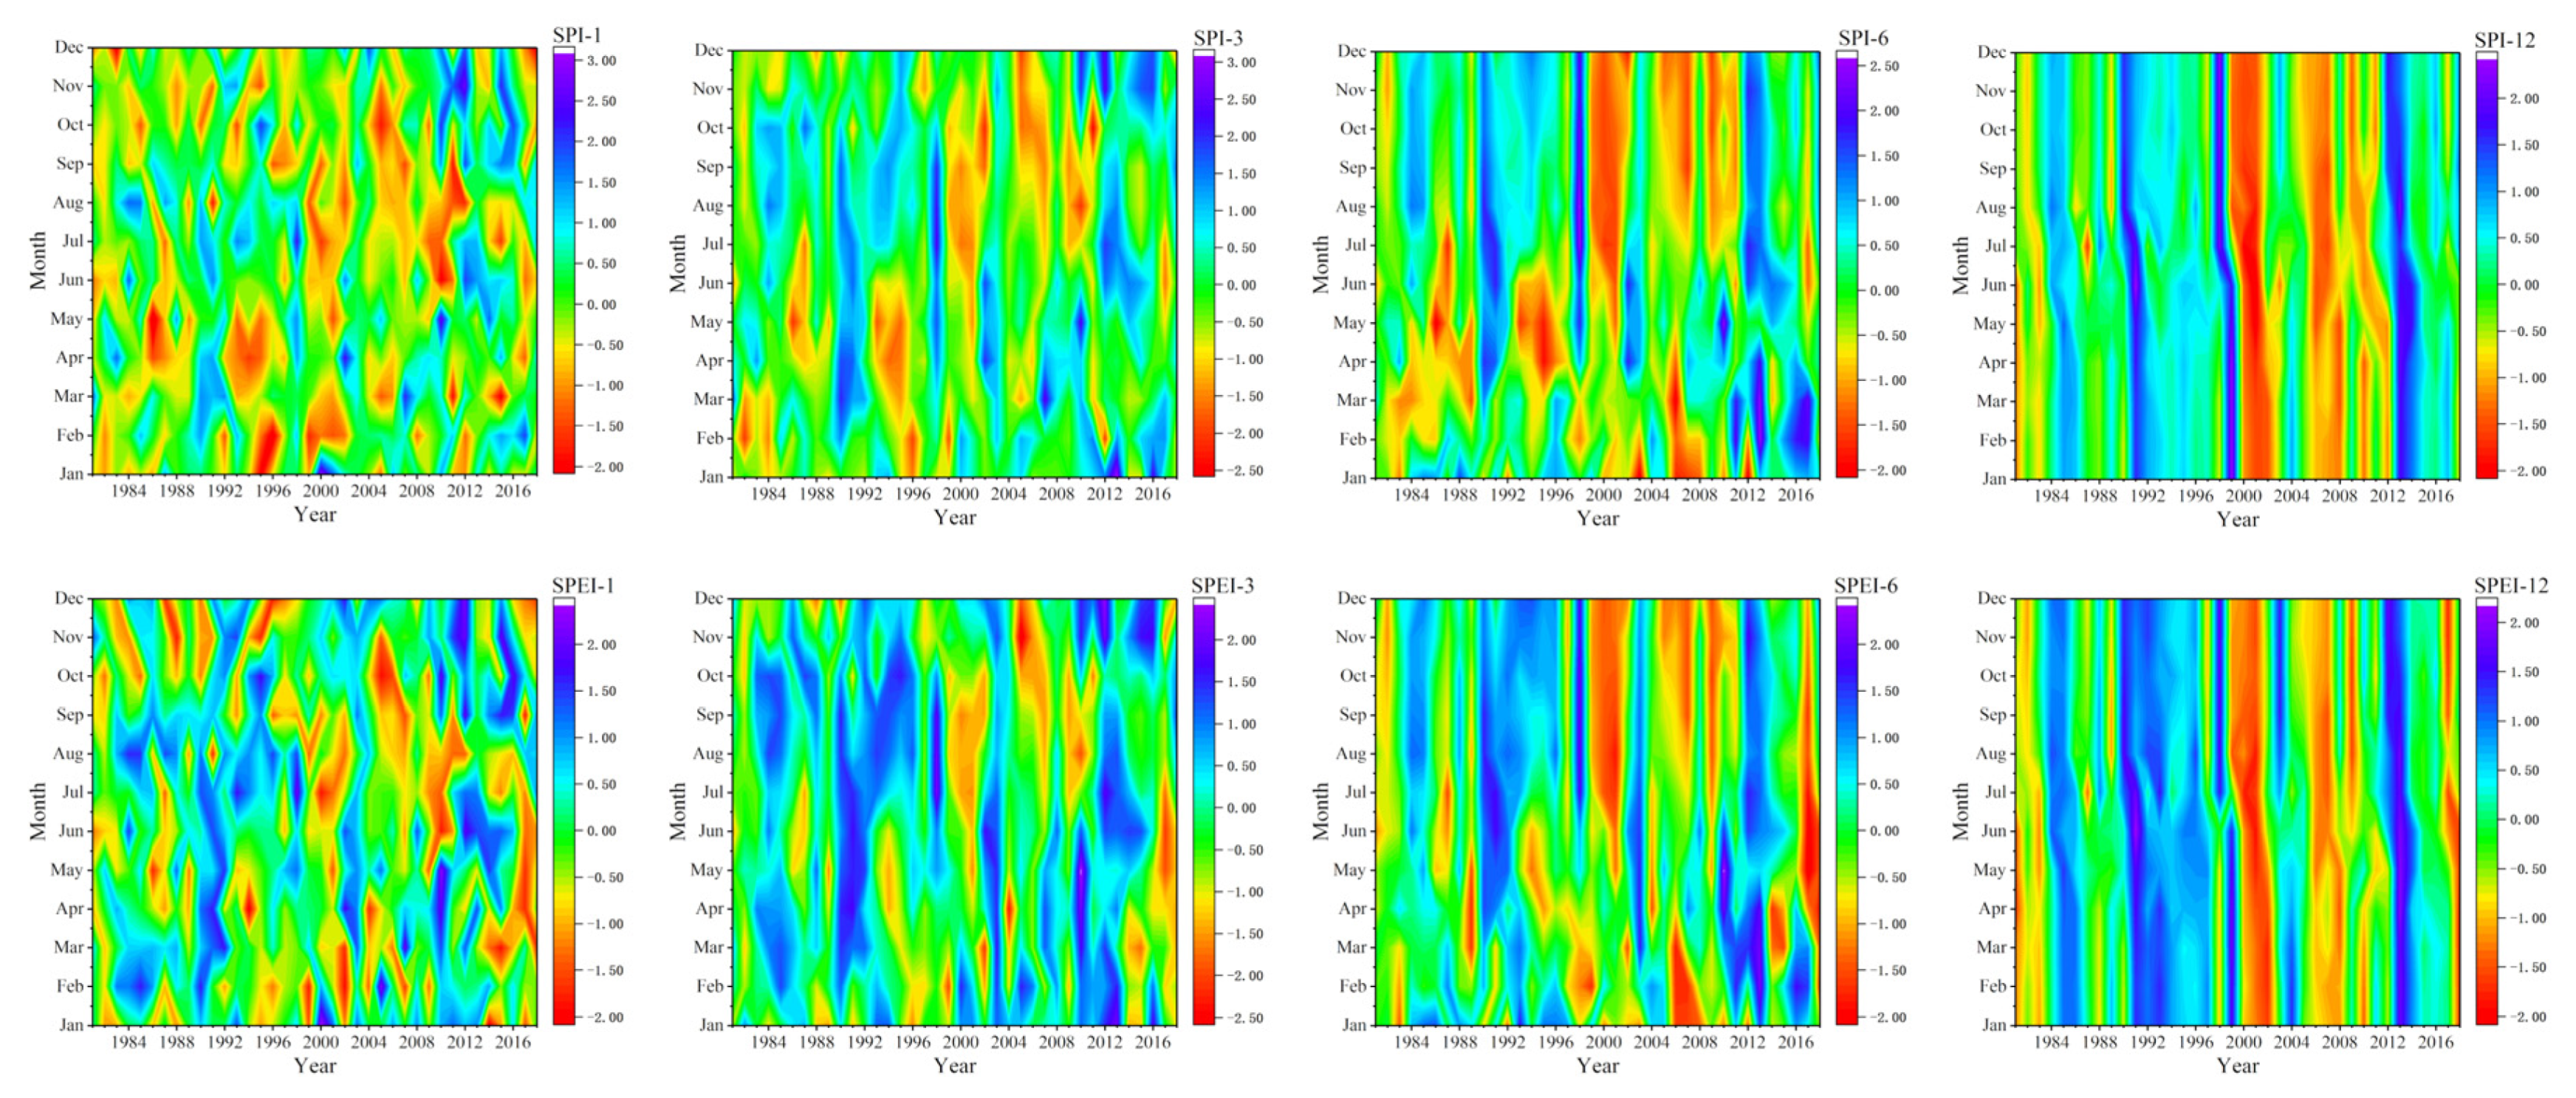
3.1.2. Monthly Variations in the SPI and SPEI

The monthly variation characteristics of the SPI and SPEI were noticeable at various timescales, which clearly reflects the change in the dry and wet degree of each month in the study area, especially after 1999, and the dry degree of some months increased obviously (Figure 3). However, the drought reflected by the SPI and SPEI was slightly different in each month at various timescales, especially at 1-, 3-, and 6-month timescales. The drought reflected by the SPI was more frequent in March to June before 1999, while the drought reflected by the SPEI was less frequent at 1-, 3-, and 6-month timescales. After 1999, the two indexes showed similar dry and wet degrees in each month. It can be said that the SPI and SPEI were basically consistent in reflecting drought periods, but the drought degree reflected by the SPI was more serious than that reflected by the SPEI [35], and with the increase of time series, the drought degree reflected by the SPEI in some months was higher than that reflected by the SPI, which may be due to the factor of increasing temperature.

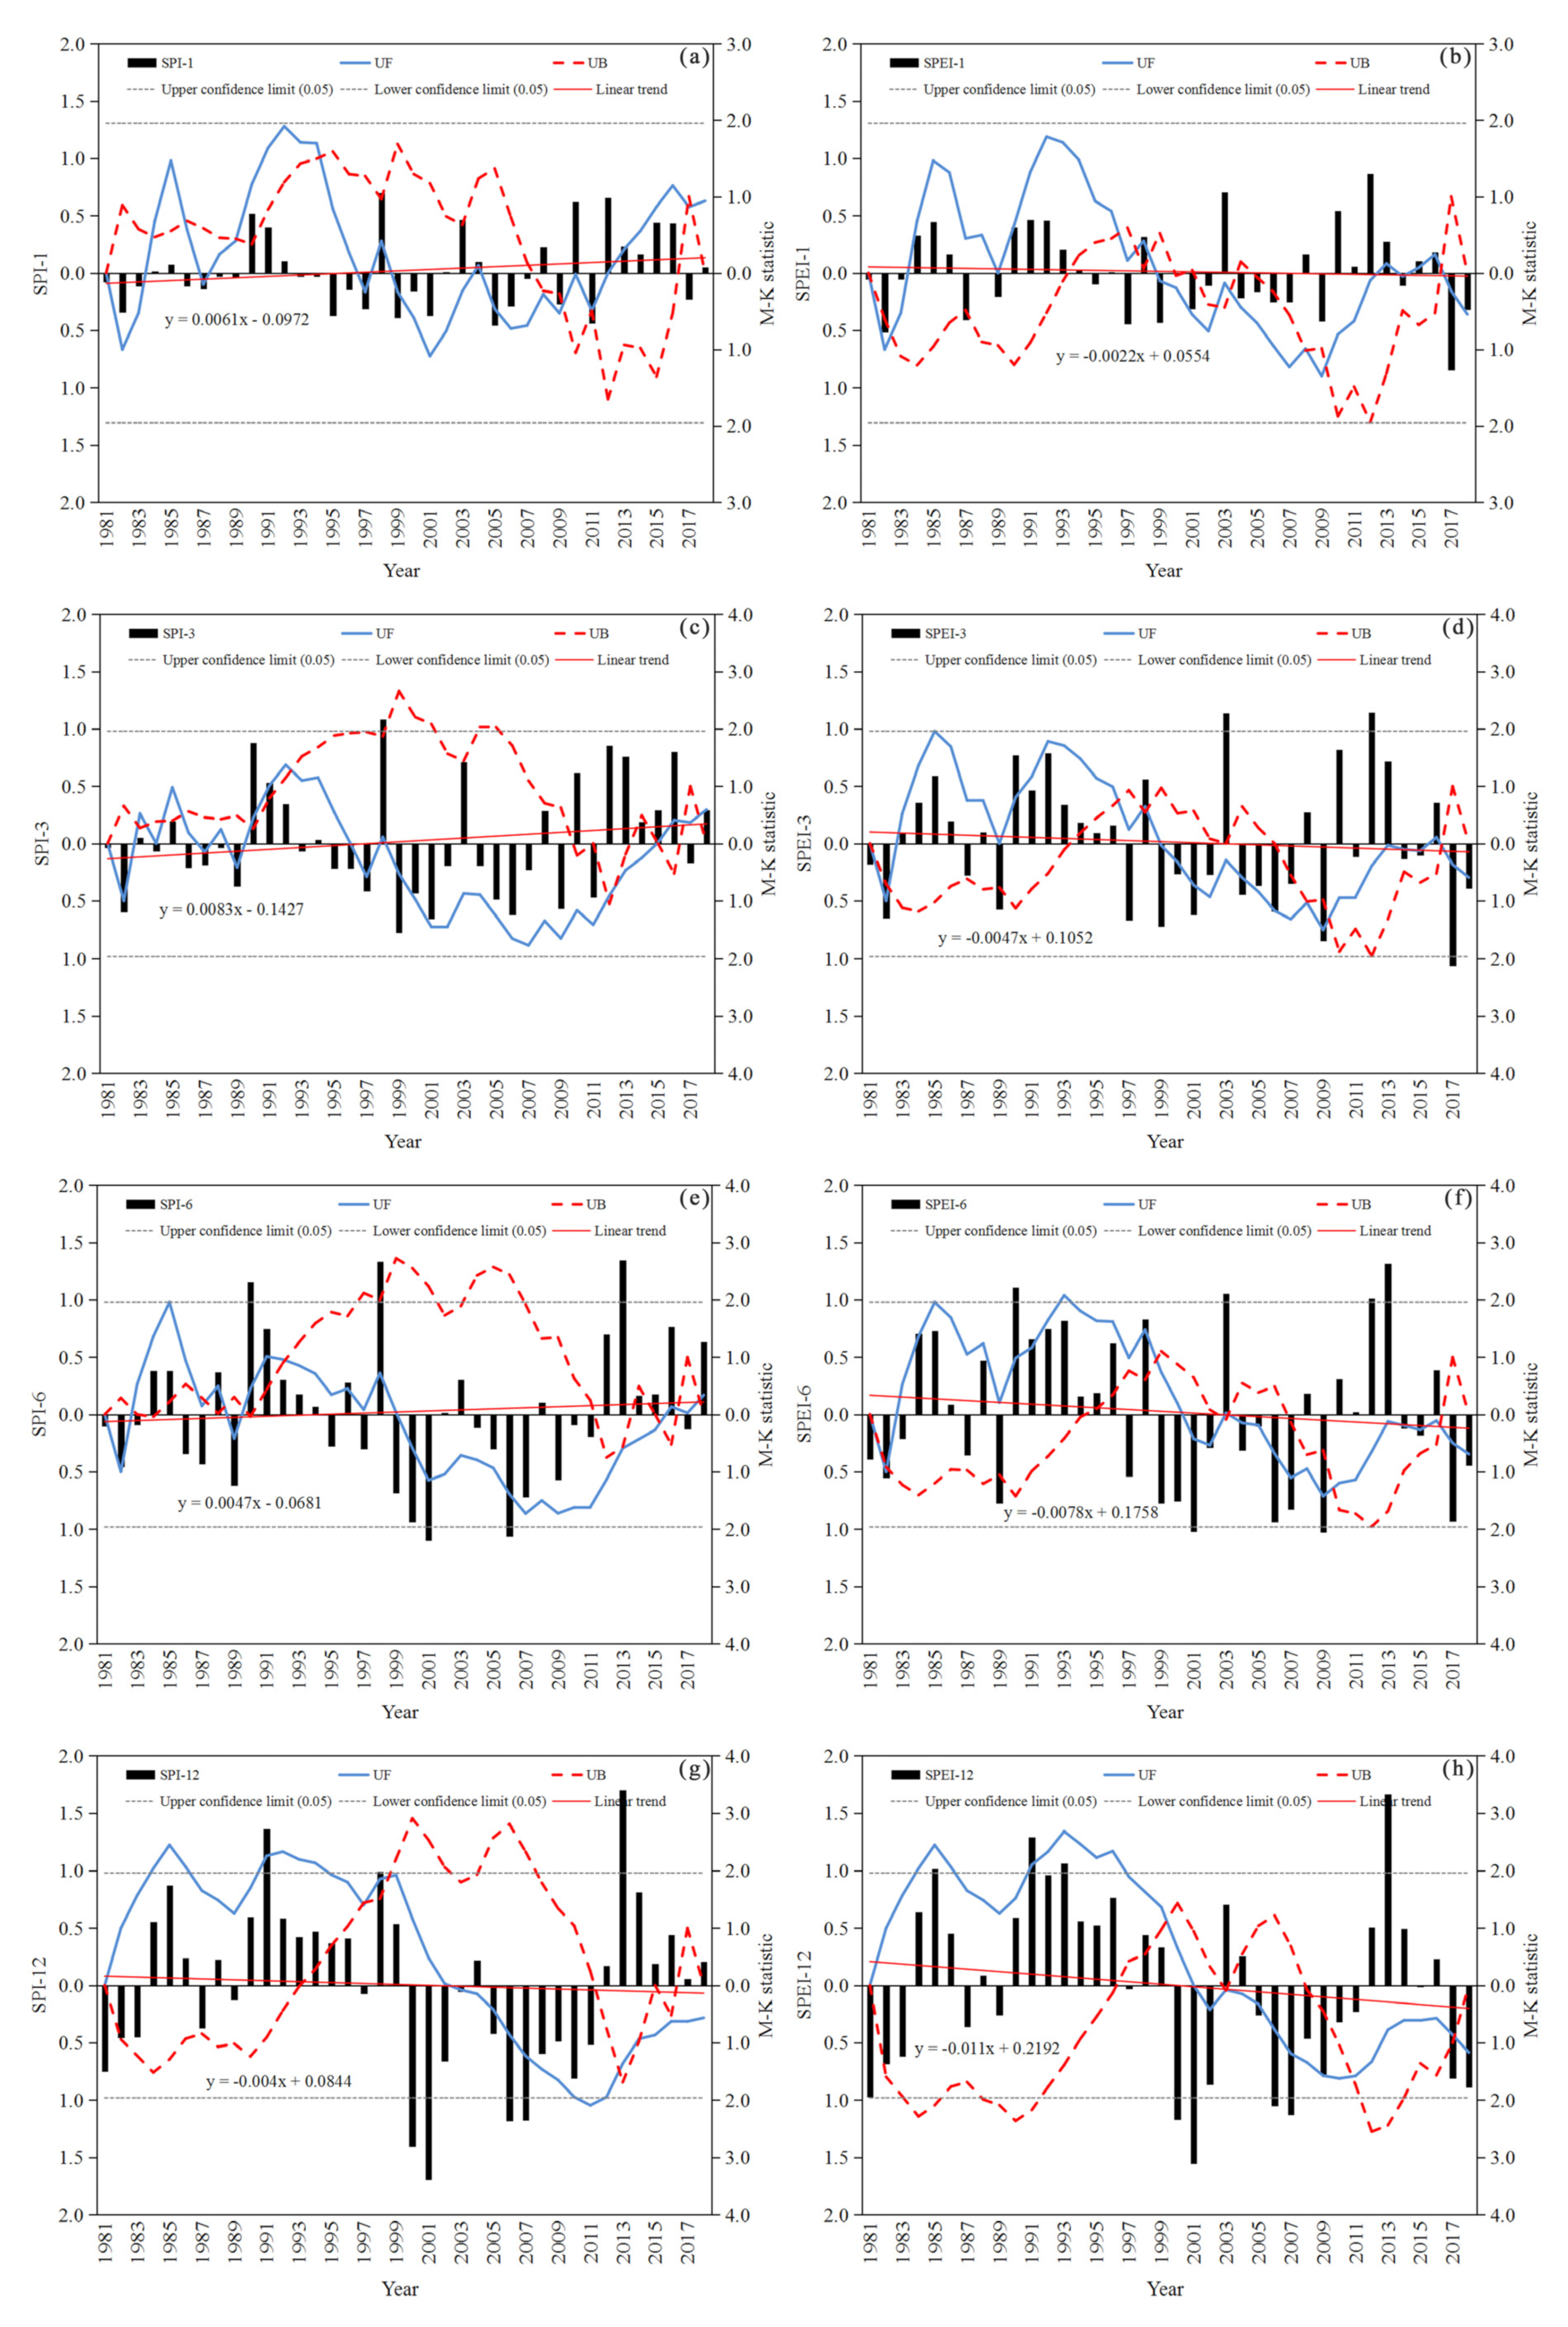
3.1.3. Annual Variations in the SPI and SPEI

Consistent with the above analysis, since the beginning of the 21st century, drought events in Inner Mongolia have increased. The annual variations of the SPI and SPEI were basically consistent at the 1-, 3-, 6-, and 12-month timescales, but after 2017, there was a large difference between them (Figure 4). Using the Mann–Kendall test and linear trend analysis, the annual trends of SPI and SPEI were not significant, so we did mutation detection in time series. From abrupt changes in the SPI and SPEI, the up or down trend of the UF curves of the SPI and SPEI did not exceed the critical value of the significance level at 1-month and 3-month timescales. Although there were some intersections between the UF curve and UB curve, the mutation features were still not obvious. At 6-month timescales, the mutation feature of the SPI was still not obvious, but there was an obvious mutation point in the SPEI in 1999. At 12-month timescales, the up or down trend of the UF curves of the SPI and SPEI exceeded the critical value of the significance level, and there was a significant mutation point in 1999. It can be seen that with the increase in timescale, the variations of the SPI and SPEI were increasingly consistent.

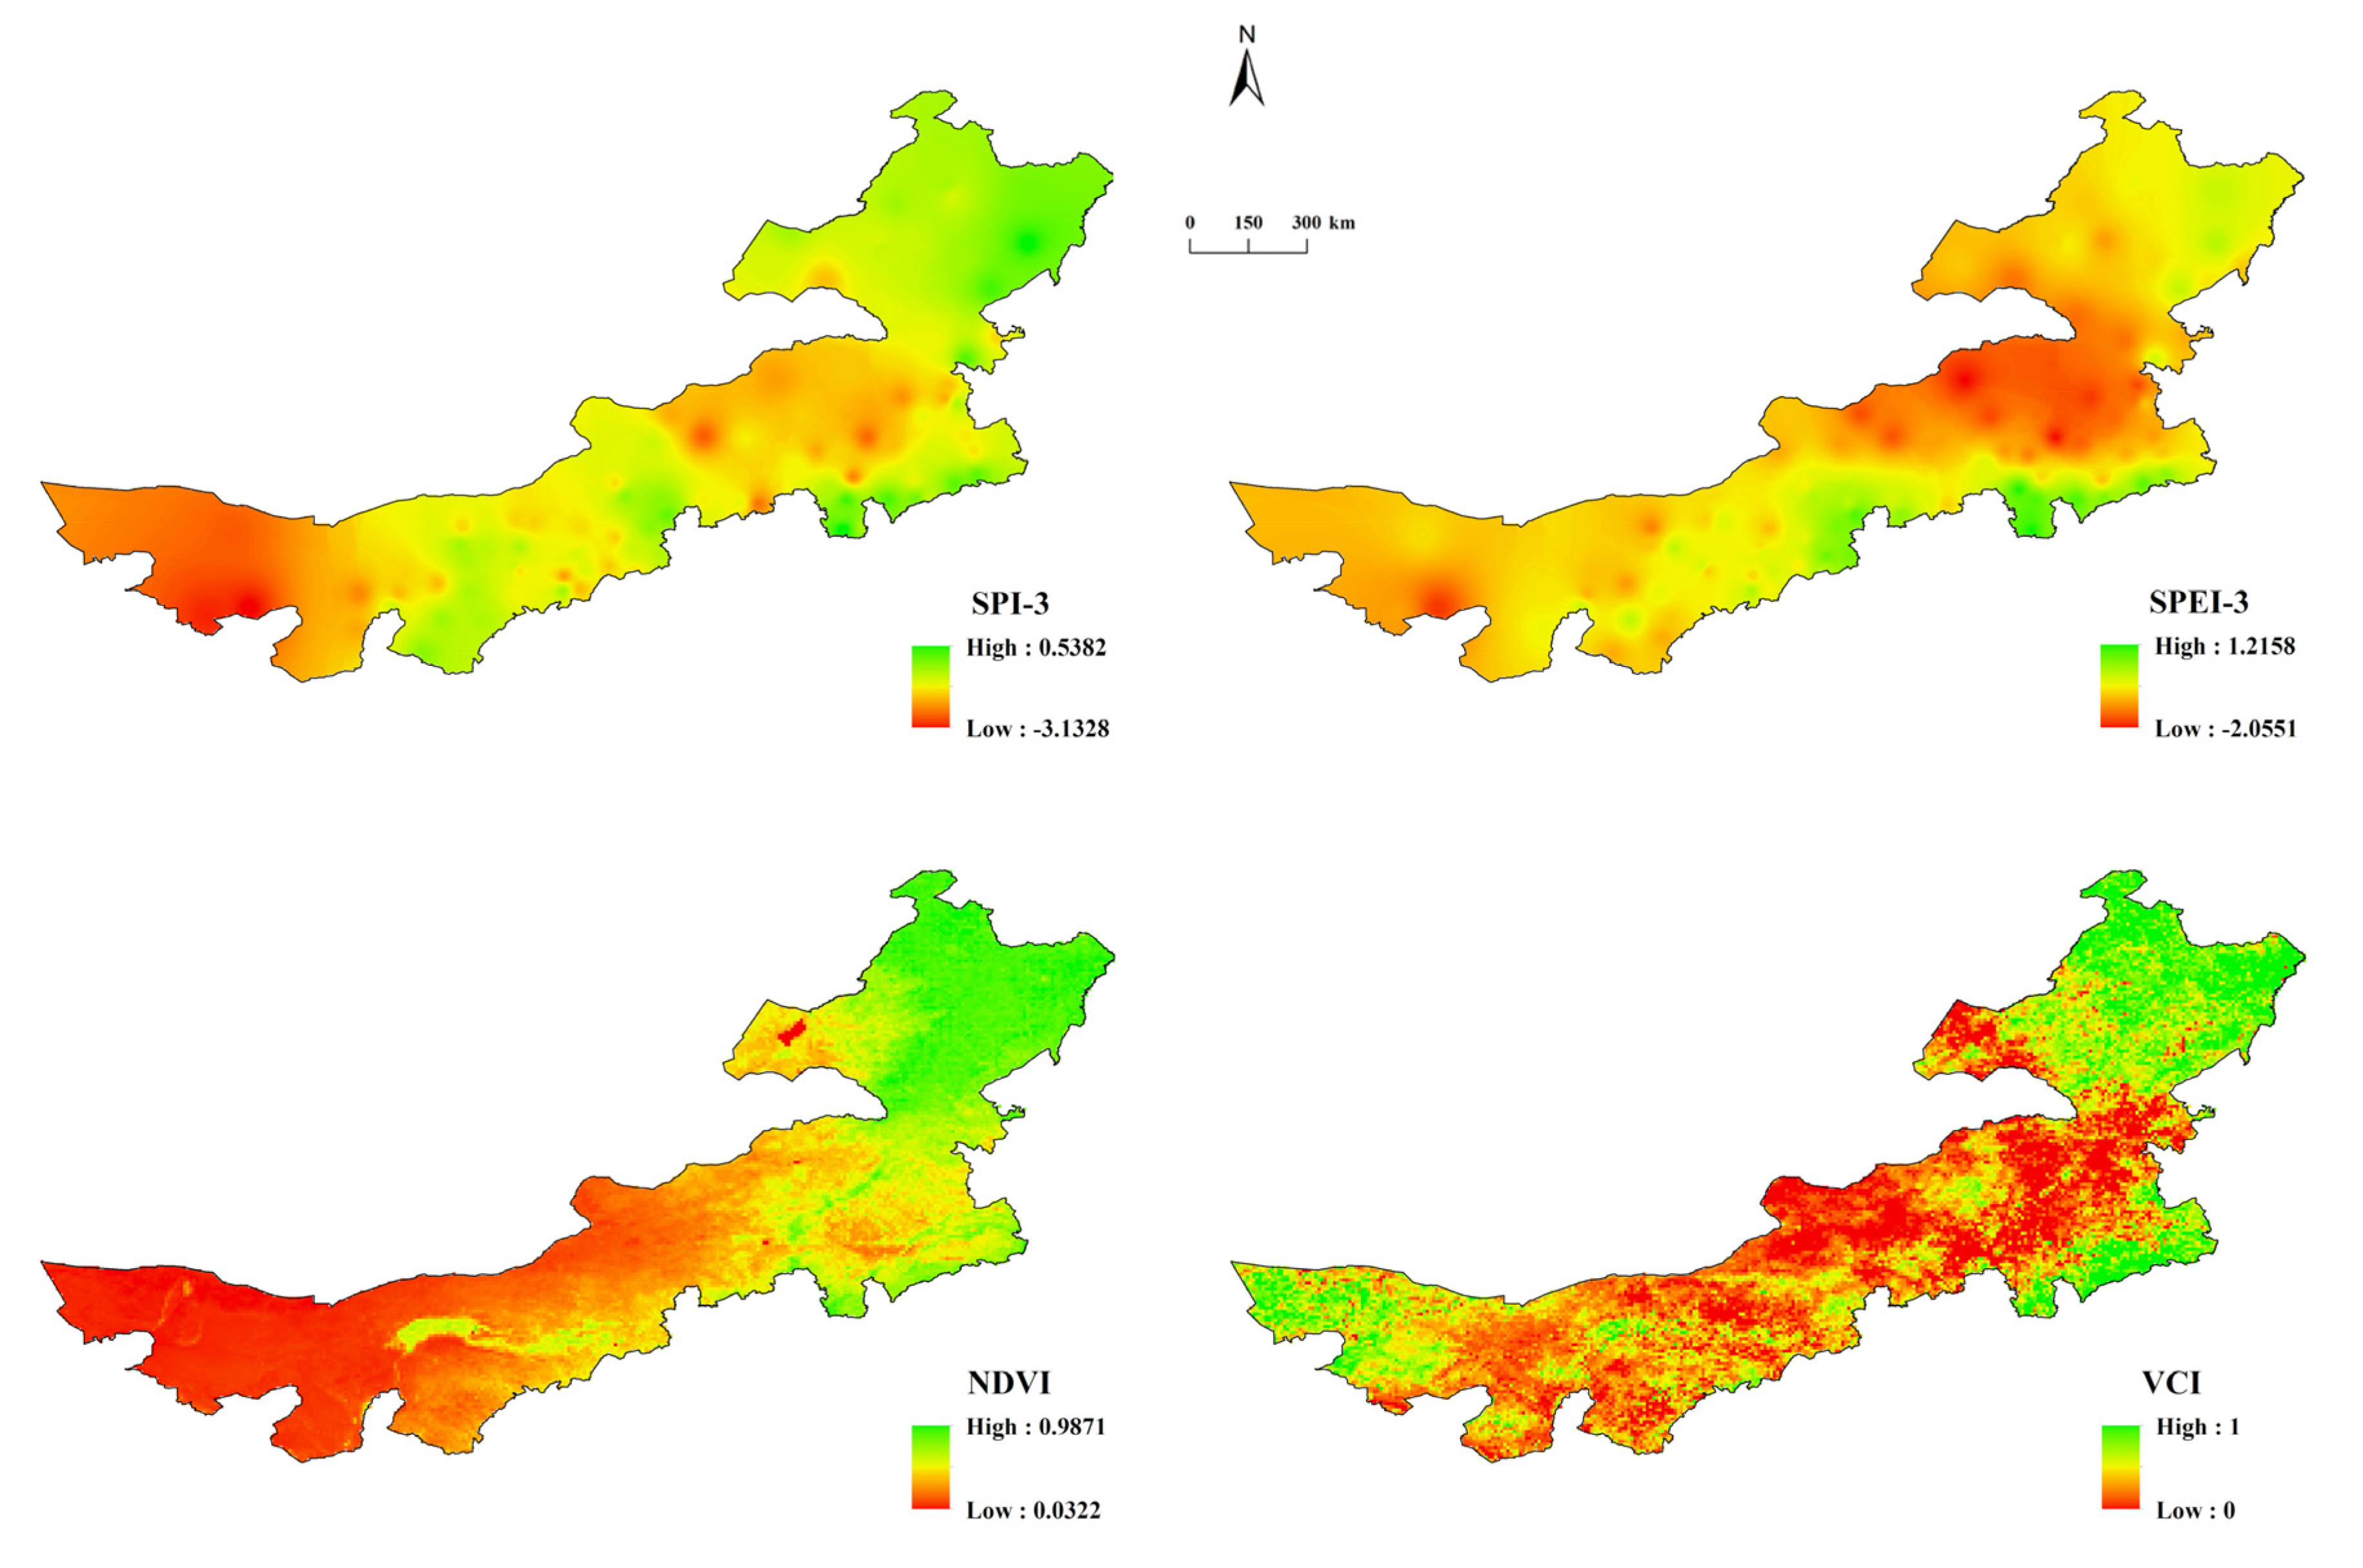
3.2. Spatial Variations in the SPI and SPEI

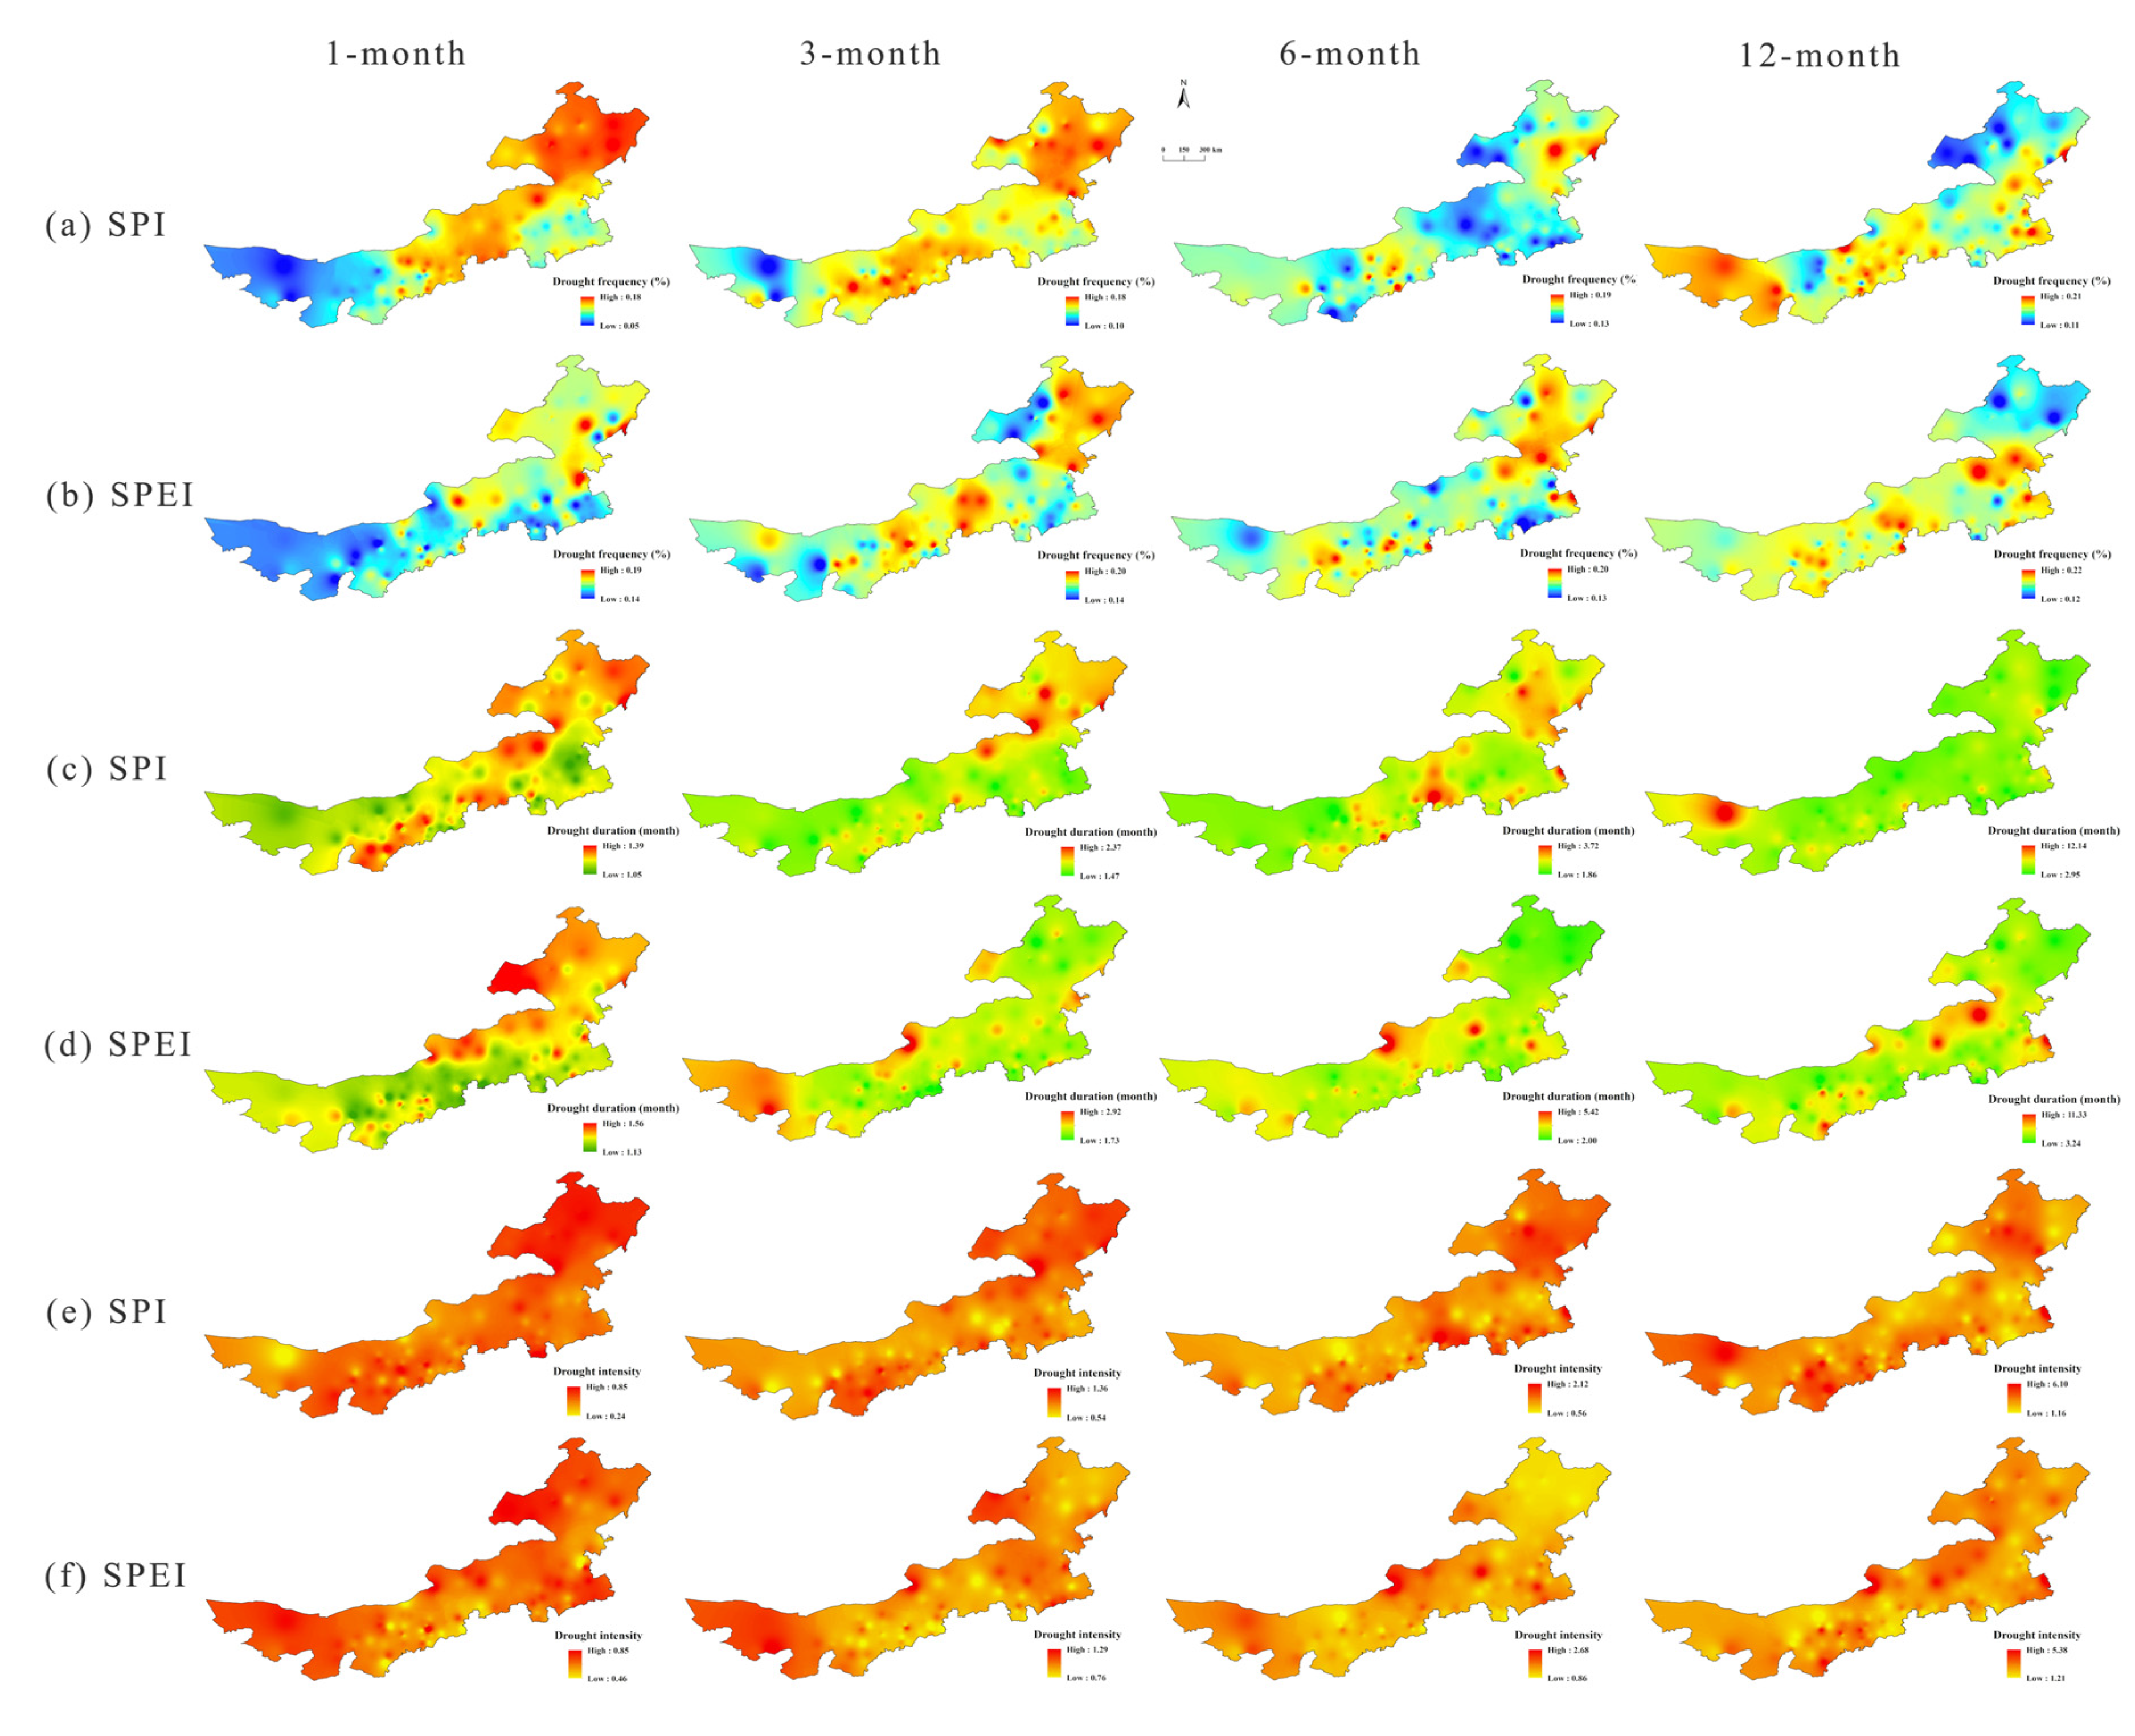
3.2.1. Spatial Distribution of Drought Characteristics

From the analysis of the above time series changes, we can see that there were differences in the drought characteristics reflected by the SPI and SPEI in Inner Mongolia. Here, we analyzed the drought characteristics (drought frequency, drought duration, and drought intensity) of the SPI and SPEI at various timescales from the perspective of spatial distribution (Figure 5). For drought frequency, the SPI and SPEI showed different values of drought frequency at different timescales, but the distribution of drought frequency was slightly similar. At 1-month timescale, the high value of drought frequency was mainly distributed in Hulunbeier and Xilinguole Leagues. The distribution area of high drought frequency values was expanded at 3-month timescale, and it was mainly distributed in central and northeastern Inner Mongolia. At 6-month timescale, the high value of drought frequency was mainly distributed in northeastern Inner Mongolia, and there were some high values of drought frequency in the western region of Inner Mongolia, but the range was not large. Except for the Alxa region, the distribution area of high values of drought frequency was similar at 12-month timescale, mainly distributed near Xingan and Ulanchab Leagues. We can see that except for 6-month timescale, the distribution area of the high drought frequency in the SPI was more than that of the SPEI at the other timescales. For drought duration, at 1-month timescale, the distribution areas of drought duration of the SPI and SPEI were slightly similar, mainly distributed in northeastern and northern Inner Mongolia, and at the other three timescales, the distribution areas of drought duration were obviously different. For drought intensity, there were differences in the distribution of drought intensity reflected by the SPI and SPEI at all timescales. It is worth noting that with the increase in timescale, the area with high drought intensity has not expanded, so it can be said that this region was mainly affected by short-term drought. In summary, due to the differences in the value of the SPI and SPEI in time series, their drought characteristics were quite different in space at different timescales.

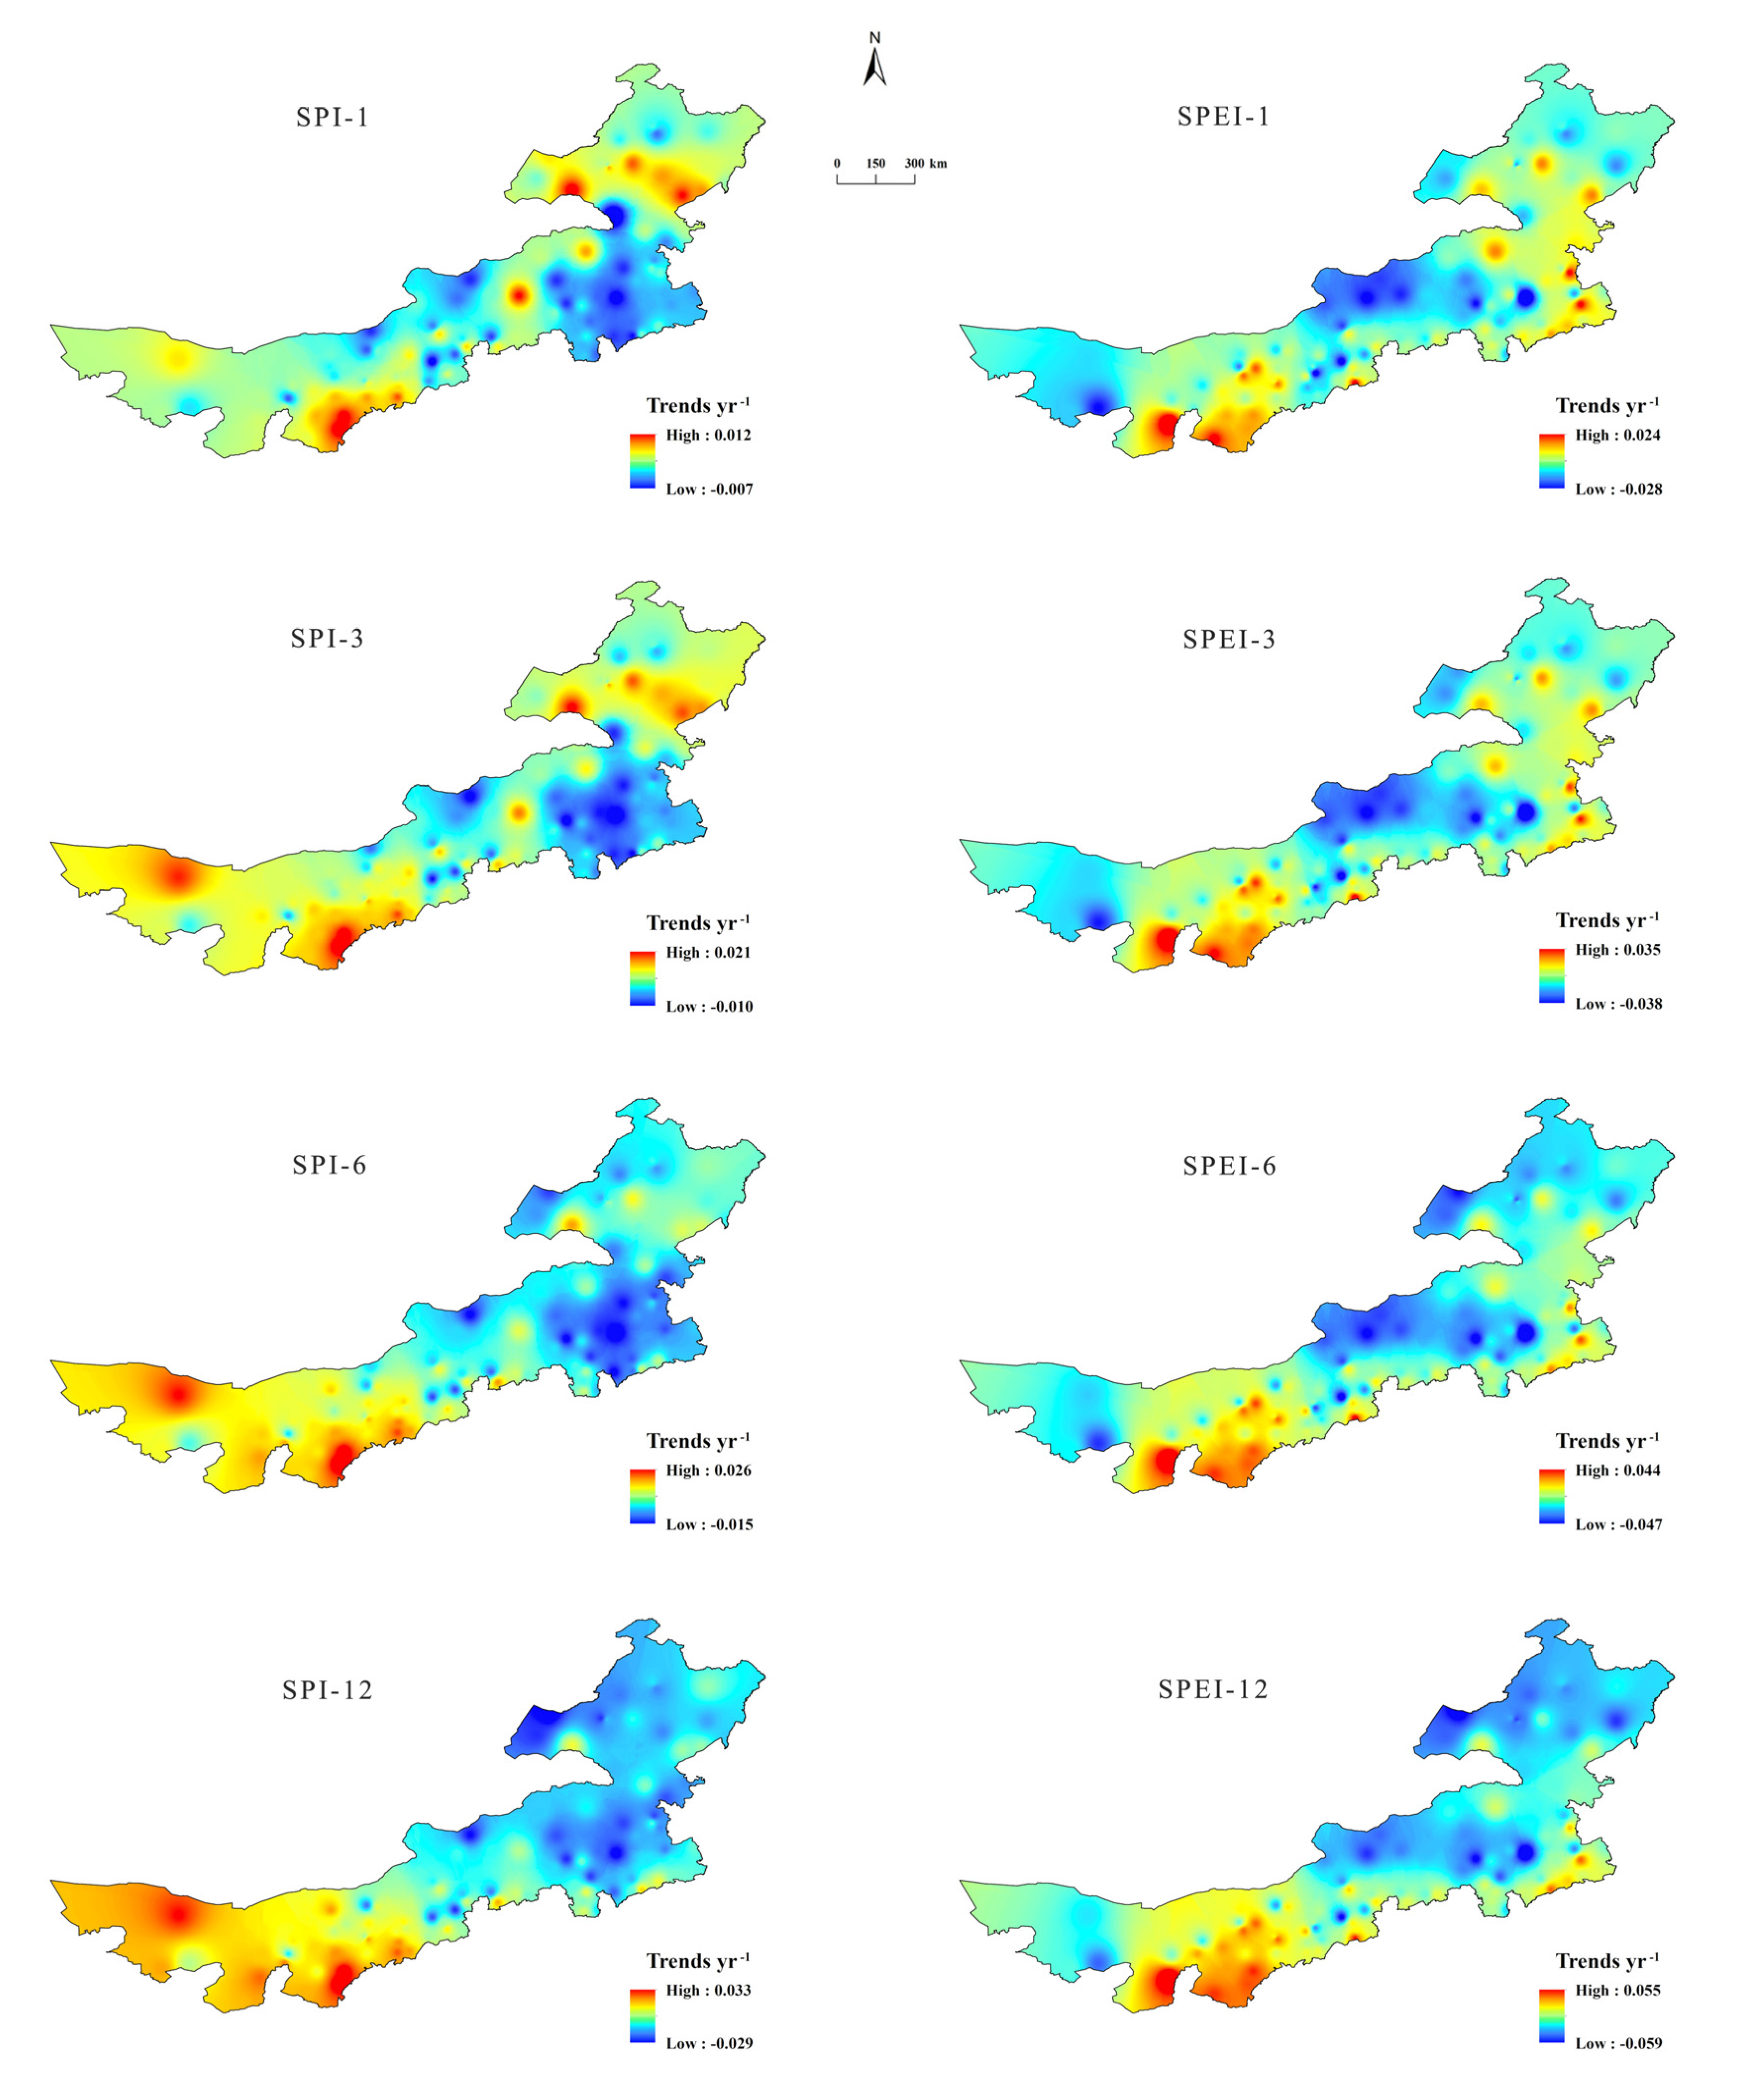
3.2.2. Spatial Distribution of the SPI and SPEI Trends

The spatial distribution of the SPI and SPEI trends at various timescales in Inner Mongolia during 1981–2018 were shown in Figure 6. For the SPI, the eastern and central parts of Inner Mongolia noticeably tended toward drought at 1-month and 3-month timescales, and at the other two timescales, the northeastern, eastern, and central parts of Inner Mongolia noticeably tended toward drought. For the SPEI, at 1-month and 3-month timescales, the drought trends were obvious in the central and Alxa areas of Inner Mongolia, the trend of drought in the northeastern and central areas of Inner Mongolia was obvious at 6-month and 12-month timescales, and the trend of drought in the Alxa area was alleviated at 12-month timescale. With the increase in timescale, the range of drought increases reflected by the SPI and SPEI expanded, mainly concentrated in the central and eastern parts of Inner Mongolia. It can be said that as a whole, the drought in Inner Mongolia increased from west to east.

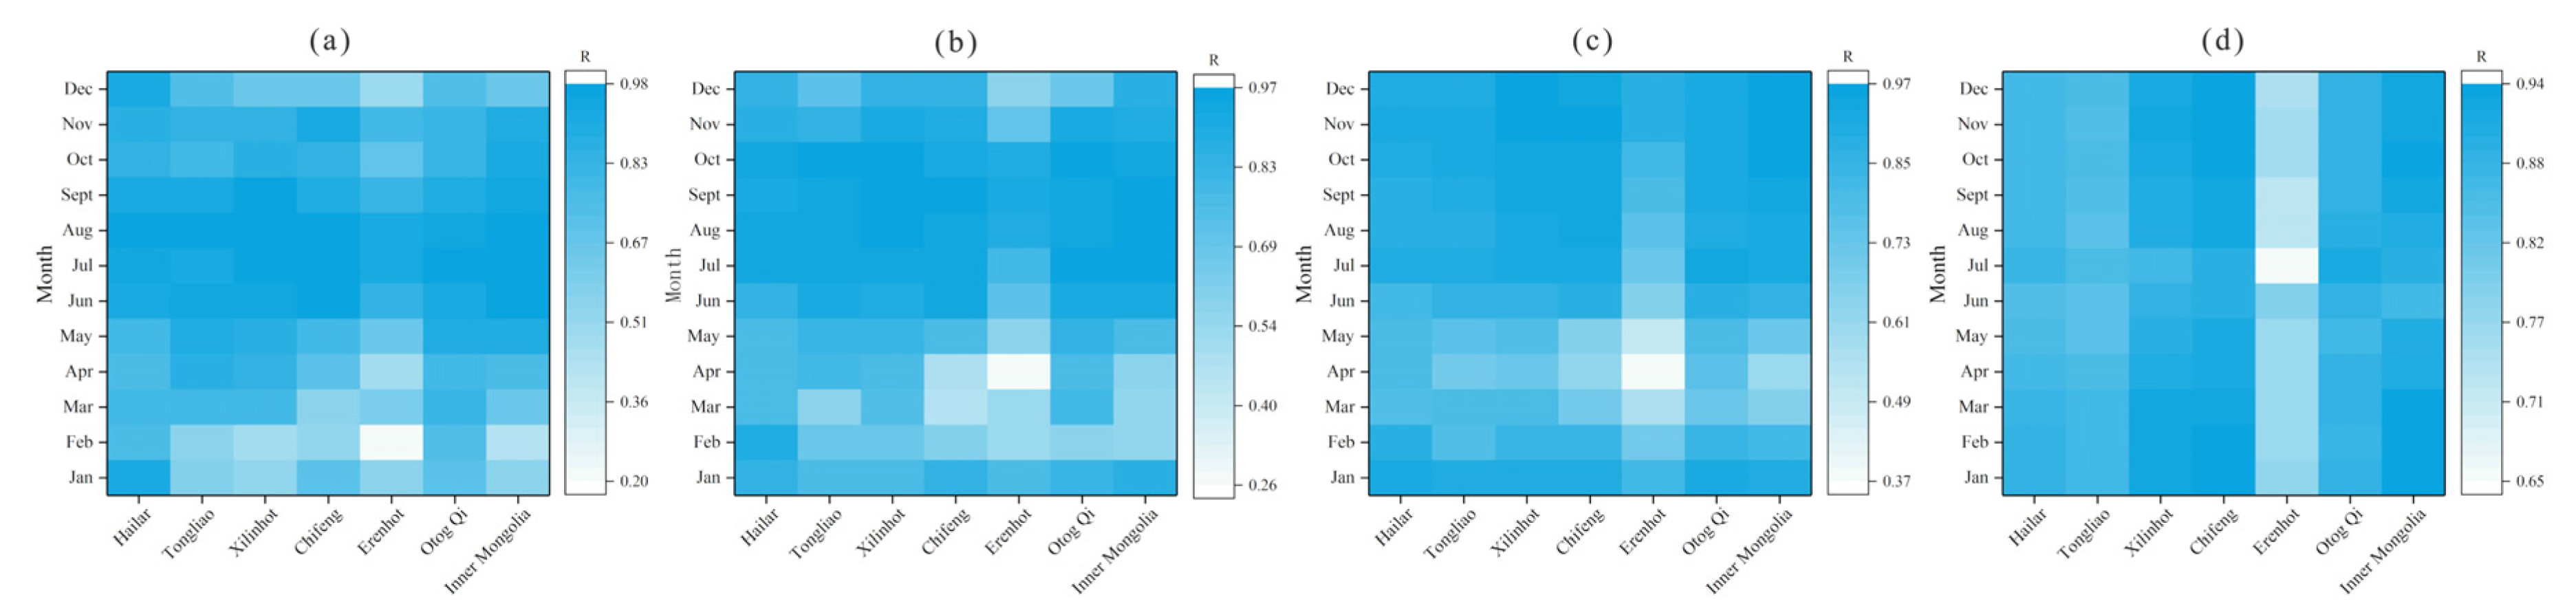
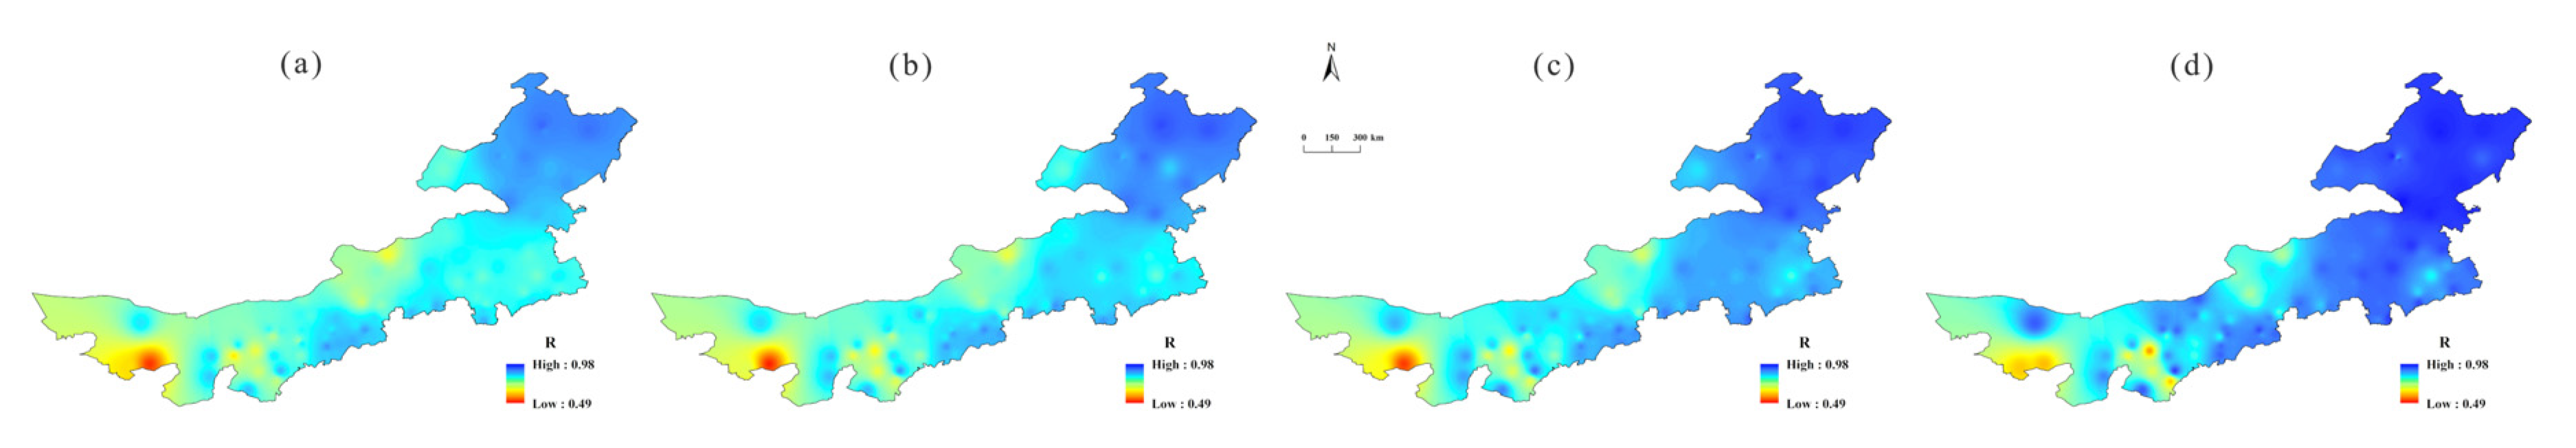
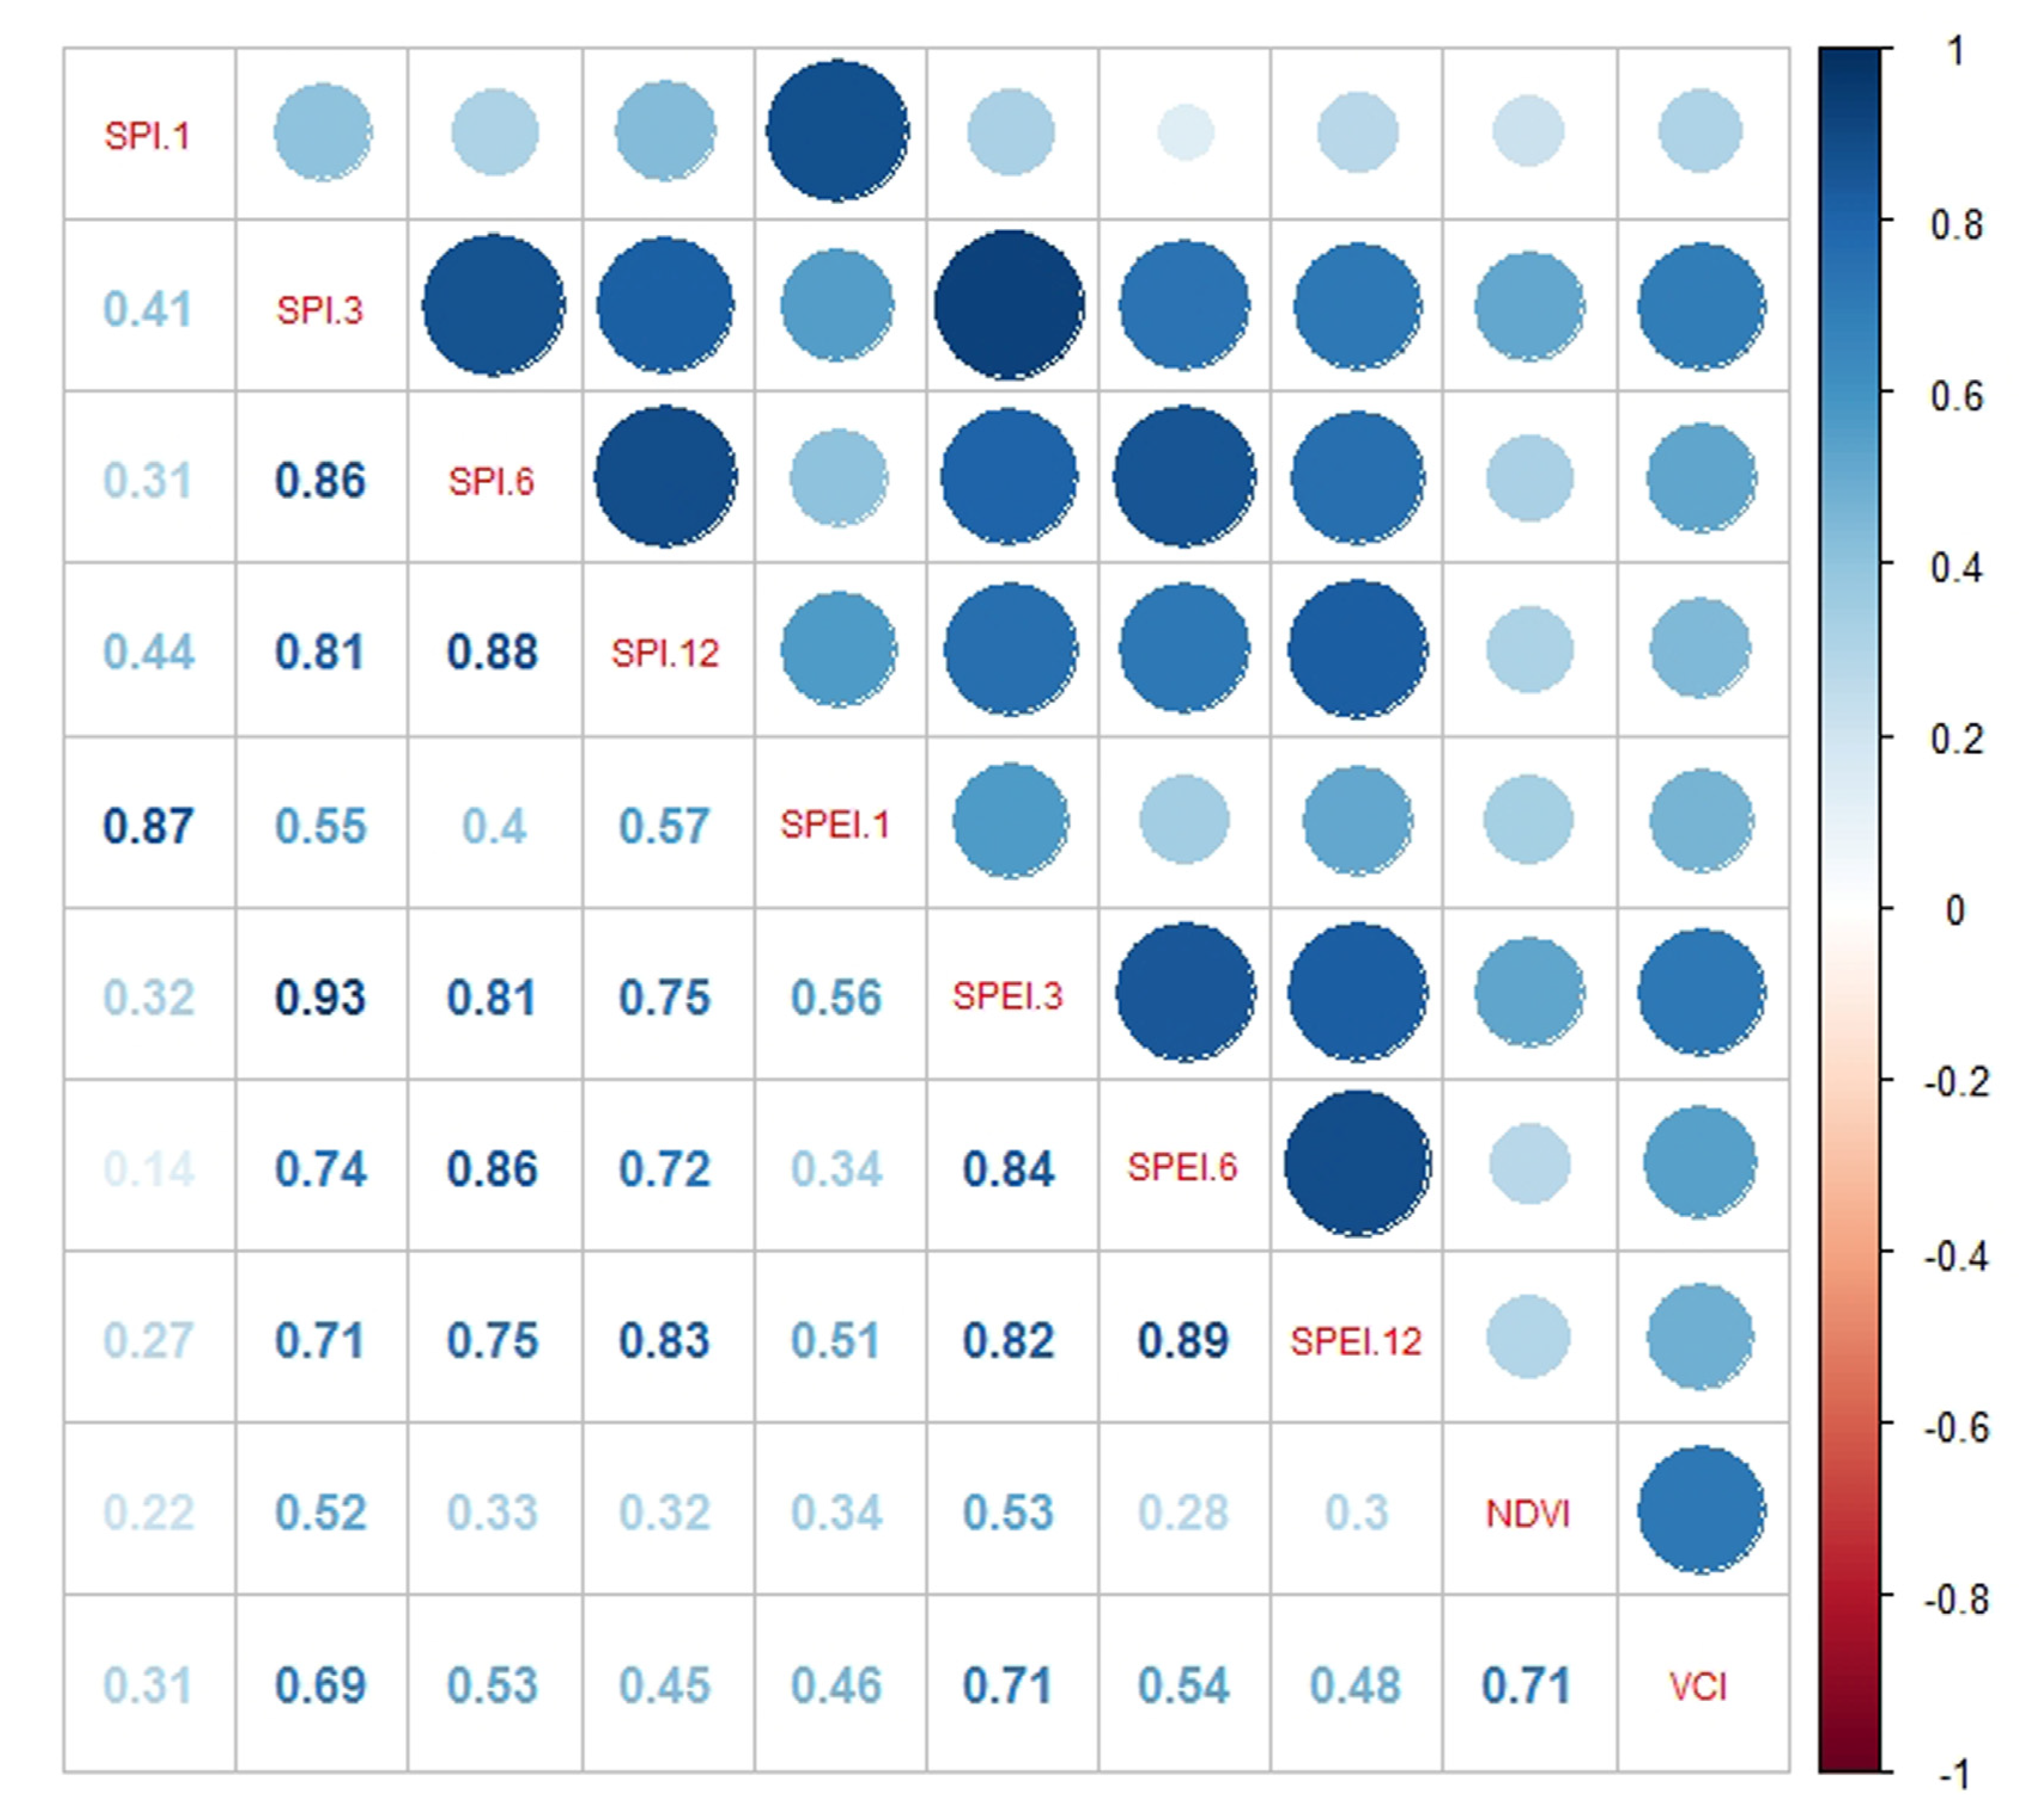
3.3. Consistency of the SPI and SPEI

To analyze the consistency of the SPI and SPEI, typical meteorological stations in different climatic regions were selected, and we analyzed the correlation between the SPI and SPEI on monthly at various timescales (Figure 7). It can be seen that there were differences in the correlation coefficient of each station in different months, especially on the short timescale. However, the correlation coefficients between the SPI and SPEI were relatively high (above 0.65) from June to October at short timescales. With the increase in timescale, the correlation coefficients between them in each month were basically the same, and the correlations were also relatively high (above 0.70).
In addition, the spatial distribution of correlation between the SPI and SPEI at various timescales in Inner Mongolia was also analyzed (Figure 8). The correlation between the SPI and SPEI in various regions of Inner Mongolia was high at various timescales, and the correlation coefficients were above 0.49. The correlation between the SPI and SPEI in eastern Inner Mongolia was generally higher than that in western Inner Mongolia. Therefore, the results of drought monitoring identified by the SPI and SPEI may be quite different in western Inner Mongolia. However, with the increase in timescale, the scope of high correlation between the SPI and SPEI in Inner Mongolia gradually expanded. Therefore, the drought monitoring of the SPI and SPEI may be consistent at a longer timescale [20,42].

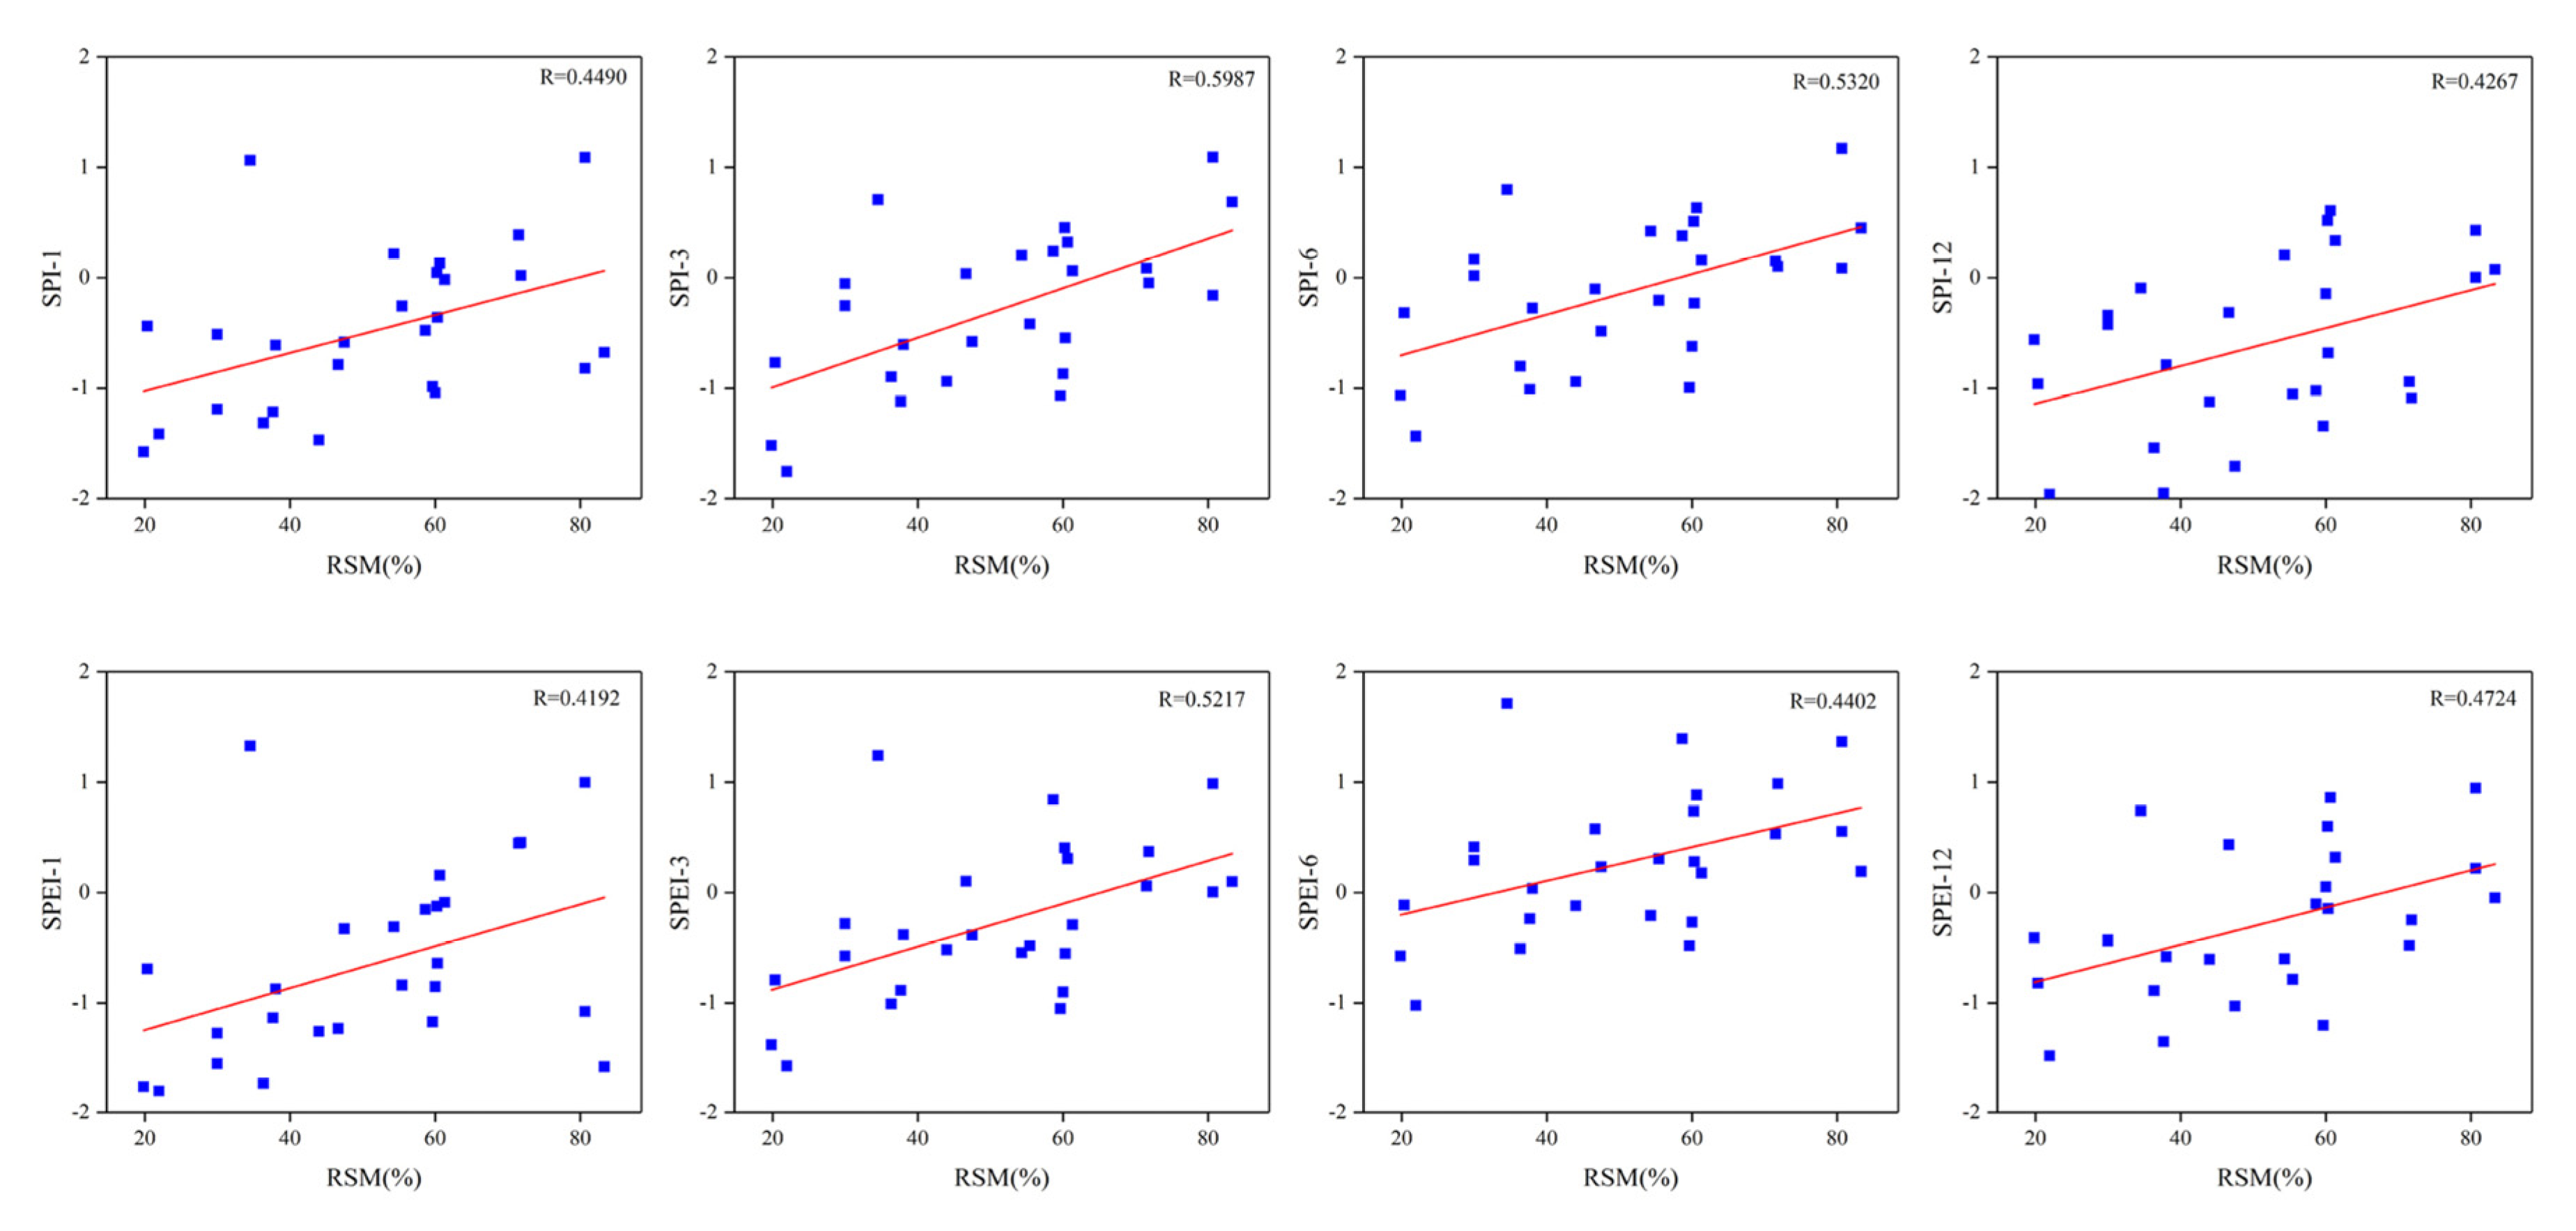
3.4. Applicability of the SPI and SPEI

The response of vegetation to drought was significant, and the growth of vegetation can also reflect the degree of drought in the region [6,59]. Here, the NDVI and VCI were used to analyze the applicability of the SPI and SPEI in drought monitoring. In the summer of 2010, drought occurred in most areas of Inner Mongolia. Considering the different responses of different vegetation types to drought, August was selected for analysis. Here, we calculated the correlation coefficients among the vegetation indexes (the NDVI and VCI) and the SPI/SPEI of meteorological stations at various timescales in Inner Mongolia. The NDVI and VCI had high correlation coefficients with the SPI/SPEI at 3-month timescale and the highest correlation degree (R = 0.53/0.71) with the SPEI-3. At the same time, it can be seen that the SPI and SPEI had a high correlation at various timescales (Figure 9).
The SPI-3/SPEI-3 was closely related to vegetation growth, which has also been confirmed in other studies [60]. We also compared the spatial distribution of the NDVI, VCI, SPI-3, and SPEI-3 (Figure 10). Due to the drought in most parts of Inner Mongolia during the period, we can see that the drought range reflected by the SPEI was more realistic than that reflected by the SPI. The serious drought area reflected by the SPI was distributed in Alxa League, while the serious drought area reflected by the SPEI was mainly distributed in Xilingol League. Consistent with drought reflected by the SPI and SPEI, NDVI and VCI also reflected the large-scale drought in Inner Mongolia. In the Alxa area, vegetation was scarce, and the NDVI was low year round, reflecting serious drought, and due to warming and humidification in recent years, the VCI value has increased. The serious drought area reflected by the VCI was more consistent with that of the SPEI-3.
Soil moisture is usually also used for drought monitoring [61], and the relationship between soil moisture and the SPI/SPEI was also explored here. The correlation between the SPI-3/SPEI-3 and soil relative humidity was higher, and the SPI-3 was the highest (R = 0.5987) (Figure 11). This may be because the SPI was mainly affected by precipitation, and soil relative humidity was also mainly from precipitation, so the relationship between the SPI and soil relative humidity may be better than that between the SPEI and soil relative humidity [47].

4. Discussion

There were also some differences between the SPI and SPEI in regional drought monitoring, which can be found in most studies [15,20,35,62]. From the perspective of time series, the variations of the SPI and SPEI at each timescale were slightly similar. At the short timescale, the two indexes fluctuated most frequently, and the differences between them was the largest. At the long timescale, the fluctuation of the SPI and SPEI tended to be gentle, and the differences between them decreased, but there were still slight differences in the intensity of drought. Spatially, due to the differences in the SPI and SPEI values, the drought results identified by the SPI and SPEI were quite different, which was also confirmed in the study. However, it is still worth discussing whether the selection of the SPI and SPEI thresholds can be consistent in drought identification.
Due to the change in climate and the difference of climatic conditions in different regions, there will always be differences between the SPI and SPEI, and the applicability of the SPI and SPEI in drought monitoring has also been discussed for some time [35,62,63]. Although the SPI can describe the variations of drought, it ignores the effect of evaporation on drought. However, the SPEI considers both precipitation and evapotranspiration, and in the context of global warming, it is more suitable for drought monitoring in arid and semiarid areas [20,43,62]. According to the research, the impact of precipitation on drought in the western part of Inner Mongolia was not very obvious but was noticeable on drought intensity in the eastern part [30]. In this study, drought monitoring based on the SPI only took the precipitation of Inner Mongolia as the index, which may have led to inaccuracy of the drought monitoring results. The temperature in Inner Mongolia is increasing, and the range of drought is expanding [17,42,64]. Due to the consideration of temperature in the SPEI, the drought reflected by the SPEI showed an increasing trend at various timescales, while drought reflected by the SPI only showed an increasing trend at 12-month timescale, so the performance of the SPI may be insufficient. In the spatial distribution of the trend, except for the Alxa region, the distribution ranges of drought trends reflected by the SPI and SPEI were basically consistent, especially at 12-month timescale (Figure 7), but there were still some differences. The spatial distribution of drought trends reflected by the two indexes may have some reference significance for drought monitoring in Inner Mongolia.
In this study, the drought variations in Inner Mongolia were basically consistent with those of other research results [42,65,66]. We compared and analyzed the variations of the SPI and SPEI in time and space from various timescales, so as to better understand the performance of two indexes in Inner Mongolia and facilitate the follow-up study. Considering that the time period of this study was different from that of other studies, the characteristics of drought frequency and intensity obtained in this study will also be different from those of other research results. Also, due to different parameters, it is inevitable that there are differences between the SPI and SPEI, but they may be consistent on a longer timescale [20,42], that is, the drought identified by the SPI/SPEI on a longer timescale may be more accurate. When analyzing the applicability of the SPI and SPEI, the two indexes had their own advantages and can generally monitor regional drought. However, compared with typical drought events and the vegetation index (Figure 9 and Figure 10), the SPEI may be more suitable for drought monitoring in this area. In this study, we can also see that there was a relatively poor correlation between the SPI/SPEI and soil relative humidity, and this may have been due to different natural characteristics of different regions (such as vegetation, soil, and altitude). In addition, the adaptability of the two indexes may be also different in different periods [20,21,62], which remains to be analyzed in the future.

5. Conclusions

In the study, after calculating the SPI and SPEI at 1-, 3-, 6-, and 12-month timescales at 102 meteorological stations in Inner Mongolia from 1981 to 2018, we compared and analyzed the performance of the SPI and SPEI in drought monitoring from temporal and spatial variations, and we also discussed the consistency and applicability of the SPI and SPEI in Inner Mongolia. The main findings were as follows:
(1)
The temporal evolution of the SPI and SPEI were similar at various timescales, but there were still slight differences in fluctuation value and continuity, and the differences decreased with increasing timescale. In monthly variations, the drought reflected by the SPI was more serious than that reflected by the SPEI, and with increasing time series, the drought reflected by the SPEI in some months was higher than that reflected by the SPI. At 12-month timescale, the variations of the SPI and SPEI were basically consistent, and there was an obvious mutation point in 1999.
(2)
Due to the difference between the values of the SPI and SPEI in time series, their drought characteristics were quite different in space at various timescales. However, with the increase in timescale, the spatial distributions of drought trends indicated by the SPI and SPEI in Inner Mongolia were basically consistent, except for in Alxa, and the drought in Inner Mongolia increased from west to east.
(3)
There were some differences between the SPI and SPEI in drought monitoring in Inner Mongolia. At the shortest timescale, the two indexes fluctuated most frequently, and the differences between them were the largest. At the longest timescale, the fluctuations in the SPI and SPEI tended to be gradual, and the differences between them decreased. Therefore, the drought reflected by the SPI and SPEI may be consistent at long timescales.
(4)
When analyzing the applicability of the SPI and SPEI in Inner Mongolia, the two indexes had their own advantages and they can generally monitor regional drought. Compared with typical drought events and the vegetation indexes, the SPEI may be more suitable than the SPI for drought monitoring in Inner Mongolia.
The study provided a reference for the evaluation and selection of drought indexes in drought monitoring and had a further understanding for the characteristics of drought in Inner Mongolia. In the study, the SPEI was better than the SPI as a whole. However, due to the vast territory and diversity of natural characteristics of Inner Mongolia, the SPI may also be better than the SPEI in other regions. The applicability of drought index may be closely related to natural characteristics and seasonality, which will be further research work in the future.

Author Contributions

Z.P. designed the study of the paper, data processing and analysis, and manuscript writing; S.F. contributed to the ideas and interpretation of the data; L.W. provided methodology support; W.Y. contributed to the ideas, data analysis and manuscript modifying. All authors contributed to the discussion and commented on the manuscript at all stages. All authors have read and agreed to the published version of the manuscript.

Funding

This paper was supported by the National Key Research and Development Program of China (grant number 2019YFC1510205 and 2018YFC1506500), the Fundamental Research Funds (grant number 2019Z010).

Acknowledgments

The authors sincerely thank the anonymous reviewers and the editors for their valuable comments and constructive suggestions.

Conflicts of Interest

The authors declare no conflict of interest.

References

  1. Cook, B.I.; Smerdon, J.E.; Seager, R.; Coats, S. Global warming and 21st century drying. Clim. Dyn. 2014, 43, 2607–2627. [Google Scholar] [CrossRef] [Green Version]
  2. Dai, A. Increasing drought under global warming in observations and models. Nat. Clim. Chang. 2013, 3, 52–58. [Google Scholar] [CrossRef]
  3. Coumou, D.; Rahmstorf, S. A decade of weather extremes. Nat. Clim. Chang. 2012, 2, 491–496. [Google Scholar] [CrossRef]
  4. Fang, S.; Qi, Y.; Yu, W.; Liang, H.; Han, G.; Li, Q.; Shen, S.; Zhou, G.; Shi, G. Change in temperature extremes and its correlation with mean temperature in mainland China from 1960 to 2015. Int. J. Clim. 2016, 37, 3910–3918. [Google Scholar] [CrossRef]
  5. Philip, S.; Kew, S.F.; van Oldenborgh, G.J.; Otto, F.; O′Keefe, S.; Haustein, K.; King, A.; Zegeye, A.; Eshetu, Z.; Hailemariam, K. Attribution analysis of the Ethiopian drought of 2015. J. Clim. 2017, 31, 2465–2485. [Google Scholar] [CrossRef]
  6. Jiang, W.; Wang, L.; Feng, L.; Zhang, M.; Yao, R. Drought characteristics and its impact on changes in surface vegetation from 1981 to 2015 in the Yangtze River Basin, China. Int. J. Clim. 2019, 1–18. [Google Scholar] [CrossRef]
  7. Piao, S.; Ciais, P.; Huang, Y.; Shen, Z.; Peng, S.; Li, J.; Zhou, L.; Liu, H.; Ma, Y.; Ding, Y. The impacts of climate change on water resources and agriculture in China. Nature 2010, 467, 43–51. [Google Scholar] [CrossRef]
  8. Mishra, A.K.; Singh, V.P. A review of drought concepts. J. Hydrol. 2010, 391, 202–216. [Google Scholar] [CrossRef]
  9. Liebmann, B.; Hoerling, M.P.; Funk, C.; Bladé, I.; Dole, R.M.; Allured, D.; Quan, X.; Pegion, P.; Eischeid, J.K. Understanding recent eastern horn of africa rainfall variability and change. J. Clim. 2014, 27, 8630–8645. [Google Scholar] [CrossRef]
  10. Shen, Z.; Zhang, Q.; Singh, V.P.; Sun, P.; Song, C.; Yu, H. Agricultural drought monitoring across Inner Mongolia, China: Model development, spatiotemporal patterns and impacts. J. Hydrol. 2019, 571, 793–804. [Google Scholar] [CrossRef]
  11. Maxwell, D.; Fitzpatrick, M. The 2011 Somalia famine: Context, causes, and complications. Glob. Food Secur. 2012, 1, 5–12. [Google Scholar] [CrossRef]
  12. Sheffield, J.; Wood, E.F. Projected changes in drought occurrence under future global warming from multi-model, multi-scenario, IPCC AR4 simulations. Clim. Dyn. 2007, 31, 79–105. [Google Scholar] [CrossRef]
  13. Huang, J.; Yu, H.; Guan, X.; Wang, G.; Guo, R. Accelerated dryland expansion under climate change. Nat. Clim. Chang. 2016, 6, 166–171. [Google Scholar] [CrossRef]
  14. Guo, S. The meteorological disaster risk assessment based on the diffusion mechanism. J. Risk Anal. Crisis Response 2012, 2, 124–130. [Google Scholar] [CrossRef] [Green Version]
  15. Mehr, A.D.; Vaheddoost, B. Identification of the trends associated with the SPI and SPEI indices across Ankara, Turkey. Theor. Appl. Clim. 2019, 139, 1531–1542. [Google Scholar] [CrossRef]
  16. Tran, T.V.; Tran, D.X.; Myint, S.W.; Latorre-Carmona, P.; Ho, D.D.; Tran, P.H.; Dao, H.N. Assessing spatiotemporal drought dynamics and its related environmental issues in the mekong river delta. Remote Sens. 2019, 11, 2742. [Google Scholar] [CrossRef] [Green Version]
  17. Wang, Y.; Liu, G.; Guo, E. Spatial distribution and temporal variation of drought in Inner Mongolia during 1901–2014 using Standardized Precipitation Evapotranspiration Index. Sci. Total Environ. 2019, 654, 850–862. [Google Scholar] [CrossRef]
  18. Zhang, A.; Jia, G. Monitoring meteorological drought in semiarid regions using multi-sensor microwave remote sensing data. Remote Sens. Environ. 2013, 134, 12–23. [Google Scholar] [CrossRef]
  19. Wang, X.; Zhuo, L.; Li, C.; Engel, B.A.; Sun, S.; Wang, Y. Temporal and spatial evolution trends of drought in northern Shaanxi of China: 1960–2100. Theor. Appl. Clim. 2019, 139, 965–979. [Google Scholar] [CrossRef]
  20. Tirivarombo, S.; Osupile, D.; Eliasson, P. Drought monitoring and analysis: Standardised Precipitation Evapotranspiration Index (SPEI) and Standardised Precipitation Index (SPI). Phys. Chem. Earth Parts A/B/C 2018, 106, 1–10. [Google Scholar] [CrossRef]
  21. Vicente-Serrano, S.M.; Beguería, S.; Lorenzo-Lacruz, J.; Camarero, J.J.; López-Moreno, J.I.; Azorin-Molina, C.; Revuelto, J.; Morán-Tejeda, E.; Sanchez-Lorenzo, A. Performance of drought indices for ecological, agricultural, and hydrological applications. Earth Interact. 2012, 16, 1–27. [Google Scholar] [CrossRef] [Green Version]
  22. Wable, P.S.; Jha, M.K.; Shekhar, A. Comparison of drought indices in a Semi-Arid River Basin Of India. Water Resour. Manag. 2018, 33, 75–102. [Google Scholar] [CrossRef]
  23. McKee, T.B.; Doesken, N.J.; Kleist, J. The relationship of drought frequency and duration to time scales. In Proceedings of the 8th Conference on Applied Climatology, Anaheim, CA, USA, 17–22 January 1993; Volume 17, pp. 179–183. [Google Scholar]
  24. Palmer, W.C. Meteorological Drought Research Paper No. 45; Weather Bureau: Washington, DC, USA, 1965.
  25. Vicente-Serrano, S.; Beguería, S.; López-Moreno, J.I. A multiscalar drought index sensitive to global warming: The standardized precipitation evapotranspiration index. J. Clim. 2010, 23, 1696–1718. [Google Scholar] [CrossRef] [Green Version]
  26. Guo, E.; Liu, X.; Zhang, J.; Wang, Y.; Wang, C.; Wang, R.; Li, D. Assessing spatiotemporal variation of drought and its impact on maize yield in Northeast China. J. Hydrol. 2017, 553, 231–247. [Google Scholar] [CrossRef]
  27. Spinoni, J.; Naumann, G.; Carrao, H.; Barbosa, P.; Vogt, J. World drought frequency, duration, and severity for 1951–2010. Int. J. Clim. 2014, 34, 2792–2804. [Google Scholar] [CrossRef] [Green Version]
  28. Hong, X.; Guo, S.; Xiong, L.; Liu, Z. Spatial and temporal analysis of drought using entropy-based standardized precipitation index: A case study in Poyang Lake basin, China. Theor. Appl. Clim. 2015, 122, 543–556. [Google Scholar] [CrossRef]
  29. Tao, H.; Borth, H.; Fraedrich, K.; Su, B.; Zhu, X. Drought and wetness variability in the Tarim River Basin and connection to large-scale atmospheric circulation. Int. J. Clim. 2014, 34, 2678–2684. [Google Scholar] [CrossRef]
  30. Zhou, Y.; Li, N.; Ji, Z.; Gu, X.; Fan, B. Temporal and Spatial Patterns of Droughts Based on Standard Precipitation Index (SPI) in Inner Mongolia during 1981–2010. J. Nat. Resour. 2013, 28, 1694–1706. [Google Scholar]
  31. Zhang, Q.; Qi, T.; Singh, V.P.; Chen, Y.D.; Xiao, M. Regional frequency analysis of droughts in china: A multivariate perspective. Water Resour. Manag. 2015, 29, 1767–1787. [Google Scholar] [CrossRef]
  32. Mathbout, S.; Lopez-Bustins, J.A.; Martin-Vide, J.; Bech, J.; Rodrigo, F.S. Spatial and temporal analysis of drought variability at several time scales in Syria during 1961–2012. Atmos. Res. 2018, 200, 153–168. [Google Scholar] [CrossRef]
  33. Shaowei, Z.; Hongchao, Z.; Pengcheng, R.; Guangjie, X.; Bangdong, L.; Wencheng, D.; Liying, W. Application of Standardized Precipitation Evapotranspiration Index in China. Clim. Environ. Res. 2013, 18, 617–625. [Google Scholar]
  34. Mohammed, Y.; Yimer, F.; Tadesse, M.; Tesfaye, K. Meteorological drought assessment in north east highlands of Ethiopia. Int. J. Clim. Chang. Strateg. Manag. 2017, 10, 142–160. [Google Scholar] [CrossRef] [Green Version]
  35. Li, W.; Duan, L.; Wang, W.; Wu, Y.; Liu, T.; Quan, Q.; Chen, X.; Yin, H.; Zhou, Q. Spatiotemporal characteristics of drought in a semi-arid grassland over the past 56 years based on the Standardized Precipitation Index. Meteorol. Atmos. Phys. 2020. published online. [Google Scholar] [CrossRef]
  36. Sobral, B.S.; de Oliveira-Junior, J.F.; de Gois, G.; Pereira-Junior, E.R.; de Bodas Terassi, P.M.; Rodrigues Muniz-Junior, J.G.; Lyra, G.B.; Zeri, M. Drought characterization for the state of Rio de Janeiro based on the annual SPI index: Trends, statistical tests and its relation with ENSO. Atmos. Res. 2019, 220, 141–154. [Google Scholar] [CrossRef]
  37. Yuan, X.; Jian, J.; Jiang, G. Spatiotemporal Variation of Precipitation Regime in China from 1961 to 2014 from the Standardized Precipitation Index. ISPRS Int. J. Geo-Inf. 2016, 5, 194. [Google Scholar] [CrossRef] [Green Version]
  38. John, R.; Chen, J.; Ou-Yang, Z.T.; Xiao, J.; Becker, R.; Samanta, A.; Ganguly, S.; Yuan, W.; Batkhishig, O. Vegetation response to extreme climate events on the Mongolian Plateau from 2000 to 2010. Environ. Res. Lett. 2013, 8, 035033. [Google Scholar] [CrossRef]
  39. Zhang, X.; Pan, X.; Xu, L.; Wei, P.; Yin, Z.; Shao, C. Analysis of spatio-temporal distribution of drought characteristics based on SPEI in Inner Mongolia during 1960–2015. Trans. Chin. Soc. Agric. Eng. 2017, 033, 190–199. [Google Scholar] [CrossRef]
  40. Huang, J.; Xue, Y.; Sun, S.; Zhang, J. Spatial and temporal variability of drought during 1960–2012 in Inner Mongolia, north China. Quat. Int. 2015, 355, 134–144. [Google Scholar] [CrossRef]
  41. Li, R.; Tsunekawa, A.; Tsubo, M. Index-based assessment of agricultural drought in a semi-arid region of Inner Mongolia, China. J. Arid Land 2014, 6, 3–15. [Google Scholar] [CrossRef]
  42. Liu, S.; Kang, W.; Wang, T. Drought variability in Inner Mongolia of northern China during 1960–2013 based on standardized precipitation evapotranspiration index. Environ. Earth Sci. 2016, 75, 145–158. [Google Scholar] [CrossRef]
  43. Tan, C.; Yang, J.; Li, M. Temporal-Spatial Variation of Drought Indicated by SPI and SPEI in Ningxia Hui Autonomous Region, China. Atmosphere 2015, 6, 1399–1421. [Google Scholar] [CrossRef] [Green Version]
  44. Ding, Y.; Xu, J.; Wang, X.; Peng, X.; Cai, H. Spatial and temporal effects of drought on Chinese vegetation under different coverage levels. Sci. Total Environ. 2020, 716, 137166. [Google Scholar] [CrossRef] [PubMed]
  45. Li, X.; He, B.; Quan, X.; Liao, Z.; Bai, X. Use of the Standardized Precipitation Evapotranspiration Index (SPEI) to Characterize the Drying Trend in Southwest China from 1982–2012. Remote Sens. 2015, 7, 10917–10937. [Google Scholar] [CrossRef] [Green Version]
  46. Li, X.; Sha, J.; Wang, Z.L. Comparison of drought indices in the analysis of spatial and temporal changes of climatic drought events in a basin. Environ. Sci. Pollut. Res. Int. 2019, 26, 10695–10707. [Google Scholar] [CrossRef]
  47. Xu, K.; Yang, D.; Yang, H.; Li, Z.; Qin, Y.; Shen, Y. Spatio-temporal variation of drought in China during 1961–2012: A climatic perspective. J. Hydrol. 2015, 526, 253–264. [Google Scholar] [CrossRef]
  48. Schwalm, C.R.; Anderegg, W.R.L.; Michalak, A.M.; Fisher, J.B.; Biondi, F.; Koch, G.; Litvak, M.; Ogle, K.; Shaw, J.D.; Wolf, A.; et al. Global patterns of drought recovery. Nature 2017, 548, 202–205. [Google Scholar] [CrossRef] [PubMed]
  49. Gebremeskel Haile, G.; Tang, Q.; Leng, G.; Jia, G.; Wang, J.; Cai, D.; Sun, S.; Baniya, B.; Zhang, Q. Long-term spatiotemporal variation of drought patterns over the Greater Horn of Africa. Sci. Total Environ. 2020, 704, 135299. [Google Scholar] [CrossRef]
  50. Li, W.; Yi, X.; Hou, M.; Chen, H.; Chen, Z. Standardized precipitation evapotranspiration index shows drought trend in China. Chin. J. Eco-Agric. 2012, 20, 643–649. [Google Scholar] [CrossRef]
  51. Liu, Z.; Wang, Y.; Shao, M.; Jia, X.; Li, X. Spatiotemporal analysis of multiscalar drought characteristics across the Loess Plateau of China. J. Hydrol. 2016, 534, 281–299. [Google Scholar] [CrossRef]
  52. Li, Y.; Wang, Z.; Zhang, Y.; Li, X.; Huang, W. Drought variability at various timescales over Yunnan Province, China: 1961–2015. Theor. Appl. Clim. 2019, 138, 743–757. [Google Scholar] [CrossRef]
  53. Yue, S.; Pilon, P.; Cavadias, G. Power of the mann-kendall and spearman′s rho tests for detecting monotonic trends in hydrological series. J. Hydrol. 2002, 259, 254–271. [Google Scholar] [CrossRef]
  54. Gocic, M.; Trajkovic, S. Analysis of changes in meteorological variables using Mann-Kendall and Sen’s slope estimator statistical tests in Serbia. Glob. Planet. Chang. 2013, 100, 172–182. [Google Scholar] [CrossRef]
  55. Cheng, Q.; Gao, L.; Zhong, F.; Zuo, X.; Ma, M. Spatiotemporal variations of drought in the Yunnan-Guizhou Plateau, southwest China, during 1960–2013 and their association with large-scale circulations and historical records. Ecol. Indic. 2020, 112, 106041. [Google Scholar] [CrossRef]
  56. Mekonen, A.A.; Berlie, A.B.; Ferede, M.B. Spatial and temporal drought incidence analysis in the northeastern highlands of Ethiopia. Geoenviron. Disasters 2020, 7, 49–60. [Google Scholar] [CrossRef] [Green Version]
  57. Sun, Y.; Liu, S.; Dong, Y.; Dong, S.; Shi, F. Effects of multi-time scales drought on vegetation dynamics in Qaidam River Basin, Qinghai-Tibet Plateau from 1998 to 2015. Theor. Appl. Clim. 2020. published online. [Google Scholar] [CrossRef]
  58. Wei, P.; Xu, L.; Pan, X.; Hu, Q.; Li, Q.; Zhang, X.; Shao, C.; Wang, C.; Wang, X. Spatio-temporal variations in vegetation types based on a climatic grassland classification system during the past 30 years in Inner Mongolia, China. Catena 2020, 185, 104298. [Google Scholar] [CrossRef]
  59. Li, C.; Leal Filho, W.; Yin, J.; Hu, R.; Wang, J.; Yang, C.; Yin, S.; Bao, Y.; Ayal, D.Y. Assessing vegetation response to multi-time-scale drought across inner Mongolia plateau. J. Clean. Prod. 2018, 179, 210–216. [Google Scholar] [CrossRef]
  60. Zhao, A.; Zhang, A.; Cao, S.; Liu, X.; Liu, J.; Cheng, D. Responses of vegetation productivity to multi-scale drought in Loess Plateau, China. Catena 2018, 163, 165–171. [Google Scholar] [CrossRef]
  61. Wu, D.; Fang, S.; Li, X.; He, D.; Zhu, Y.; Yang, Z.; Xu, J.; Wu, Y. Spatial-temporal variation in irrigation water requirement for the winter wheat-summer maize rotation system since the 1980s on the North China Plain. Agric. Water Manag. 2019, 214, 78–86. [Google Scholar] [CrossRef]
  62. Labudová, L.; Labuda, M.; Takáč, J. Comparison of SPI and SPEI applicability for drought impact assessment on crop production in the Danubian Lowland and the East Slovakian Lowland. Theor. Appl. Clim. 2016, 128, 491–506. [Google Scholar] [CrossRef]
  63. Vicente-Serrano, S.M.; Chura, O.; López-Moreno, J.I.; Azorin-Molina, C.; Sanchez-Lorenzo, A.; Aguilar, E.; Moran-Tejeda, E.; Trujillo, F.; Martínez, R.; Nieto, J.J. Spatio-temporal variability of droughts in Bolivia: 1955–2012. Int. J. Clim. 2015, 35, 3024–3040. [Google Scholar] [CrossRef] [Green Version]
  64. Pei, Z.; Fang, S.b.; Yang, W.n.; Wang, L.; Wu, M.y.; Zhang, Q.f.; Han, W.; Khoi, D.N. The Relationship between NDVI and Climate Factors at Different Monthly Time Scales: A Case Study of Grasslands in Inner Mongolia, China (1982–2015). Sustainability 2019, 11, 7243. [Google Scholar] [CrossRef] [Green Version]
  65. Jin, L.; Zhang, J.; Wang, R.; Zhang, M.; Bao, Y.; Guo, E.; Wang, Y. Analysis for spatio-temporal variation characteristics of droughts in different climatic regions of the mongolian plateau based on SPEI. Sustainability 2019, 11, 5767. [Google Scholar] [CrossRef] [Green Version]
  66. Tong, S.; Quan, L.; Zhang, J.; Bao, Y.; Lusi, A.; Ma, Q.; Li, X.; Zhang, F. Spatiotemporal drought variability on the Mongolian Plateau from 1980–2014 based on the SPEI-PM, intensity analysis and Hurst exponent. Sci. Total Environ. 2018, 615, 1557–1565. [Google Scholar] [CrossRef]
Figure 1. Geographical location and climatic characteristics of Inner Mongolia. (a) Meteorological station distribution and Digital Elevation Model (DEM), (b) annual average temperature, and (c) annual average precipitation.
Water 12 01925 g001
Figure 2. The temporal evolution (left) and the difference (right) of the standardized precipitation index (SPI) and standardized precipitation evapotranspiration index (SPEI) at 1-, 3-, 6-, and 12-month timescales in Inner Mongolia during 1981–2018.
Water 12 01925 g002
Figure 3. Monthly variations in the SPI and SPEI at 1-, 3-, 6-, and 12-month timescales in Inner Mongolia during 1981–2018.
Water 12 01925 g003
Figure 4. Annual variations, linear trends, and abrupt changes in the SPI and SPEI at 1-, 3-, 6-, and 12-month timescales in Inner Mongolia during 1981–2018. SPI: (a) 1-month, (c) 3-month, (e) 6-month and (g) 12-month timescales; SPEI: (b) 1-month, (d) 3-month, (f) 6-month and (h) 12-month timescales.
Water 12 01925 g004
Figure 5. Spatial distribution of drought characteristics at 1-, 3-, 6-, and 12-month timescales in Inner Mongolia during 1981–2018. Drought frequency, (a) SPI and (b) SPEI; drought duration, (c) SPI and (d) SPEI; and drought intensity, (e) SPI and (f) SPEI.
Water 12 01925 g005
Figure 6. Spatial distribution of the SPI and SPEI trends at 1-, 3-, 6-, and 12-month timescales in Inner Mongolia during 1981–2018.
Water 12 01925 g006
Figure 7. The correlations between the SPI and SPEI of typical meteorological stations at 1-, 3-, 6-, and 12-month timescales. (a) 1-month, (b) 3-month, (c) 6-month, and (d) 12-month timescales. All coefficients are significant with p < 0.05.
Water 12 01925 g007
Figure 8. The spatial distribution of correlation between the SPI and SPEI in Inner Mongolia. (a) 1-month, (b) 3-month, (c) 6-month, and (d) 12-month timescales. All coefficients are significant with p < 0.05.
Water 12 01925 g008
Figure 9. The correlations among the vegetation indexes and the SPI/SPEI at 1-, 3-, 6-, and 12-month timescales. All coefficients are significant with p < 0.05.
Water 12 01925 g009
Figure 10. Spatial comparisons of the SPI-3, SPEI-3, normalized difference vegetation index (NDVI), and vegetation condition index (VCI) during typical drought events.
Water 12 01925 g010
Figure 11. The correlations between the soil relative humidity and the SPI/SPEI at 1-, 3-, 6-, and 12-month timescales. All coefficients are significant with p < 0.05.
Water 12 01925 g011

