Climate-Dependent Groundwater Discharge on Semi-Arid Inland Ephemeral Wetlands: Lessons from Holocene Sediments of Lagunas Reales in Central Spain

 , ,
, ,
Abstract
:1. Introduction
2. Study Area
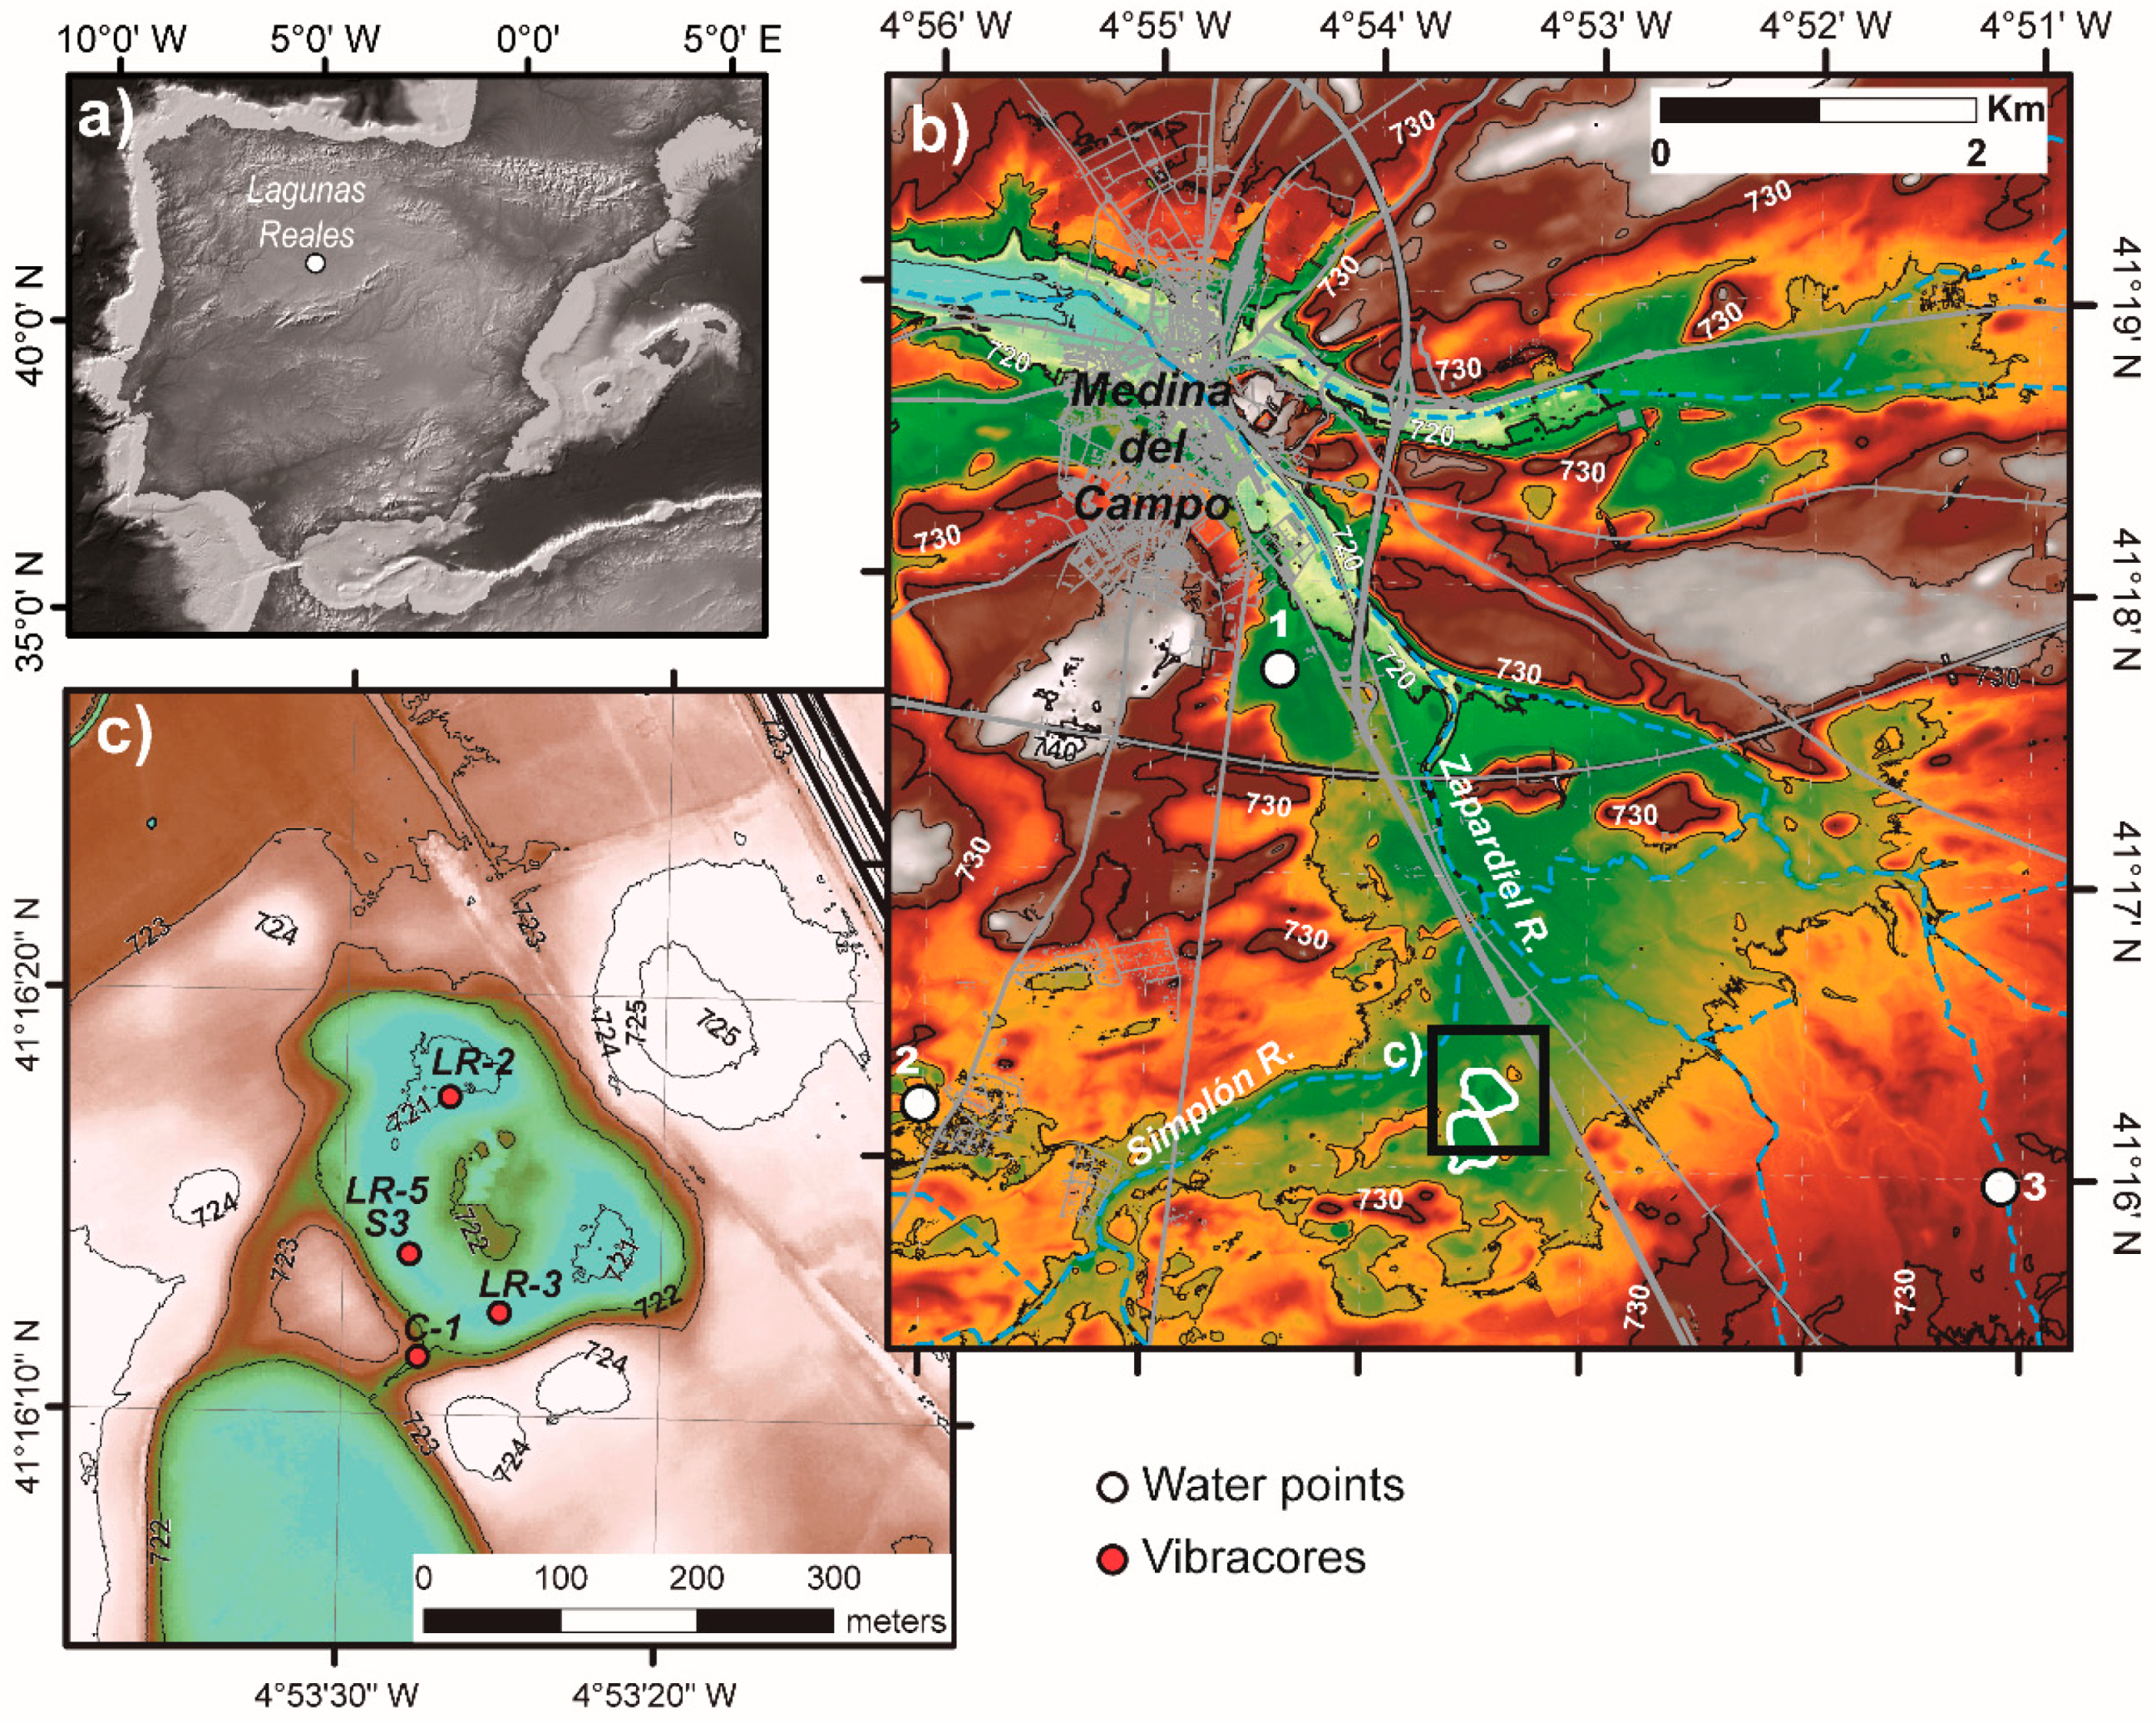
2.1. Location
2.2. Climate, Hydrology and Historical Evolution of the Wetland
3. Materials and Methods
- XRF scanning with a GEOTEK XRF core scanner in a He purged atmosphere with an illumination window of 15 mm (cross-core slit width) × 10 mm (down-core resolution). Two runs, with a 30 s count time exposure, were performed for 10 kV and 40 kV (detecting from Mg to U). XRF spectra were processed with bAxil. Element intensities are represented in peak area.
- Lightness (L*) analyses were performed with 1 cm down core resolution using a Konica Minolta 700-d spectrophotometer integrated in the GEOTEK XRF core scanner. Lightness values range from 0 (black) to 100 (white).
- Geophysical properties (P-wave velocity, gamma density, non-contact resistivity and magnetic susceptibility) were analysed with a 1 cm down core resolution with a GEOTEK Multi-Sensor Core Logger (MSCL-GEOTEK). In this paper, gamma density was used because of its correlation with other logs. Gamma density data were obtained by the attenuation of a collimated gamma ray beam (5 mm diameter) emitted from a 137Cs sealed source, passing through the core.
- Core colour scans (high resolution images with a down core resolution 50 µm) were obtained using a Geoscan IV coupled to the MSCL GEOTEK.
- Mineralogical analysis by X-ray diffractometry (PTE-RX-04) for the bulk sample and <2 m fraction. These analyses were used to check the sources of the chemical elements obtained from the geochemical analyses.
- Geochemical analysis of the major oxides and trace elements by X-ray fluorescence and atomic absorption spectroscopy (XRF and AAS). The results were used to check the validity of the non-destructive high-resolution XRF scanning.
- C (organic, inorganic and total) and S by elemental analyser (ELTRA). S data were used to check the results of the XRF core scanning. C values gave an estimate of organic matter and carbonate content and they can be compared to other results from non-destructive techniques (XRF core scanning and L*).
4. Results
4.1. Sediments
4.1.1. Substratum of the Wetland
4.1.2. Sedimentary Fill of the Ponds
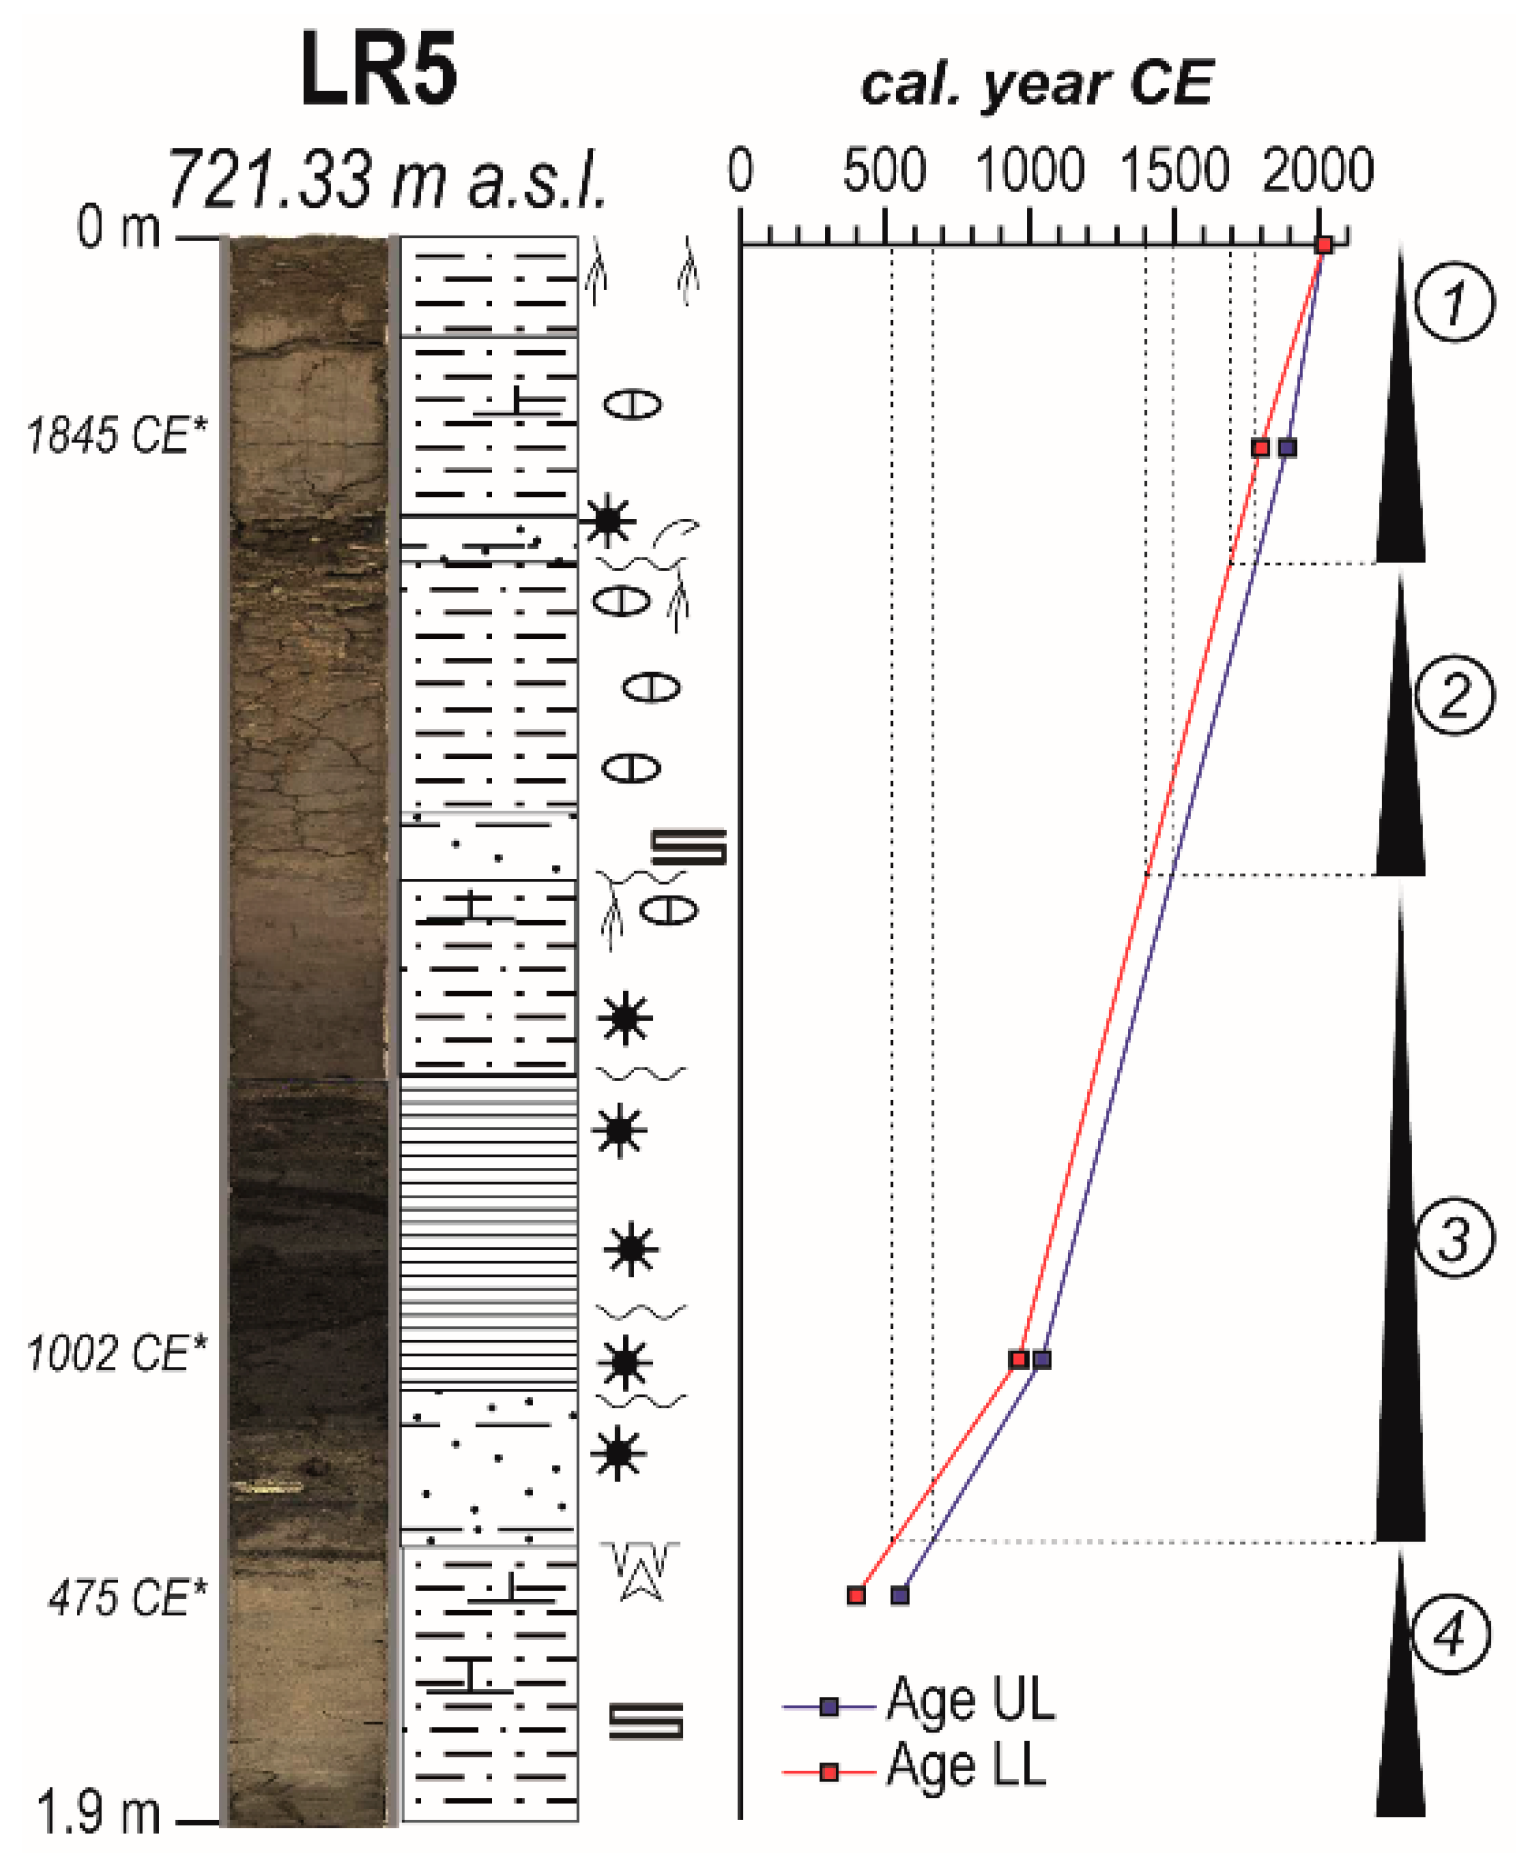
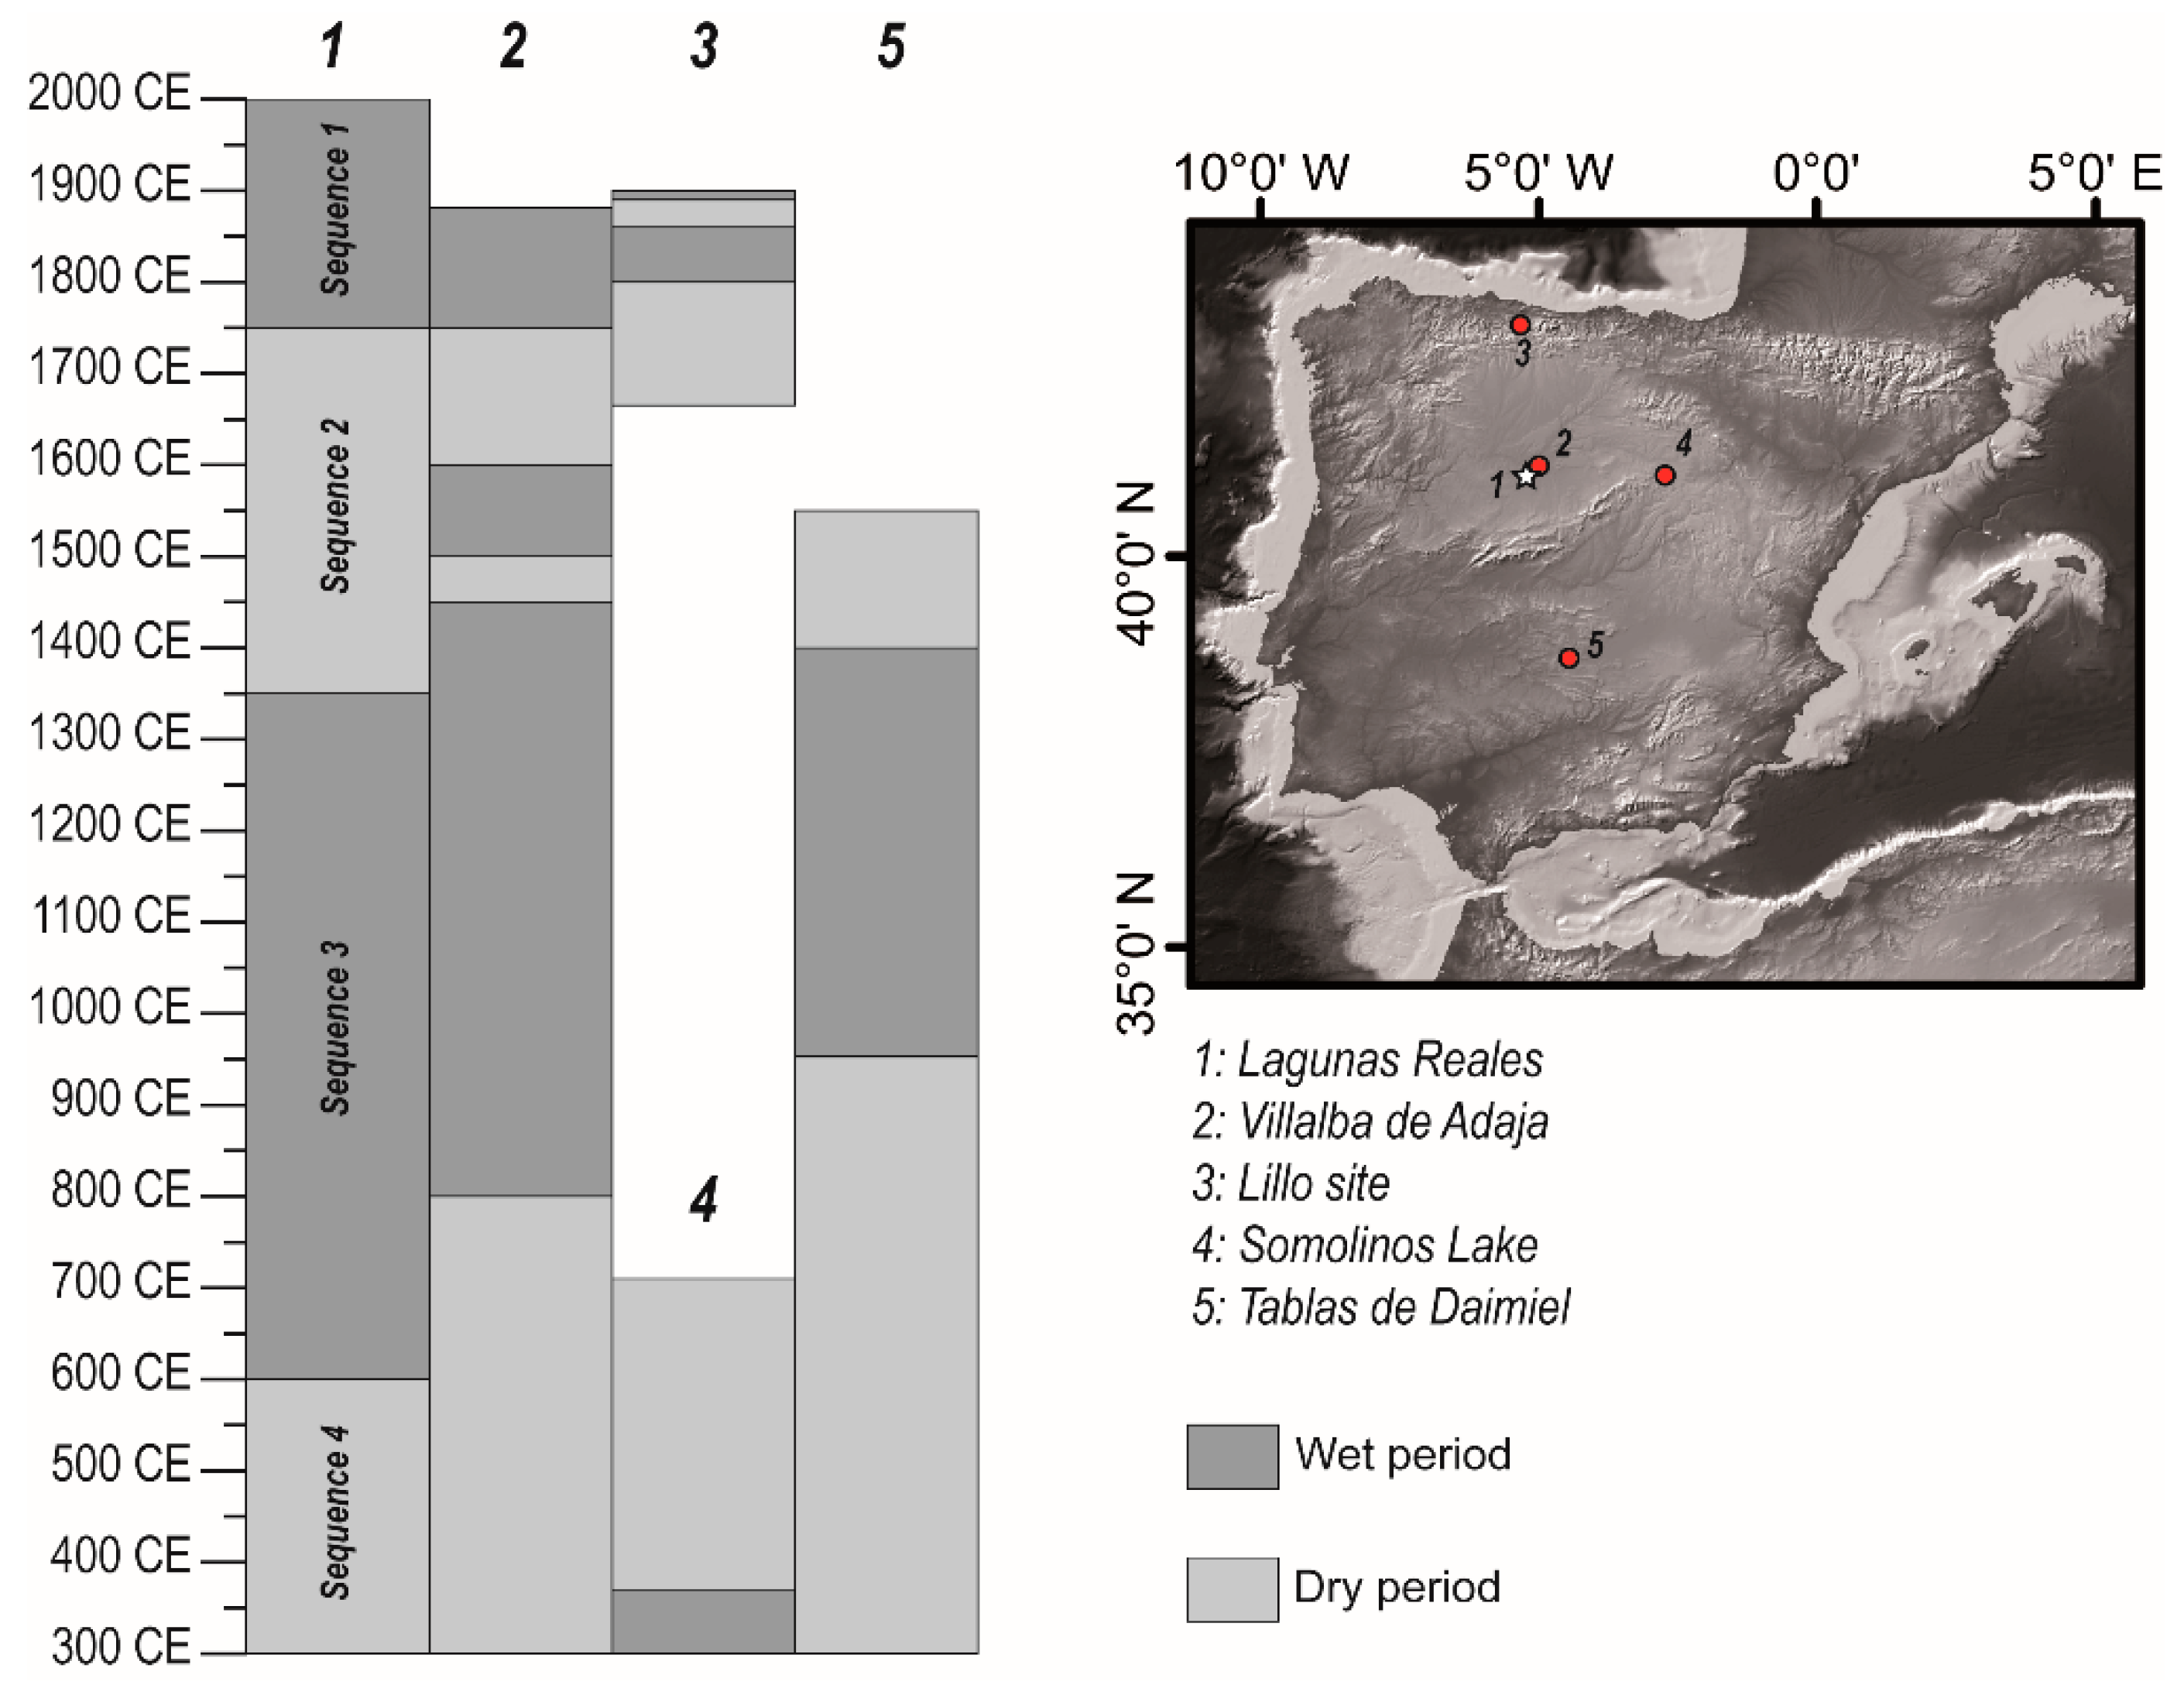
- Sequence 1: It is represented in all the cores with thicknesses ranging from 0.39 to 0.47 m (Figure 3). According to the age model, this sequence covers from 1700 to 1800 CE until the present (Figure 4). Its lower boundary is an erosive surface and the upper one is the bottom of the present-day ponds and it shows pedogenic features (root traces, E horizon in the uppermost cm). They are grey to green silty sands and mud with a variable amount of sand-sized grains forming a fining-upwards sequence. Their mineralogy is composed of quartz, microcline, Ca-bearing albite, phyllosilicates (illite and smectite) and calcite, the latter mixed with the clay (increasing upwards) or forming nodules of up to 2 mm in size (downwards). There is sparse organic matter and some bivalve fragments can be found in the sandy layers. They show horizontal lamination, which can be diffuse where carbonate nodules and root traces (<2 mm in diameter) are present (mainly downwards), and erosive surfaces are common. This sequence records the infill of the ponds, from the initial flooding stage, when the siliciclastic sediment is supplied by surface runoff, until their present-day stage. The internal erosive surfaces document different runoff episodes, probably linked to heavy rainfall episodes that brought the sediment from the surrounding reliefs and flooded the ponds. Clay flocculation was the main process during the high-water stages while calcite precipitation took place during the moments of greater evaporation. The presence of root traces and horizontal lamination point to shallow and calm waters whilst the presence of carbonate nodules is indicative of some pedogenic episodes linked to the temporary drying-out of the ponds [54,55]. The decreasing upwards intensity of the pedogenic processes and the increase in subaqueous precipitation of calcite point to a positive water budget trend and a more stable water body.
- Sequence 2: This sequence is represented in all the cores with thicknesses ranging from 0.29 to 0.39 m (Figure 3) and its age is between 1400 and 1500 CE and 1700 and 1800 CE (Figure 4). Its lower boundary is an erosive surface and its top is cut by Sequence 1. It is a fining-upwards sequence composed of green to dark green silty sand at the bottom, and poorly laminated to massive mud, with variable content in sand-size grains, dominating most of the sequence. Its mineralogical composition is similar to Sequence 1; however, the carbonate nodules (up to 1 cm in size) are more abundant, always related to root traces and increasing upwards, and there is sparse organic matter, mm-sized charcoal particles and shell fragments. Like Sequence 1, this sequence records from an initial flooding, linked to high energy events able to erode the bottom of the pond, until a final stage when dry periods were more frequent than the flooded ones. Each sedimentation episode records an initial flood, recorded by sands, followed by clay flocculation on the temporary water body and pedogenesis when the pond dried out. However, unlike Sequence 1, the increase upwards in pedogenic features points to longer and more frequent sub-aerial exposure episodes, which would result from an overall negative water budget.
- Sequence 3: The sequence thicknesses vary from 0.38 m (core LR2) up to 0.80 m (core LR5) (Figure 3). It is dated between ca. 525 and 675 CE and 1400 and 1500 CE (Figure 4). Its lower boundary is an erosive surface while its top is the erosive bottom surface of Sequence 2. It is a fining-upwards sequence made up of, from bottom to top, an alternation of gravel, mostly composed of mud clasts resulting from the erosion of the unit below (mean size: 3 mm; maximum size: 2 cm), and mud, changing upwards into inter-layered sands and mud, and ending with carbonated mud. The whole sequence shows well-defined lamination and pedogenic features (root traces and mm-sized carbonate nodules), restricted to the top of the sequence. The silicate composition is similar to the upper sequences, where calcite can reach up to 30% in the upper carbonated mud, and the more distinctive feature of this sequence is the higher organic matter content, in comparison to sequences 1, 2 and 4, which imprints darker tones to the sediment (dark green to dark grey). Like the previous ones, this fining-upwards sequence records the progressive infill of the pond, from an initial flood-dominated stage to a final desiccated stage via successive flooding episodes. The main difference with the other sequences is that the greater amount of organic matter of vegetal origin and the minor development of pedogenic features (only to the top) imply wetter conditions, a stable water body and an overall positive water budget when compared to the other sequences.
- Sequence 4: This was only recorded in cores LR2 (thickness: 0.50 m) and LR5 (thickness: 0.33 m) (Figure 3). The lower boundary cannot be seen and the upper one is the erosive bottom surface of Sequence 3. According to the age model, this sequence is older than 525–675 CE (Figure 4). It is composed of carbonated mud to marl with variable amounts of sand and clay. The siliciclastic fraction is composed of phyllosilicates (illite, smectite, muscovite and chlorite), quartz, microcline and Ca-bearing albite. The calcite content ranges from 36% to 50%. The sediment shows a cream or pale grey colour and may contain mm-sized fragments of charcoal and shells. It is arranged in sets of parallel laminae bounded by erosive surfaces. Root traces (mm-size in diameter) are present throughout the sequence but increase to the top of the sequence, where mm-size carbonate nodules and lensoidal crystals of gypsum appear. Its genesis is like that of Sequence 2, but the amount of calcite and the presence of gypsum point to higher evaporation rates, and the ubiquity of rootlet traces are indicative of a very shallow water body.
4.2. Geochemical and Geophysical Record
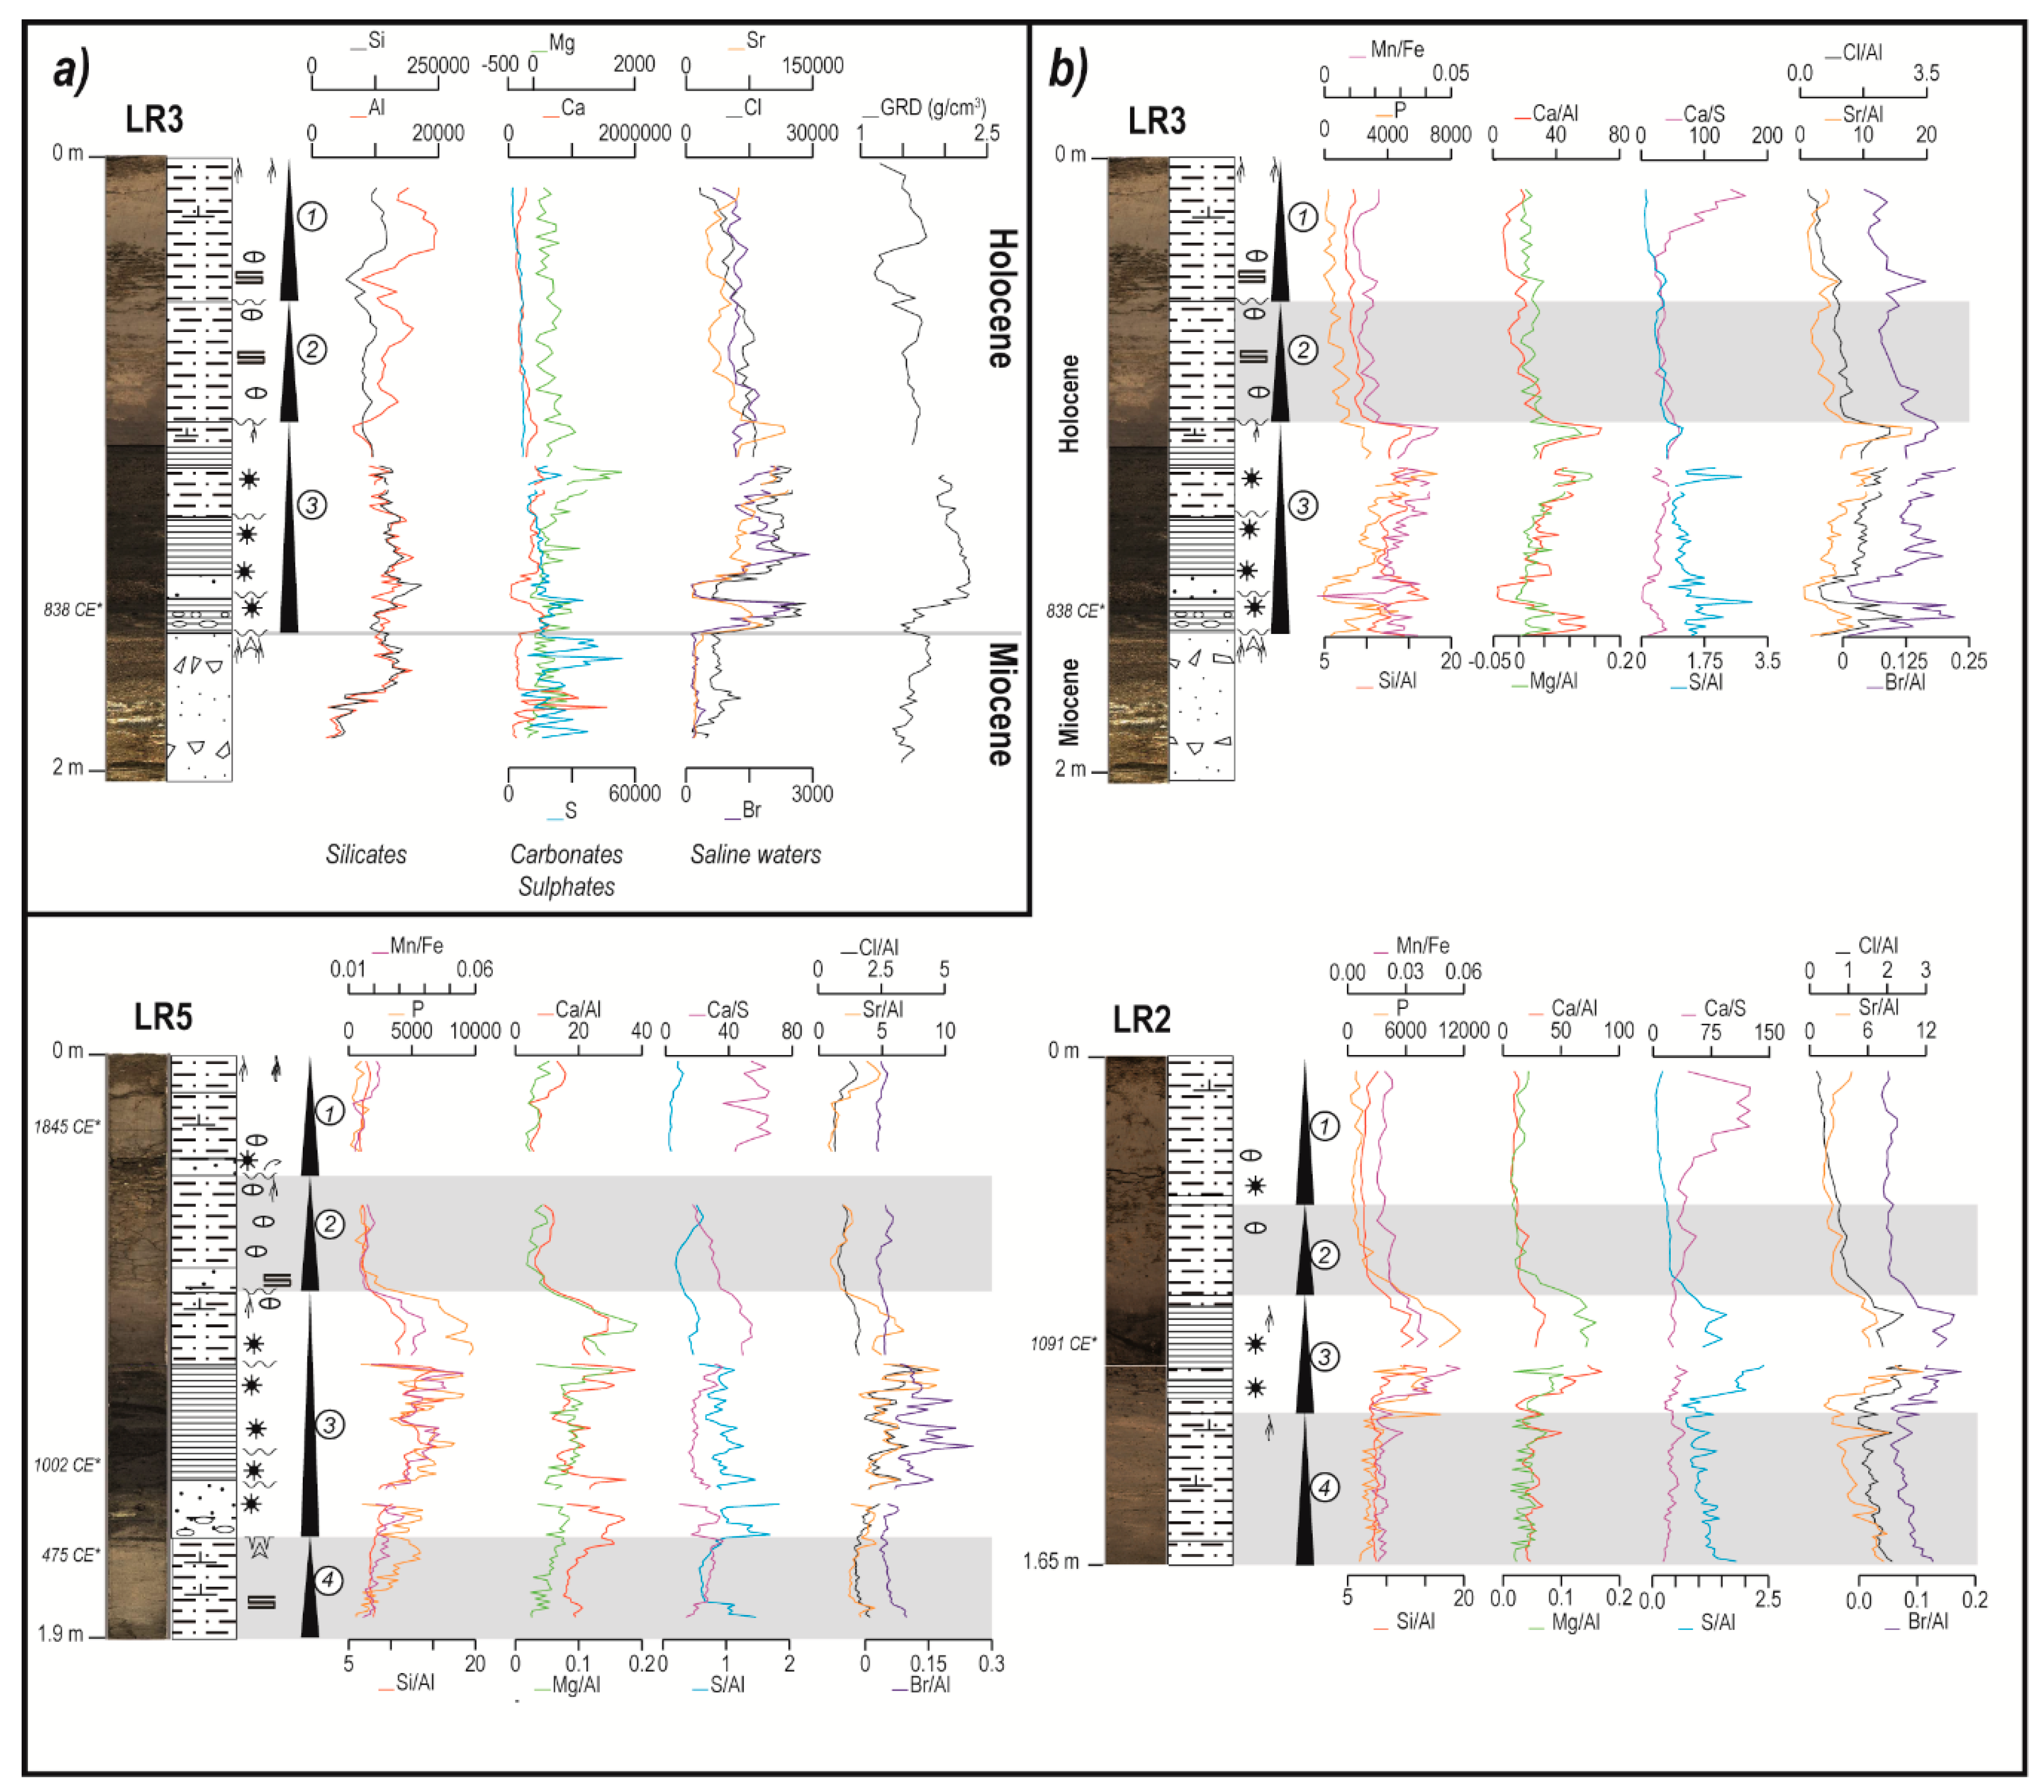
4.2.1. The Miocene/Holocene Boundary
4.2.2. Geochemical Record of the Holocene Sequences
- Sequence 1: Its lower boundary is pinpointed by an increase in Mn/Fe, Ca/Al, Mg/Al, S/Al, Sr/Al, Br/Al and Cl/Al in LR3, which can be related to the initial flooding stage of the sequence, and by a change in trend for P, Si/Al, Ca/S and Sr/Al for LR2, which may be interpreted as the result of the change from drying (Sequence 2) to wetting (Sequence 1) conditions. The uppermost centimetres of the sequence show a slight increase in Sr/Al, Cl/Al and S/Al coeval with a decrease in the Ca/S ratio that could be ascribed to a salinity increase related to the recent drying of the ponds. This sequence is characterized by low values of Si/Al, Mn/Fe and P, which are coherent with its mostly clayey composition and low organic content. The Ca/S ratio increases upwards despite the Si/Al, S/Al, Ca/Al, Mg/Al stand still and Cl/Al, Sr/Al and Br/Al remain the same or show a slow decrease. This implies an increase of Ca that is not due to silicate or gypsum minerals and is compatible with the described increase in calcite due to precipitation from a relatively stable water body.
- Sequence 2: Its lower boundary is marked by a noticeable decrease in the values of all the geochemical parameters in relation to Sequence 3. As compared to Sequences 1 and 3, Sequence 2 shows low values in siliciclastic, organic matter and redox proxies (Si/Al, Mg/Al, Ca/Al, P, Mn/Fe) and saline elements (S/Al, Sr/Al, Cl/Al and Br/Al), as well as in the fresh vs. saline waters ratio (Ca/S), which points to arid conditions (scarce surface water inputs, poorly developed vegetation and evaporative conditions).
- Sequence 3: Its bottom can only be observed in LR2 and LR5 and it is signalled by a noticeable increase, and change in trend, for all the proxies in LR2 and, in LR5, by a break in P and Mn/Fe, a rise in Ca/Al and S/Al, drop in Ca/S and change in trend for Sr/Al, Cl/Al and Br/Al. In relation to Sequences 2 and 4, Sequence 3 shows higher values for all the geochemical proxies which, in addition, shows an increasing upwards trend for the lower part of the sequence followed by progressive (LR2, LR5) or sudden (LR3) decrease of all the values, except for S/Al that shows a continuous decreasing upwards trend. The base of this sequence is characterized by anomalous low values in elements linked to the mineralogical composition (Si/Al, Mg/Al, Ca/Al, etc.), which is due to the incorporation of eroded material from the lower sequence in addition to the sediment supplied by surface water. It is worth mentioning that there is a good peak-to-peak direct correlation amongst all the proxies. The correlation amongst the proxies for surface inputs (Si/Al, P, Mn/Fe) and those related to the presence of saline water (Ca/Al, Mg/Al, Sr/Al, Cl/Al, Br/Al) point to a mixture of both sources but the decrease in S/Al and increase in Ca/S reveal a dilution, so the sediments become less saline higher up.
- Sequence 4: This sequence shows a decrease in all the proxies as compared to Sequence 3. P, Mn/Fe, Mg/Al, Ca/Al and Ca/S have a slightly increasing upwards trend, more evident for LR5 than for LR2, whilst S/Al, Br/Al, Cl/Al and Sr/Al show a decreasing trend. On the other hand, the Si/Al ratio is almost constant in both cores. As compared to Sequence 3, this sequence points to lower surface inputs and a decrease in the of supply saline elements, which is coherent with a drier period; however, in comparison to Sequence 2, the increasing upwards trend of the Ca/S ratio and other ratios seem to point to wetter conditions for that period.
5. Discussion
- (1)
- Clastic sedimentation is related to surface runoff and, therefore, to rainfall episodes.
- (2)
- Chemical sedimentation takes place under the surface of a “stable” water body.
- (3)
- Vegetation development is enhanced by favourable ecological conditions (water availability).
- (4)
- Pedogenesis takes place where/when the water table is below the ground surface.
- (5)
- The sequences cover from the initial flooding stage to the drying out of the pond.
- (6)
- A sequence records a certain number of events (depositional or not) that took place during its recorded period.
- (1)
- An increase in pedogenesis implies a longer total period without a water table above the ground surface.
- (2)
- Chemical sediments suggest a relatively stable water table and warm conditions that increase evaporation and the concentration of solutes.
- (3)
- An increase in clastic sedimentation implies more frequent rainfall episodes.
- (4)
- An increase in organic matter indicates wetter conditions.
- (5)
- The shallowing upwards sequence implies a destruction of accommodation space. This can be achieved by a lowering of the water table (drying out), the rising up of the bottom (silting of the pond) or a combination of the two.
- (6)
- The sequences record the result of a combination of processes at different time scales and the resulting trend shows the long-term evolution of these processes. Thus, the sequences record the cumulative effect of the processes considering their arrangement in time.
6. Conclusions
Author Contributions
Funding
Acknowledgments
Conflicts of Interest
References
- Ramsar Convention Secretariat. An Introduction to the Convention on Wetlands (Previously the Ramsar Convention Manual), 5th ed.; Ramsar Convention Secretariat: Gland, Switzerland, 2016. [Google Scholar]
- Mitra, S.; Wassmann, R.; Vlek, P.L.G. Global Inventory of Wetlands and Their Role in the Carbon Cycle, No. 64; ZEF Discussion Papers on Development Policy, Center for Development Research (ZEF): Bonn, Germany, 2003; pp. 1–44. [Google Scholar]
- Russi, D.; Brink, P.; Farmer, A.; Badura, T.; Coates, D.; Förster, J.; Kumar, R.; Davidson, N. The Economics of Ecosystems and Biodiversity for Water and Wetlands; IEEP: London, UK, 2013; pp. 1–78. [Google Scholar]
- Stacke, T.; Hagemann, S. Development and validation of a global dynamical wetlands extent scheme. Hydrol. Earth Syst. Sci. 2012, 16, 2915–2933. [Google Scholar] [CrossRef] [Green Version]
- Davidson, N.C. How much wetland has the world lost? Long-term and recent trends in global wetland area. Mar. Freshw. Res. 2014, 65, 934–941. [Google Scholar] [CrossRef]
- Comín, F.A.; Alonso, M. Spanish salt lakes: Their chemistry and biota. Hydrobiologia 1988, 158, 237–245. [Google Scholar] [CrossRef]
- Casado, S.; Montes, C. Guía de los Lagos y Humedales de España; J.M. Reyero: Madrid, Spain, 1995; pp. 1–255. [Google Scholar]
- Santisteban, J.I.; Mediavilla, R.; Domínguez-Castro, F.; Gil-García, M.J.; Ruiz-Zapata, M.B.; Dabrio, C.J. From a climate to man-controlled C budget in a temperate wetland (Las Tablas de Daimiel National Park, Central Spain). In Earth: Our Changing Planet, Proceedings of IUGG XXIV General Assembly, Perugia, Italy, 2–13 July 2007; Ubertini, L., Manciola, P., Casadei, S., Grimaldi, S., Eds.; International Union of Geodesy and Geophysics: Perugia, Italy, 2007; p. 1257. [Google Scholar]
- Höbig, N.; Mediavilla, R.; Gibert, L.; Santisteban, J.I.; Cendon, D.I.; Ibáñez, J.; Reicherter, K. Palaeohydrological evolution and implications for paleoclimate since the Late Glacial at Laguna de Fuente de Piedra, southern Spain. Quat. Int. 2016, 407, 29–46. [Google Scholar] [CrossRef]
- Reed, J.M.; Stevenson, A.C.; Juggins, S. A multi-proxy record of Holocene climatic change in southwestern Spain: The Laguna Medina, Cádiz. Holocene 2001, 11, 707–719. [Google Scholar] [CrossRef]
- Martín-Puertas, C.; Valero-Garcés, B.L.; Mata, M.P.; González-Samperiz, P.; Bao, R.; Moreno, A.; Stefanova, V. Arid and humid phases in southern Spainduring the last 4000 years: The Zoñar Lake record, Córdoba. Holocene 2008, 18, 907–921. [Google Scholar] [CrossRef] [Green Version]
- Martín-Puertas, C.; Jiménez-Espejo, F.; Martínez-Ruiz, F.; Nieto-Moreno, V.; Rodrigo, M.; Mata, M.P.; Valero-Garcés, B.L. Late Holocene climate variability in the southwestern Mediterranean region: An integrated marine and terrestrial geochemical approach. Clim. Past 2010, 6, 807–816. [Google Scholar] [CrossRef] [Green Version]
- Valero-Garcés, B.L.; Delgado-Huertas, A.; Navas, A.; Machín, J.; González-Sampériz, P.; Kelts, K. Quaternary palaeohydrological evolution of the playa lake: Salada Mediana, central Ebro Basin, Spain. Sedimentology 2000, 47, 1135–1156. [Google Scholar] [CrossRef]
- Pérez, A.; Luzón, A.; Roc, A.; Soria, A.; Mayayo, M.; Sánchez, J.A. Sedimentary facies distribution and genesis of a recent carbonate-rich saline lake: Gallocanta Lake. Iberian Chain, NE Spain. Sediment. Geol. 2002, 148, 185–202. [Google Scholar] [CrossRef]
- Luzón, A.; Pérez, A.; Mayayo, M.J.; Soria, A.R.; Sánchez, J.A.; Roc, A.C. Palaeogeographical changes since 11,000 yr BP in the Gallocanta lacustrine basin. Iberian Range. NE Spain. Holocene 2007, 17, 649–663. [Google Scholar] [CrossRef]
- Santisteban, J.I.; García del Cura, M.A.; Mediavilla, R.; Dabrio, C.J. Estudio preliminar de los sedimentos recientes de las Lagunas de Villafáfila (Zamora). Geogaceta 2003, 33, 51–54. [Google Scholar]
- López-Sáez, J.A.; Abel-Schaad, D.; Iriarte, E.; Alba-Sánchez, F.; Pérez-Díaz, S.; Guerra-Doce, E.; Delibes de Castro, G.; Abarquero Moras, F.J. Una perspectiva paleoambiental de la explotación de la sal en las Lagunas de Villafáfila (Tierra de Campos, Zamora). Cuatern. Geomorfol. 2017, 31, 73–104. [Google Scholar] [CrossRef]
- Sánchez-López, G.; Hernández, A.; Pla-Rabes, S.; Trigo, R.M.; Toro, M.; Granados, I.; Sáez, A.; Masqué, P.; Pueyo, J.; Rubio-Inglés, M.J.; et al. Climate reconstruction for the last two millennia in central Iberia: The role of East Atlantic (EA), North Atlantic Oscillation (NAO) and their interplay over the Iberian Peninsula. Quat. Sci. Rev. 2016, 149, 135–150. [Google Scholar] [CrossRef] [Green Version]
- Giralt, S.; Moreno, A.; Cacho, I.; Valero-Garcés, B.L. A comprehensive overview of the last 2000 years Iberian Peninsula climate history. CLIVAR Exchanges 2017, 73, 5–10. [Google Scholar]
- Valero-Garcés, B.L.; González-Sampériz, P.; Navas, A.; Machín, J.; Mata, P.; Delgado-Huertas, A.; Bao, R.; Moreno, A.; Carrión, J.S.; Schwalb, A.; et al. Human impact since medieval times and recent ecological restoration in a Mediterranean lake: The Laguna Zoñar, southern Spain. J. Paleolimnol. 2006, 35, 441–465. [Google Scholar] [CrossRef] [Green Version]
- Santisteban, J.I.; Mediavilla, R.; Gil-García, M.J.; Domínguez-Castro, F.; Ruiz-Zapata, M.B. La historia a través de los sedimentos: Cambios climáticos y de usos del suelo en el registro reciente de un humedal mediterráneo (Las Tablas de Daimiel, Ciudad Real). Boletín Geológico Min. 2009, 120, 497–508. [Google Scholar]
- Dubois, N.; Saulnier-Talbot, E.; Mills, K.; Gell, P.; Battarbee, R.; Bennion, H.; Chawchai, S.; Dong, X.; Francus, P.; Flower, R.; et al. First human impacts and responses of aquatic systems: A review of palaeolimnological records from around the world. Anthr. Rev. 2018, 5, 28–67. [Google Scholar] [CrossRef]
- Fuentealba, M.; Latorre, C.; Frugone-Álvarez, M.; Sarricolea, P.; Giralt, S.; Contreras-López, M.; Prego, R.; Bernárdez, P.; Valero-Garcés, B. A combined approach to establishing the timing and magnitude of anthropogenic nutrient alteration in a Mediterranean coastal lake watershed system. Sci. Rep. 2020, 10, 5864. [Google Scholar] [CrossRef] [Green Version]
- Digerfeldt, G.; Almendinger, J.E.; Björk, S. Reconstruction of past lake levels and their relation to groundwater hydrology in the Parkers Prairie sandplain, west-central Minnesota. Palaeogeogr. Palaeoclimatol. Palaeoecol. 1992, 94, 99–118. [Google Scholar] [CrossRef]
- Almendinger, J.E. A groundwater model to explain past lake levels at Parkers Prairie, Minnesota, USA. Holocene 1993, 3, 105–115. [Google Scholar] [CrossRef]
- Donovan, J.J.; Smith, A.J.; Panek, V.A.; Engstrom, D.R.; Ito, E. Climate-driven hydrologic transients in lake sediment records: Calibration of groundwater conditions using 20th Century drought. Quat. Sci. Rev. 2002, 21, 605–624. [Google Scholar] [CrossRef]
- Fritz, S.C. Deciphering climatic history from lake sediments. J. Paleolimnol. 2008, 39, 5–16. [Google Scholar] [CrossRef] [Green Version]
- Nissenbaum, A.; Magaritz, M. Bromine-Rich Groundwater in the Hula Valley, Israel. Naturwissenschaften 1991, 78, 217–218. [Google Scholar] [CrossRef]
- Gómez, J.J.; Lillo, J.; Sahún, B. Naturally occurring arsenic in groundwater and identification of the geochemical sources in the Duero Cenozoic Basin, Spain. Environ. Geol. 2006, 50, 1151–1170. [Google Scholar] [CrossRef]
- Gwynne, R.; Frape, S.; Shouakar-Stash, O.; Love, A. 81Br, 37Cl, and 87Sr studies to assess groundwater flow and solute sources in the southwestern Great Artesian Basin, Australia. Procedia Earth Planet. Sci. 2013, 7, 330–333. [Google Scholar] [CrossRef] [Green Version]
- Pineda Velasco, A.; Salazar Rincón, A.; Herrero Hernández, A.; Camero Benito, Y. Mapa Geológico de España, E. 1:50.000, 2ª Serie (MAGNA). Hoja 427 (Medina del Campo); Instituto Tecnológico Geominero de España: Madrid, Spain, 2007; pp. 1–75. [Google Scholar]
- Fernández Pereira, J.; Rodríguez Arroyo, J.; del Barrio, V.; Ramos, M.A.; Castrillón, M.; Vaquerizo, E.; Trujillo, H.; Hernández, V.; Gómez, S.; Seisdedos, P.; et al. Plan Hidrológico de la parte española de la demarcación hidrográfica del Duero (2015–2021); Memoria. Ministerio de Agricultura, Alimentación y Medio Ambiente, Confederación Hidrográfica del Duero: Valladolid, Spain, 2015; pp. 1–486.
- Nafría García, D.A.; Garrido del Pozo, N.; Álvarez Arias, M.V.; Cubero Jiménez, D.; Fernández Sánchez, M.; VIllarino Barrera, I.; Gutiérrez García, A.; Abia Llera, I. Atlas Agroclimático de Castilla y León; Agencia Estatal de Meteorología: Madrid, Spain, 2013; pp. 1–135. [Google Scholar]
- Mediavilla, R.; Santisteban, J.I.; Borruel-Abadía, V.; López-Cilla, I. Chapter 6. Past and recent sedimentation at the Lagunas Reales and their long-term evolution. In Medina del Campo Case Study; Confederación Hidrográfica del Duero: Valladolid, Spain, under review.
- IGME-DGA. Apoyo a la Caracterización Adicional de las Masas de Agua Subterránea en Riesgo de no Cumplir los Objetivos Medioambientales en 2015. Demarcación Hidrográfica del Duero. Masa de Agua Subterránea 47 Medina del Campo; Ministerio de Ciencia e Innovación/Ministerio de Medio Ambiente y Medio Rural y Marino: Madrid, Spain, 2010; pp. 1–39.
- Alcalá, F.J.; Custodio, E. Using the Cl/Br ratio as a tracer to identify the origin of salinity in aquifers in Spain and Portugal. J. Hydrol. 2008, 359, 189–207. [Google Scholar] [CrossRef]
- Gonzalez Bernáldez, F.; Herrera, P.; Sastre, A.; Rey, J.M.; Vicente, R. Comparación preliminar de los ecosistemas de descarga de aguas subterráneas en las cuencas del Duero y del Tajo. Hidrogeol. Recur. Hidráulicos 1987, 11, 19–39. [Google Scholar]
- González Bernáldez, F. Ecological aspects of wetland/groundwater relationships in Spain. Limnetica 1992, 8, 11–26. [Google Scholar]
- Rey Benayas, J.M.; Pérez, C.; González Bernáldez, F.; Zabaleta, M. Tipología y cartografía de los humedales de las cuencas del Duero y Tajo. Mediterr. Sec. Biol. 1990, 12, 5–26. [Google Scholar]
- Rey Benayas, J.M.; González Bernáldez, F.; Levassor, C.; Peco, B. Vegetation of groundwater discharge sites in the Douro basin, central Spain. J. Veg. Sci. 1990, 1, 461–466. [Google Scholar] [CrossRef]
- Fernández Pérez, L.; Cabrera Lagunilla, M.P. Estudio hidrogeológico de las Lagunas de Villafáfila. In Proceedings of the III Reunión Nacional sobre Geología Ambiental y Ordenación del Territorio, Valencia, Spain; Comunicaciones, I; Serv. Publicaciones Universidad de Valencia: Valencia, Spain, 1987; pp. 441–459. [Google Scholar]
- Armenteros, I.; Huerta, P.; Cidón-Trigo, A.; Rueda-Gualdrón, M.C.; Recio, C.; Martínez-Graña, A. Hidrogeología del entorno de las Lagunas de Villafáfila (Zamora). Geogaceta 2019, 66, 51–54. [Google Scholar]
- Cabestrero, O.; Sanz-Montero, M.E. Brine evolution in two inland evaporative environments: Influence of microbial mats in mineral precipitation. J. Paleolimnol. 2016, 59, 139–157. [Google Scholar] [CrossRef]
- Bronk Ramsey, C. Bayesian analysis of radiocarbon dates. Radiocarbon 2009, 51, 337–360. [Google Scholar] [CrossRef] [Green Version]
- Reimer, P.J.; Bard, E.; Bayliss, A.; Beck, J.W.; Blackwell, P.G.; Bronk Ramsey, C.; Grootes, P.M.; Guilderson, T.P.; Haflidason, H.; Hajdas, I.; et al. IntCal13 and Marine13 Radiocarbon Age Calibration Curves 0–50,000 Years cal BP. Radiocarbon 2013, 55, 1869–1887. [Google Scholar] [CrossRef] [Green Version]
- Calvert, S.E.; Pedersen, T.F. Chapter Fourteen Elemental Proxies for Palaeoclimatic and Palaeoceanographic Variability in Marine Sediments: Interpretation and Application. In Developments in Marine Geology; Hillaire-Marcel, C., De Vernal, A., Eds.; Elsevier: Amsterdam, The Netherlands, 2007; Volume 1, pp. 567–644. [Google Scholar]
- Santisteban, J.I.; Mediavilla, R.; Galán de Frutos, L.; López Cilla, I. Holocene floods in a complex fluvial wetland in central Spain: Environmental variability, climate and time. Glob. Planet. Chang. 2019, 181, 102986. [Google Scholar] [CrossRef]
- Engstrom, D.R.; Hansen, B.C.S. Postglacial vegetational change and soil development in southeastern Labrador as inferred from pollen and chemical stratigraphy. Can. J. Bot. 1985, 63, 543–561. [Google Scholar] [CrossRef]
- Naeher, S.; Gilli, A.; North, R.P.; Hamann, Y.; Schubert, C.J. Tracing bottom water oxygenation with sedimentary Mn/Fe ratios in Lake Zurich, Switzerland. Chem. Geol. 2013, 352, 125–133. [Google Scholar] [CrossRef]
- R Core Team. R. A Language and Environment for Statistical Computing; R Foundation for Statistical Computing: Vienna, Austria, 2020. [Google Scholar]
- Freytet, P.; Plaziat, J.C. Continental Carbonate Sedimentation and Pedogenesis—Late Cretaceous and Early Tertiary of Southern France; Schweizerbart Science Publishers: Stuttgart, Germany, 1982; pp. 1–213. [Google Scholar]
- Wright, V.P. Terrestrial stromatolites and laminar calcretes: A review. Sediment. Geol. 1989, 65, 1–13. [Google Scholar] [CrossRef]
- Mack, G.H.; James, W.C. Paleoclimate and the Global Distribution of Paleosols. J. Geol. 1994, 102, 360–366. [Google Scholar] [CrossRef]
- Kraus, M.J.; Aslan, A. Eocene hydromorphic Paleosols; significance for interpreting ancient floodplain processes. J. Sediment. Res. 1993, 63, 453–463. [Google Scholar]
- Pipujol, M.D.; Buurman, P. Dynamics of iron and calcium carbonate redistribution and palaeohydrology in middle Eocene alluvial paleosols of the southeast Ebro Basin margin (Catalonia, northeast Spain). Palaeogeogr. Palaeoclimatol. Palaeoecol. 1997, 134, 87–107. [Google Scholar] [CrossRef]
- López Merino, L.; López Sáez, J.A.; Alba Sánchez, F.; Pérez Díaz, S.; Abel Schaad, D.; Guerra Doce, E. Estudio polínico de una laguna endorreica en Almenara de Adaja (Valladolid, Meseta Norte): Cambios ambientales y actividad humana durante los últimos 2800 años. Rev. Española Micropaleontol. 2009, 41, 333–347. [Google Scholar]
- Gil-García, M.J.; Ruiz Zapata, M.B.; Santisteban, J.I.; Mediavilla, R.; López-Pamo, E.; Dabrio, C.J. Late Holocene environments in Las Tablas de Daimiel (south central Iberian Peninsula, Spain). Veg. Hist. Archaeobot. 2007, 16, 241–250. [Google Scholar] [CrossRef] [Green Version]
- Currás, A.; Zamora, L.; Reed, J.M.; García-Soto, E.; Ferrero, S.; Armengol, X.; Mezquita-Joanes, F.; Marqués, M.A.; Riera, S.; Julià, R. Climate change and human impact in central Spain during Roman times: High-resolution multi-proxy analysis of a tufa lake record (Somolinos, 1280 m asl). Catena 2012, 89, 31–53. [Google Scholar] [CrossRef] [Green Version]
- Andreu-Hayles, L.; Ummenhofer, C.C.; Barriendos, M.; Schleser, G.H.; Helle, G.; Leuenberger, M.; Gutiérrez, E.; Cook, E.R. 400 Years of summer hydroclimate from stable isotopes in Iberian trees. Clim. Dyn. 2017, 49, 143–161. [Google Scholar] [CrossRef] [Green Version]
- Grove, A.T. The “Little Ice Age” and its geomorphological consequences in Mediterranean Europe. Clim. Chang. 2001, 48, 121–136. [Google Scholar] [CrossRef]
- Domínguez-Castro, F.; Santisteban, J.I.; Barriendos, M.; Mediavilla, R. Reconstruction of drought episodes for central Spain from rogation ceremonies recorded at the Toledo Cathedral from 1506 to 1900: A methodological approach. Glob. Planet. Chang. 2008, 63, 230–242. [Google Scholar] [CrossRef] [Green Version]
- Loisel, J.; MacDonald, G.M.; Thomson, M.J. Little Ice Age climatic erraticism as an analogue for future enhanced hydroclimatic variability across the American Southwest. PLoS ONE 2017, 12, e0186282. [Google Scholar] [CrossRef] [Green Version]
- Oliva, M.; Ruiz-Fernández, J.; Barriendos, M.; Benito, G.; Cuadrat, J.M.; Domínguez-Castro, F.; Garcia-Ruiz, J.M.; Giralt, S.; Gómez-Ortiz, A.; Hernández, A.; et al. The Little Ice Age in Iberian mountains. Earth-Sci. Rev. 2018, 177, 175–208. [Google Scholar] [CrossRef]
- Moreno, A.; Pérez, A.; Frigola, J.; Nieto-Moreno, V.; Rodrigo-Gámiz, M.; Martrat, B.; González-Sampériz, P.; Morellón, M.; Martín-Puertas, C.; Corella, J.P.; et al. The medieval climate Anomaly in the Iberian Peninsula reconstructed from marine and lake records. Quat. Sci. Rev. 2012, 43, 16–32. [Google Scholar] [CrossRef]
- Digerfeldt, G. Reconstruction and regional correlation of Holocene lake-level fluctuations in Lake Bysjön, South Sweden. Boreas 1988, 17, 165–182. [Google Scholar] [CrossRef]
- Harrison, S.P.; Digerfeldt, G. European lakes as palaeohydrological and palaeoclimatic indicators. Quat. Sci. Rev. 1993, 12, 233–248. [Google Scholar] [CrossRef]
- Telford, R.J.; Lamb, H.F.; Umer Mohammed, M. Diatom-derived palaeoconductivity estimates for Lake Awassa, Ethiopia: Evidence for pulsed inflows of saline groundwater? J. Paleolimnol. 1999, 21, 409–421. [Google Scholar] [CrossRef]
- Fritz, S.C.; Ito, E.; Yu, Z.; Laird, K.R.; Engstrom, D.R. Hydrologic Variation in the Northern Great Plains During the Last Two Millennia. Quat. Res. 2000, 53, 175–184. [Google Scholar] [CrossRef]
- Finney, B.P.; Bigelow, N.H.; Barber, V.A.; Edwards, M.E. Holocene climate change and carbon cycling in a groundwater-fed, boreal forest lake: Dune Lake, Alaska. J. Paleolimnol. 2012, 48, 43–54. [Google Scholar] [CrossRef]
- Li, B.; Rodell, M. Evaluation of a model-based groundwater drought indicator in the conterminous U.S. J. Hydrol. 2015, 526, 78–88. [Google Scholar] [CrossRef] [Green Version]
- Rust, W.; Holman, I.; Corstanje, R.; Bloomfield, J.; Cuthbert, K. A conceptual model for climate teleconnection signal control on groundwater variability in Europe. Earth-Sci. Rev. 2018, 177, 164–174. [Google Scholar] [CrossRef]
- Sø, H.U.; Postma, D.; Lan, V.M.; Trang, P.T.K.; Kazmierczak, J.; Nga, D.V.; Pi, K.; Koch, C.B.; Viet, P.H.; Jakobsen, R. Arsenic in Holocene aquifers of the Red River floodplain, Vietnam: Effects of sediment-water interactions, sediment burial age and groundwater residence time. Geochim. Cosmochim. Acta 2018, 225, 192–209. [Google Scholar] [CrossRef]
- Wang, Y.; Pi, K.; Fendorf, S.; Deng, Y.; Xie, X. Sedimentogenesis and hydrobiogeochemistry of high arsenic Late Pleistocene-Holocene aquifer systems. Earth-Sci. Rev. 2019, 189, 79–98. [Google Scholar] [CrossRef]
- Cook, P.G.; Böhlke, J.K. Determining Timescales for Groundwater Flow and Solute Transport. In Environmental Tracers in Subsurface Hydrology; Cook, P.G., Herczeg, A.L., Eds.; Springer: Boston, MA, USA, 2000; pp. 1–30. [Google Scholar]
- Custodio, E. Las aguas subterráneas como elemento básico de la existencia de numerosos humedales. Ing. Agua 2010, 17, 119–135. [Google Scholar] [CrossRef] [Green Version]
- Parsons, D.F.; Hayashi, M.; van der Kamp, G. Infiltration and solute transport under a seasonal wetland: Bromide tracer experiments in Saskatoon, Canada. Hydrol. Process. 2002, 18, 2011–2027. [Google Scholar] [CrossRef]
- Pigati, J.S.; Rech, J.A.; Quade, J.; Bright, J. Desert wetlands in the geologic record. Earth-Sci. Rev. 2014, 132, 67–81. [Google Scholar] [CrossRef]


| N-64 | Balneario Las Salinas | N-61 | PZ 02.17.25 | |
|---|---|---|---|---|
| Depth (m) | 61 | 20 | 71 | 120 |
| Sample date | 31 January 2000 | 18 October 2005 | 03 February 2000 | 24 May 2007 |
| pH | 9.56 | 8.51 | 7.30 | 7.82 |
| Conductivity (20 °C) µS/cm | 918.00 | 1425.00 | 300.00 | 490.00 |
| Alkalinity mg/L CaCO3 | 124.90 | 209.70 | 62.40 | 173.72 |
| Cl− mg/L | 175.30 | 266.20 | 43.80 | 57.35 |
| CO32− mg/L | 98.00 | <5.00 | ||
| HCO3− mg/L | 26.90 | 137.30 | 62.40 | 211.81 |
| PO43− mg/L | 0.65 | <0.05 | 0.12 | 0.73 |
| Ca2+ mg/L | 1.90 | 116.70 | 25.80 | 48.42 |
| Mg2+ mg/L | 1.04 | 26.80 | 2.90 | 5.86 |
| Na+ mg/L | 216.70 | 163.30 | 39.40 | 46.21 |
| K+ mg/L | 3.40 | 5.90 | 2.30 | 1.33 |
| NH4+ mg/L | 0.07 | 0.09 | 0.04 | <0.04 |
| NO2− mg/L | 0.42 | <0.04 | ||
| NO3− mg/L | 26.81 | 10.10 | 0.00 | 8.30 |
| Fe mg/L | 0.56 | <0.01 | 0.09 | <0.05 |
| Mn mg/L | 0.03 | 0.32 | 0.00 | <0.02 |
| Zn mg/L | 0.05 | 0.00 | ||
| SiO2 mg/L | 18.19 | 23.43 | ||
| SO42− mg/L | 139.50 | 23.00 | 14.11 | |
| Sr mg/L | 1.97 |
| Lab. Number | Sample Name | 14C Age Year (BP) | 1σ Range cal. Age (CE/BCE) | 2σ Range cal. Age (CE/BCE) |
|---|---|---|---|---|
| GdA-5576 | LR2-1/91–95 cm | 945 ± 30 | 1082–1128 CE | 1025–1157 CE |
| GdA-5577 | LR2-4/192–196 cm | 2315 ± 30 | 403–376 BCE | 412–356 BCE |
| GdA-5578 | LR3-2/145.5–147.5 cm | 1170 ± 30 | 855–894 CE | 772–904 CE |
| GdA-5579 | LR5-1/22.5–26.5 cm | 135 ± 20 | 1834–1878 CE | 1799–1890 CE |
| GdA-5580 | LR5-3/133–136 cm | 1030 ± 30 | 989–1023 CE | 962–1042 CE |
| GdA-5581 | LR5-5/161–165 cm | 1585 ± 35 | 486–535 CE | 400–550 CE |
© 2020 by the authors. Licensee MDPI, Basel, Switzerland. This article is an open access article distributed under the terms and conditions of the Creative Commons Attribution (CC BY) license (http://creativecommons.org/licenses/by/4.0/).
Share and Cite
Mediavilla, R.; Santisteban, J.I.; López-Cilla, I.; Galán de Frutos, L.; de la Hera-Portillo, Á. Climate-Dependent Groundwater Discharge on Semi-Arid Inland Ephemeral Wetlands: Lessons from Holocene Sediments of Lagunas Reales in Central Spain. Water 2020, 12, 1911. https://doi.org/10.3390/w12071911
Mediavilla R, Santisteban JI, López-Cilla I, Galán de Frutos L, de la Hera-Portillo Á. Climate-Dependent Groundwater Discharge on Semi-Arid Inland Ephemeral Wetlands: Lessons from Holocene Sediments of Lagunas Reales in Central Spain. Water. 2020; 12(7):1911. https://doi.org/10.3390/w12071911
Chicago/Turabian StyleMediavilla, Rosa, Juan I. Santisteban, Ignacio López-Cilla, Luis Galán de Frutos, and África de la Hera-Portillo. 2020. "Climate-Dependent Groundwater Discharge on Semi-Arid Inland Ephemeral Wetlands: Lessons from Holocene Sediments of Lagunas Reales in Central Spain" Water 12, no. 7: 1911. https://doi.org/10.3390/w12071911