Article

Using Chlorophyll a Fluorescence Imaging to Select Desiccation-Tolerant Native Moss Species for Water-Sustainable Green Roofs

by
Ricardo Cruz de Carvalho
1,2,*,
Teresa Afonso do Paço
3,4,
Cristina Branquinho
1 and
Jorge Marques da Silva
5
1
cE3c, Centre for Ecology, Evolution and Environmental Changes, Faculty of Sciences, University of Lisbon, Campo Grande, Edifício C2, Piso 5, 1749-016 Lisbon, Portugal
2
MARE–Marine and Environmental Sciences Centre, Faculty of Sciences, University of Lisbon, Campo Grande, Edifício C2, Piso 5, 1749-016 Lisbon, Portugal
3
Department of Biosystems Engineering, Institute of Agronomy, University of Lisbon, Tapada da Ajuda, 1349-017 Lisbon, Portugal
4
Linking Landscape, Environment, Agriculture and Food (LEAF), Institute of Agronomy, University of Lisbon, Tapada de Ajuda, 1349-017 Lisbon, Portugal
5
BioISI, Biosystems and Integrative Sciences Institute and Plant Biology Department, Faculty of Sciences, University of Lisbon, Campo Grande, Edifício C2, Piso 4, 1749-016 Lisbon, Portugal
*
Author to whom correspondence should be addressed.
Water 2020, 12(6), 1748; https://doi.org/10.3390/w12061748
Submission received: 1 May 2020 / Revised: 5 June 2020 / Accepted: 17 June 2020 / Published: 19 June 2020

Abstract

:
Green roofs have been more thoroughly investigated in the last few years due to the potential benefits they offer to ecosystems in urban areas (e.g., carbon sequestration, particle retention, heat island effect attenuation). However, current climate change models predict an increase in desertification, with an increase in temperature and decrease in rainfall, which means there is an increasing demand for green roofs with lower water consumption. Vegetation with very little water requirements, such as desiccation-tolerant mosses, has shown a potential to complement or substitute for vascular species, increasing the sustainability of lower water use in green roofs. In this study, we use chlorophyll a fluorescence imaging to screen for bryophytes with adequate physiology to be used in green roofs placed in at-risk areas with prolonged drought episodes. Apart from Hypnum cupressiforme, all selected species presented a high potential for use in those conditions, particularly Didymodon fallax, Grimmia lisae, Pleurochaete squarrosa, and Targionia hypophylla. Chlorophyll a fluorescence imaging technology proved to be a simple and non-invasive tool for a fast screening of these poikilohydric organisms, to be used in future studies of bryophyte biology, but more importantly in the green roof industry.

1. Introduction

Green roofs consist of plant-based structures that are placed on a waterproof layer on top of residences, factories, offices, and other buildings increasing the services provided by green spaces in urban areas [1,2,3,4,5,6]. In addition to an improvement of urban aesthetics, green roofs attenuate flood effects, increasing the retention time of rainwater [5,7]. Furthermore, they contribute to the thermal regulation of buildings and reduce the urban heat island effect, as well as mitigating heat loss during the winter [8,9]. Other important contributions include biodiversity conservation, increased carbon sequestration, air quality improvement, soundproofing for building interiors, increased roof durability, and an ability to slow down the spread of potential fires [10,11,12,13].
The increased popularity of green roofs began in northern Europe, in areas with cold and humid climates (e.g., Germany, Netherlands). These environments enabled easier maintenance of these structures at a low cost without resorting to irrigation [9]. However, in the Mediterranean area or in regions with similar latitudes (e.g., California, south-western Australia, South Africa, Chile), characterized by hot and dry summers, the use of classical green roofs requires irrigation, to maintain both plant survival and aesthetic quality [14].
However, the need for watering can make green roofs economically non-viable, jeopardizing the objective of optimizing energy consumption for building acclimatization [15]. The possible economic advantages of green roofs depend on them being low cost, sustainable, and absent of high maintenance requirements. Moreover, converting older buildings to support green roofs would be extremely difficult, due to the overwhelming costs of structural adaptations to include irrigation systems.
In desert areas, it is very difficult for plants to survive due to low precipitation. However, these areas are covered with biological soil crusts (biocrusts), a complex mosaic of poikilohydric organisms, including cyanobacteria, green algae, lichens, mosses, microfungi, and bacteria. Cyanobacteria weave filaments to create a matrix that aggregates, protects, and stabilizes soil surfaces, creating conditions that allow the establishment of other higher organisms such as lichens and mosses [16,17]. The green covers arose as a potential solution, allowing green roofs to be compatible with the harsh conditions of urban centers. Although lichens are, at present, impossible to produce artificially and cyanobacteria are highly dynamic throughout time, mosses appear to be the most stable option for these covers. Mosses from these harsh environments can photosynthesize when water is available but, in drought conditions, they undergo extensive desiccation and their entire metabolism ceases. Desiccated mosses remain dormant for months and years, returning to normal function upon rehydration, presenting a spectrum of desiccation tolerance (DT) [18,19,20,21]. Moreover, mosses can retain water up to 8–10 times their dry weight, allowing for a self-sustained growth [7,22]. More importantly, this water retention makes them a viable candidate for attenuating the effects of flash floods, which are becoming more frequent due to climate change. Furthermore, mosses do not have roots but instead grow in a very thin substrate layer, decreasing the weight load on architectural structures, and allowing them to be tested on steeper surfaces, such as walls. They can also be used in traditional green roofs acting as a filler in between vascular plants, increasing the overall system performance of green roofs regarding water consumption [23,24].
Photosynthesis is the key metabolic process for photoautotrophic organisms. The in vivo measurement of the chlorophyll a fluorescence provides a long-established and non-invasive method for assessing photosynthetic activity [25]. The introduction of imaging technologies to the in vivo chlorophyll a fluorescence measurement allowed to obtain spatial (topographic) representations of photosynthetic activity over a biological surface. Furthermore, this combined approach is an effective method, fostering for screening organisms/samples with different photosynthetic performance, as well as providing a lower-cost and faster tool for establishing user-made systems [26,27].
Under the current climate change, water will be available based on location, seasonality, and/or intensity of rainfall, with the Mediterranean region being the most cause for concern [28]. In our previous approach [29], we used Ellenberg’s ecological preference values, which is a system based on the ordinal classification of plants, according to the position of their actual ecological niche along an environmental gradient (light, temperature, and humidity) [30]. These preference values were used to select moss species most adequate for Mediterranean green roofs. Selecting the Ellenberg’s values typical for the Mediterranean climate (light: 8–9 (light-loving and full-light plants); temperature: 8–9 (Mediterranean and sub-Mediterranean plants); and humidity: 1–3 (extreme dryness to moderately dry sites)) and analyzing their life form, growth form, and lifestyle [31,32], a table of moss species with potential use in Mediterranean green roofs was generated [29]. From that list of potential bryophytes that naturally occur in harsh environmental conditions, we selected some of the most cosmopolitan species in the Mediterranean. Those species were tested with the non-invasive chlorophyll a fluorescence imaging technique, allowing the analyses of the photosynthetic fitness over desiccation and rehydration cycles.

2. Materials and Methods

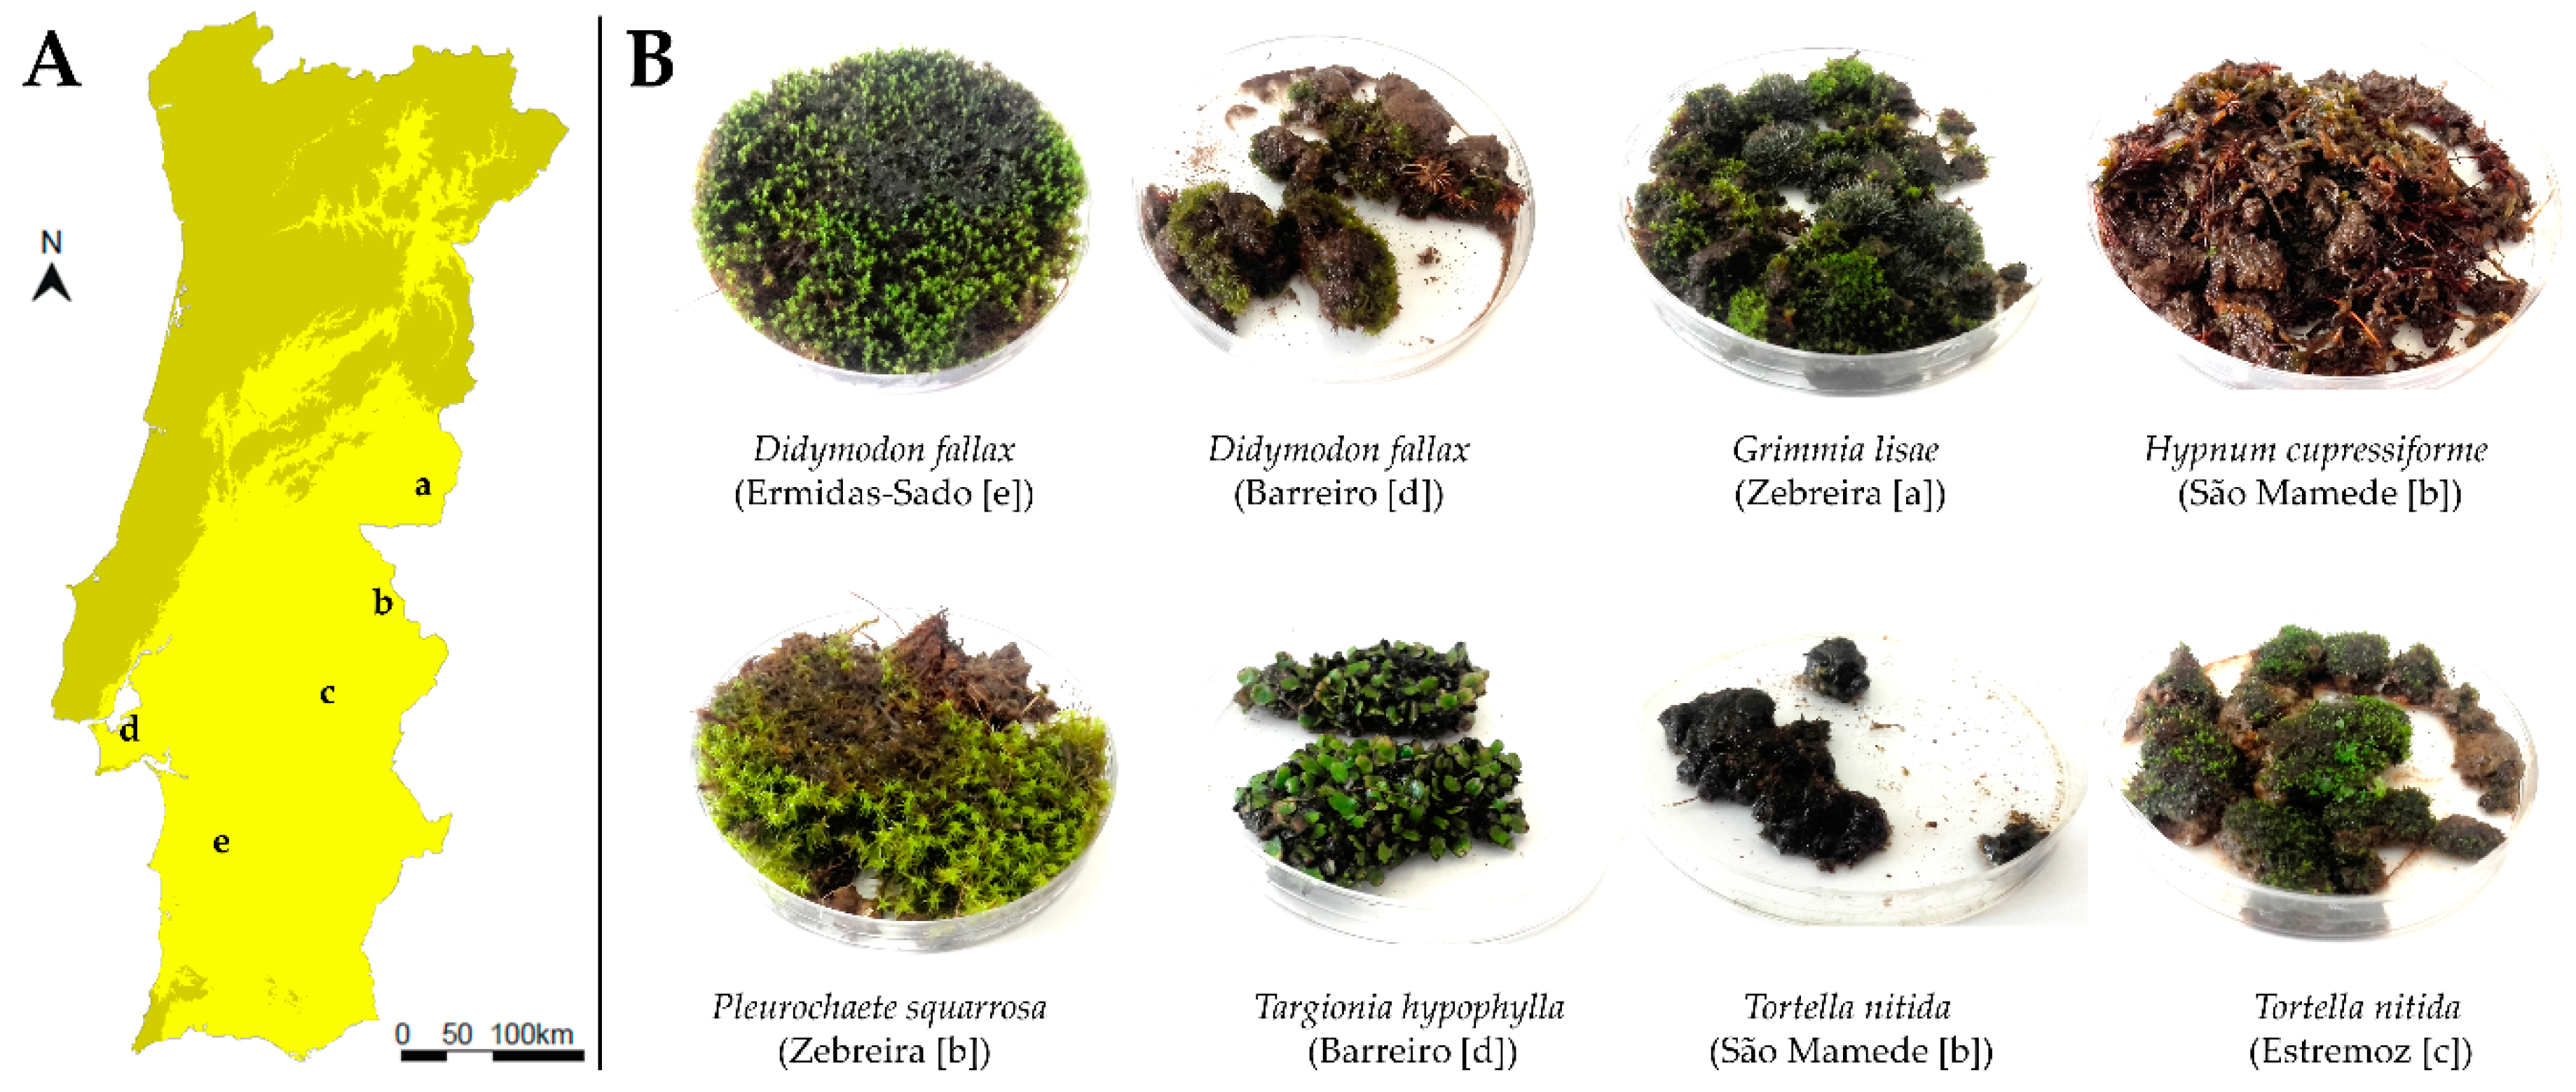
2.1. Biological Material

Bryophytes were selected and collected from harsh environmental conditions (roadsides, sun-exposed walls) in dry sub-humid (Alegrete, Parque Natural de São Mamede) to semiarid (Zebreira, Beira Baixa; Estremoz, Alto Alentejo; Barreiro, Setúbal; and Ermidas-Sado, Baixo Alentejo) areas, in both natural and urban locations (Figure 1A). Bryophyte selection included isolating colony patches of four different mosses that were selected from our previous work [29] (Table 1): Didymodon fallax (Hedw.) R. H. Zander (high (Barreiro) and low (Ermidas-Sado) human population densities), Grimmia lisae De Not., Pleurochaete squarrosa (Brid.) Lindb., and Tortella nitida (Lindb.) Broth. from urban and natural environments (Figure 1B). Although not on the list the mosses [29], Hypnum cupressiforme Hedw. and the liverwort Targionia hypophylla L. were selected as a less DT and more DT species, respectively, to explore their potential use in green walls, since they can grow on any surface regardless of structural orientation.
Samples were collected dry and stored in paper bags until analysis (3 months later) as per normal practice [34].

2.2. Experimental Design

Throughout the experiment, samples were kept in 8 cm Petri dishes in a growth chamber (ARALAB, Portugal) under controlled conditions of light (circa 100 µmol m−2 s−1), temperature (18 °C), relative humidity (50%), and photoperiod (16 h/8 h, day/night). After dry samples were weighed (T0), chlorophyll a fluorescence was measured (for details see the section below) bryophytes were rehydrated afterward with 50 mL of distilled water. Measurements were also taken after 3 (T3), 6 (T6), and 10 (T10) days, keeping the samples hydrated in Petri dishes partly closed during this period, avoiding water evaporation and, thus, desiccation. Afterward, samples were dried for 3 days with the Petri dishes fully opened. When samples reached the same weight as T0, i.e., at the end of the drying process (T13), measurements were taken and then the mosses were rehydrated with 50 mL of distilled water. Measurements were taken after 1 h (Rh1h) and 1 day (Rh1d), keeping the Petri dishes partly closed and samples hydrated (Figure 2).

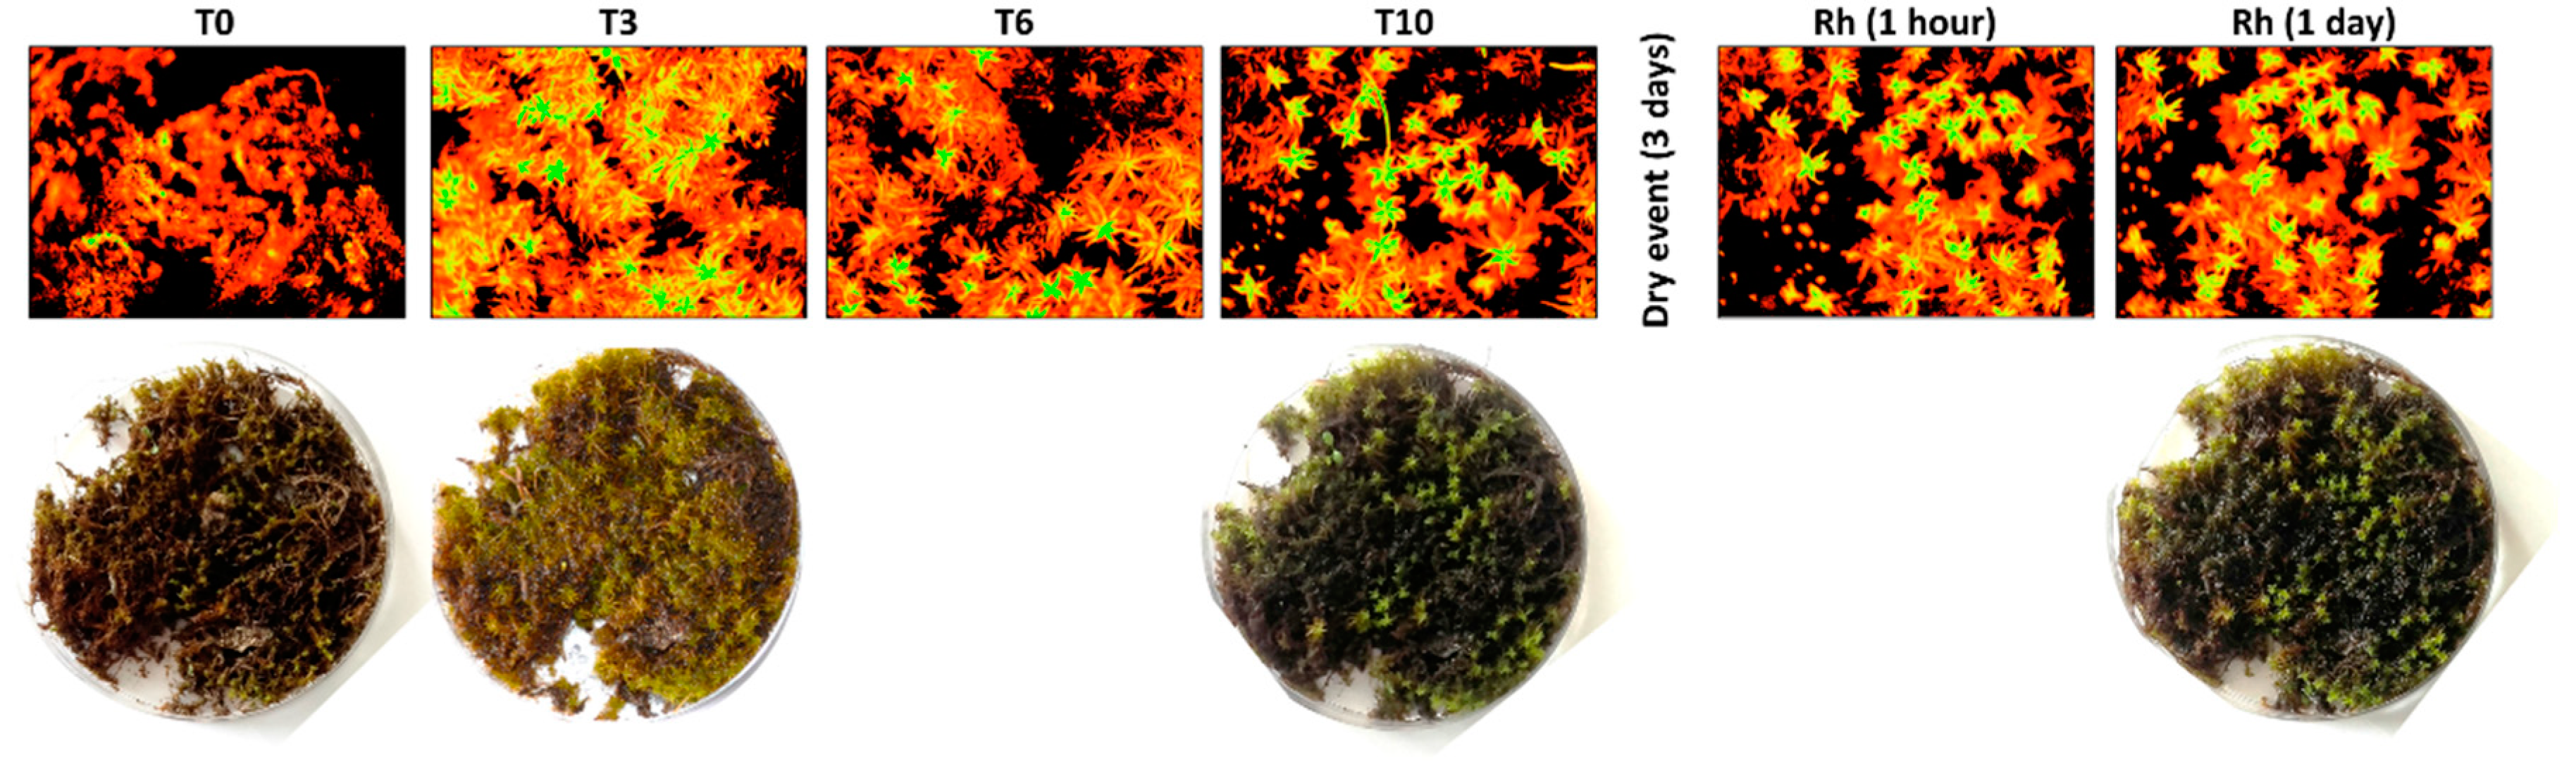
2.3. Imaging Pulse Amplitude Modulated Chlorophyll a Fluorescence

Imaging pulse-amplitude-modulated chlorophyll a fluorescence measurements were performed using the Mini Version of Imaging-PAM M-Series (Walz GmbH) which comprised an IMAGE-K5 1/2′′ CCD camera (640 × 480 pixel resolution) with a 16 mm objective (Allied Vision Technologies GmbH, Stadtroda, Germany). The stage works at a fixed working distance and comprises a 24 × 32 mm area, illuminated by a Luxeon Light-Emitting Diode (LED) array (460 nm) of 12 high-power LEDs divided into four groups and equipped with short-pass filters and providing the measuring beam, the actinic light, and the saturation light pulses. After 5 minutes of dark-adaptation, a saturation pulse with an intensity of 6000 µmol photons m−2 s−1 for 0.8 s and the measuring pulse frequency of 8 Hz was applied, allowing the measurement of the dark-adapted samples for their maximum (Fm) and minimum (Fo) fluorescence values, respectively. In turn, the maximum photochemical efficiency of photosystem II (PSII) (Fv/Fm), a ratio that can be used as an indicator of the photosynthetic fitness, was calculated [35]. Furthermore, the electron transport rate (ETR), which reflects the energy used in photosynthesis, and the non-photochemical quenching (NPQ/4), which provides information on the dissipative mechanisms of photosynthesis (mostly through heat) [35,36,37], were determined by applying a blue actinic light (111 µmol photons m−2 s−1) for 5 minutes, followed by a new saturating light pulse. Rapid light curves (RLCs) were constructed by calculating the relative electron transport rate (rETR) for each level of actinic light (E) using the formula rETR = E × ΔF/Fm′. The RLC consisted of exposing the samples to ten incremental intensities of actinic light: 0, 32, 61, 111, 145, 223, 320, 402, 624, 1270, and 2000 µmol photons m−2 s−1, each with a 30 s irradiance step. Afterward, the model of Platt and colleagues [38] was applied to characterize the light response of the rETR vs. E curves, estimating the parameters of α (initial slope of the light curve indicative of photosynthetic efficiency), β (photoinhibition), rETRmax (maximum rETR), and Ek (light saturation value). The model was fitted through the application of Microsoft Excel Solver (curve fits with r > 0.95). Numerical values and images of the chlorophyll a fluorescence parameters were obtained from the digital images using analytical software (Imaging Win v.2.41, Walz GmbH, Effeltrich, Germany). For each species, five shoots were selected with the software.

2.4. Statistical Analysis

For each variable considered in this study, differences among species within each assayed day were evaluated through one-way ANOVA with Tukey’s multiple comparisons test (GraphPad Prism 6.03 for Windows, GraphPad Software, San Diego, CA, USA) and are presented in Supplemental Data.

3. Results

Chlorophyll a fluorescence analysis shows that, in general, recovery was very similar for all bryophytes, except for H. cupressiforme, which had a slower recovery, reaching their optimal performance at T6. Although still in good condition, at T10 the differences among species increased in number and complexity (see statistical differences among species in Tables S1–S7 in Supplemental Data). When the samples were dry at T0 and T13 chlorophyll a fluorescence was absent in all samples.
Regarding the maximum quantum efficiency of PSII (Fv/Fm; Table 2A), a widely used parameter to evaluate photosynthetic fitness, at T3 there were four species (D. fallax (B), G. lisae, P. squarrosa, T. hypophylla) that presented values between 0.6–0.7 corresponding to 80–90% recovery of the reference unstressed value of 0.75 for mosses [18,39]. The exceptions were T. nitida and H. cupressiforme, which only recovered to those values at T6 and T10, respectively.
In the case of the electron transport rate (ETR; Table 2B), the trend was very similar, but as observed previously, H. cupressiforme showed the lowest performance at T3. Nevertheless, at T6, the ETR of all the analyzed species was fully recovered, with the liverwort, T. hypophylla, presenting the highest value (36 µmol m−2 s−1). However, after 10 days of constant rehydration, some of the most tolerant species (D. fallax (B), G. lisae, T. hypophylla, P. squarrosa) started to demonstrate a statistically significant decrease in ETR (circa 20 µmol m−2 s−1), compared with the values at T6 (circa 16 µmol m−2 s−1).
Non-photochemical quenching (NPQ/4; Table 2C) presented the highest values in T. hypophylla and P. squarrosa at T3, decreasing drastically at T6, but increasing to more typical values at T10. A similar pattern was also observed for D. fallax, whilst for the remaining species, NPQ/4 increased throughout the hydration period.
The parameters measured in the rapid light curves (RLC) allowed further analysis of the response of the selected bryophytes in the hydration–dehydration cycles. The photosynthetic efficiency (α; Table 3A) pattern was very similar to the one observed for Fv/Fm in all species. The lower photosynthetic performance of H. cupressiforme at T3 seems to be due to the higher photoinhibitory response (β; Table 3B), which decreased over time, in contrast with the other species, where it consistently increased over time.
Regarding the maximum relative electron transport rate (rETRmax; Table 3C), an increase between T3 and T6 was observed, but, after 10 days of rehydration, the six species presented very similar values (circa 20 µmol m−2 s−1).
This previously observed photoinhibitory effect (Table 3B) is further confirmed by the general decrease of saturating irradiance (Ek; Table 3D) over the hydration period (again, except for H. cupressiforme). At T10, most bryophytes reached their saturating light at values around 100–125 µmol m−2 s−1, but D. fallax (Barreiro) and G. lisae (Zebreira), which grow in full light-exposed sites, showed values closer to 175 µmol m−2 s−1.
Following a 3 days desiccation event, again no photosynthetic activity was detected in bryophytes, with no measurable chlorophyll a fluorescence (T13). After 1 h of rehydration (T13 + 1 h), all parameters showed values lower than those measured at T10, except for T. hypophylla which presented a higher rETRmax (Table 3C), and T. nitida (E) which presented no photosynthetic activity at this recovery point (Table 2 and Table 3, T13 + 1 h). However, after 24 h of recovery, most species have recovered up to 90% the values measured at T6, regarding Fv/Fm (Table 2A, T14) and α (Table 3A, T14), but with decreases in ETR (Table 2B) and Ek (Table 3C), and, thus, showing higher values of non-photochemical quenching (Table 2C) and photoinhibition (Table 3D). Overall, the species that showed greatest differences were H. cupressiforme and T. nitida (E) (see statistical differences among species in Tables S1–S7 in Supplemental Data) presenting the lowest performances when compared with the remaining species.

4. Discussion

In recent years, commercial green surfaces have included mosses such as Tortula muralis and Bryum argenteum, selected intuitively without scientific criteria [40]. Although these mosses have been described as desiccation tolerant, not all bryophytes perform equally in the face of desiccation. The varying degrees of tolerance exist along a large spectrum, where the velocity of desiccation plays a major role, and where highly desiccation-tolerant species could withstand higher rates of water loss [41]. This might be due to the presence of constitutive desiccation tolerance mechanisms in these species, in contrast with the inducible tolerance mechanisms in less tolerant species [20,42]. On the other hand, desiccation-tolerant species are dependent on the alternation of dehydration–rehydration cycles, in a manner still not fully understood [21,43]. Nevertheless, their presence in green roofs contributes to sustainable irrigation of green roofs, particularly in areas with Mediterranean-like climates [23,24].
The most desiccation-tolerant species in this study (T. hypophylla and P. squarrosa) can maintain high values of photosynthetic fitness after desiccation/rehydration events, to which they are daily exposed in natural environments. These conditions require them to survive the excess irradiance, which indicates that these are good candidates to survive the harsh conditions of a Mediterranean green roof with lower irrigation requirements. In the case of P. squarrosa, the data further confirms its high adaptability and tolerance to sparse water supply, which has been observed previously in green roof-like conditions [23,24]. For the other species, photoinhibition increases with time, which indicates a high relative acclimation to the optimal growth chamber conditions and possibly a concomitant decrease in the effectiveness of their desiccation tolerance mechanisms. This information could also indicate that an increase in the growth rate may be achieved from within the growth chambers’ optimal conditions, as found in other bryophytes [44], which may allow for an increase in the production speed of green roof installations. However, the use of growth chambers may also require a later increase of the dehydration/rehydration acclimation cycles before the organisms can be applied to green roof settings.
The species H. cupressiforme and T. nitida were the ones that negatively stood out from the other species. The first is a species that thrives in moist environments, taking more time to recover after desiccation (at least 10 days). Although this moss has a higher demand for irrigation, it could still be used for other architectural purposes such as shaded vertical walls, since it presents a pleurocarpic life form (matt-like structure) that is ideal for higher surface coverage. On the other hand, T. nitida, although presenting lower levels of photosynthetic performance than the more DT species, had a higher performance than H. cupressiforme, so it may still be considered as a possible desiccation-tolerant option for green roofs.
Furthermore, after 10 days of constant rehydration, some of the most tolerant species (D. fallax, G. lisae, T. hypophylla, P. squarrosa) started to demonstrate a decrease in photosynthetic activity (as shown by the decrease in ETR) indicating that hydration for more than a few days is not suitable for these species, increasing photoinhibition and non-photochemical quenching processes. In fact, during the hot and dry Mediterranean summers, these mosses lose their bright green color and turn dark-green-brown [24]. The color change of these mosses is caused by the loss of all cellular water and the consequential shutdown of their metabolic processes [18,20,41,42,43,44] that allow them to tolerate the high temperature and solar radiation of this season. Their tolerance of these extreme conditions makes them an ideal candidate for green roof application [21]. However, during the cold and wet winters typical of the Mediterranean these species could be prevented from going through the hydration–desiccation cycles that seem to be important in maintaining their photochemical performance. Nevertheless, this does not seem to hinder the ability of these species to be used in green roofs, since these structures are built with a draining system that prevents the accumulation of water on the surface [1].
The introduction of imaging technologies, such as the long-established chlorophyll a fluorescence measurement [25], a non-invasive technique that allows obtaining topographic representations of photosynthesis over a biological surface, allows the screening for organisms/samples with varied photosynthetic performances [26]. The recent development of the lower-cost user-made systems [27] facilitates the use of this technique for screening bryophytes most suitable for green roof technologies.
Green roofs provide many benefits to the ecosystem and are fundamental requirements for the creation of eco-friendly cities [45]. However, irrigation sustainability will be a requirement for future green roof instalments in a sustainable world [14]. The application of bryophytes to standard green roofs, as a standalone organism or in combination with other plants, is still in its infancy [24]. Expectedly, chlorophyll a fluorescence imaging is an effective non-invasive optical technology with the potential to rapidly select adequate species, which will increase the development speed of more sustainable green roofs. The application of green roofs to urban buildings may help cities adapt to the effects of climate change.

5. Conclusions

The non-invasive technique of chlorophyll a fluorescence analysis is a very fast tool to screen for species to be used in green roofs, allowing researchers to focus resources on promising species, such as Didymodon fallax, Grimmia lisae, Pleurochaete squarrosa, and Targionia hypophylla, which can undergo multiple cycles of dehydration/rehydration without losing photosynthetic performance. Green roofs may benefit from their natural-based mechanism of water sustainability, which is built into their natural cycles. Therefore, this study could permit the selection of the desiccation-tolerant bryophytes by performing quick surveys, fostering the use of local species to reduce the dependence on the irrigation systems of green roofs, not only in the Mediterranean but all around the world.

Supplementary Materials

The following are available online at https://www.mdpi.com/2073-4441/12/6/1748/s1, Table S1: Results of the statistical analysis comparisons of Fv/Fm between species within each time (one-way ANOVA with Tukey’s multiple comparisons test); Table S2: Results of the statistical analysis comparisons of ETR between species within each time (one-way ANOVA with Tukey’s multiple comparisons test); Table S3: Results of the statistical analysis comparisons of Fv/Fm between species within each time (one-way ANOVA with Tukey’s multiple comparisons test); Table S4: Results of the statistical analysis comparisons of α between species within each time (one-way ANOVA with Tukey’s multiple comparisons test); Table S5: Results of the statistical analysis comparisons of β between species within each time (one-way ANOVA with Tukey’s multiple comparisons test); Table S6: Results of the statistical analysis comparisons of rETRmax between species within each time (one-way ANOVA with Tukey’s multiple comparisons test); Table S7: Results of the statistical analysis comparisons of Ek between species within each time (one-way ANOVA with Tukey’s multiple comparisons test).

Author Contributions

Conceptualization, R.C.d.C.; methodology, R.C.d.C. and J.M.d.S.; investigation, R.C.d.C.; data curation, R.C.d.C.; writing—original draft preparation, R.C.d.C. and J.M.d.S.; writing—review and editing, T.P. and C.B.; project administration, R.C.d.C. All authors have read and agreed to the published version of the manuscript.

Funding

This work was funded by Fundação para a Ciência e a Tecnologia (FCT) via the project MedMossRoofs (PTDC/ATP-ARP/5826/2014).

Acknowledgments

The authors wish to thank César Garcia (Universidade de Lisboa), for help in the identification of the bryophyte species, and Thomas William Henley for editing English language, grammar, punctuation, spelling, and overall style of the text.

Conflicts of Interest

The authors declare no conflict of interest.

References

  1. Oberndorfer, E.; Lundholm, J.; Bass, B.; Coffman, R.R.; Doshi, H.; Dunnett, N.; Gaffin, S.; Köhler, M.; Liu, K.K.Y.; Rowe, B. Green roofs as urban ecosystems: Ecological structures, functions, and services. BioScience 2007, 57, 823–833. [Google Scholar] [CrossRef]
  2. Clark, C.; Adriaens, P.; Talbot, F.B. Green roof valuation: A probabilistic economic analysis of environmental benefits. Environ. Sci. Technol. 2008, 42, 2155–2161. [Google Scholar] [CrossRef]
  3. Currie, B.A.; Bass, B. Estimates of air pollution mitigation with green plants and green roofs using the UFORE model. Urban Ecosyst. 2008, 11, 409–422. [Google Scholar] [CrossRef]
  4. Carter, T.; Keeler, A. Life-cycle cost-benefit analysis of extensive vegetated roof systems. J. Environ. Manag. 2008, 8, 350–363. [Google Scholar] [CrossRef] [PubMed]
  5. Rowe, D.B. Green roofs as a means of pollution abatement. Environ. Pollut. (Oxford, U.K.) 2011, 159, 2100–2110. [Google Scholar] [CrossRef] [PubMed] [Green Version]
  6. Veisten, K.; Smyrnova, Y.; Klæboe, R.; Hornikx, M.; Mosslemi, M.; Kang, J. Valuation of green walls and green roofs as soundscape measures: Including monetised amenity values together with noise-attenuation values in a cost-benefit analysis of a green wall affecting courtyards. Int. J. Environ. Res. Public Health 2012, 9, 3770–3778. [Google Scholar] [CrossRef] [Green Version]
  7. Anderson, M.; Lambrinos, J.; Schroll, E. The potential value of mosses for stormwater management in urban environments. Urban Ecosyst. 2010, 13, 319–332. [Google Scholar] [CrossRef]
  8. Alexandri, E.; Jones, P. Temperature decreases in an urban canyon due to green walls and green roofs in diverse climates. Build. Environ. 2008, 4, 480–493. [Google Scholar] [CrossRef]
  9. Berardi, U.; GhaffarianHoseini, A.; GhaffarianHoseini, A. State-of-the-art analysis of the environmental benefits of green roofs. Appl. Energy 2014, 115, 411–428. [Google Scholar] [CrossRef]
  10. Snodgrass, E.C.; Snodgrass, L.L. Green Roof Plants: A Resource and Planting Guide; Timber Press: Portland, OR, USA, 2006; 220p, ISBN 978-0881927870. [Google Scholar]
  11. Yang, J.; Yu, Q.; Gong, P. Quantifying air pollution removal by green roofs in Chicago. Atmos. Environ. 2008, 42, 7266–7273. [Google Scholar] [CrossRef]
  12. Loder, A. “There’s a meadow outside my workplace”: A phenomenological exploration of aesthetics and green roofs in Chicago and Toronto. Landsc. Urban Plan. 2014, 126, 94–106. [Google Scholar] [CrossRef]
  13. Sutton, R.K. Aesthetics for green roofs and green walls. J. Liv. Architect. 2014, 1, 1–20. Available online: https://livingarchitecturemonitor.com/s/JLIV2014Volume1_Issue2-Sutton.pdf (accessed on 1 May 2020).
  14. Schweitzer, O.; Erell, E. Evaluation of the energy performance and irrigation requirements of extensive green roofs in a water-scarce Mediterranean climate. Energy Build. 2014, 68, 25–32. [Google Scholar] [CrossRef]
  15. Sovocool, K.A.; Morgan, M. Xeriscape Conversion Study Final Report; Southern Nevada Water Authority: Las Vegas, NV, USA, 2005; p. 93. Available online: https://www.snwa.com/assets/pdf/reports-xeriscape.pdf (accessed on 1 May 2020).
  16. Belnap, J.; Lange, O. (Eds.) Structure and Functioning of Biological Soil Crusts: A synthesis. In Biological Soil Crusts: Structure, Function, and Management. Ecological Studies (Analysis and Synthesis) Volume 150; Springer: Berlin/Heidelberg, Germany, 2001; pp. 471–479. [Google Scholar] [CrossRef]
  17. Bowker, M.A.; Maestre, F.T.; Eldridge, D.; Belnap, J.; Castillo-Monroy, A.; Escolar, C.; Soliveres, S. Biological soil crusts (biocrusts) as a model system in community, landscape and ecosystem ecology. Biodivers. Conserv. 2014, 23, 1619–1637. [Google Scholar] [CrossRef]
  18. Cruz de Carvalho, R.C.; Branquinho, C.; Marques da Silva, J. Physiological consequences of desiccation in the aquatic bryophyte Fontinalis antipyretica. Planta 2011, 234, 195–205. [Google Scholar] [CrossRef]
  19. Cruz de Carvalho, R.; Catalá, M.; Marques da Silva, J.; Branquinho, C.; Barreno, E. The impact of dehydration rate on the production and cellular location of reactive oxygen species in an aquatic moss. Ann. Bot. 2012, 110, 1007–1016. [Google Scholar] [CrossRef] [Green Version]
  20. Cruz de Carvalho, R.; Bernardes da Silva, A.; Soares, R.; Almeida, A.M.; Coelho, A.V.; Marques da Silva, J.; Branquinho, C. Differential proteomics of dehydration and rehydration in bryophytes: Evidence towards a common desiccation tolerance mechanism. Plant Cell Environ. 2014, 37, 1499–1515. [Google Scholar] [CrossRef]
  21. Cruz de Carvalho, R.; Maurício, A.; Pereira, M.F.; Marques da Silva, J.; Branquinho, C. All for one: The role of colony morphology in bryophyte desiccation tolerance. Front. Plant Sci. 2019, 10, 1360. [Google Scholar] [CrossRef]
  22. Rixen, C.; Mulder, C.P.H. Improved water retention links high species richness with increased productivity in arctic tundra moss communities. Oecologia 2005, 146, 287–299. [Google Scholar] [CrossRef]
  23. Brandão, C.; Cameira, M.R.; Valente, F.; Cruz de Carvalho, R.; Paço, T.A. Wet season hydrological performance of green roofs using native species under Mediterranean climate. Ecol. Eng. 2017, 102, 596–611. [Google Scholar] [CrossRef]
  24. Paço, T.A.; Cruz de Carvalho, R.; Arsénio, P.; Martins, D. Green roof design techniques to improve water use under Mediterranean conditions. Urban Sci. 2019, 3, 14. [Google Scholar] [CrossRef] [Green Version]
  25. Schreiber, U.; Schliwa, U.; Bilger, W. Continuous recording of photochemical and non-photochemical chlorophyll fluorescence quenching with a new type of modulation fluorometer. Photosynth. Res. 1986, 10, 51–62. [Google Scholar] [CrossRef]
  26. Oxborough, K.; Baker, N.R. An instrument capable of imaging chlorophyll a fluorescence from intact leaves at very low irradiance and at cellular and subcellular levels of organization. Plant Cell Environ. 1997, 20, 1473–1483. [Google Scholar] [CrossRef]
  27. Marques da Silva, J. Monitoring Photosynthesis by In Vivo Chlorophyll Fluorescence: Application to High-Throughput Plant Phenotyping. In Applied Photosynthesis—New Progress; Najafpour, M.M., Ed.; Intechopen: London, UK, 2016; pp. 3–22. [Google Scholar] [CrossRef] [Green Version]
  28. Bates, B.C.; Kundzewicz, Z.W.; Wu, S.; Palutikof, J.P. (Eds.) Climate Change and Water. Technical Paper of the Intergovernmental Panel on Climate Change; PCC Secretariat: Geneva, Switzerland, 2008; 210p, ISBN 978-92-9169-123-4. [Google Scholar]
  29. Cruz de Carvalho, R.; Varela, Z.; Paço, T.A.; Branquinho, C. Selecting potential moss species for green roofs in the Mediterranean Basin. Urban Sci. 2019, 3, 57. [Google Scholar] [CrossRef] [Green Version]
  30. Ellenberg, H.; Weber, H.E.; Düll, R.; Wirth, V.; Werner, W.; Paulissen, D. Zeigerwerte von Pflanzen in Mitteleuropa Scripta Geobotanica 18, 2nd ed.; Goltze: Göttingen, Germany, 1992; pp. 1–258. ISBN 9783884525180. [Google Scholar]
  31. Dierssen, K. Distribution, Ecological Amplitude and Phytosociological Characterization of European Bryophytes; Bryophytorum Bibliotheca 56; J. Cramer: Stuttgart, Germany, 2001; pp. 1–289. ISBN 978-3-443-62028-8. [Google Scholar]
  32. During, H.J. Ecological Classifications of Bryophytes and Lichens. In Bryophytes and Lichens in a Changing Environment; Bates, J.W., Farmer, A.M., Eds.; Clarendon: Oxford, UK, 1992; pp. 1–31. ISBN 978-0198542919. [Google Scholar]
  33. Kurz-Besson, C.B.; Lousada, J.L.; Gaspar, M.J.; Correia, I.E.; David, T.S.; Soares, P.M.M.; Cardoso, R.M.; Russo, A.; Varino, F.; Mériaux, C.; et al. Effects of recent minimum temperature and water deficit increases on Pinus pinaster radial growth and wood density in southern Portugal. Front. Plant Sci. 2016, 7, 1170. [Google Scholar] [CrossRef] [PubMed]
  34. British Columbia Ministry of Forests. Techniques and Procedures for Collecting, Preserving, Processing, and Storing Botanical Specimens; Victoria, B.C. Work. Pap. 18/1996; British Columbia Ministry of Forests: Victoria, BC, Canada, 1996; p. 44. Available online: https://www.for.gov.bc.ca/hfd/pubs/Docs/Wp/Wp18.pdf. (accessed on 1 May 2020).
  35. Baker, N.R.; Oxborough, K. Chlorophyll Fluorescence as a Probe of Photosynthetic Productivity. In Chlorophyll a Fluorescence. Advances in Photosynthesis and Respiration, Volume 19; Papageorgiou, G.C., Govindjee, Eds.; Springer: Dordrecht, The Netherlands, 2004; pp. 65–82. [Google Scholar] [CrossRef]
  36. Bilger, W.; Björkman, O. Relationships among violaxanthin deepoxidation, thylakoid membrane conformation, and nonphotochemical chlorophyll fluorescence quenching in leaves of cotton (Gossypium hirsutum L.). Planta 1994, 193, 238–246. [Google Scholar] [CrossRef]
  37. Oxborough, K. Imaging of chlorophyll a fluorescence: Theoretical and practical aspects of an emerging technique for the monitoring of photosynthetic performance. J. Exp. Bot. 2004, 55, 1195–1205. [Google Scholar] [CrossRef]
  38. Platt, T.; Gallegos, C.L.; Harrison, W.G. Photoinhibition of photosynthesis in natural assemblages of marine phytoplankton. J. Mar. Res. 1980, 38, 687–701. Available online: http://images.peabody.yale.edu/publications/jmr/jmr38-04-06.pdf (accessed on 1 May 2020).
  39. Hájek, T. Physiological Ecology of Peatland Bryophytes. In Photosynthesis in Bryophytes and Early Land Plants. Advances in Photosynthesis and Respiration, Chapter 13; Hanson, D.T., Rice, S.K., Eds.; Springer: Dordrecht, The Netherlands, 2014; pp. 233–252. [Google Scholar] [CrossRef]
  40. Garabito, D.; Vallejo, R.; Montero, E.; Garabito, J.; Martínez-Abaigar, J. Green buildings envelopes with bryophytes. A review of the state of the art. Bol. Soc. Españ. Briol. 2017, 48–49, 1–16. Available online: https://www.briologia.es/boletines/vol48-49.pdf (accessed on 1 May 2020).
  41. Oliver, M.J.; Velten, J.; Mishler, B.D. Desiccation tolerance in bryophytes: A reflection of the primitive strategy for plant survival in dehydrating habitats? Integr. Comp. Biol. 2005, 45, 788–799. [Google Scholar] [CrossRef] [Green Version]
  42. Wang, X.Q.; Yang, P.F.; Liu, Z.; Liu, W.Z.; Hu, Y.; Chen, H.; Kuang, T.Y.; Pei, Z.M.; Shen, S.H.; He, Y.K. Exploring the mechanism of Physcomitrella patens desiccation tolerance through a proteomic strategy. Plant Physiol. 2009, 149, 1739–1750. [Google Scholar] [CrossRef] [PubMed] [Green Version]
  43. Stark, L.R. Ecology of desiccation tolerance in bryophytes: A conceptual framework and methodology. Bryologist 2017, 120, 129–164. [Google Scholar] [CrossRef]
  44. Cruz de Carvalho, R.; Santos, P.; Branquinho, C. Production of moss-dominated biocrusts to enhance the stability and function of the margins of artificial water bodies. Restor. Ecol. 2018, 26, 419–421. [Google Scholar] [CrossRef]
  45. Francis, L.F.M.; Jensen, M.B. Benefits of green roofs: A systematic review of the evidence for three ecosystem services. Urban Urban Green 2017, 28, 167–176. [Google Scholar] [CrossRef]
Figure 1. (A) Collection sites in southern Portugal (a. Zebreira; b. São Mamede; c. Estremoz; d. Barreiro; e. Ermidas-Sado) where (B) the bryophyte species were collected (Didymodon fallax (Hedw.) R. H. Zander, Grimmia lisae De Not., Hypnum cupressiforme Hedw., Pleurochaete squarrosa (Brid.) Lindb., Targionia hypophylla L., and Tortella nitida (Lindb.) Broth.). Map of Portugal represents the two climate types in Portugal (Csa: Mediterranean hot summer (yellow); Csb: Mediterranean cool summer (green)) [29].
Water 12 01748 g001
Figure 2. Representation of the experimental design of this study, in this case, Pleurochaete squarrosa, showing representative chlorophyll a fluorescence images (Fo (minimum fluorescence); upper row) and correlated RGB images (low row), at selected times.
Water 12 01748 g002
Table 1. Bryophyte species collected in the present study (clade, growth form, location, aridity index (1980–2010) (A.I.), natural (N), or urban (U) site, coordinates).
SpeciesPlant CladeGrowth FormLocationA.I. *N/UCoordinates
Didymodon fallax (Hedw.) R.H.ZanderBryophyta (mosses)AcrocarpousErmidas-SadoSemi-aridU38°00′24.6″ N 8°25′03.2″ W
BarreiroDry sub-humidU38°39′56.0″ N 9°04′05.9″ W
Grimmia lisae De Not.Bryophyta (mosses)AcrocarpousZebreiraSemi-aridU39°50′33.4″ N 7°04′07.2″ W
Hypnum cupressiforme Hedw.Bryophyta (mosses)PleurocarpousAlegrete (Parque Natural de São Mamede)Dry sub-humidN39°15′14.6″ N 7°18′05.0″ W
Pleurochaete squarrosa (Brid.) Lindb.Bryophyta (mosses)AcrocarpousZebreiraSemi-aridU39°51′06.9″ N 7°04′22.9″ W
Targionia hypophylla L.Marchantiophyta (liverworts)BarreiroDry sub-humidU38°39′56.0″ N 9°04′05.9″ W
Tortella nitida (Lindb.) Broth.Bryophyta (mosses)AcrocarpousAlegrete (Parque Natural de São Mamede)Dry sub-humidN39°15′14.6″ N 7°18′05.0″ W
EstremozSemi-aridU38°48′01.8″ N 7°39′41.9″ W
* Aridity Index (1980–2010) according to [33].
Table 2. Chlorophyll a fluorescence parameters (A, maximum photochemical efficiency of photosystem II (Fv/Fm); B, electron transport rate (ETR); and C, non-photochemical quenching (NPQ/4)) in different bryophyte species, during a cycle of 10 days hydration followed by a 3 days dry event and a recovery period of 24 h (average ± standard deviation, n = 5, different letters (a,b,c) indicate significant differences at p < 0.05 between times within the same species). Sites: E-S—Ermidas-Sado, Baixo Alentejo; Brr—Barreiro, Setúbal; Z—Zebreira, Beira Baixa; E—Estremoz, Alto Alentejo; SM—Parque Natural de São Mamede, Alto Alentejo.
A
Fv/FmT0T3T6T10T13T13 + 1hT14
Didymodon fallax (E-S)No photosynthetic activity measured by chlorophyll a fluorescence0.570 ± 0.026 a0.605 ± 0.016 a0.680 ± 0.017 bNo photosynthetic activity measured by chlorophyll a fluorescence0.589 ± 0.025 a0.569 ± 0.026 a
Didymodon fallax (Brr)0.626 ± 0.058 a0.628 ± 0.016 a0.545 ± 0.062 a0.367 ± 0.101 b0.565 ± 0.036 a
Grimmia lisae (Z)0.583 ± 0.051 ac0.665 ± 0.013 b0.625 ± 0.026 abc0.606 ± 0.018 c0.623 ± 0.022 abc
Hypnum cupressiforme (SM)0.281 ± 0.051 a0.592 ± 0.048 b0.655 ± 0.014 b0.450 ± 0.048 c0.620 ± 0.022 b
Pleurochaete squarrosa (Z)0.618 ± 0.015 a0.641 ± 0.019 b0.690 ± 0.002 c0.527 ± 0.004 d0.633 ± 0.004 ab
Targionia hypophylla (Brr)0.716 ± 0.008 ac0.744 ± 0.007 a0.747 ± 0.002 a0.666 ± 0.047 bc0.700 ± 0.015 c
Tortella nitida (SM)0.520 ± 0.030 ac0.613 ± 0.014 b0.615 ± 0.025 b0.491 ± 0.040 c0.584 ± 0.013 b
Tortella nitida (E)0.352 ± 0.145 a0.645 ± 0.047 b0.714 ± 0.017 b0.000 ± 0.000 c0.572 ± 0.016 d
B
ETR (µmol m−2 s−1)T0T3T6T10T13T13 + 1hT14
Didymodon fallax (E-S)No photosynthetic activity measured by chlorophyll a fluorescence18.5 ± 1.7 a20.2 ± 1.4 a17.3 ± 1.9 abNo photosynthetic activity measured by chlorophyll a fluorescence13.9 ± 2.5 b14.0 ± 1.8 b
Didymodon fallax (Brr)20.3 ± 3.6 a18.2 ± 2.7 ab13.2 ± 1.7 bc8.0 ± 5.3 c18.7 ± 1.2 ab
Grimmia lisae (Z)21.1 ± 2.5 ab20.9 ± 1.4 a14.7 ± 1.2 b19.1 ± 3.5 a19.7 ± 1.7 a
Hypnum cupressiforme (SM)3.0 ± 2.3 a13.1 ± 2.8 bc16.1 ± 3.2 b10.5 ± 1.7 c16.6 ± 1.9 b
Pleurochaete squarrosa (Z)15.5 ± 1.2 a19.2 ± 1.0 b17.6 ± 0.8 c13.7 ± 0.3 d14.5 ± 0.7 ad
Targionia hypophylla (Brr)18.6 ± 2.3 a36.0 ± 0.6 b16.1 ± 0.4 ac14.3 ± 1.9 c17.8 ± 0.9 a
Tortella nitida (SM)16.1 ± 1.0 a14.1 ± 0.6 a15.1 ± 1.6 a12.2 ± 2.9 b17.0 ± 1.1 a
Tortella nitida (E)17.2 ± 1.5 a18.7 ± 2.2 a18.8 ± 2.8 a0.0 ± 0.0 b14.0 ± 0.7 a
C
NPQ/4T0T3T6T10T13T13 + 1hT14
Didymodon fallax (E-S)No photosynthetic activity measured by chlorophyll a fluorescence0.132 ± 0.027 a0.091 ± 0.024 a0.236 ± 0.056 bNo photosynthetic activity measured by chlorophyll a fluorescence0.402 ± 0.081 c0.265 ± 0.037 b
Didymodon fallax (Brr)0.145 ± 0.032 ac0.118 ± 0.014 a0.121 ± 0.027 a0.315 ± 0.062 b0.194 ± 0.033 c
Grimmia lisae (Z)0.141 ± 0.018 ab0.168 ± 0.021 ab0.108 ± 0.034 a0.200 ± 0.051 b0.198 ± 0.028 b
Hypnum cupressiforme (SM)0.060 ± 0.012 a0.383 ± 0.096 b0.383 ± 0.148 b0.186 ± 0.037 a0.398 ± 0.096 b
Pleurochaete squarrosa (Z)0.439 ± 0.057 ac0.278 ± 0.053 b0.309 ± 0.037 bc0.252 ± 0.022 b0.376 ± 0.024 c
Targionia hypophylla (Brr)0.663 ± 0.098 a0.073 ± 0.002 b0.490 ± 0.059 cd0.508 ± 0.110 c0.366 ± 0.032 d
Tortella nitida (SM)0.147 ± 0.011 a0.365 ± 0.031 b0.296 ± 0.039 b0.297 ± 0.065 b0.318 ± 0.079 b
Tortella nitida (E)0.071 ± 0.049 a0.182 ± 0.046 b0.248 ± 0.089 b0.000 ± 0.000 c0.202 ± 0.023 b
Table 3. Rapid light curve parameters (A, photosynthetic efficiency (α); B, photoinhibition (β); C, maximum rETR (rETRmax); and D, light saturation value (Ek)) in different bryophyte species, during a cycle of 10 days hydration followed by a 3 days dry event and a recovery period of 24 h (average ± standard deviation, n = 5, different letters (a,b,c,d) indicate significant differences at p < 0.05 between times within the same species). Sites: E-S—Ermidas-Sado, Baixo Alentejo; Brr—Barreiro, Setúbal; Z—Zebreira, Beira Baixa; E—Estremoz, Alto Alentejo; SM—Parque Natural de São Mamede, Alto Alentejo.
A
αT0T3T6T10T13T13 + 1hT14
Didymodon fallax (E-S)No photosynthetic activity measured by chlorophyll a fluorescence0.205 ± 0.014 a0.246 ± 0.016 b0.255 ± 0.024 bNo photosynthetic activity measured by chlorophyll a fluorescence0.249 ± 0.023 b0.241 ± 0.022 ab
Didymodon fallax (Brr)0.243 ± 0.034 ac0.218 ± 0.012 ac0.170 ± 0.017 ab0.160 ± 0.022 b0.261 ± 0.037 c
Grimmia lisae (Z)0.241 ± 0.022 a0.287 ± 0.017 b0.244 ± 0.009 a0.272 ± 0.030 ab0.251 ± 0.014 ab
Hypnum cupressiforme (SM)0.104 ± 0.014 a0.230 ± 0.027 bc0.244 ± 0.049 bc0.194 ± 0.036 b0.282 ± 0.024 c
Pleurochaete squarrosa (Z)0.206 ± 0.025 a0.255 ± 0.020 b0.259 ± 0.020 b0.200 ± 0.007 a0.183 ± 0.002 a
Targionia hypophylla (Brr)0.284 ± 0.014 a0.285 ± 0.021 a0.257 ± 0.013 ac0.150 ± 0.006 b0.247 ± 0.016 c
Tortella nitida (SM)0.182 ± 0.014 ab0.185 ± 0.006 ab0.213 ± 0.027 a0.175 ± 0.015 b0.254 ± 0.019 c
Tortella nitida (E)0.178 ± 0.058 a0.240 ± 0.020 b0.251 ± 0.045 b0.000 ± 0.000 c0.192 ± 0.013 ab
B
βT0T3T6T10T13T13 + 1hT14
Didymodon fallax (E-S)No photosynthetic activity measured by chlorophyll a fluorescence57.9 ± 13.4 a59.1 ± 9.5 a102.1 ± 20.9 aNo photosynthetic activity measured by chlorophyll a fluorescence205.1 ± 82.6 b106.7 ± 17.4 a
Didymodon fallax (Brr)60.0 ± 18.6 a64.0 ± 16.2 a86.1 ± 13.3 a121.0 ± 42.2 a65.9 ± 8.3 a
Grimmia lisae (Z)46.9 ± 4.3 ac71.0 ± 16.5 abc89.5 ± 3.4 b89.9 ± 27.3 b62.4 ± 1.8 c
Hypnum cupressiforme (SM)448.6 ± 296.2 a155.1 ± 69.0 b123.6 ± 15.0 b195.6 ± 33.4 ab158.4 ± 29.8 b
Pleurochaete squarrosa (Z)86.4 ± 3.6 a88.0 ± 10.1 a120.5 ± 15.2 b128.6 ± 1.0 b113.3 ± 1.0 b
Targionia hypophylla (Brr)98.8 ± 19.2 a79.7 ± 11.9 a123.2 ± 13.2 a262.0 ± 100.9 b116.1 ± 17.0 a
Tortella nitida (SM)79.6 ± 2.7 a97.3 ± 0.7 ab98.3 ± 14.2 ab185.8 ± 120.3 b112.4 ± 18.9 ab
Tortella nitida (E)86.1 ± 28.6 a143.6 ± 15.0 b143.6 ± 15.0 b0.0 ± 0.0 c126.5 ± 4.5 b
C
rETRmax (µmol m−2 s−1)T0T3T6T10T13T13 + 1hT14
Didymodon fallax (E-S)No photosynthetic activity measured by chlorophyll a fluorescence37.6 ± 9.0 ab43.1 ± 6.4 a26.5 ± 6.7 bNo photosynthetic activity measured by chlorophyll a fluorescence14.0 ± 5.9 b23.6 ± 4.7 b
Didymodon fallax (Brr)44.9 ± 15.8 a37.5 ± 14.2 ab20.7 ± 5.1 bc14.9 ± 6.7 c40.5 ± 4.9 a
Grimmia lisae (Z)53.0 ± 9.2 a42.9 ± 9.4 ab27.8 ± 0.6 b33.9 ± 13.4 b40.9 ± 2.4 ab
Hypnum cupressiforme (SM)3.2 ± 1.8 a18.2 ± 9.4 bc20.7 ± 6.5 b10.3 ± 2.3 c18.6 ± 3.1 bc
Pleurochaete squarrosa (Z)24.5 ± 3.9 a29.7 ± 3.0 b22.2 ± 2.9 a15.9 ± 0.7 c16.4 ± 0.3 c
Targionia hypophylla (Brr)30.1 ± 5.4 ad37.0 ± 6.4 a21.5 ± 2.0 b6.5 ± 2.1 c22.1 ± 4.1 bd
Tortella nitida (SM)23.3 ± 1.9 a19.4 ± 0.7 a22.6 ± 5.0 a11.9 ± 4.6 b23.6 ± 4.3 a
Tortella nitida (E)21.3 ± 5.0 a17.3 ± 3.4 a19.7 ± 8.6 a0.0 ± 0.0 b15.5 ± 1.4 a
D
EkT0T3T6T10T13T13+1hT14
Didymodon fallax (E-S)No photosynthetic activity measured by chlorophyll a fluorescence183.5 ± 39.4 a175.7 ± 26.2 a103.1 ± 19.8 bcNo photosynthetic activity measured by chlorophyll a fluorescence55.9 ± 19.9 c97.7 ± 16.9 c
Didymodon fallax (Brr)182.2 ± 50.6 a171.0 ± 59.9 a120.8 ± 19.1 ab91.1 ± 29.4 b156.3 ± 17.2 a
Grimmia lisae (Z)218.5 ± 19.2 a151.3 ± 43.0 bc114.0 ± 4.2 c121.8 ± 35.8 bc163.3 ± 4.6 b
Hypnum cupressiforme (SM)31.3 ± 18.8 a76.5 ± 31.4 b83.7 ± 11.8 b53.2 ±7.7 ab66.9 ± 16.8 ab
Pleurochaete squarrosa (Z)118.2 ± 5.1 a117.1 ± 13.0 a85.8 ± 11.4 bc79.4 ± 0.6 c90.0 ± 0.8 c
Targionia hypophylla (Brr)105.8 ± 16.8 ab129.8 ± 17.0 a83.5 ± 8.6 b43.0 ± 13.8 c89.3 ± 12.8 b
Tortella nitida (SM)128.2 ± 4.2 a104.8 ± 0.8 ac105.2 ± 12.9 ac67.0 ± 23.4 b93.0 ± 16.6 bc
Tortella nitida (E)128.7 ± 42.2 a71.7 ± 8.1 a75.5 ± 20.7 a0.0 ± 0.0 b80.7 ± 2.8 a

