Article

Microplastic Concentrations in Raw and Drinking Water in the Sinos River, Southern Brazil

by
Marlon Ferraz
1,
Amanda Leticia Bauer
1,
Victor Hugo Valiati
2 and
Uwe Horst Schulz
1,*
1
Laboratory of Fish Ecology, Universidade do Vale do Rio dos Sinos, Av. Unisinos, 950, E 04 234, Cristo Rei, São Leopoldo 93022-750, Brazil
2
Laboratory of Genetics and Molecular Biology, Universidade do Vale do Rio dos Sinos, Av. Unisinos, 950, E 04 234, Cristo Rei, São Leopoldo 93022-750, Brazil
*
Author to whom correspondence should be addressed.
Water 2020, 12(11), 3115; https://doi.org/10.3390/w12113115
Submission received: 18 September 2020 / Revised: 1 November 2020 / Accepted: 4 November 2020 / Published: 6 November 2020
(This article belongs to the Special Issue Microplastics in Aquatic Environments and Wastewater Treatment )

Abstract

:
Microplastics are omnipresent in the atmosphere, terrestrial and aquatic ecosystems, food and beverages. They may cause risks to biodiversity and the human population. The present study aims to assess the concentrations of microplastics in raw and drinking water of the Sinos River in Southern Brazil. The water was collected at eight locations along the Sinos River and in eight residences supplied with treated river water. The samples were processed by dying plastic particles with Nile Red and counting by fluorescence microscopy. River water showed an average of 330.2 particles L−1 and treated water 105.8 particles L−1. Fibers were the most abundant particles shapes in the samples. Particle abundance in the raw water did not follow the urbanization gradient in the Sinos River basin. The exact pathways of microplastic particles remain unidentified, but the predominance of fibers suggests that untreated sewage from washing machines may be a principal source of contamination, particularly in the headwaters. The microplastic in the drinking water is an additional factor to be considered in conservation efforts aiming at improving water quality in the Sinos River basin.

Graphical Abstract

1. Introduction

The research interest in plastic contamination has increased in recent years. A quick search in the Aquatic Sciences and Fisheries Database [1] using the term “micro plastic” generates 804 hits for the period between 2003 and 2020. A total of 713 (88%) of all articles were published in the last five years between 2015 and 2020.
These publications address the quantification of particles suspended in the water column [2], in the sediment [3], in invertebrates [4], in stomach contents of fish [5], and in aquatic bacteria [6]. Others have analyzed the effects of trophic transfer in marine food chains [7].
Most studies target marine ecosystems. Many of these studies show that microplastic (MP) concentrations vary widely: Tsang et al. [8] quantified an average of 0.046 particles L−1 (p L−1) (min = 0.00032, max = 0.35642) at nine locations off the coast of Hong Kong in China and Ramíres-Álvarez et al. [9] found concentrations ranging from 0.00001 to 0.0007 p L−1 on the northwest coast of Baja California, Mexico. However, MPs in freshwater are still poorly studied [10], although lotic ecosystems are the most common pathway for artificial polymers into the sea [11].
Studies that addressed MPs in freshwater found synthetic polymers even in remote areas, like Lake Hovsgol, Mongolia, where Free et al. [12] quantified on average 20,264 p km−2. However, urban areas are considered the principal MP source ([13]: New Jersey, [14]: England).
In Brazil, studies related to MPs follow the global pattern with most publications on coastal and marine ecosystems [15]. Gomes [16] conducted the first study about plastic particles in the environment in Brazil. He counted a mean of 31.8 pellets m−2 on beaches of the northern coast of Rio Grande do Sul. Other studies in Brazil found MPs on the beaches of Guanabara Bay (Rio de Janeiro) where the concentrations ranged from 12 to 1300 p m−2 [17]. Surface water concentrations ranged from 0.0014 to 0.0213 p L−1 at the same location [18]. Out of a sample of 2332 fish from a tropical Brazilian estuary 9% of the examined individuals contained a mean particle count of 1.06 ± 0.3, independently of size or trophic guild [19]. In a tropical Brazilian river Silva-Cavalcanti et al. [5] examined 48 individuals Hoplosternum littorale, a siluriform bottom dwelling species. They quantified a total of 176 MPs in the guts of 40 individuals (min = 1 and max = 24 per fish), 46.6% of the particles were fibers. Another study by Andrade et al. [20], examining the stomach contents of 172 specimens from 16 serrasalmid species in the Xingu River basin, found 96 MPs in 46 specimens. The authors analyzed species of three trophic guilds (omnivorous, herbivorous and carnivorous fish), but did not find significant differences. This work was the first record of microplastics in fish belonging to the Amazon basin.
The risks of MPs to human health are still poorly known. Exposal may occur by inhalation of MPs suspended in the air or by ingestion of MP containing food and beverages. Outdoor air may contain 0.0003 to 0.0015 p L−1, while indoor air may contain 0.001–0.006 p L−1 [21]. Inhaling airborne particles can contaminate the airways, causing inflammation by dust overload, oxidative stress and may cause malignant damage [22]. Ingested MPs are bioresistant and not degradable in vivo. Potential damages can be expected by the mechanical properties of MPs which are believed to cause local inflammatory responses in the intestine [23].
The recent review by Koelmans et al. [24] listed 50 studies with 55 records of MP concentrations in tap and bottled drinking water, as well as in ground, surface, and wastewater. All studies reported the presence of MP in the samples with concentrations covering a 10 billion-fold magnitude (10−5 p L−1 – 105 p L−1). Given the omnipresence of MP on a global scale, the potential health hazards caused by artificial polymers, and the importance of the Sinos River as a drinking water resource for approximately 1.3 million inhabitants, this study analyzed MP concentrations in raw and treated raw water. We tested the hypothesis that the MP concentrations in the Sinos River water followed the urbanization gradient of the river basin.

2. Materials and Methods
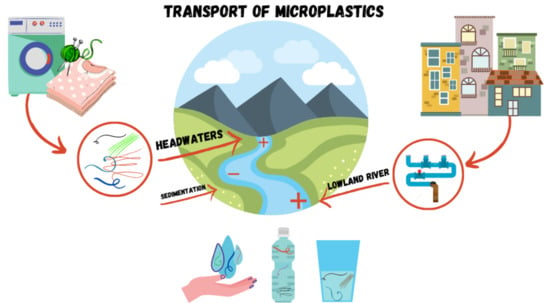
2.1. Study Area

The Sinos River basin is densely populated and industrialized. On approximately 1.5% of the area of Brazil’s southernmost state Rio Grande do Sul about 21% of the state`s gross domestic product is generated [25]. The Sinos River provides drinking water for 1.3 × 10⁶ inhabitants. In the lower parts of the basin water quality is class 4, which is the worst in the Brazilian water quality ranking system, due to the large amounts of untreated municipal sewage [26]. The upper parts of the basin are in better condition, where the prevailing water quality classes are 3 and 2. The area is less urbanized, and rice paddies and lifestock dominate the land use.

2.2. Sampling Array

Raw water from the Sinos River was sampled at eight sites in the main riverbed, following the urbanization gradient from upstream to downstream (Figure 1). All samples were collected during three days in December 2018. No rain fell during the sampling.
At each sample site in the river 1 L of raw water was collected in duplicates by submerging a glass flask to a depth of about 50 cm. The lid was opened when the flask was submerged to avoid contamination from the atmosphere [27]. All samples were taken close to the riverbanks at a total water depth of approximately 1.2 m.
Eight samples of drinking water, as well in duplicates, were collected in residences of seven municipalities along the Sinos River, following the same gradient as the samples of river water along the main channel.

2.3. Extraction of Plastic Particles

The extraction of plastic particles in river and tap water followed largely the protocol of Karami et al. [28]. Organic matter was digested with 15% KOH at 40 °C for 48 h and filtered (Whatman GF3 7 µm). The filter was inserted into a 15 mL test tube. A solution of 4 M NaCl was added, centrifuged for 2 min at 200 rpm, sonicated for 2 min at 60 Hz, and centrifuged again for 5 min at 500 rpm. The supernatant was filtered (Whatman GF3, 7 µm). Subsequently, the filter was allocated on a Petri dish with 15 mL ultra-pure water and 0.5 mL Nile red solution (1 mg Nile Red in 1 mL acetone). The filter rested for 60 min to stain the polymers. The liquid used for staining was filtered again with the same filter. In the final step, the filter was dried in Petri dish at 40 °C for 12 h. The particles were counted under the Axio Scope A1 Zeiss fluorescence microscope (Carl Zeiss Microscopy GmbH, Göttingen, Germany) at 400× magnification [29] and categorized in fibers, pellets, and films according to Hendrickson et al. [30]. The same extraction protocol was applied to the tap water of the residences. The lower size limit for all counted particles was 200 µm and upper 1000 µm.
In addition to the water samples control filters were processed, using the same proceedings as in the water samples, replacing the river/tap water by ultra-pure distilled water [31].
To ensure that the counted items were plastic particles, we processed reference samples of plastic polymers and biological tissue with the same protocol as the water samples. The tested polymers were high-density polyethylene (HDPE), low-density polyethylene (LDPE), polystyrene (PS), expanded polystyrene (EPS), polyethylene terephthalate (PET), and polyester (PES), which are the most common polymers that occur in river water [32]. The biological reference samples were composed of vegetal fibers and fish flesh. The processing of these reference samples showed that HDPE, LDPE, PS, EPS, PET, and PES particles reflected under the fluorescence microscope in bright blue color, vegetal fibers in red and fish flesh in grey. Consequently, all bright blue particles were counted as microplastics.

2.4. Data Processing

The total number of microplastic particles of each sample was composed by the counts of all fibers, pellets, and films. These counts were corrected by the counts of the control filters.
Median concentrations of plastic particles in raw and drinking water were compared by the Mann-Whitney-U test, because data were not normally distributed (Shapiro–Wilk W = 0.81774, p < 0.001). The total sample size was 32, divided in 16 samples of raw water and 16 in drinking water, including the duplicates. The Kolmogorov–Smirnov test was used to compare the frequency distributions of fibers, pellets, and films in both sample categories. R software was used to process data [33].

3. Results

Of all 32 samples only one sample of raw water was plastic free after control filter correction. The raw water of the Sinos River contained a mean particle concentration of 330.2 p L−1 (min = 0, max = 940) while drinking water contained approximately a third of this concentration (mean = 105.8 p L−1, min = 2, max = 459). The Mann–Whitney U test showed that this difference was significant (U = 195, p = 0.011; Figure 2). The distribution of the particle shapes did not differ in raw and drinking water samples (K = 0.48, p = 0.996; Table 1). The mean MP particle concentration, calculated from the samples in duplicates, did not follow the urbanization gradient in the Sinos River basin (Figure 3). The highest concentrations of up to 940 p L−1 were measured at the sampling sites in the headwaters. The lowest concentrations occurred in the middle section, where the river flows in agricultural area with relatively little urban influence. In the urban areas of the lower river reaches, where most of the untreated municipal sewage is discharged, MP concentrations increased again. Considering this distribution pattern, our hypothesis had to be rejected.

4. Discussion

MP particles occurred in all but one analyzed sample of raw and drinking water from the Sinos River. In general terms particle concentrations of 354 p L−1 in Sinos River water were within the wide concentration intervals observed in other hydric systems, like the River Rhine, with a mean particle concentration between Basel and Rotterdam of 5.6 p L−1 [34] and 1473 ± 34 to 3605 ± 497 p L−1 in urban rivers of the Czech Republic [35].
Comparisons of plastic particle concentration of raw water with drinking water derived from the same river are scarce. Vermaire et al. [36] who analyzed raw and drinking water from the Ottawa River found a significant difference of a mean particle concentration of 0.1 p L−1 in raw and 0.02 p L−1 in drinking water, equivalent to an 80% decrease. Pivokonsky et al. [37] analyzed the efficiency of three water treatment plants in urban areas in the Czech Republic and found removal rates between 70% and 83%. The comparison of mean MP counts in raw and drinking water from the Sinos River as well shows a decrease of approximately 70%. Further studies have to show if this value corresponds to the MP removal rate by the water treatment plants. Corrosion of plastic pipes and reservoirs may have occurred between the treatment plants and the faucets, adding MPs to the treated water. However, corrosion of PVC pipes and reservoirs should produce predominantly fragments [38] and not fibers, which were the dominant shape in both groups.
Predominance of fibers in plastic particle composition was reported frequently for water bodies in different regions of the world: Hendrickson et al. [30] found fibers to be the dominant shape in Western Lake Superior, Vermaire et al. [36] showed that 70% of the particles analyzed in the Ottawa River (Canada) were plastic fibers, and in urban estuaries of China Zhao et al. [39] found fibers at a rate of 60% and 85%.
The most common source of fiber contamination in the Sinos River is untreated sewage, considering that an average wash load of 6 kg may release approximately 500,000 polyester fibers [40]. In the headwater areas many residences near the river discharge the sewage from sinks and washing machines directly into the river or its tributaries, without passing through filters and septic tanks. In the entire Sinos River basin, only one municipality treats the municipal sewage, which amounts to less than 10% of the total discharged amount [41]. Additionally, the water providing companies still return the sludge, containing AlSO4, MPs, and other residuals from raw water treatment back into the Sinos River. Part of this pollution returns to the water consumers in form of MPs.
Most of the municipal sewage is generated and discharged in the lower parts of the basin, where the most densely populated areas are located. As shown in Figure 3 the mean particle concentration follows a flat U-pattern during the descent from the headwaters to the lower regions with two peaks: One in the headwaters, the other in the lower areas. In the lower areas of the basin, the amount of particle input generated in urban areas is reflected by the increase of mean particle concentration. Tibbets et al. [14] found major microplastic concentrations downstream from urban areas of Birmingham (UK) in the river sediment, as did Schmidt et al. [42] in the water of an urban stream crossing Berlin (Germany). However, no direct relation between population density and particle concentration is evident. Several studies relate no increase of particle concentration downstream of urban areas. Dris et al. [43] did not find an increase of plastic particle concentration in the Seine downstream of Paris and Klein et al. [44] did not detect a significant correlation between population density and particle concentration in the river Rhein-Main system. Yin et al. [45] found higher MP concentrations in East Dongting Lake adjacent to rural areas than adjacent to urban areas.
In the case of the Sinos River basin, the headwaters as well contain high plastic concentrations. The residences discharging the sewage of washing machines directly into the river and high-water turbulence, which keeps particles in suspension, may be responsible for this result.
Many studies analyzed MPs in food (honey [46]), beverages (beer [46]), air [47] and drinking water [35]. Humans are permanently exposed to microplastic particles of most diverging origins. They are inhaled and swallowed. Microplastics have been found in human stool [48]. However, how many particles may cross the intestine/blood barrier and enter human tissue is not known, much less the possible consequences of the incorporation of plastic particles into the organs. Mattson et al. [49] showed under laboratory conditions, that nano-sized plastic particles passed though the food chain from phytoplankton to zooplankton and fish. Subsequent anatomical analyses located plastic particles in the fish brains. These contaminated individuals showed behavioral disorders when compared to fishes from the control group. The authors of this publication are not aware of studies that analyzed nanoparticles in human food or inhaled air. Methodological problems of analyzing and counting plastic particles increase with smaller particle size. The results of our study were limited to particles > 200 µm. Particles smaller than the lower size limit of each particular study are left unaccounted for [35]. Most probably, nanoparticle exposure exceeds microparticle exposure by far. In this sense it seems to be possible, that effects similar to these observed in fish by Mattson et al. [47] may occur in humans.
The biological and/or chemical pathways of plastic particles in the human body and their direct effect on human health are not clear at present. Hazards may be caused by physical, chemical, and/or biological properties of plastic particles or adhering biofilms [50]. Particularly leaching processes of unbound monomers and additives like bisphenol A, phthalates, and their metabolites are of special concern because of their endocrine disruptive properties [51,52]. Thompson et al. [53] fear that for those substances no safe threshold doses may exist. Additionally, synergistic effects may occur, because humans are exposed simultaneously to many of them.
Considering the omnipresence of MPs in the environment, future research must address the consequences for human and animal health. Do MPs simply pass the intestinal system or exists transport of MP fragments or adsorbed substances into the body tissues? Secondly, efficient methods for the removal of MPs from sewage have to be developed and tested. The presence of MP in raw and river-derived drinking water in the Sinos River basin are adding additional strain on the water quality of the system.

5. Conclusions

The results show that the concentrations of MPs in raw and drinking water of the Sinos River are within the range of other rivers flowing in densely populated areas. High MP concentrations in the headwaters most probably are related to the direct discharge of sewage from washing machines of near river dwelling residents. In downriver sections untreated municipal sewage is considered to be the most important source. Mean MP concentration in drinking water was 105.8 p L−1. MP input sources between raw water treatment plants and the faucets in residences are still unknown and should be targeted in futures studies. The possible impact of MP concentrations in drinking water in relation to public health still needs to be assessed.

Author Contributions

This publication is based on the undergraduate thesis M.F. He collected the water samples, analyzed most of them, processed the data and wrote the first Portuguese version of the publication. A.L.B. is an undergraduate student. She produced the graphical abstract and assisted in the extraction and counting of MPs. V.H.V. is the coordinator of the Laboratory of Genetics and Molecular Biology, which provided the infrastructure for MP analysis. Additionally, he contributed with his experience in analytical proceedings. U.H.S. was the project coordinator, raised funds, translated the Portuguese version and contributed essentially to the data processing and discussion of the study. All authors have read and agreed to the published version of the manuscript.

Funding

The study was partly funded by a grant of the Brazilian National Council for Scientific and Technological Development (CNPq, grant number: 151152/2018-7) and a scholarship of the State Foundation for Research Support (FAPERGS) for A. L. Bauer (no. 20/2551-0000339-6).

Conflicts of Interest

The authors declare no conflict of interest.

References

  1. Aquatic Sciences and Fisheries Database (ASFA) ASFA. Available online: https://search-proquest.ez101.periodicos.capes.gov.br/asfaaquaculture/results/1BA41A9A5DEF4EA5PQ/1?accountid=26688 (accessed on 10 June 2020).
  2. Faure, F.; Corbaz, M.; Baecher, H.; Neuhaus, V.; Alencastro, L.F. Pollution due to Plastics and Microplastics in Lake Geneva. Arch. Sci. 2012, 65, 157–164. [Google Scholar]
  3. Castañeda, R.A.; Avlijas, S.; Simard, M.A.; Ricciardi, A. Microplastic pollution in St. Lawrence River sediments. Can. J. Fish. Aquat. Sci. 2014, 71, 1767–1771. [Google Scholar] [CrossRef]
  4. Brennecke, D.; Ferreira, E.C.; Costa, T.M.M.; Appel, D.; da Gama, B.A.P.; Lenz, M. Ingested microplastics (>100μm) are translocated to organs of the tropical fiddler crab Uca rapax. Mar. Pollut. Bull. 2015, 96, 491–495. [Google Scholar] [CrossRef] [PubMed]
  5. Silva-Cavalcanti, J.S.; Silva, J.D.B.; de França, E.J.; de Araújo, M.C.B.; Gusmão, F. Microplastics ingestion by a common tropical freshwater fishing resource. Environ. Pollut. 2017, 221, 218–226. [Google Scholar] [CrossRef] [PubMed]
  6. McCormick, A.R.; Hoellein, T.J.; London, M.G.; Hittie, J.; Scott, J.W.; Kelly, J.J. Microplastic in surface waters of urban rivers: Concentration, sources, and associated bacterial assemblages. Ecosphere 2016, 7, e01556. [Google Scholar] [CrossRef]
  7. Nelms, S.E.; Galloway, T.S.; Godley, B.J.; Jarvis, D.S.; Lindeque, P.K. Investigating microplastic trophic transfer in marine top predators. Environ. Pollut. 2018, 238, 999–1007. [Google Scholar] [CrossRef]
  8. Tsang, Y.Y.; Mak, C.W.; Liebich, C.; Lam, S.W.; Sze, E.T.-P.; Chan, K.M. Microplastic pollution in the marine waters and sediments of Hong Kong. Mar. Pollut. Bull. 2017, 115, 20–28. [Google Scholar] [CrossRef]
  9. Ramírez-Álvarez, N.; Rios Mendoza, L.M.; Macías-Zamora, J.V.; Oregel-Vázquez, L.; Alvarez-Aguilar, A.; Hernández-Guzmán, F.A.; Sánchez-Osorio, J.L.; Moore, C.J.; Silva-Jiménez, H.; Navarro-Olache, L.F. Microplastics: Sources and distribution in surface waters and sediments of Todos Santos Bay, Mexico. Sci. Total Environ. 2020, 703, 134838. [Google Scholar] [CrossRef] [PubMed]
  10. Anderson, P.J.; Warrack, S.; Langen, V.; Challis, J.K.; Hanson, M.L.; Rennie, M.D. Microplastic contamination in Lake Winnipeg, Canada. Environ. Pollut. 2017, 225, 223–231. [Google Scholar] [CrossRef]
  11. Miller, R.Z.; Watts, A.J.R.; Winslow, B.O.; Galloway, T.S.; Barrows, A.P.W. Mountains to the sea: River study of plastic and non-plastic microfiber pollution in the northeast USA. Mar. Pollut. Bull. 2017, 124, 245–251. [Google Scholar] [CrossRef]
  12. Free, C.M.; Jensen, O.P.; Mason, S.A.; Eriksen, M.; Williamson, N.J.; Boldgiv, B. High-levels of microplastic pollution in a large, remote, mountain lake. Mar. Pollut. Bull. 2014, 85, 156–163. [Google Scholar] [CrossRef]
  13. Ravit, B.; Cooper, K.; Moreno, G.; Buckley, B.; Yang, I.; Deshpande, A.; Meola, S.; Jones, D.; Hsieh, A. Microplastics in urban New Jersey freshwaters: Distribution, chemical identification, and biological affects. AIMS Environ. Sci. 2017, 4, 809–826. [Google Scholar] [CrossRef]
  14. Tibbetts, J.; Krause, S.; Lynch, I.; Sambrook Smith, G.H. Abundance, Distribution and Drivers of Microplastic Contaminant in Urban River Environments. Water 2018, 10, 1597. [Google Scholar] [CrossRef] [Green Version]
  15. Castro, R.O.; da Silva, M.L.; de Araújo, F.V. Review on microplastic studies in Brazilian aquatic ecosystems. Ocean Coast. Manag. 2018, 165, 385–400. [Google Scholar] [CrossRef]
  16. Gomes, C.M.B. Lançamento de partículas de polietileno à costa do Rio Grande do Sul. Sep. Rev. Veritas 1973, 70/73, 174–206. [Google Scholar]
  17. De Carvalho, D.G.; Baptista Neto, J.A. Microplastic pollution of the beaches of Guanabara Bay, Southeast Brazil. Ocean Coast. Manag. 2016, 128, 10–17. [Google Scholar] [CrossRef]
  18. Olivatto, G.P.; Martins, M.C.T.; Montagner, C.C.; Henry, T.B.; Carreira, R.S. Microplastic contamination in surface waters in Guanabara Bay, Rio de Janeiro, Brazil. Mar. Pollut. Bull. 2019, 139, 157–162. [Google Scholar] [CrossRef]
  19. Vendel, A.L.; Bessa, F.; Alves, V.E.N.; Amorim, A.L.A.; Patrício, J.; Palma, A.R.T. Widespread microplastic ingestion by fish assemblages in tropical estuaries subjected to anthropogenic pressures. Mar. Pollut. Bull. 2017, 117, 448–455. [Google Scholar] [CrossRef]
  20. Andrade, M.C.; Winemiller, K.O.; Barbosa, P.S.; Fortunati, A.; Chelazzi, D.; Cincinelli, A.; Giarrizzo, T. First account of plastic pollution impacting freshwater fishes in the Amazon: Ingestion of plastic debris by piranhas and other serrasalmids with diverse feeding habits. Environ. Pollut. 2019, 244, 766–773. [Google Scholar] [CrossRef] [PubMed]
  21. Dris, R.; Gasperi, J.; Mirande, C.; Mandin, C.; Guerrouache, M.; Langlois, V.; Tassin, B. A first overview of textile fibers, including microplastics, in indoor and outdoor environments. Environ. Pollut. 2017, 221, 453–458. [Google Scholar] [CrossRef] [Green Version]
  22. Prata, J.C. Airborne microplastics: Consequences to human health? Environ. Pollut. 2018, 234, 115–126. [Google Scholar] [CrossRef]
  23. Waring, R.H.; Harris, R.M.; Mitchell, S.C. Plastic contamination of the food chain: A threat to human health? Maturitas 2018, 115, 64–68. [Google Scholar] [CrossRef]
  24. Koelmans, A.A.; Mohamed Nor, N.H.; Hermsen, E.; Kooi, M.; Mintenig, S.M.; De France, J. Microplastics in freshwaters and drinking water: Critical review and assessment of data quality. Water Res. 2019, 155, 410–422. [Google Scholar] [CrossRef]
  25. Caracterização da Bacia Hidrográfica do Rio dos Sinos. Available online: http://www.comitesinos.com.br/bacia-hidrografica-do-rio-dos-sinos (accessed on 20 October 2020).
  26. Blume, K.; Macedo, J.; Meneguzzi, A.; Silva, L.; Quevedo, D.; Rodrigues, M. Water quality assessment of the Sinos River, Southern Brazil. Braz. J. Biol. 2010, 70, 1185–1193. [Google Scholar] [CrossRef] [Green Version]
  27. Karlsson, T.M.; Vethaak, A.D.; Almroth, B.C.; Ariese, F.; van Velzen, M.; Hassellöv, M.; Leslie, H.A. Screening for microplastics in sediment, water, marine invertebrates and fish: Method development and microplastic accumulation. Mar. Pollut. Bull. 2017, 122, 403–408. [Google Scholar] [CrossRef]
  28. Karami, A.; Golieskardi, A.; Choo, C.K.; Romano, N.; Ho, Y.B.; Salamatinia, B. A high-performance protocol for extraction of microplastics in fish. Sci. Total Environ. 2017, 578, 485–494. [Google Scholar] [CrossRef] [PubMed]
  29. Maes, T.; Jessop, R.; Wellner, N.; Haupt, K.; Mayes, A.G. A rapid-screening approach to detect and quantify microplastics based on fluorescent tagging with Nile Red. Sci. Rep. 2017, 7, 44501. [Google Scholar] [CrossRef] [Green Version]
  30. Hendrickson, E.; Minor, E.C.; Schreiner, K. Microplastic Abundance and Composition in Western Lake Superior As Determined via Microscopy, Pyr-GC/MS, and FTIR. Environ. Sci. Technol. 2018, 52, 1787–1796. [Google Scholar] [CrossRef]
  31. Mintenig, S.M.; Löder, M.G.J.; Primpke, S.; Gerdts, G. Low numbers of microplastics detected in drinking water from ground water sources. Sci. Total Environ. 2019, 648, 631–635. [Google Scholar] [CrossRef]
  32. Di, M.; Wang, J. Microplastics in surface waters and sediments of the Three Gorges Reservoir, China. Sci. Total Environ. 2018, 616–617, 1620–1627. [Google Scholar] [CrossRef]
  33. R Core Team. R: A Language and Environment for Statistical Computing; R Foundation for Statistical Computing: Vienna, Austria, 2020; Available online: https://www.R-project.org/ (accessed on 10 June 2020).
  34. Mani, T.; Hauk, A.; Walter, U.; Burkhardt-Holm, P. Microplastics profile along the Rhine River. Sci. Rep. 2016, 5, 17988. [Google Scholar] [CrossRef]
  35. Pivokonsky, M.; Cermakova, L.; Novotna, K.; Peer, P.; Cajthaml, T.; Janda, V. Occurrence of microplastics in raw and treated drinking water. Sci. Total Environ. 2018, 643, 1644–1651. [Google Scholar] [CrossRef]
  36. Vermaire, J.C.; Pomeroy, C.; Herczegh, S.M.; Haggart, O.; Murphy, M. Microplastic abundance and distribution in the open water and sediment of the Ottawa River, Canada, and its tributaries. FACETS 2017, 2, 301–314. [Google Scholar] [CrossRef] [Green Version]
  37. Pivokonský, M.; Pivokonská, L.; Novotná, K.; Čermáková, L.; Klimtová, M. Occurrence and fate of microplastics at two different drinking water treatment plants within a river catchment. Sci. Total Environ. 2020, 741, 140236. [Google Scholar] [CrossRef] [PubMed]
  38. Brossia, S. Corrosion of Pipes in Drinking Water Systems. In Handbook of Environmental Degradation of Materials; Elsevier: Amsterdam, The Netherlands, 2018; pp. 489–505. ISBN 978-0-323-52472-8. [Google Scholar]
  39. Zhao, S.; Zhu, L.; Wang, T.; Li, D. Suspended microplastics in the surface water of the Yangtze Estuary System, China: First observations on occurrence, distribution. Mar. Pollut. Bull. 2014, 86, 562–568. [Google Scholar] [CrossRef]
  40. Napper, I.E.; Thompson, R.C. Release of synthetic microplastic plastic fibres from domestic washing machines: Effects of fabric type and washing conditions. Mar. Pollut. Bull. 2016, 112, 39–45. [Google Scholar] [CrossRef] [PubMed] [Green Version]
  41. Costa, M.F.; Ivar do Sul, J.A.; Silva-Cavalcanti, J.S.; Araújo, M.C.B.; Spengler, Â.; Tourinho, P.S. On the importance of size of plastic fragments and pellets on the strandline: A snapshot of a Brazilian beach. Environ. Monit. Assess. 2010, 168, 299–304. [Google Scholar] [CrossRef] [PubMed]
  42. Schmidt, L.K.; Bochow, M.; Imhof, H.K.; Oswald, S.E. Multi-temporal surveys for microplastic particles enabled by a novel and fast application of SWIR imaging spectroscopy—Study of an urban watercourse traversing the city of Berlin, Germany. Environ. Pollut. 2018, 239, 579–589. [Google Scholar] [CrossRef] [Green Version]
  43. Dris, R.; Gasperi, J.; Rocher, V.; Tassin, B. Synthetic and non-synthetic anthropogenic fibers in a river under the impact of Paris Megacity: Sampling methodological aspects and flux estimations. Sci. Total Environ. 2018, 618, 157–164. [Google Scholar] [CrossRef] [Green Version]
  44. Klein, S.; Worch, E.; Knepper, T.P. Occurrence and Spatial Distribution of Microplastics in River Shore Sediments of the Rhine-Main Area in Germany. Environ. Sci. Technol. 2015, 49, 6070–6076. [Google Scholar] [CrossRef]
  45. Yin, L.; Wen, X.; Du, C.; Jiang, J.; Wu, L.; Zhang, Y.; Hu, Z.; Hu, S.; Feng, Z.; Zhou, Z.; et al. Comparison of the abundance of microplastics between rural and urban areas: A case study from East Dongting Lake. Chemosphere 2020, 244, 125486. [Google Scholar] [CrossRef] [PubMed]
  46. Kosuth, M.; Mason, S.A.; Wattenberg, E.V. Anthropogenic contamination of tap water, beer, and sea salt. PLoS ONE 2018, 13, e0194970. [Google Scholar] [CrossRef] [PubMed]
  47. Dris, R.; Imhof, H.; Sanchez, W.; Gasperi, J.; Galgani, F.; Tassin, B.; Laforsch, C. Beyond the ocean: Contamination of freshwater ecosystems with (micro-)plastic particles. Environ. Chem. 2015, 12, 539–550. [Google Scholar] [CrossRef]
  48. Schwabl, P.; Köppel, S.; Königshofer, P.; Bucsics, T.; Trauner, M.; Reiberger, T.; Liebmann, B. Detection of Various Microplastics in Human Stool: A Prospective Case Series. Ann. Intern. Med. 2019, 171, 453–457. [Google Scholar] [CrossRef] [PubMed]
  49. Mattsson, K.; Johnson, E.V.; Malmendal, A.; Linse, S.; Hansson, L.-A.; Cedervall, T. Brain damage and behavioural disorders in fish induced by plastic nanoparticles delivered through the food chain. Sci. Rep. 2017, 7, 11452. [Google Scholar] [CrossRef]
  50. World Health Organization. Microplastics in Drinking-Water; Licence: CC BY-NC-SA 3.0 IGO; World Health Organization: Geneva, Switzerland, 2019; ISBN 978-92-4-151619-8. Available online: https://www.who.int/water_sanitation_health/publications/microplastics-in-drinking-water/en/ (accessed on 10 March 2020).
  51. Chen, Q.; Allgeier, A.; Yin, D.; Hollert, H. Leaching of endocrine disrupting chemicals from marine microplastics and mesoplastics under common life stress conditions. Environ. Int. 2019, 130, 104938. [Google Scholar] [CrossRef]
  52. Li, J.; Liu, H.; Paul Chen, J. Microplastics in freshwater systems: A review on occurrence, environmental effects, and methods for microplastics detection. Water Res. 2018, 137, 362–374. [Google Scholar] [CrossRef]
  53. Thompson, R.C.; Moore, C.J.; vom Saal, F.S.; Swan, S.H. Plastics, the environment and human health: Current consensus and future trends. Philos. Trans. Royal Soc. B Biol. Sci. 2009, 364, 2153–2166. [Google Scholar] [CrossRef]
Figure 1. (A), South America; (B), Brazil; (C), Brazil´s southernmost state Rio Grande do Sul; (D), Sinos River basin. Blue dots = Raw water collection sites, red dots = drinking water collection sites in the residences. All residences were supplied with treated Sinos water.
Water 12 03115 g001
Figure 2. Box and whisker plot showing median (black line), total range (whiskers), the inter-quartile range (grey box), and outliers (dots) of MP particle concentrations in samples of drinking and raw water in the Sinos River basin.
Water 12 03115 g002
Figure 3. Mean particle concentration from two river water samples following the urbanization gradient of the Sinos River basin (low numbers = headwater sites; bars = standard deviation).
Water 12 03115 g003
Table 1. Particle shapes in raw and drinking water of the Sinos River basin.
% Fibers% Pellets% Filmsp
Raw water89.410.50.10.996
Drinking water80.219.10.7
Publisher’s Note: MDPI stays neutral with regard to jurisdictional claims in published maps and institutional affiliations.

