Article

Impact of the City on the Rapid Increase in the Runoff and Transport of Suspended and Dissolved Solids During Rainfall—The Example of the Silnica River (Kielce, Poland)

Division of Environmental Research and Geo-Information, Institute of Geography and Environmental Sciences, Jan Kochanowski University, Uniwersytecka 7, 25-406 Kielce, Poland
*
Author to whom correspondence should be addressed.
Water 2020, 12(10), 2693; https://doi.org/10.3390/w12102693
Submission received: 23 July 2020 / Revised: 10 September 2020 / Accepted: 24 September 2020 / Published: 26 September 2020
(This article belongs to the Special Issue Urban Rainwater and Flood Management)

Abstract

:
Urbanisation changes the water cycle and affects the parameters of transported, suspended and dissolved matter, especially in small river catchments. This paper presents the reasons why river runoff and fluvial transport rapidly increase during rainfall-induced summer floods in the stretch of the Silnica River that flows through the centre of Kielce, a city with a population of 200,000. Examples of implemented hydrotechnical solutions that aim to reduce the height of flood waves and eliminate water accumulation are also presented. The 18.05 km long Silnica River drains a catchment area of 49.4 km2. It flows through areas of varied land use, which have determined the location of five hydrometric stations (outlets) at different sub-catchments: Dabrowa(forest), Piaski (suburbia) and Jesionowa (includes a reservoir), as well as Pakosz and Bialogon (largely impervious areas in the city centre). Specific runoff, suspended and dissolved solids concentration and the specific load of these two types of fluvial transport were determined. It was found that the maximum specific runoff in the outlets of urban sub-catchments was significantly higher during floods than those of the sub-catchments upstream of the city centre; the suspended solids concentration was several times higher, and the suspended solids load was approximately 200 times higher. Recognition of the basic parameters of rainfall-induced flood waves, as well as the dynamics and size of fluvial transport at the hydrometric stations, especially at the outlets of sub-catchments with a large proportion of impervious area (approximately 30%), has become the basis for the development and implementation of modernisation projects and the construction of hydrotechnical facilities and devices in the river channel in the centre of Kielce.

1. Introduction

Natural systems of the circulation of matter, especially in small river catchments, have been disturbed by increasing urbanisation [1,2]. Cities contain a large proportion of impervious surfaces (roofs, roads, parking lots, etc.), which causes changes in the water cycle. As a consequence, surface runoff accelerates, which significantly increases the culmination and volume of flood waves. Moreover, concentration-time is shortened, and flow velocity in the river channel increases [3,4,5,6,7,8,9,10]. Additionally, human activity leads to an increase in impurities in watercourses, transported in the form of suspended and dissolved solids [11,12,13,14,15,16,17] and delivered from various areas, lines and point sources [18,19,20,21].
The analysis of the most intense fluvial processes occurring during rainfall-induced floods has been the subject of many studies [22,23,24,25,26,27,28]. There are fewer papers, however, on these processes in rivers that drain urbanised areas [29,30]. To date, research devoted to the analysis of the dynamics of suspended and dissolved material in rainwater in urban catchments has predominated [31,32,33,34,35,36,37]. There is, therefore, an insufficient number of papers that show the dynamics and mechanisms of hydrological processes and fluvial transport during floods in catchments with a significant share of urbanised areas.
Recognition of hydrological processes and the size of fluvial transport during rainfall in urban areas is essential for understanding the cognitive and utilitarian effects of the design of, and the need for, flood protection. For this reason, interest in urban hydrology has increased significantly in recent decades. Suspended solids flow along with the water. When transported in excess, they may cause damage to technical infrastructure (especially inappropriately designed bridges and road crossings) [38].
Potential damage to technical infrastructure can be minimised by structural solutions. One rational approach is the analysis of the vulnerability of technical infrastructure to floods [39]. In small watercourses that flow through urban areas, flood damage to hydrotechnical infrastructure can be reduced by modernization and reconstruction on the basis of hydrological analyses.
The purpose of this paper is to demonstrate the important role of an urban area in the rapid increase in river runoff and fluvial transport during rainfall-induced floods of various origins, as well as to present hydrotechnical solutions that can be implemented to reduce flood risk, using the example of the Silnica River, a watercourse that flows through the centre of the city of Kielce (Poland).

2. Materials and Methods
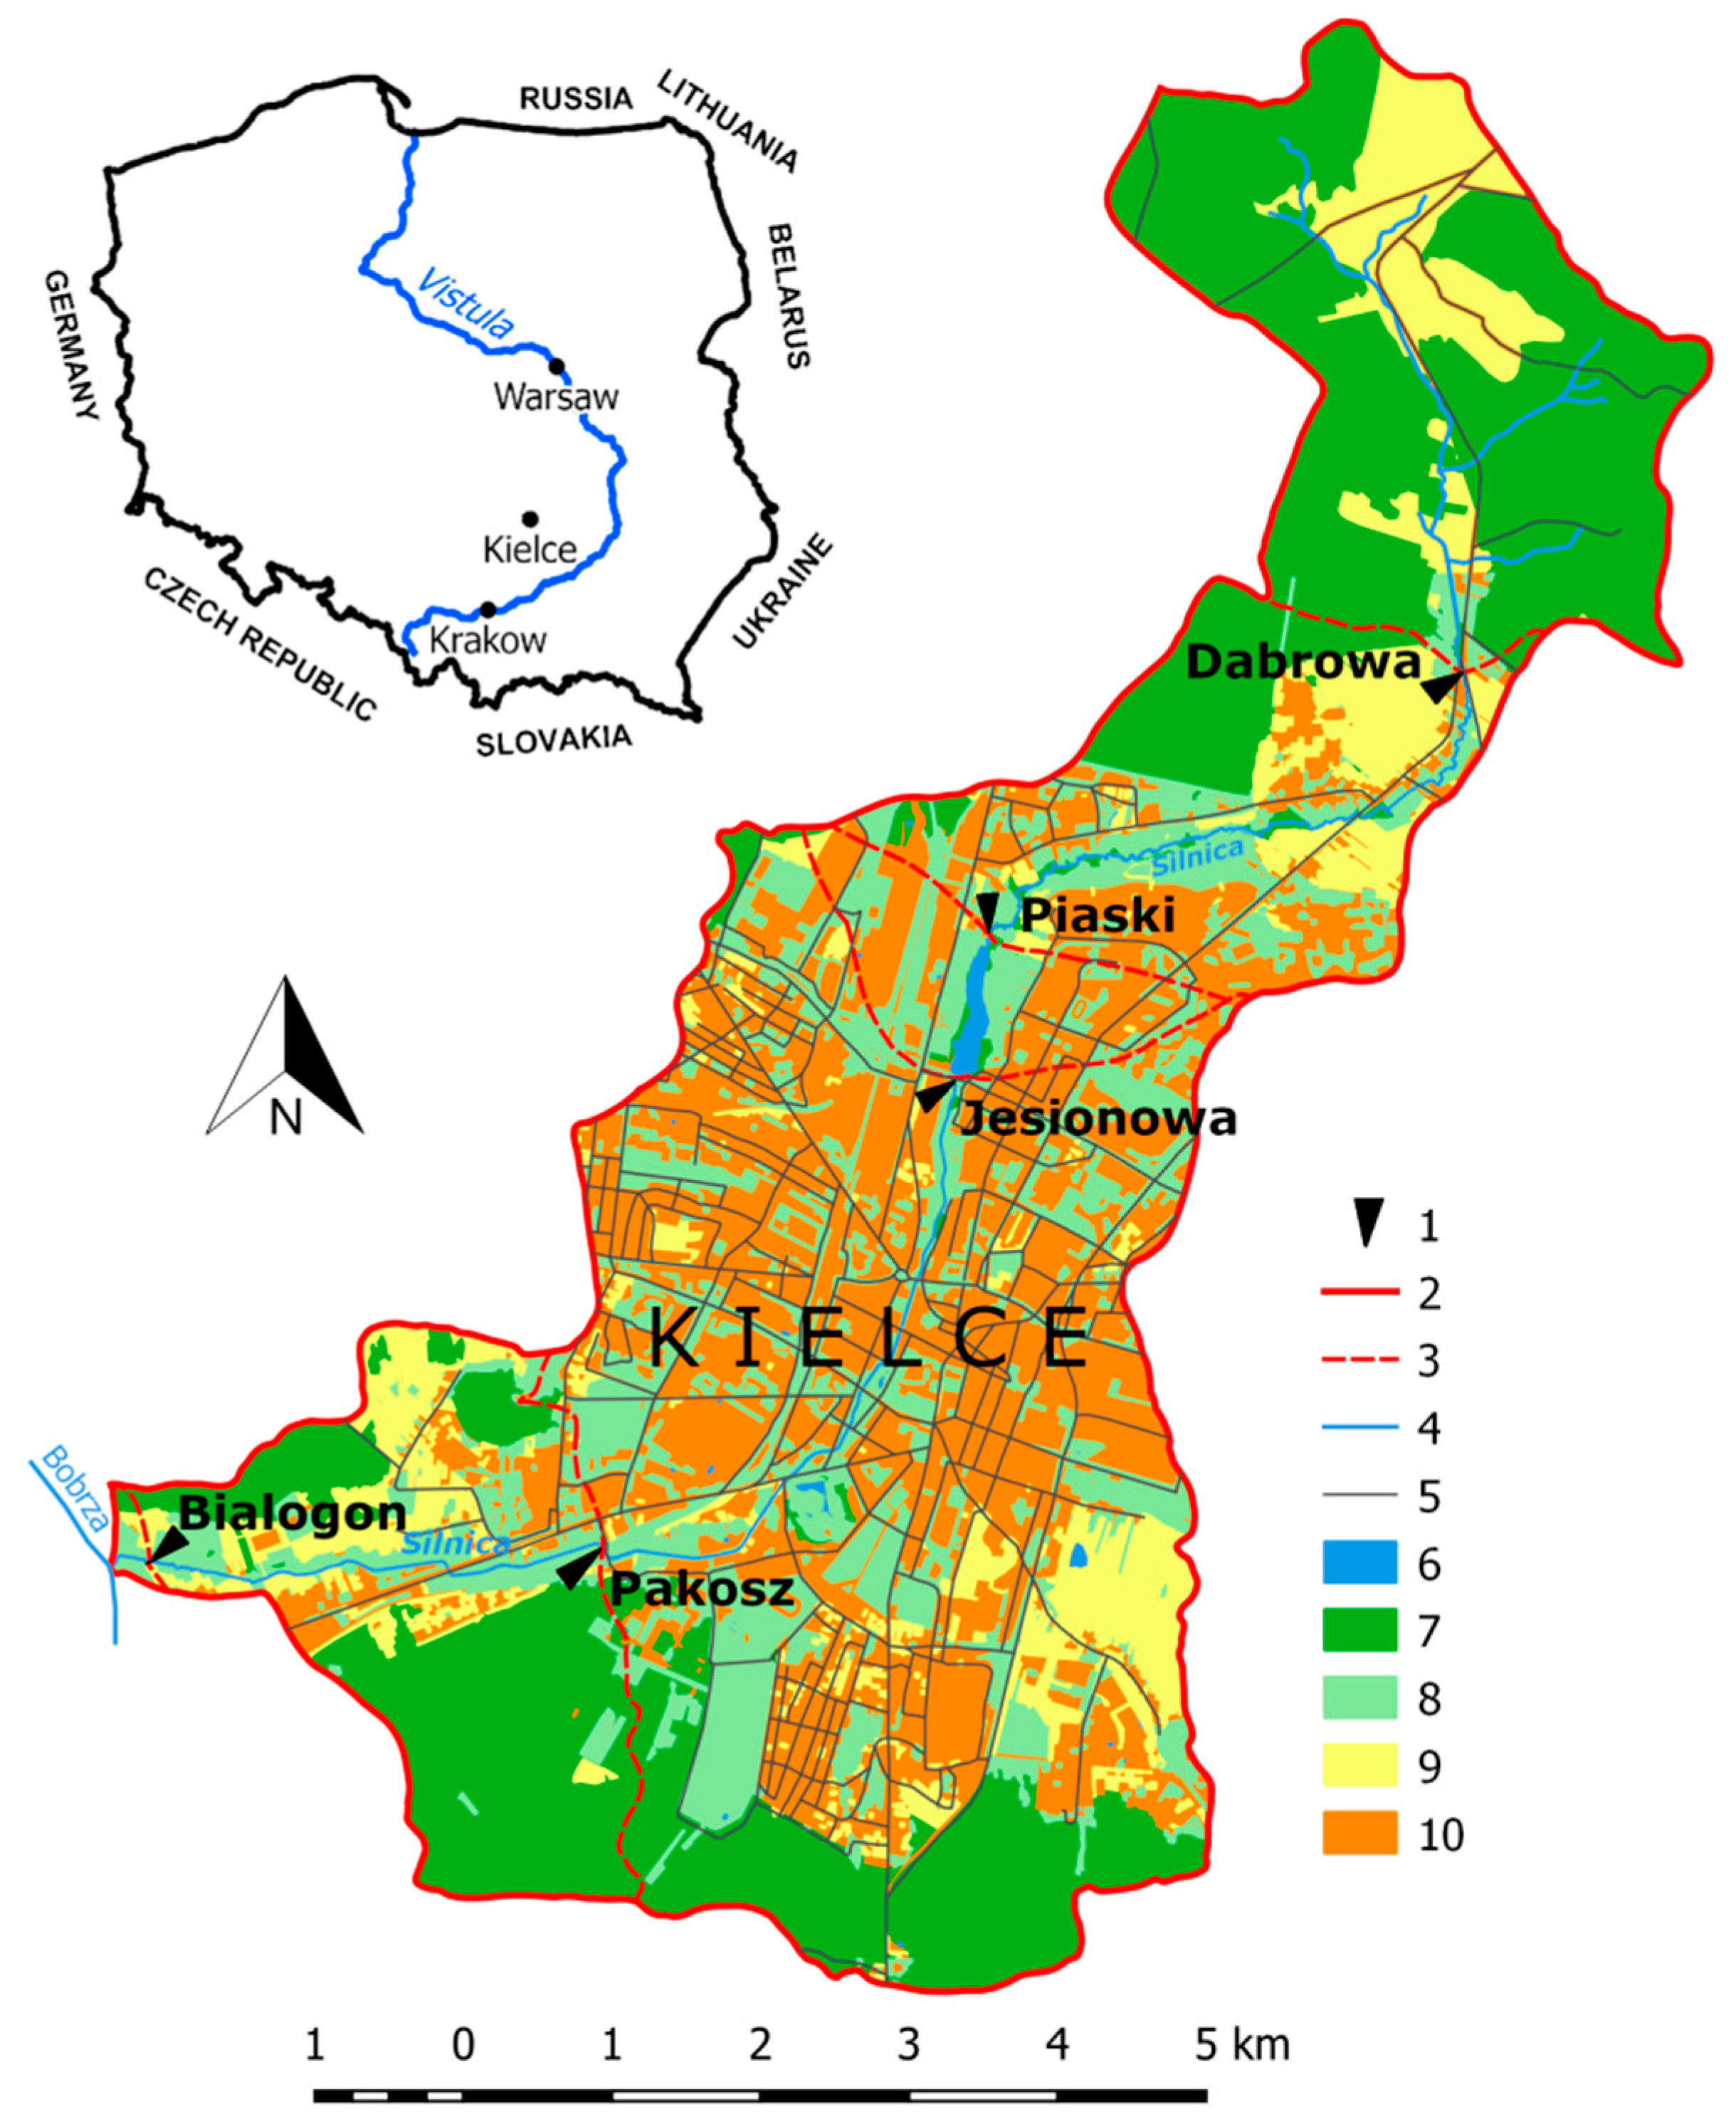
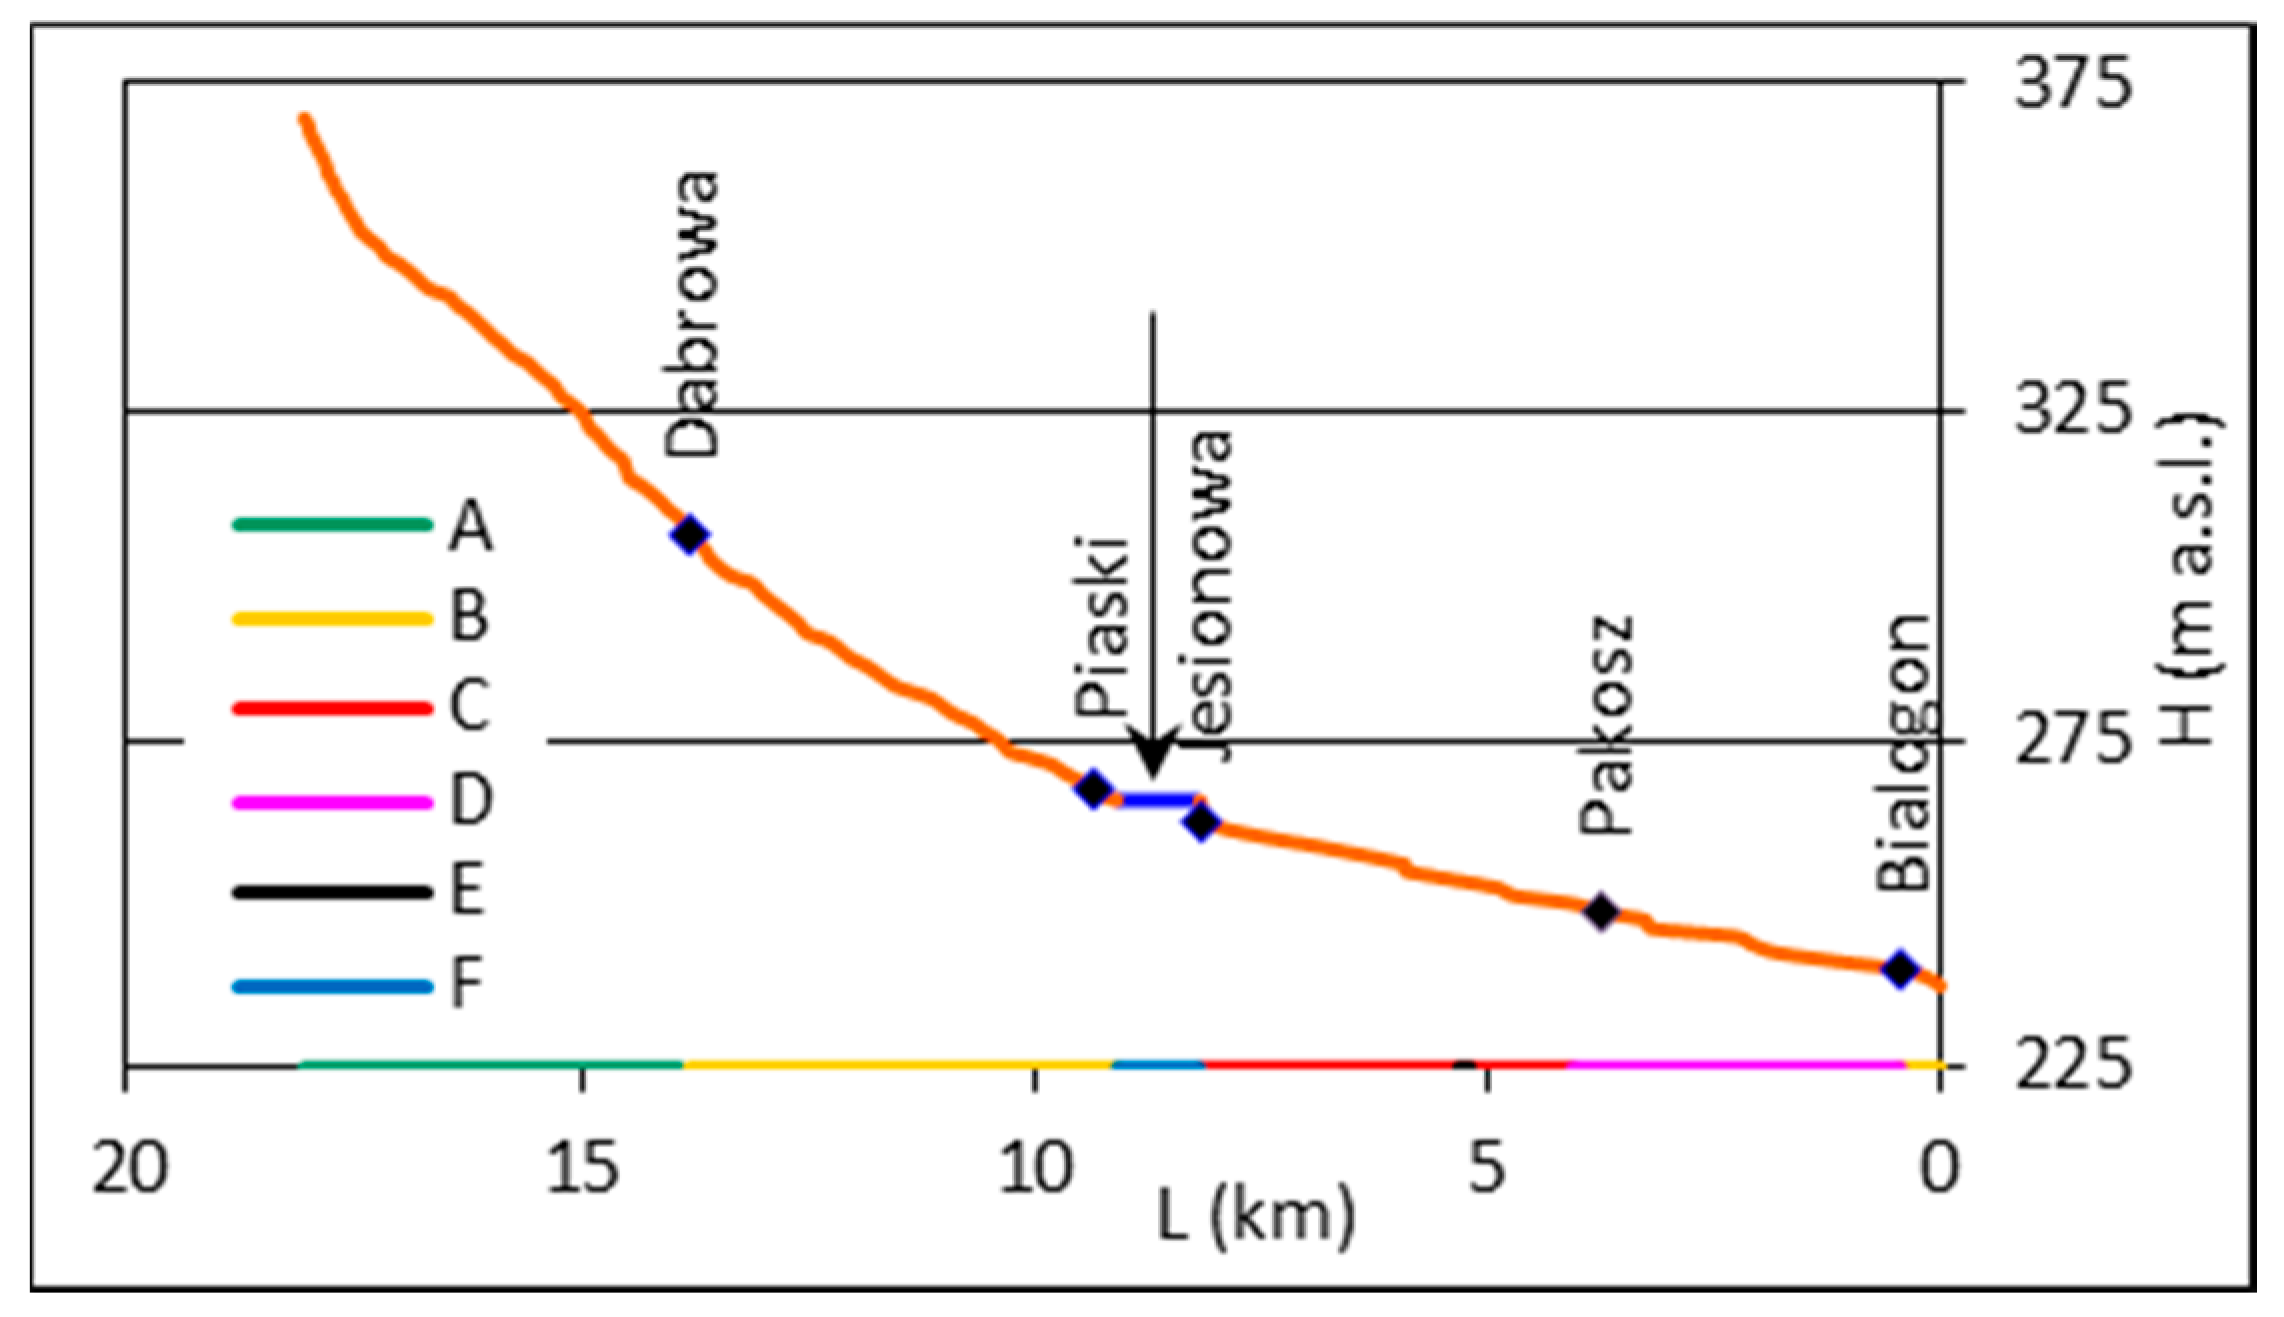
2.1. Study Area

The Silnica River (18.05 km) flows through the centre of Kielce, the capital of Swietokrzyskie Voivodeship in central Poland with a population of approx. 200,000 [40]. Along the course of the river, land use in its 49.4 km2 catchment changes significantly (Figure 1). This diversity has determined the location of five hydrometric stations at the sub-catchment outlets. In the upper part of the Silnica catchment (at the Dabrowa outlet), forests cover as much as 72.9% of the total area (Table 1). In the next two sub-catchments, i.e., at Piaski and Jesionowa outlets, the share of forest decreases, while that of impervious areas increases (12.7% and 17.4%, respectively). Between the Piaski and Jesionowa outlets, there is an artificial reservoir of 10.5 ha with a capacity of 170,000 m3. Below the centre of Kielce, the Silnica catchment ends at the Pakosz outlet, at which the share of impervious areas reaches 30.2%. Towards the river mouth, this percentage decreases to 27.6% (at the Bialogon outlet). The studied catchment area is located within the Paleozoic core of the Holy Cross Mountains, where various types of sedimentary rock (quartzite sandstones, sandstones, clay-stones, marls, limestones, dolomites) occur on the surface. The geological structure of the area conditions the occurrence of parallel inselberg ranges and mountain ridges separated by broad depressions with less resistant rocks. It is an area of highly diversified relief, where the maximum elevation is 455.7 m (Mount Wisniowka), and the minimum 239.2 m (Silnica mouth), with a mean catchment slope of 53.2‰ [41].

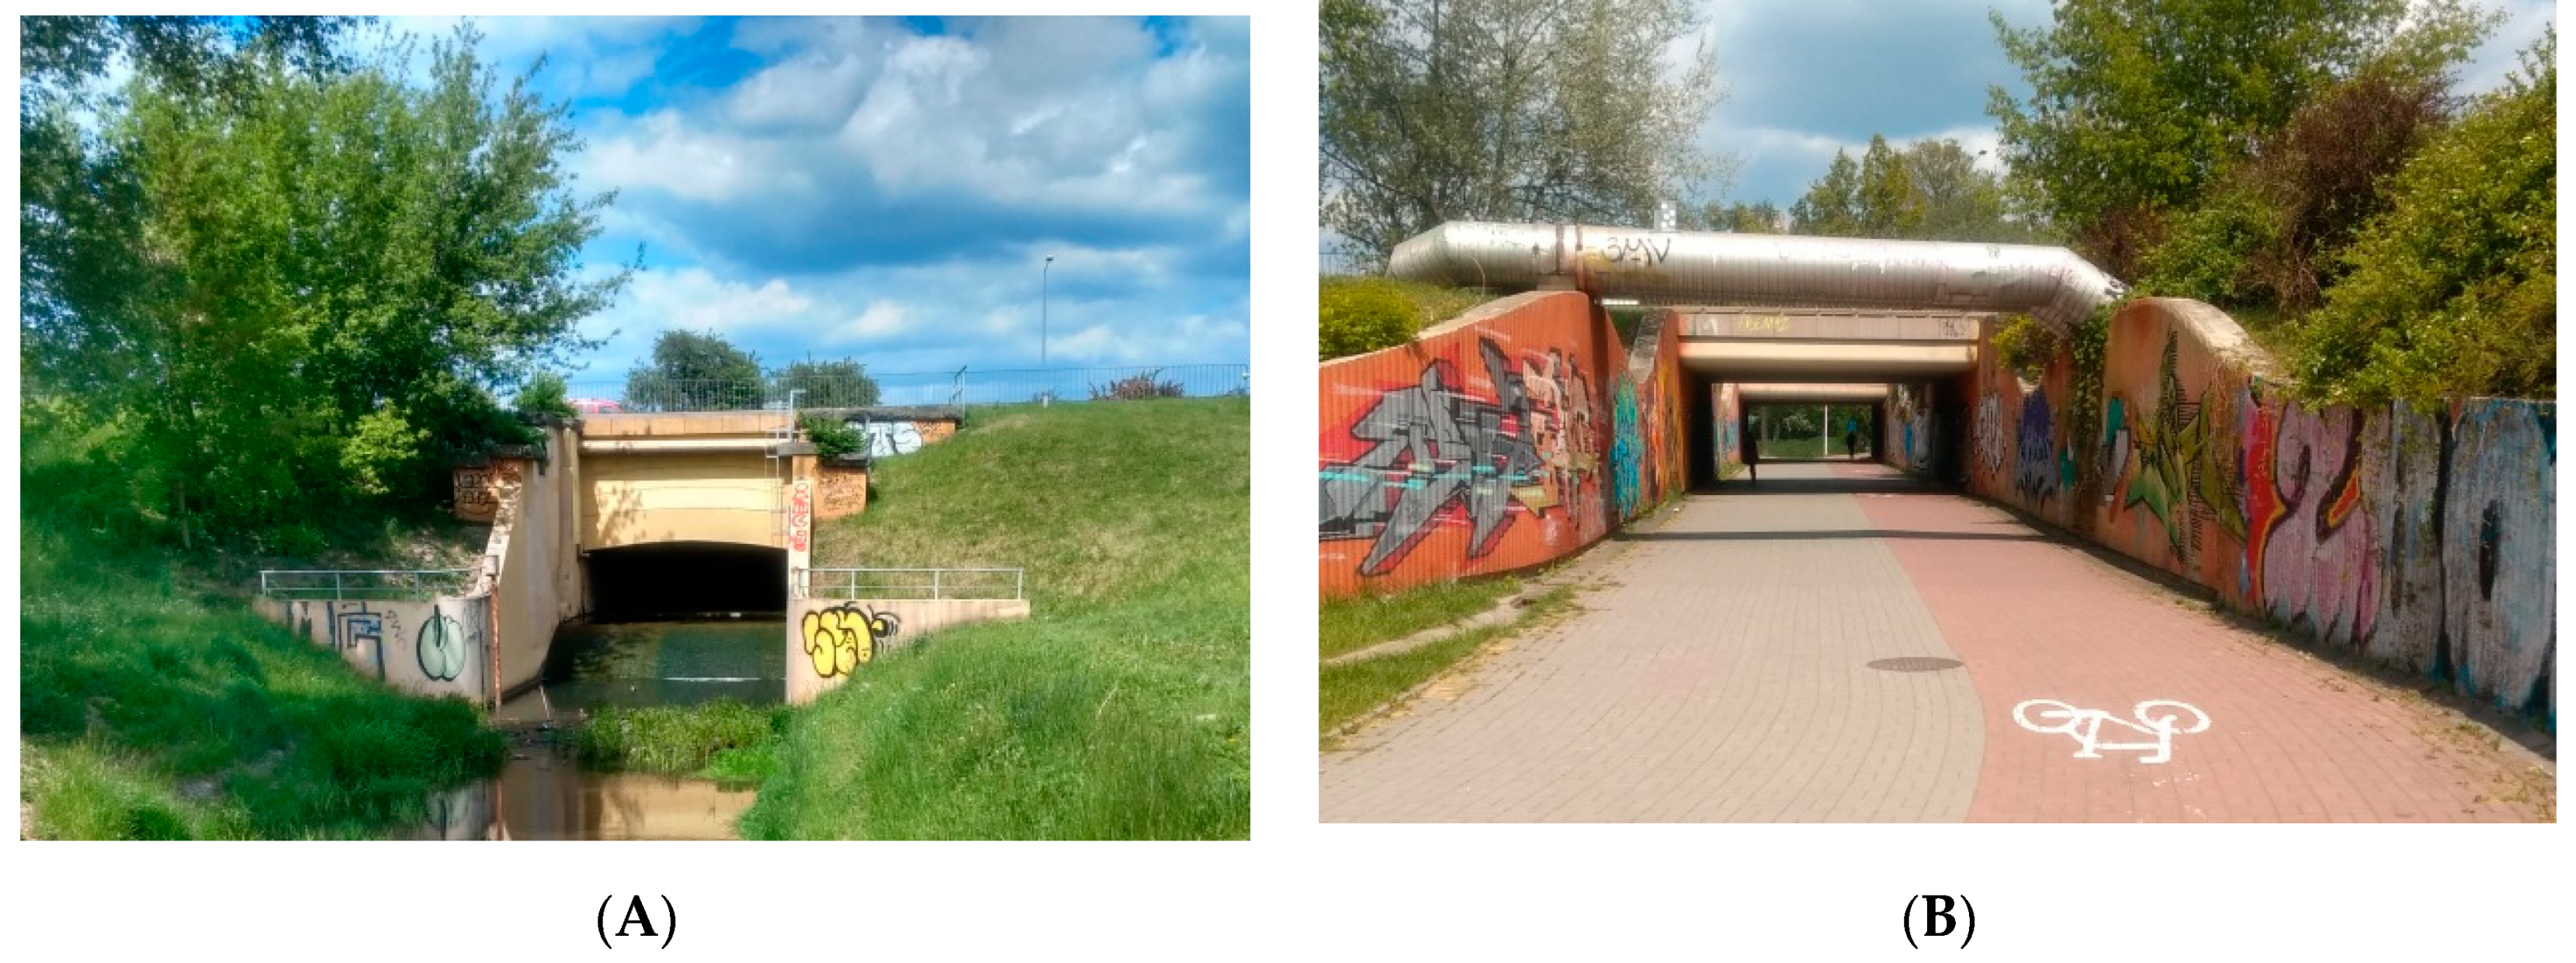
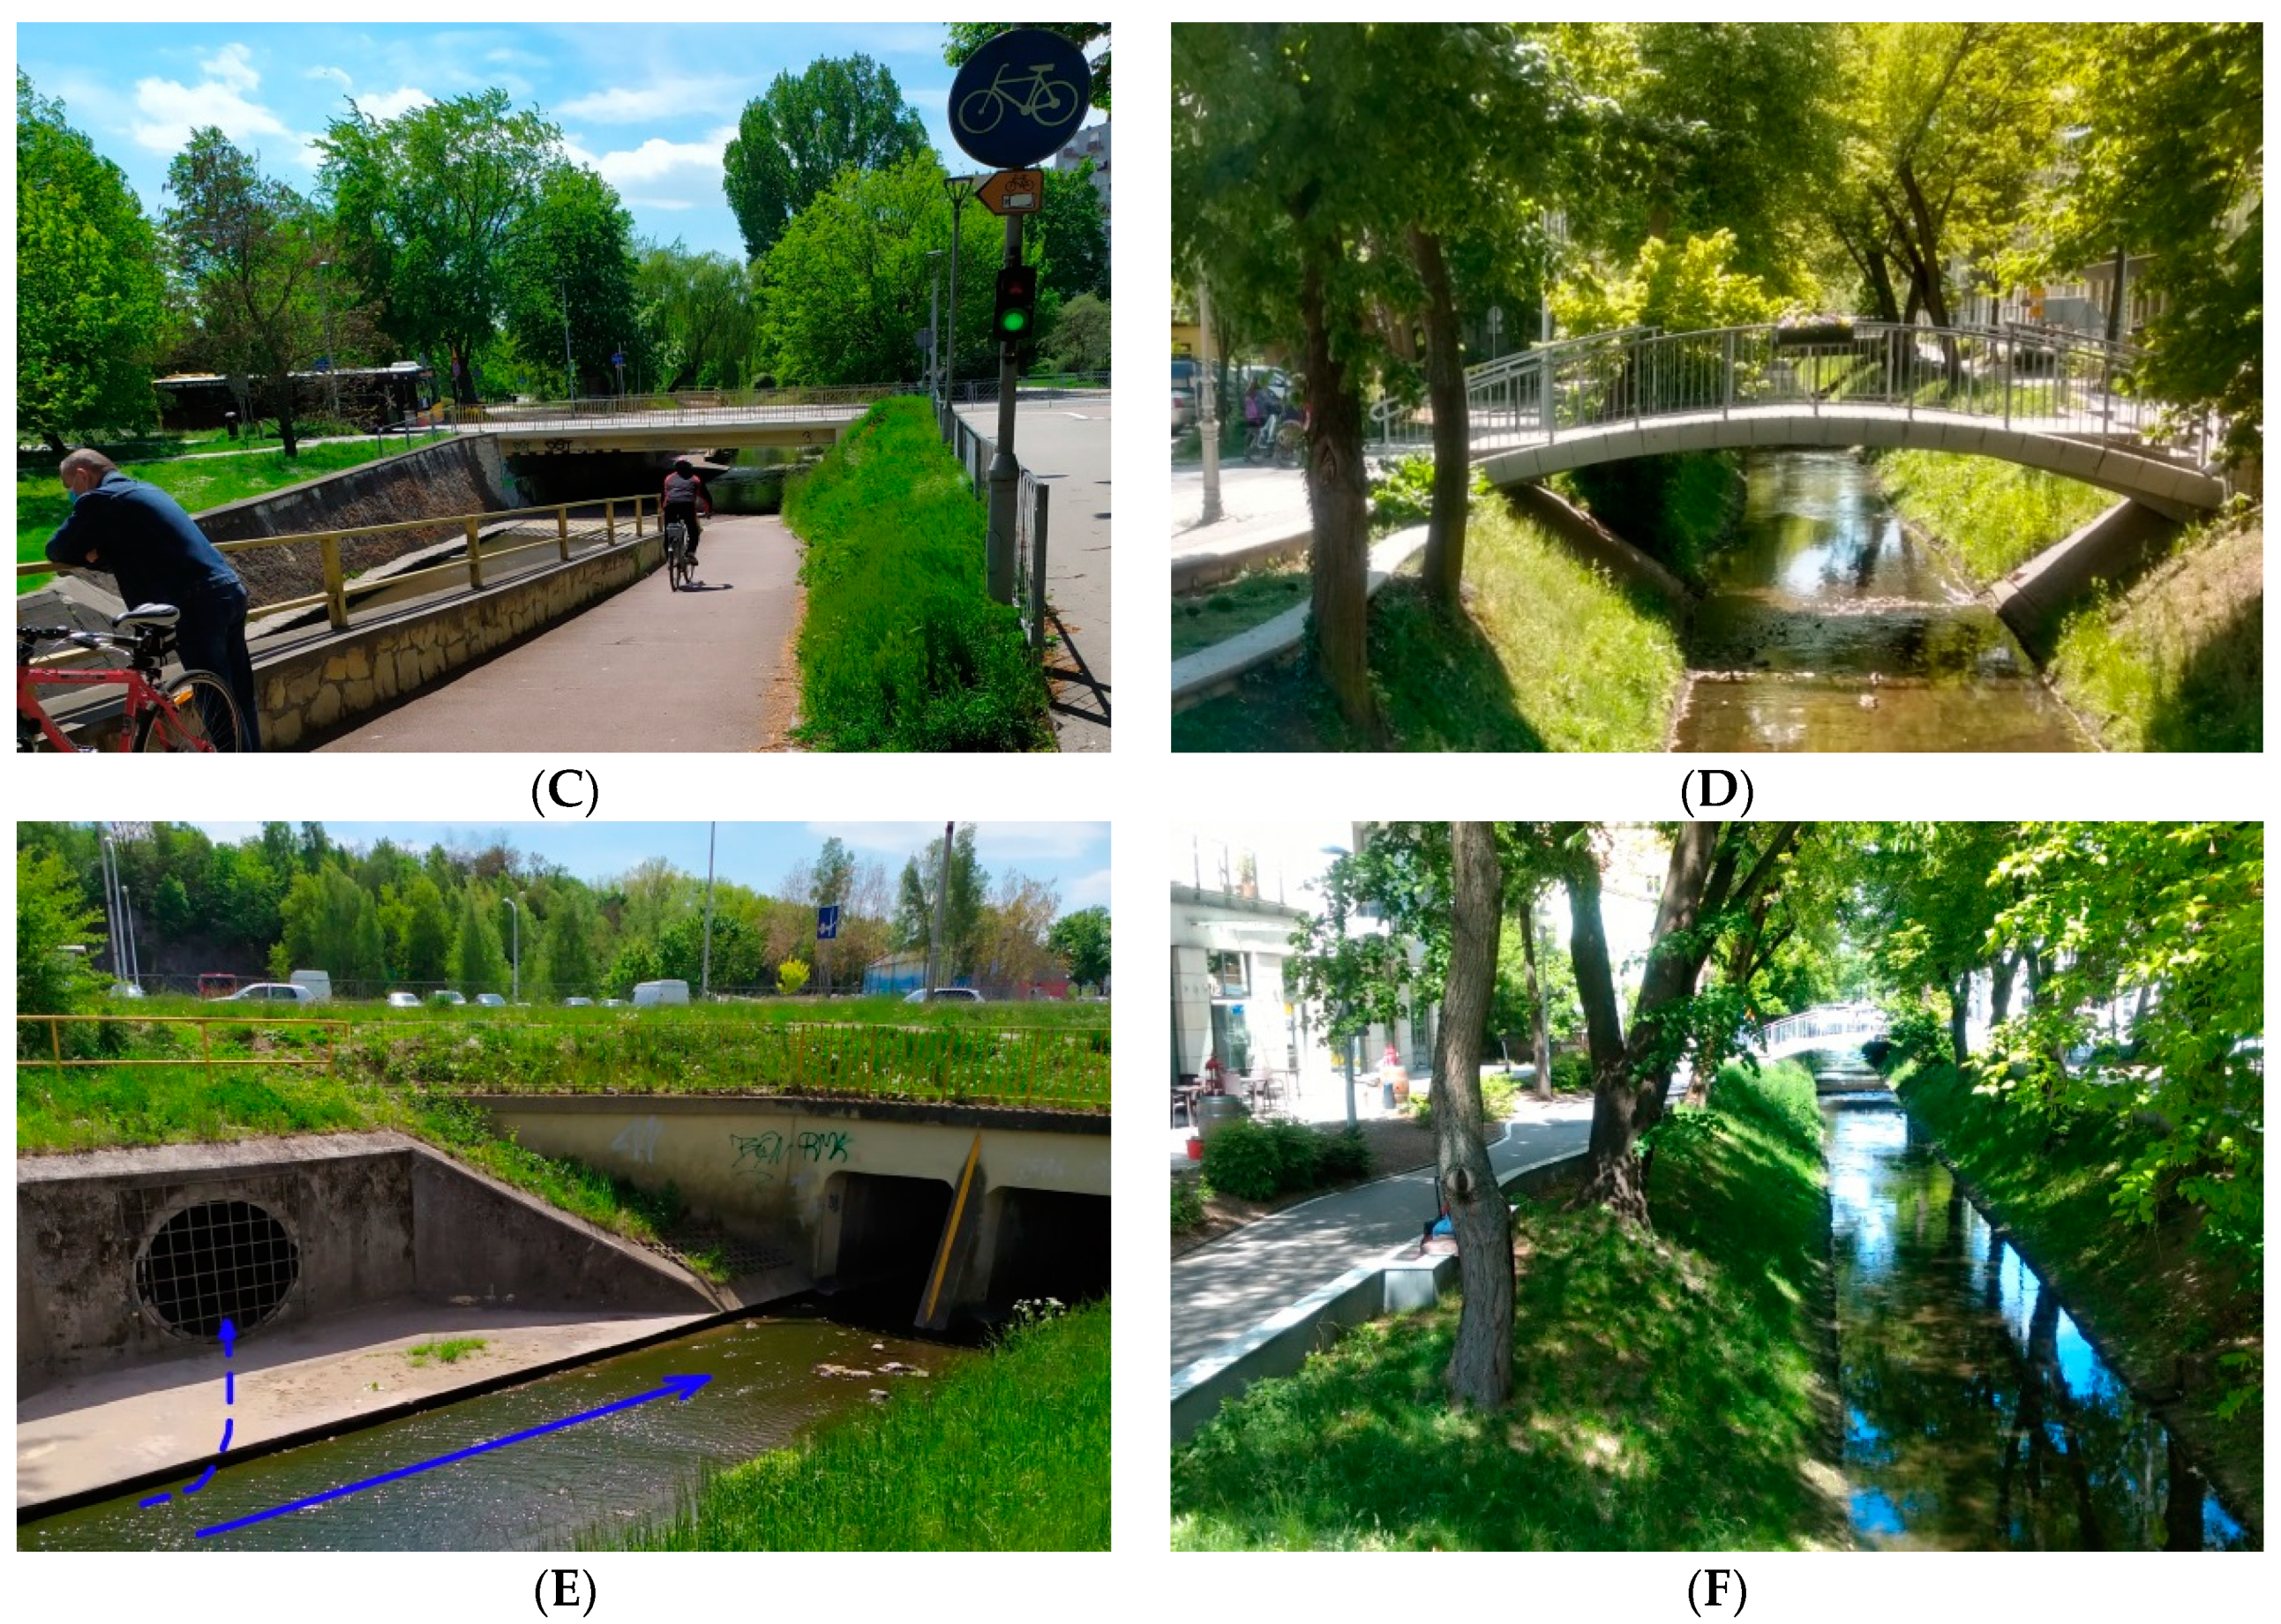
2.2. State of the Silnica River Channel

Because its average slope is as high as 7.3‰, the Silnica River is regarded as a mountain river. In the upper reaches, it flows through partly waterlogged forest areas and further downstream to an artificial reservoir through a suburban area. Most riverbed processes in the area are semi-natural, i.e., similar natural processes (Figure 2). The Silnica, which flows into the Kielce Reservoir artificial water body, forms a delta. Below the dam (8.2 river km), the river flows through the centre of Kielce. In this section, the nature of the river channel changes: it is straight and regulated and has high reinforced banks (1.4–3.5 m high), which are adapted to high discharge and are not conducive to accumulation. Here there are numerous bridges, footbridges, correction thresholds, storm drainage pipe outlets, surface channels for draining excess water, etc. In terms of fluvial transport, this over-four-kilometre section performs only a transit function. Below the centre of Kielce (Pakosz outlet), intensive accumulation of material from the city area is observed in the river channel. In a broad channel, sandbanks form a “mid-channel pseudo-terrace”. This is 1–3 m wide and 0.2–0.5 m high; it becomes flooded and overbuilt at elevated water levels. In the section of the Silnica’s mouth, where there are no artificial bank reinforcements, very intense lateral and bottom erosion processes are observed.

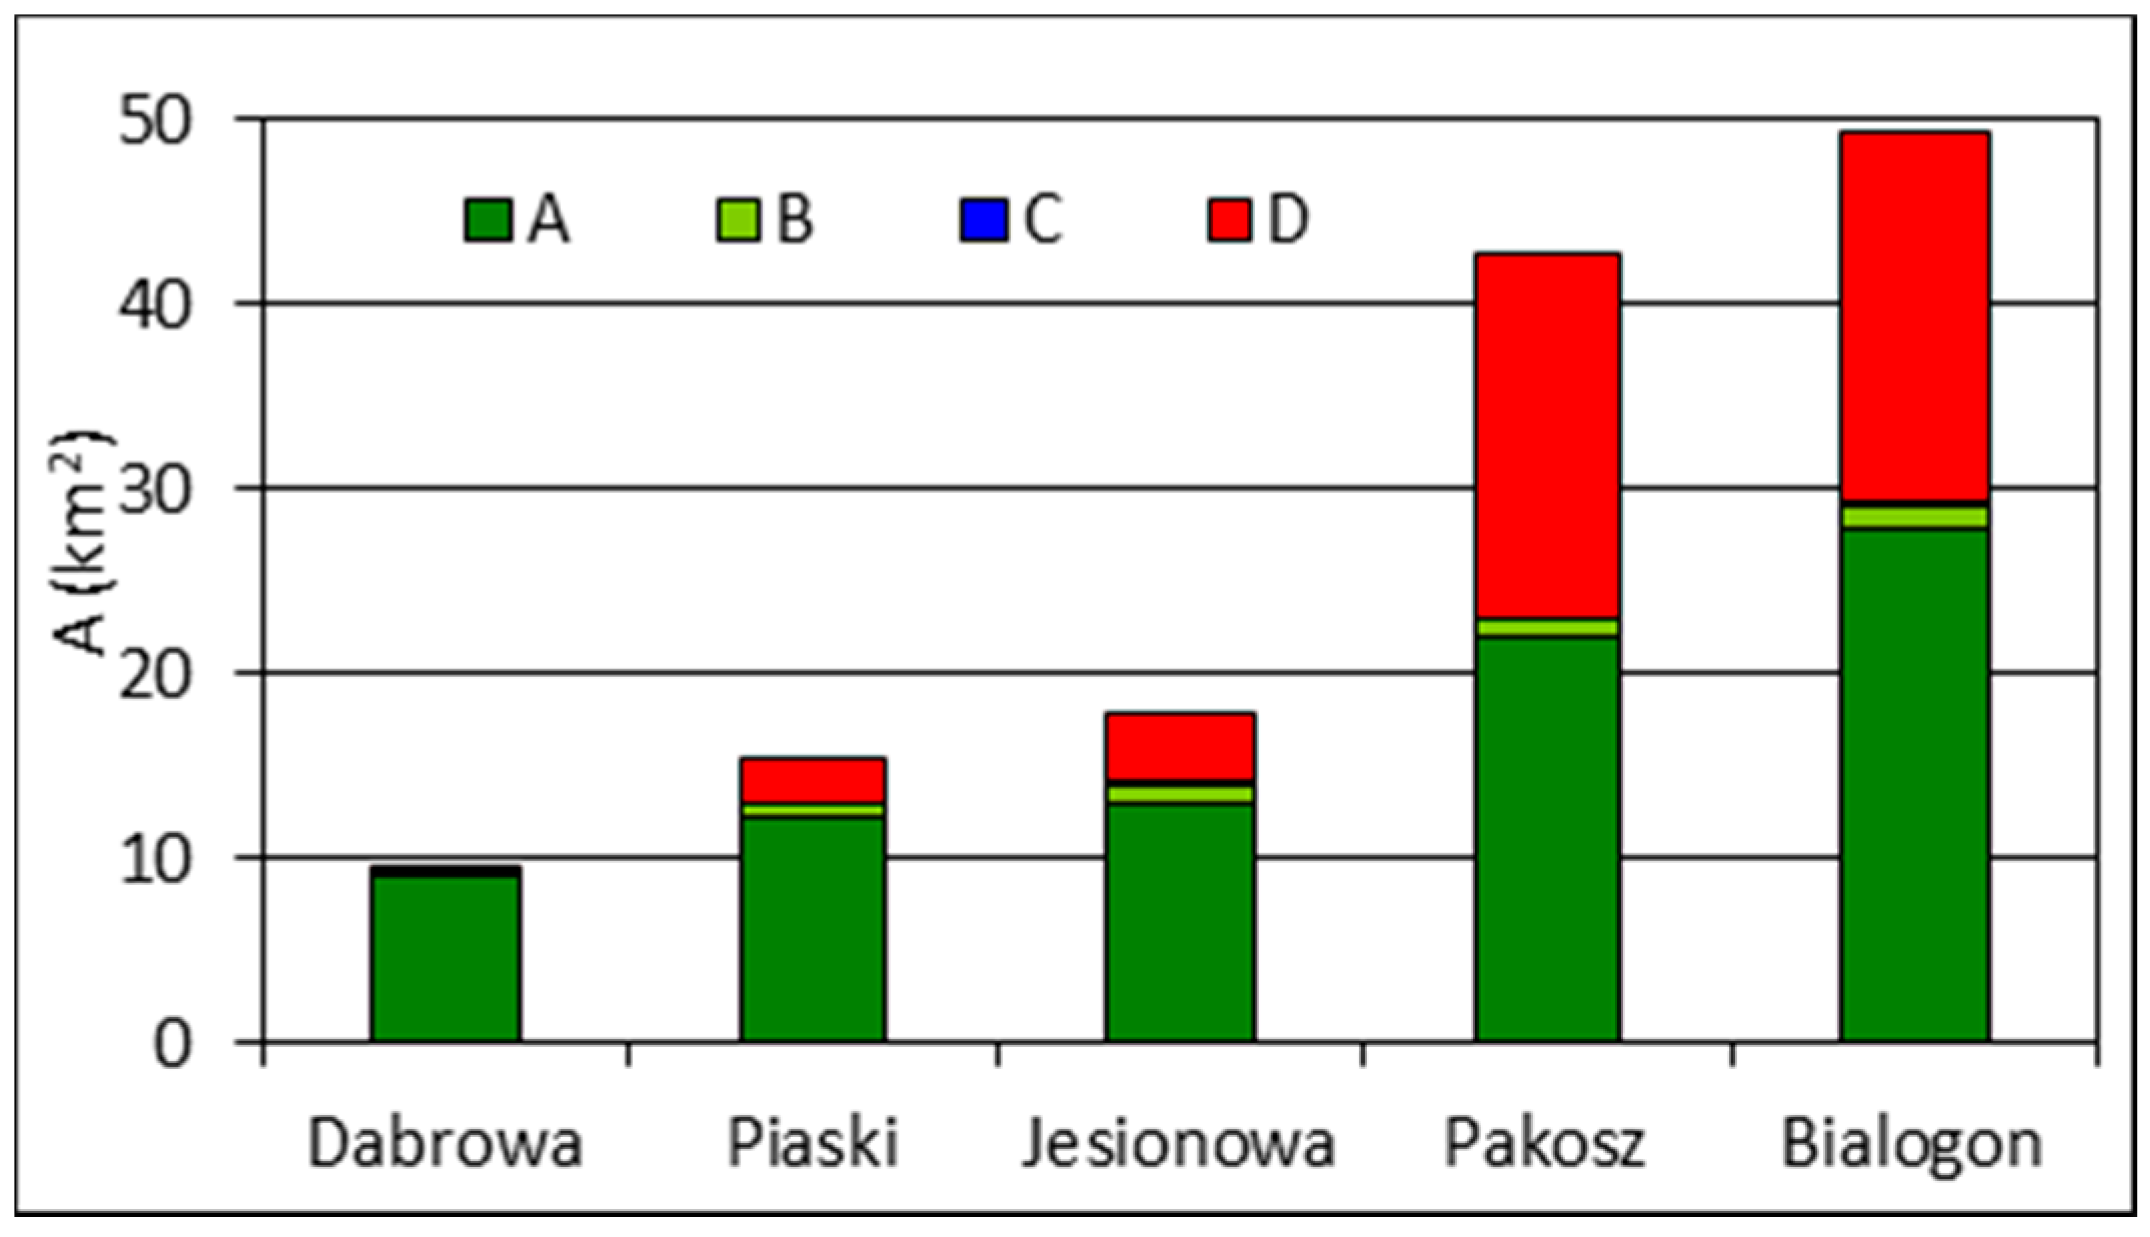
2.3. Areas Supplying Material to the Watercourses within the Catchment

A detailed analysis of the range of the areas that supply the Silnica River with water and material was carried out by Ciupa [41]. The author took into account slope directions, potential surface drainage system (watercourses and dry valleys) and land use. As a result, he delimited four types of supply areas: (1) slopes and dry valleys, (2) floodplains, (3) direct supply to river channels and (4) direct supply to river channels via anthropogenic drainage systems.
Because the location of the city is in the central part of the Silnica catchment, there is a significant diversity of water and material supply to the river channel (Figure 3). The system that supplies t with water and suspended solids has been transformed mainly in the section that flows through the city centre and further downstream (Pakosz and Bialogon outlets). This situation is due to large impervious surfaces and a dense drainage network in the catchment. As a result, there is a rapid growth in the areas that supply water and the number of sources that supply waste to the river channel. As a consequence, there is a significant increase in the water discharge rate, along with suspended and dissolved solids. These conditions cause an increase in energy in the channel, which initiates fluvial processes.
As the catchment area increases, the share of supply areas from slopes and dry valleys decreases [11]. In the Silnica catchment, this ranges from 98% (9.0 km2) downriver to the Dabrowa outlet to 51.4% (21.9 km2) at the Pakosz outlet and 56.4% (27.9 km2) at Bialogon. In turn, downstream the share of direct delivery areas to the river channel increases as a result of the road and stormwater drainage systems, ditches, surface gutters, etc. This grows from 0.0% at the Dabrowa outlet to 45.9% (19.5 km2) at Pakosz and 40.9% (20.2 km2) at Bialogon. In urbanised areas, extensive supply areas in many places reach watersheds, and local underground drainage systems can even reach beyond these watersheds.

2.4. Research Methods

The analysis was based on hydrological and fluvial tests carried out in the Silnica catchment during two rainfall-induced floods. These occurred in July 2001, the wettest month and year in the multi-annual period 1954–2019, and covered the entire catchment. The monthly precipitation total at the hydro-meteorological station in Kielce at that time amounted to 294.2 mm (multi-annual average: 87.5 mm) and was almost 100 mm higher than the previously recorded maximum. Consequently, the precipitation total that month was the highest annually (948.1 mm) since measurements began. A maximum daily sum of 155.2 mm (24 July) was also recorded. In July 2001, during two big rainfall-induced floods (21 and 25 July) in the Silnica catchment, detailed hydrological and fluvial measurements were carried out. Field measurements (precipitation depth with a recording rain gauge, water level with a floating gauge) were conducted continuously at five hydrometric stations on the Silnica river, and the results were analysed at 1-h intervals (14:00 UTC, 15:00 UTC, …).
The discharge was determined using a rating curve, developed on the basis of multi-year hydrological studies conducted in this catchment for monitoring and flood protection of the city of Kielce. Specific runoff (q) was determined on the basis of the discharge.
Fluvial research included water sampling with a bottle bathometer in an hourly cycle. On this basis, suspended solids concentration and conductivity were determined. Suspended solids concentration (SSC) was determined by a filtration method (quantitative filters, medium hardness, weight accuracy of 0.0002 g), and dissolved solids concentration (DSC) was calculated by using the conductivity method.
Specific runoff and suspended and dissolved solids concentrations (SSC and DSC, respectively) were used to calculate the specific load of these two types of fluvial transport (SSL, DSL) following these formulas:
S S L = S S C · q ;   D S L = D S C · q
where SSL is suspended solids specific load (g·s−1·km−2), DSC is dissolved solids specific load (g·s−1·km−2), SSC is suspended solids concentration (g·m−3), DSC is dissolved solids concentration (g·m−3), and q is specific runoff (L·s−1·km−2).

3. Results

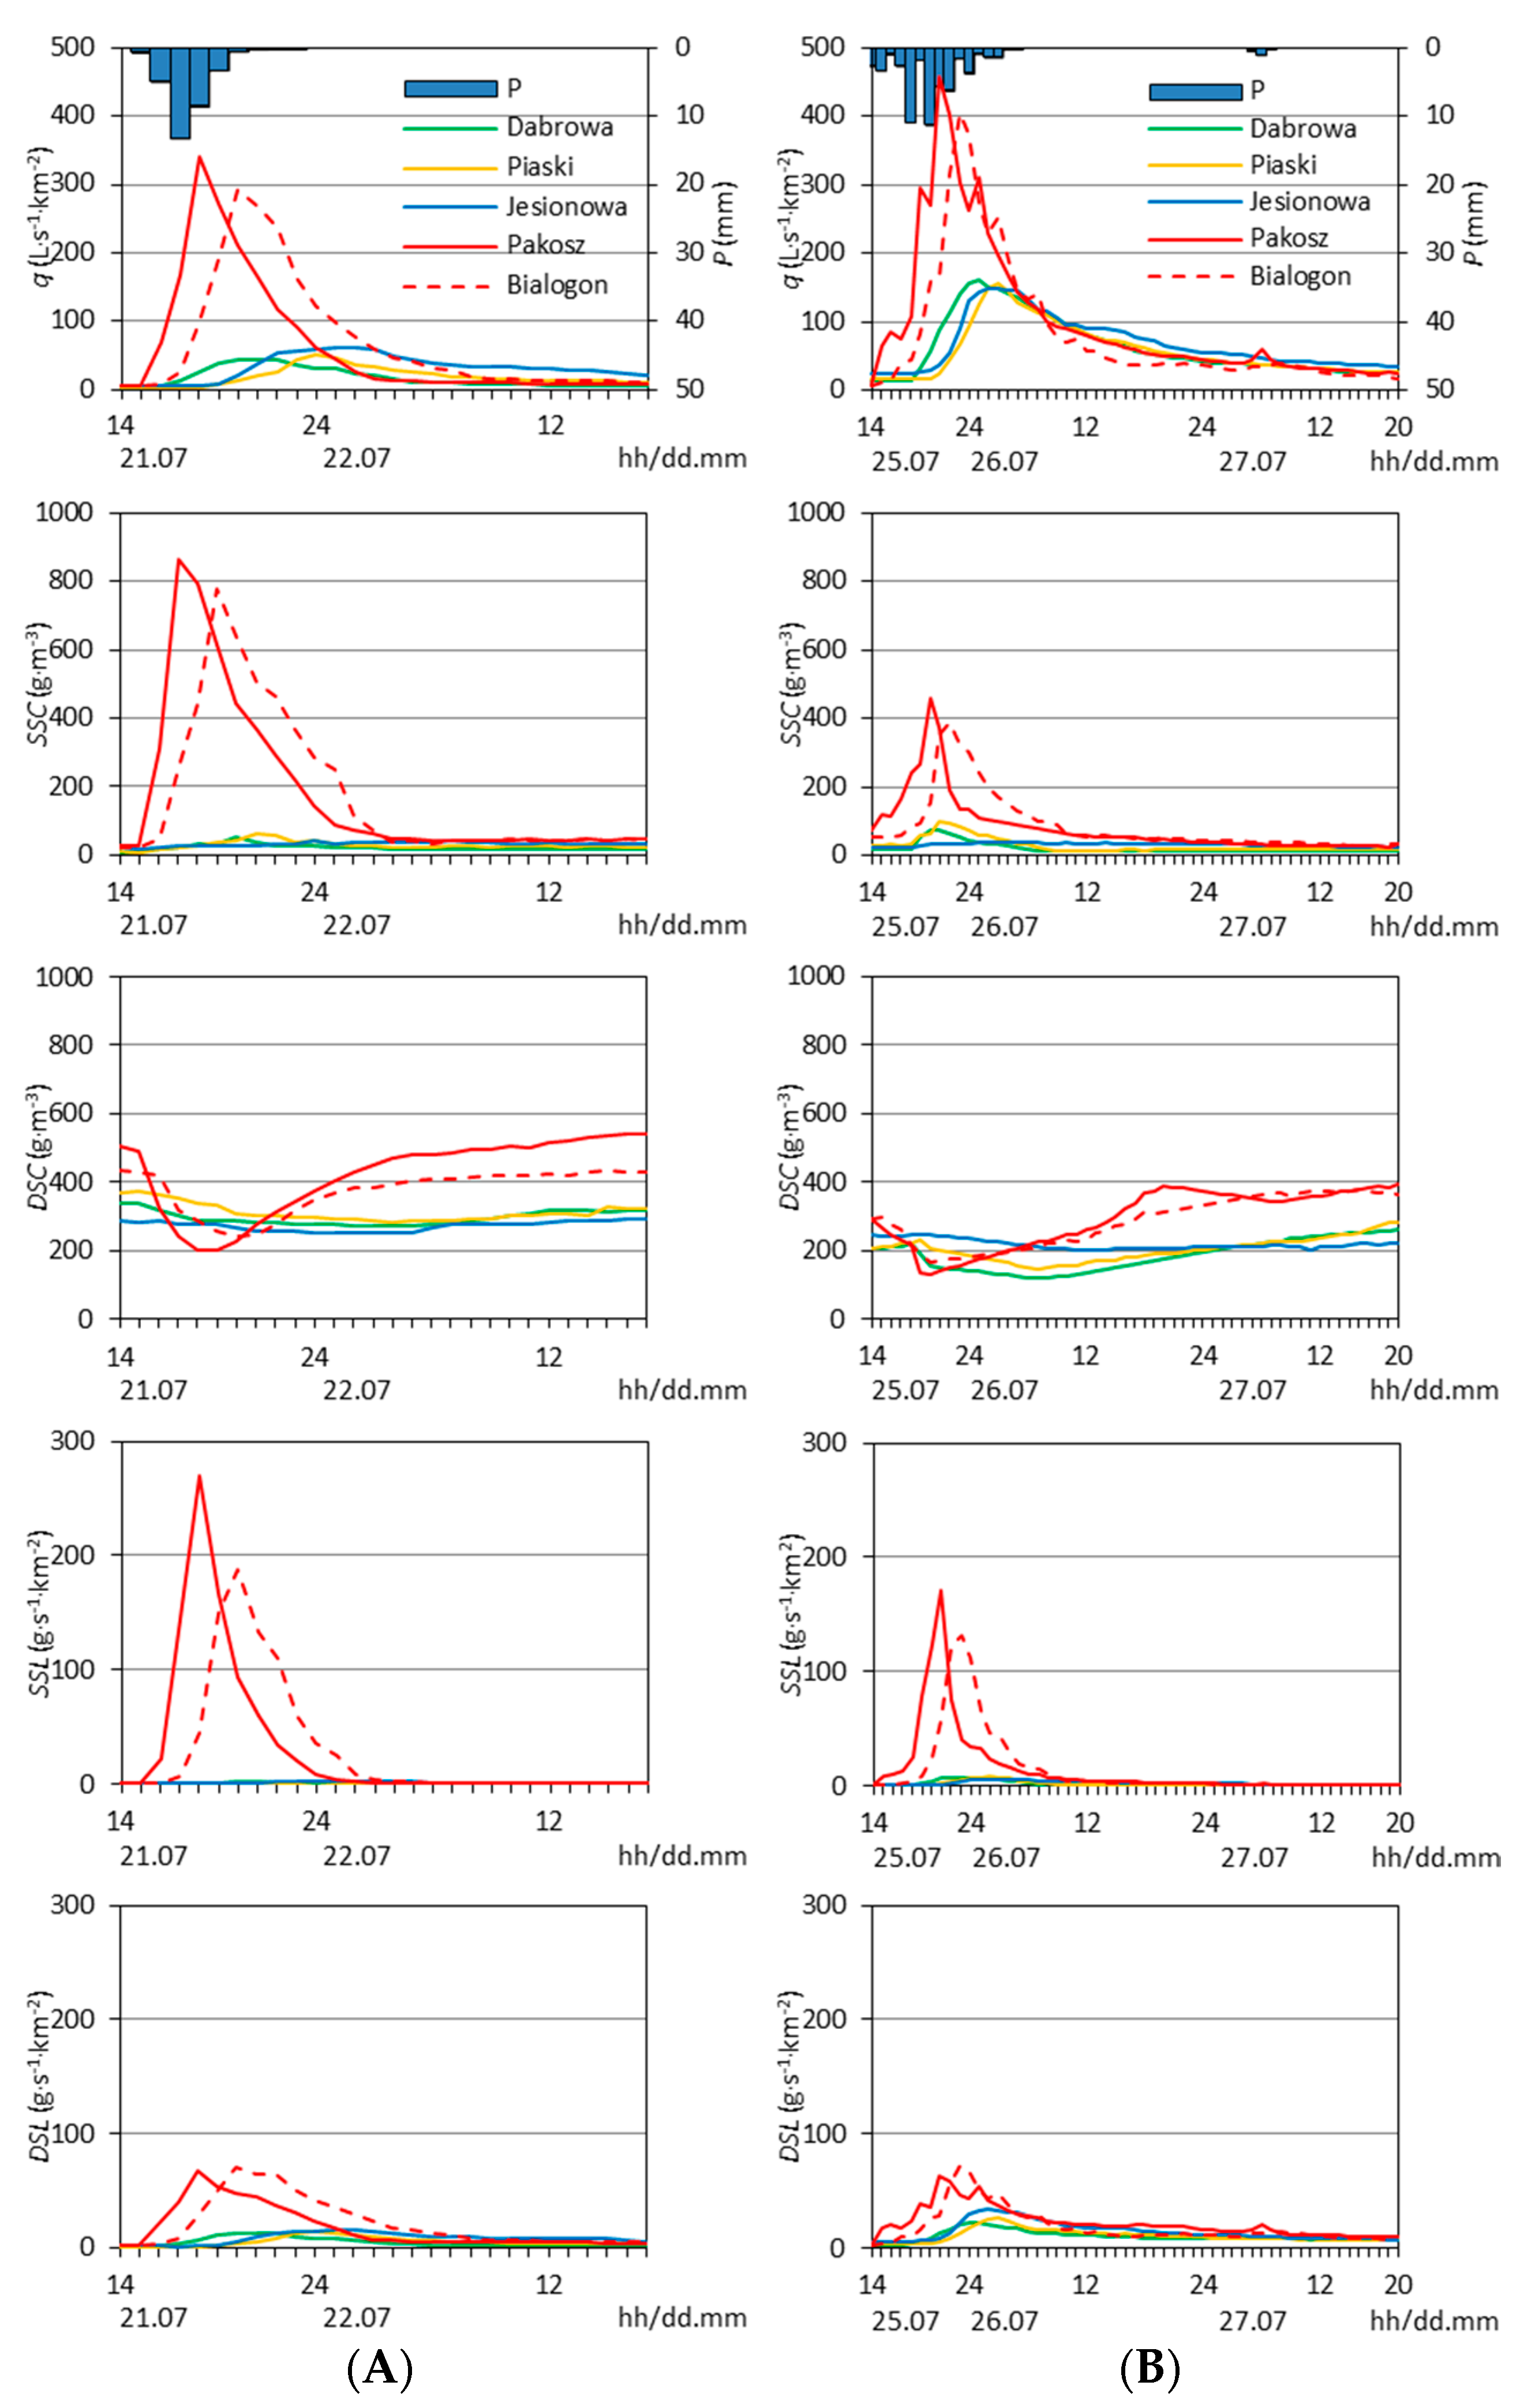
3.1. Runoff and Fluvial Transport during Rainfall-Induced Floods

The described floods were caused by precipitation events on 21 July 2001 and 25 July 2001 with mean areal depths of precipitation (P) of 32.1 mm and 55.5 mm, respectively. The first of these events, caused by processes in the cold front zone, lasted for nine hours and showed a clear intensity peak of 13.3 mm·h−1 (Figure 4A). The second, sixteen hours long, was related to the extensive convergence zone over eastern Poland. The highest hourly rainfall intensity exceeded 10 mm·h−1 twice (max. 11.3 mm·h−1) (Figure 4B). The effect of these events was a high specific runoff (q), which generally increased with the growth in the catchment area and was conditioned by different land uses. In the upper part of the catchment, with a dominant share of forests (Dabrowa outlet), it reached 45 L·s−1·km−2 and 160 L·s−1·km−2 during these events, respectively. At the Piaski outlet (suburban sub-catchment), it was 50 L·s−1·km−2 and 156 L·s−1·km−2, respectively. By far the most extensive specific runoff occurred in the sub-catchments that cover the city centre: Pakosz and Bialogon (Figure 4). After the first rainfall event (21 July), this maximum reached 334 L·s−1·km−2 and 291 L·s−1·km−2, respectively, while during the second rainfall event (25 July), it was 458 L·s−1·km−2 and 404 L·s−1·km−2, respectively.
Hydrographs of the analysed flood waves differ significantly in shape. This situation is due to the height of the runoff culmination and the time of its concentration. In this respect, hydrographs that represent sub-catchments with a large share of urbanised areas differ from those of other sub-catchments (Figure 4). In the former, the time of the flood wave concentration at the outlet located directly downstream of the city centre (Pakosz) was at about 1 h, while at the Bialogon outlet (the entire catchment), this was at 3 h. In the forest sub-catchment (Dabrowa), this was 4–5 h, and 6–7 h in the suburban sub-catchment (Piaski), 6–7 h. This hydrological effect stems from the impermeability of the catchment and, consequently, accelerated water circulation in a dense system of roads and stormwater drainage within the abnormally enlarged supply areas discussed above.
During the analysed rainfall-induced floods, an even greater spatial differentiation of suspended solids concentration was found in individual hydrometric stations. At the Dabrowa sub-catchment outlet, its highest value during the first rainfall event was 50.1 g·m−3, while during the second, it reached 73.2 g·m−3. The forest cover in this sub-catchment is high, but it is encroached upon by the buildings of the Kielce suburban zone together with high road density, including the S7 expressway (Krakow–Warsaw) and the national road DK73. These roads are a source of efficient water supply and fine-grained sediment to the Silnica channel, especially since they run alongside the river over a distance of several kilometres. At the Jesionowa sub-catchment outlet (downstream of the artificial reservoir), there was a decrease in maximum concentration to 39.5 g·m−3 (21 July) and 37.1 g·m−3 (25 July). This decrease is the effect of the sedimentation of transported material in the reservoir. After passing through the city centre, at the Pakosz outlet a rapid increase in the suspended solids concentration was found, the maximum value of which was reached during the entire flood events: 865 g·m−3 and 457 g·m−3, respectively (Figure 4). Lower concentration during the second flood event resulted from a short rainless period, in which there was no re-accumulation of fine-grained material on the surfaces of roads, pavements and parking lots. The almost five-kilometre section of the Silnica river channel that runs through the centre of Kielce primarily performs a transit function by means of fluvial transport. During intense rainfall events, sediment transported as suspended solids is supplied primarily by surface runoff. At the Bialogon outlet, the suspended solids concentration decreased during both floods to 780 g·m−3 and 389 g·m−3, respectively, which can be explained by the deposition of suspended solids. The morphological effect in the river channel is one of numerous mid-channel sandbanks.
During the analysed rainfall-induced floods, a different dissolved solids concentration was found at individual outlets. In the first phase of the flood waves, there was a decrease in concentration. The highest concentration was recorded at the Pakosz and Bialogon sub-catchment outlets, while the lowest was found at the Jesionowa outlet, i.e., downstream of the artificial reservoir. This decrease in concentration was the result of accelerated water circulation in the sub-catchments with a high proportion of impervious surfaces, dense drainage network and low retention capacity. At the Pakosz and Bialogon outlets, the lowest dissolved solids concentration occurred during the culmination of the discharge, reaching 199 and 241 g·m−3 (21 July) and 130 and 166 g·m−3 (25 July), respectively. At the remaining outlets, it was delayed by 1–9 h (at Jesionowa, downstream of the artificial reservoir). After the flood wave, the fastest increase in dissolved solids concentration occurred at the outlets of urbanised sub-catchments, taking less than a day to reach the level measured before the flood. In these locations, the surface runoff ended soonest, and the river in this section was again supplied with water mainly from the artificial reservoir and from canals with a permanent outflow. In the latter situation, the increased dissolved solids concentration was caused by impurities.
The conducted research showed that during the analysed rainfall-induced floods, the share of the suspended solids load in the total of the two types of load, i.e., the total of suspended and dissolved solids, was significantly different at individual sub-catchment outlets. Its average share at the outlets of the semi-natural sub-catchments was 6.8–10.6% (21 July) and 10.4–12.5% (25 July), while at the Pakosz and Bialogon outlets, it was 24.5% and 25.3% (21 July) and 21.1% and 22.2% (25 July). It is worth noting that at outlets of the sub-catchments covering the city centre, the share of suspended solids load in the total sum of transported loads was much higher than that in the other outlets. On 21 July, it reached 75.3% (Bialogon) and 79.9% (Pakosz), while it was only 13–17% in the forest and suburban sub-catchments. During the following flood, which occurred several dozen hours later, the differences between the considered loads were smaller. This variation shows the effect of the earlier removal of fine-grained sediment from the catchment surface in the process of surface runoff, and its discharge into the river in the form of suspension.

3.2. Examples of Hydrotechnical Solutions as an Effect of Hydrological Research

The consequence of the processes mentioned in the previous section was a significant acceleration of the water circulation in the Silnica river catchment that flows through the centre of Kielce. During periods of surface runoff, its channel also serves as a collector that receives water from numerous outlets such as covered stormwater canals, surface drainage gutters and roads. For this reason, the city centre is increasingly threatened by floods.
Recognising the height of flood waves and the time of their concentration, as well as the dynamics and size of fluvial transport in the hydrometric stations of the Silnica River located at subsequent sub-catchments, along with the increasing effects of urbanisation (including impervious areas), is essential from a cognitive and utilitarian point of view. The hydrological capacity of many bridges in Kielce has turned out to be insufficient, and this has contributed to the emergence of river swells and, as a consequence, flood risk. The results of the presented research became the basis for developing a concept for reconstruction of the most critical hydrotechnical structures (weir and dam, bridges, culverts and footbridges) in the city centre [42]. After modernisation, the weir (Figure 5A) gained a higher capacity, and a tunnel was built within the earth dam (Figure 5B). Every day, this tunnel has a commuting function (pedestrian crossing and bicycle path), and in the event of a flood hazard, it can act as a relief channel, thus protecting the dam. After the reconstruction, the clear span of the two bridges increased by up to 70%. Under one of the bridges, there is a bike path that crosses the river on a wooden bridge (Figure 5C). In the event of elevated water stages, the path is automatically closed by traffic lights. In turn, all traditional (horizontal) footbridges after reconstruction have acquired an arch shape (Figure 5D).
Moreover, two covered relief channels were built (Figure 5E), which, during high water events, lower the water stage in the river channel upstream of the bridge and the pond culvert by about 45 cm. Furthermore, along the Silnica river channel over long sections, aesthetic retaining walls were built to act as flood protection and are used as benches for walkers at other times (Figure 5F). These hydrotechnical investments reduce the risk of flooding in the city centre and thus provide greater security for its residents.

4. Discussion

In the Silnica sub-catchments, which include urbanised areas (Pakosz, Bialogon) where impervious surfaces cover about 30% of the area, there is a rapid increase in the size of the specific runoff and transported material loads relative to the semi-natural catchments (Dabrowa, Piaski), and this significantly exceeds the percentage increase in impervious areas. These differences are particularly pronounced during massive floods when supply areas maximise their surface, which has been documented by several studies including those from the previous century [43,44].
The maximum specific runoff from the Silnica catchment down to the Bialogon sub-catchment outlet during the analysed floods was 9.1 times (21 July) and 2.6 times (25 July) larger than its equivalent at the Piaski outlet. Similar changes in the runoff wave parameters caused by urbanisation in a small catchment in Huston, Texas, were presented by Van Sicle [45]. On the basis of the observed runoff of the Brays Bayou River during the period of intensive development of the city, which, in 21 years, evolved from an agricultural area to an urbanised development, the maximum runoff of the flood wave was more than three times higher than that in the period before urban development.
In the initial period of rainfall-induced floods, the suspended solids concentration and load in hydrometric stations located in the city centre (Pakosz outlet) and in the river mouth (Bialogon outlet) were very high, and then rapidly dropped. The calculated suspended solids load that flows through these outlets was 200 times larger than that in the other outlets. This is because the impervious surfaces of roads and parking lots (concrete and asphalt) are a key source of anthropogenic particles for the watercourse. A similar observation was reported by Wei et al. [46]. The influence of several extreme rainfall events on very high suspended solids concentration and load in small rivers was also noted by Tramblay et al. [47]. During 12 rainfall-induced floods in the small basin of the Sluzew Creek located in Warsaw (A = 28.7 km2), the maximum suspended solids concentration varied from 102 to 429 g·m−3 and was several dozen times higher than the annual average [29]. In turn, Old et al. [48] found that the suspended solids concentration during a specific rainfall increased almost 100-fold within 15 min (from 14 to 1360 mg·L−1). The conducted tests indicate that the suspended solids load from catchments with a significant share of impervious surfaces exceeds that from catchments with different land uses. This observation agrees with other studies [19,49,50]. Studies carried out in catchments in England with different land-use patterns have shown that, in the case of individual rainfall-induced floods, the suspended solids load from the urban catchment was higher than that from the rural catchment [51]. However, Bello et al. [52] arrived at different conclusions.
During both analysed rainfall events (21 and 25 July) in the Silnica sub-catchments with a high proportion of impervious areas, the first flush effect was observed. A similar phenomenon, of the rapid increase in suspended solids concentration and the occurrence of its maximum value before the culmination of the flood wave in small watercourses, has been documented many times [22,29,53,54,55,56,57].

5. Conclusions

In the studied sub-catchments with a large area of impermeable surfaces (hydrometric stations at the Pakosz and Bialogon outlets) relative to the forest (Dabrowa) and suburban (Piaski and Jesionowa) sub-catchments, summer rainfall plays a more prominent role in shaping the outflow. Transformation of flood waves in urban areas involves, among other effects, a significant reduction in concentration and falling time, as well as a rapid increase in their height and volume.
Accelerated sediment supply to the Silnica channel occurs through a dense network of roads and rainwater canals with relatively steep slopes. The network of canals and accompanying wells, with periodic runoff, is also an important source that supplies the river with clastic material, especially in the early stages of floods. Here, in the final phase of the previous flood and during the inter-flood period, clastic material accumulates; this is activated as soon as the runoff occurs.
During high rainfall-induced floods, the maximum values of the hourly percentage of the suspended solids load in semi-natural catchments do not exceed 17% of the total (i.e., suspended and dissolved solids) load. In comparison, in catchments covering the city centre, this reaches almost 80%. In the Silnica’s fluvial system, the share of the two types of loads examined, which changes in time and space, clearly reflects the changing hydro-meteorological conditions and features of the catchment development.
The results of hydrological and fluvial tests conducted in July 2001, the wettest month in the years 1954–2019, have found a practical application. The local government in Kielce adopted a policy of long-term sustainable development for the city. In urban planning policy, special attention was paid to flowing waters and the need for flood control on a four-kilometre stretch of the Silnica river channel in the city centre. Successive projects were implemented for the reconstruction of almost all hydrotechnical structures or the construction of new ones. These actions proved to be very effective, as there has been an apparent reduction in the flood risk in this area.

Author Contributions

Conceptualization, T.C. and R.S.; methodology, T.C., R.S.; formal analysis, T.C. and R.S.; resources, T.C.; writing, T.C. and R.S.; visualization, T.C. and R.S. All authors have read and agreed to the published version of the manuscript.

Funding

This research and APC was funded by Jan Kochanowski University in Kielce (grant number: SMGR.RN.20.229.635).

Conflicts of Interest

The authors declare no conflict of interest.

References

  1. Paul, M.J.; Meyer, J.L. Streams in the urban landscape. Ann. Rev. Ecol. Syst. 2001, 32, 333–365. [Google Scholar] [CrossRef]
  2. McGrane, S. Impacts of urbanisation on hydrological and water quality dynamics, and urban water management: A review. Hydrol. Sci. J. 2016, 61, 2295–2311. [Google Scholar] [CrossRef]
  3. Espey, W.H., Jr.; Morgan, C.W.; Masch, F.D. A Study of Some Effects of Urbanization on Storm Water Runoff from a Small Watershed; Report No. 23; Texas Water Development Board: Austin, TX, USA, 1966. [Google Scholar]
  4. Roesner, L.A. Urban runoff processes. In Urban Stormwater Hydrology; Kibler, D.F., Ed.; American Geophysical Union: Washington, DC, USA, 1982; Volume 7, pp. 137–159. [Google Scholar]
  5. Brun, S.E.; Band, L.E. Simulating runoff behavior in an urbanizing watershed. Comput. Environ. Urban. Syst. 2000, 24, 5–22. [Google Scholar] [CrossRef]
  6. Shuster, W.D.; Bonta, J.; Thurston, H.; Warnemuende, E.; Smith, D.R. Impacts of impervious surface on watershed hydrology: A review. Urban Water J. 2005, 2, 263–275. [Google Scholar] [CrossRef]
  7. Vicars-Groening, J.; Williams, H.F.L. Impact of urbanization on storm response of White Rock Creek, Dallas, TX. Environ. Geol. 2007, 51, 1263–1269. [Google Scholar] [CrossRef]
  8. Huang, S.Y.; Cheng, S.J.; Wen, J.C.; Lee, J.H. Identifying peak-imperviousness-recurrence relationships on a growing-impervious watershed, Taiwan. J. Hydrol. 2008, 362, 320–336. [Google Scholar] [CrossRef]
  9. O’Driscoll, M.; Clinton, S.; Jefferson, A.; Manda, A.; McMillan, S. Urbanization effects on watershed hydrology and in-stream processes in the southern United States. Water 2010, 2, 605–648. [Google Scholar] [CrossRef]
  10. Ferreira, C.S.S.; Walsh, R.P.D.; Nunes, J.P.C.; Steenhuis, T.S.; Nunes, M.; de Lima, J.L.M.P.; Coelho, C.O.A.; Ferreira, A.J.D. Impact of urban development on streamflow regime of a Portuguese peri-urban Mediterranean catchment. J. Soils Sediments 2016, 16, 2580–2593. [Google Scholar] [CrossRef]
  11. Walling, D.E.; Webb, B.W. Sediment availability and the prediction of storm-period sediment yields. In Recent Developments in the Explanation and Prediction of Erosion and Sediment Yield; Walling, D.E., Ed.; IAHS Publ. No. 137: Wallingford, UK, 1982; pp. 327–337. [Google Scholar]
  12. Walling, D.E.; Owens, P.N.; Carter, J.; Leeks, G.J.L.; Lewis, S.; Meharg, A.A.; Wright, J. Storage of sediment-associated nutrients and contaminants in river channel and flood plain systems. Appl. Geochem. 2003, 18, 195–220. [Google Scholar] [CrossRef]
  13. Hatt, B.; Fletcher, T.; Walsh, C.; Taylor, S. The influence of urban density and drainage infrastructure on the concentrations and loads of pollutants in small streams. J. Environ. Manag. 2004, 34, 112–124. [Google Scholar] [CrossRef]
  14. Chadwick, M.A.; Dobberfuhl, D.R.; Benke, A.C.; Huryn, A.D.; Suberkropp, K.; Thiele, J.E. Urbanization affects stream ecosystem function by altering hydrology, chemistry, and biotic richness. Ecol. Appl. 2006, 16, 1796–1807. [Google Scholar] [CrossRef]
  15. Taylor, K. Urban environments. In Environmental Sedimentology; Perry, C., Taylor, K., Eds.; Wiley-Blackwell: Oxford, UK, 2006; pp. 190–222. [Google Scholar]
  16. Ferreira, C.S.S.; Walsh, R.P.D.; Blake, W.H.; Kikuchi, R.; Ferreira, A.J.D. Temporal dynamics of sediment sources in an urbanizing Mediterranean catchment. Land Degrad. Dev. 2017, 28, 2354–2369. [Google Scholar] [CrossRef]
  17. Kemper, J.T.; Miller, A.J.; Welty, C. Spatial and temporal patterns of suspended sediment transport in nested urban watersheds. Geomorphology 2019, 336, 95–106. [Google Scholar] [CrossRef]
  18. Trimble, S.W. Contribution of stream channel erosion to sediment yield from an urbanizing watershed. Science 1997, 278, 1442–1444. [Google Scholar] [CrossRef] [Green Version]
  19. Nelson, E.J.; Booth, D.B. Sediment sources in an urbanizing, mixed land-use watershed. J. Hydrol. 2002, 264, 51–68. [Google Scholar] [CrossRef]
  20. Taylor, K.G.; Owens, P.N. Sediments in urban river basins: A review of sediment–contaminant dynamics in an environmental system conditioned by human activities. J. Soil. Sediment. 2009, 9, 281–303. [Google Scholar] [CrossRef]
  21. Müller, A.; Österlund, H.; Marsalek, J.; Viklander, M. The pollution conveyed by urban runoff: A review of sources. Sci. Total Environ. 2020, 709, 136125. [Google Scholar] [CrossRef]
  22. Williams, G.P. Sediment concentration versus water discharge during single hydrologic events in rivers. J. Hydrol. 1989, 111, 89–106. [Google Scholar] [CrossRef]
  23. Kostrzewski, A.; Stach, A.; Zwoliński, Z. Transport of suspended load in the Parseta River during the flash flood of June 1988, Poland. Geogr. Pol. 1994, 63, 63–73. [Google Scholar]
  24. Lenzi, M.A.; Marchi, L. Suspended sediment load during floods in a small stream of the Dolomites (northeastern Italy). Catena 2000, 39, 267–282. [Google Scholar] [CrossRef]
  25. Alexandrov, Y.; Laronne, J.B.; Reid, I. Intra-event and interseasonal behaviour of suspended sediment in flash floods of the semi-arid northern Negev, Israel. Geomorphology 2007, 85, 85–97. [Google Scholar] [CrossRef]
  26. Hsu, P.C.; Chen, C.N.; Tasi, C.T. Real-time prediction of the peak suspended sediment concentration and sediment yield of the Lao-Nung River during storms. Int. J. Sediment. Res. 2011, 26, 163–180. [Google Scholar] [CrossRef]
  27. Zumr, D.; Dostál, T.; Devátý, J.; Valenta, P.; Rosendorf, P.; Eder, A.; Strauss, P. Experimental determination of the flood wave transformation and the sediment resuspension in a small regulated stream in an agricultural catchment. Hydrol. Earth Syst. Sci. 2017, 21, 5681–5691. [Google Scholar] [CrossRef] [Green Version]
  28. Haddadchi, A.; Hicks, M. Understanding the effect of catchment characteristics on suspended sediment dynamics during flood events. Hydrol. Process. 2020, 34, 1558–1574. [Google Scholar] [CrossRef]
  29. Krajewski, A.; Gładecki, J.; Banasik, K. Transport of suspended sediment during flood events in a small urban catchment. Acta Sci. Pol. Form. Circumiectus 2018, 17, 119–127. [Google Scholar] [CrossRef]
  30. Ferreira, C.S.S.; Walsh, R.P.D.; Kalantari, Z.; Ferreira, A.J.D. Impact of land-use changes on spatiotemporal suspended sediment dynamics within a peri-urban catchment. Water 2020, 12, 665. [Google Scholar] [CrossRef] [Green Version]
  31. Rossi, L.; Krejci, V.; Rauch, W.; Kreikenbaum, S.; Fankhauser, R.; Gujer, W. Stochastic modeling of total suspended solids (TSS) in urban areas during rain events. Water Res. 2005, 39, 4188–4196. [Google Scholar] [CrossRef]
  32. Mulliss, R.M.; Revitt, D.M.; Shutes, R.B. The impacts of urban discharges on the hydrology and water quality of an urban watercourse. Sci. Total Environ. 1996, 189–190, 385–390. [Google Scholar] [CrossRef]
  33. Metadier, M.; Bertrand-Krajewski, J.L. The use of long-term on-line turbidity measurements for the calculation of urban stormwater pollutant concentrations, loads, pollutographs and intra-event fluxes. Water Res. 2012, 46, 6836–6856. [Google Scholar] [CrossRef]
  34. Gong, Y.; Liang, X.; Li, X.; Li, J.; Fang, X.; Song, R. Influence of rainfall characteristics on total suspended solids in urban runoff: A case study in Beijing, China. Water 2016, 8, 278. [Google Scholar] [CrossRef] [Green Version]
  35. Hannouche, A.; Joannis, C.; Chebbo, G. Assessment of total suspended solids (TSS) event load and its uncertainties in combined sewer system from continuous turbidity measurements. Urban. Water J. 2017, 14, 789–796. [Google Scholar] [CrossRef]
  36. Bąk, Ł.; Szeląg, B.; Górski, J.; Górska, K. The impact of catchment characteristics and weather conditions on heavy metal concentrations in stormwater—Data mining approach. Appl. Sci. 2019, 9, 2210. [Google Scholar] [CrossRef] [Green Version]
  37. Becouze-Lareure, C.; Dembélé, A.; Coquery, M.; Cren-Olivé, C.; Bertrand-Krajewski, J.L. Assessment of 34 dissolved and particulate organic and metallic micropollutants discharged at the outlet of two contrasted urban catchments. Sci. Total Environ. 2019, 651, 1810–1818. [Google Scholar] [CrossRef] [PubMed]
  38. Akan, A.O.; Houghtalen, R.J. Urban. Hydrology, Hydraulics and Stormwater Quality: Engineering Applications and Computer Modeling; John Wiley and Sons Inc.: Hoboken, NJ, USA, 2003. [Google Scholar]
  39. Fuchs, S.; Keiler, M.; Ortlepp, R.; Schinke, R.; Papathoma-Köhle, M. Recent advances in vulnerability assessment for the built environment exposed to torrential hazards: Challenges and the way forward. J. Hydrol. 2019, 575, 587–595. [Google Scholar] [CrossRef]
  40. Local Data Bank, Territorial Division. Head Office of Geodesy and Cartography, Warsaw. Available online: https://bdl.stat.gov.pl/BDL (accessed on 20 April 2020).
  41. Ciupa, T. The Impact of Land Use Runoff and Fluvial Transport in Small River Catchments: Based on the Sufraganiec and Silnica Rivers (Kielce, Poland); Jan Kochanowski University of Humanities and Sciences: Kielce, Poland, 2009. [Google Scholar]
  42. Ciupa, T.; Suligowski, R.; Ciupa, S. Hydrological issues in the environment protection programme of the city of Kielce. Studia Miej. 2017, 28, 167–182. [Google Scholar] [CrossRef]
  43. Walling, D.E. Solute variations in small catchment streams: Some comments. Trans. Inst. Br. Geogr. 1974, 64, 141–147. [Google Scholar] [CrossRef]
  44. Collins, M.B. Sediment yield studies of headwater catchments in Sussex, S.E. England. Earth Surf. Proc. Land. 1981, 6, 517–539. [Google Scholar] [CrossRef]
  45. Van Sickle, D. The effects of urban development on storm runoff. Tex. Eng. 1962, 32, 12. [Google Scholar]
  46. Wei, Z.; Simin, L.; Fengbing, T. Characterization of urban runoff pollution between dissolved and particulate phases. Sci. World J. 2013, 2013, 964737. [Google Scholar] [CrossRef] [Green Version]
  47. Tramblay, Y.; Saint-Hilaire, A.; Ouarda, T.B.M.J.; Moatar, F.; Hecht, B. Estimation of local extreme suspended sediment concentrations in California Rivers. Sci. Total Environ. 2010, 408, 4221–4229. [Google Scholar] [CrossRef] [Green Version]
  48. Old, G.H.; Leeks, G.J.L.; Packman, J.C.; Smith, B.P.G.; Lewis, S.; Hewitt, E.J.; Holmes, M.; Young, A. The impact of a convectional summer rainfall event on river flow and fine sediment transport in a highly urbanized catchment: Bradford, West Yorkshire. Sci. Total Environ. 2003, 314–316, 495–512. [Google Scholar] [CrossRef]
  49. Zeiger, S.; Hubbart, J.A. Quantifying suspended sediment flux in a mixed-land-use urbanizing watershed using a nested-scale study design. Sci. Total Environ. 2016, 542, 315–323. [Google Scholar] [CrossRef] [PubMed]
  50. Russell, K.; Vietz, G.; Fletcher, T. Global sediment yields from urban and urbanizing watersheds. Earth Sci. Rev. 2017, 168, 73–80. [Google Scholar] [CrossRef]
  51. Goodwin, T.H.; Young, A.R.; Holmes, M.G.; Old, G.H.; Hewitt, N.; Leeks, G.J.; Packman, J.C.; Smith, B.P. The temporal and spatial variability of sediment transport and yields within the Bradford Beck catchment, West Yorkshire. Sci. Total Environ. 2003, 314–316, 475–494. [Google Scholar] [CrossRef]
  52. Bello, A.A.D.; Hashim, N.B.; Haniffah, R.M. Impact of urbanization on the sediment yield in tropical watershed using temporal land-use changes and a GIS based model. J. Water Land Dev. 2017, 34, 33–45. [Google Scholar] [CrossRef] [Green Version]
  53. Lee, J.H.; Bang, K.W.; Ketchum, L.H.; Choe, J.S.; Yu, M.J. First flush analysis of urban storm runoff. Sci. Total Environ. 2002, 293, 163–175. [Google Scholar] [CrossRef]
  54. Soller, J.; Stephenson, J.; Olivieri, K.; Downing, J.; Olivieri, A.W. Evaluation of seasonal scale first flush pollutant loading and implications for urban runoff management. J. Environ. Manag. 2005, 76, 309–318. [Google Scholar] [CrossRef]
  55. Hudak, P.F.; Banks, K.E. Compositions of first flush and composite storm water runoff in small urban and rural watersheds, north-central Texas. Urban. Water J. 2006, 3, 43–49. [Google Scholar] [CrossRef]
  56. Michalczyk, Z.; Chmiel, S.; Głowacki, S.; Siwek, K.; Sposób, J. Surface runoff in the urbanized catchment of Głęboka street in Lublin in the summer season of 2011. Teka 2012, 9, 107–115. [Google Scholar]
  57. Wałek, G. The Influence of Roads on Surface Runoff Formation in the Urbanized Area on the Example of Silnica River Catchment in Kielce; Jan Kochanowski University: Kielce, Poland, 2019. [Google Scholar]
Figure 1. Land use and hydrometric stations in the Silnica catchment (1—hydrometric stations, 2—main watershed, 3—watershed of sub-catchments, 4—streams, 5—roads, 6—water reservoir, 7—forest, 8—green areas, 9—arable land, 10—impervious areas).
Water 12 02693 g001
Figure 2. Locations of the hydrometric stations superimposed on the longitudinal profile of the Silnica river. River channel: A—natural or slightly modified; B—regulated (riverbanks reinforced with sod, fascine or rock ballast); C—regulated (riverbanks reinforced with concrete elements); D—regulated with substantial mid-channel deposits (riverbanks reinforced with sod, fascine or rock ballast); E—covered section; F—artificial reservoir; arrow—location of the artificial reservoir.
Water 12 02693 g002
Figure 3. Areas that supply the Silnica channel with water and suspended solids. A—slopes and dry valleys, B—floodplains, C—direct supply to river channels, D—direct supply to river channels via anthropogenic drainage systems. Source: [41].
Water 12 02693 g003
Figure 4. Precipitation (P), specific runoff (q), suspended solids concentration (SSC) and dissolved solids concentration (DSC), suspended solids specific load (SSL) and dissolved solids specific load (DSL), during rainfall-induced floods in the Silnica catchment on (A) 21 July 2001 and (B) 25 July 2001.
Water 12 02693 g004
Figure 5. Selected hydrotechnical structures after modernisation or construction: (A) weir, (B) tunnel/relief channel, (C) bridge and bicycle path, (D) arch bridge, (E) relief channel inlet above the road culvert and (F) flood retaining wall.
Water 12 02693 g005aWater 12 02693 g005b
Table 1. Silnica catchment area with selected types of land use and development indicators.
CharacteristicSilnica Sub-Catchment Outlet
DabrowaPiaskiJesionowaPakoszBialogon
Surface area (km2)9.215.517.942.649.4
Mean catchment slope (‰)64.559.058.852.053.2
River kilometre (km)13.89.38.23.60.2
Channel slope (‰)14.911.710.78.47.4
Forests (%)72.951.244.929.632.7
Impervious surfaces (%)4.612.717.430.227.5
Other land use forms (%)22.536.137.740.239.8
Road density (km·km−2)4.86.17.112.711.8
Canal density (covered and uncovered) (km·km−2)1.21.62.05.04.7

