Article

Estimation of Precipitation Evolution from Desert to Oasis Using Information Entropy Theory: A Case Study in Tarim Basin of Northwestern China

1
College of Resource and Environmental Engineering, Guizhou University, Guiyang 550025, China
2
State Key Laboratory of Hydraulics and Mountain River Engineering, Sichuan University, Chengdu 610065, China
3
Institute for Disaster Management and Reconstruction, Sichuan University, Chengdu 610065, China
4
College of Architecture & Environment, Sichuan University, Chengdu 610065, China
*
Author to whom correspondence should be addressed.
Water 2018, 10(9), 1258; https://doi.org/10.3390/w10091258
Submission received: 25 August 2018 / Revised: 10 September 2018 / Accepted: 10 September 2018 / Published: 15 September 2018
(This article belongs to the Special Issue Advances in Hydraulics and Hydroinformatics)

Abstract

:
The cold-wet effect of oasis improves the extreme natural conditions of the desert areas significantly. However, the relationship between precipitation and the width of oasis is challenged by the shortage of observed data. In this study, the evolution of annual precipitation from desert to oasis was explored by the model establishment and simulation in Tarim Basin of northwestern China. The model was developed from the principle of maximum information entropy, and was calibrated by the China Meteorological Forcing Dataset with a high spatial resolution of 0.1° from 1990 to 2010. The model performs well in describing the evolution of annual precipitation from the desert to oasis when the oasis is wide enough, and the R2 is generally more than 0.90 and can be up to 0.99. However, it fails to simulate the seasonal precipitation evolution because of the non-convergence solved by nonlinear fitting and the unfixed upper boundary condition solved by the least square method. Through the simulation with the parameters obtained from the nonlinear fitting, the basic patterns, four stages of precipitation evolution with the oasis width increasing, are revealed at annual scale, and the current stages of these oases are also uncovered. Therefore, the establishment of the model and the simulated results provide a deeper insight from the perspective of informatics to understand the regional precipitation evolution of the desert–oasis system. These results are not only helpful in desertification prevention, but also helpful in fusing multisource data, especially in extreme drought desert areas.

1. Introduction

Oasis serves to improve the extreme natural conditions of the arid regions by affecting the regional hydrometeorological factors [1,2,3,4,5,6,7], and the oasis–desert interactions are important for the stable co-existence of oasis and desert ecosystems [8] and water resources management [9]. Hence, quantifying the spatial evolution of precipitation with the oasis width increase is crucial to the regional eco-environmental security in the arid areas.
In fact, the spatial evolutions of precipitation are affected by the cold-wet effect of oasis. The cold effect is mainly resulted from the greater absorption of latent heat through evapotranspiration [10,11] and the higher surface albedo of the vegetation than the desert surface [3]. The wet effect is because of more water vapor source from the evapotranspiration of oasis [3,4]. As a result, the local water vapor can account for up to 20% of the precipitation in arid and semiarid regions [12,13] and 20–50% in humid regions [14,15,16,17]. In fact, the extreme arid environment leads to the much larger difficulties of data observation. Many studies are based on the field observation at a low spatial resolution [1,2,3,4,5,6,12,13,14,15,16,17], although some multiscale datasets are available in specific areas such as Heihe Basin located in the northwestern China [18]. Thus, generally, exploring the relationship between the precipitation and oasis width quantitatively is still challenged by the resolution of data.
Merging multisource data is a useful tool to solve the problem of data shortage and low resolution, especially fusing the calibrated remote sensing data with the land surface observed data. After the early attempts in the 1980s [19,20], the resolution of the assimilation data has improved substantially. For example, as for the ocean system, the current resolution is about 1/4–1/6 degrees [21,22]. In China, the current resolution is 0.1 degrees spatially [23,24], and its good spatial continuity has been demonstrated by several studies. These studies have uncovered the spatial distribution of precipitation and evaporation in the Nam Co basin in Tibetan Plateau [25,26], and the spatial patterns of permafrost based on the climatic factors of this dataset [27]. The higher resolution of fusion dataset provides an alternative source to analyze the spatial evolution of precipitation.
Entropy, combining the micro and macro status, has been widely used to simulate the evolution of a system. Information entropy is a better measure of variability than the variance and coefficient of variation when the probability distribution is not symmetric [28,29], because entropy may be related to higher order moments of a distribution [30]. Hence, it has been employed to evaluate the complexity of typical chaos [31] and uncertainty of precipitation and the potential water resources ability at different scales [32,33,34,35]. Spatially, entropy has been widely employed to evaluate the spatial distribution of rainfall gauge net [36,37], quantify the soil water dynamic processes [38,39,40], explore the multifractal generation [41,42] and simulate the shallow water and solution transportation based on the molecule collision [43,44]. These applications above indicate that entropy is not only a good index to describe the uncertainty of a time series, but also a good method to describe the spatial continuity.
Therefore, the objective of this study was to quantitatively explore the evolution of precipitation from desert to inner oasis based on the Tarim Basin, northwestern China. A model describing precipitation evolution was developed from the information entropy theories, and then the parameters of model were fitted by the China Meteorological Forcing Dataset with the spatial resolution of 0.1 degrees. Through the simulation, the typical precipitation evolution patterns weare revealed, and the current stage of these oases were also identified. The establishment of the model and the simulated results provide a deeper insight from the perspective of informatics to understand the regional precipitation evolution of the desert–oasis system. These results are useful for the desertification prevention and multisource data fusion, especially in extreme drought desert areas.

2. Study Area, Data and Methodology
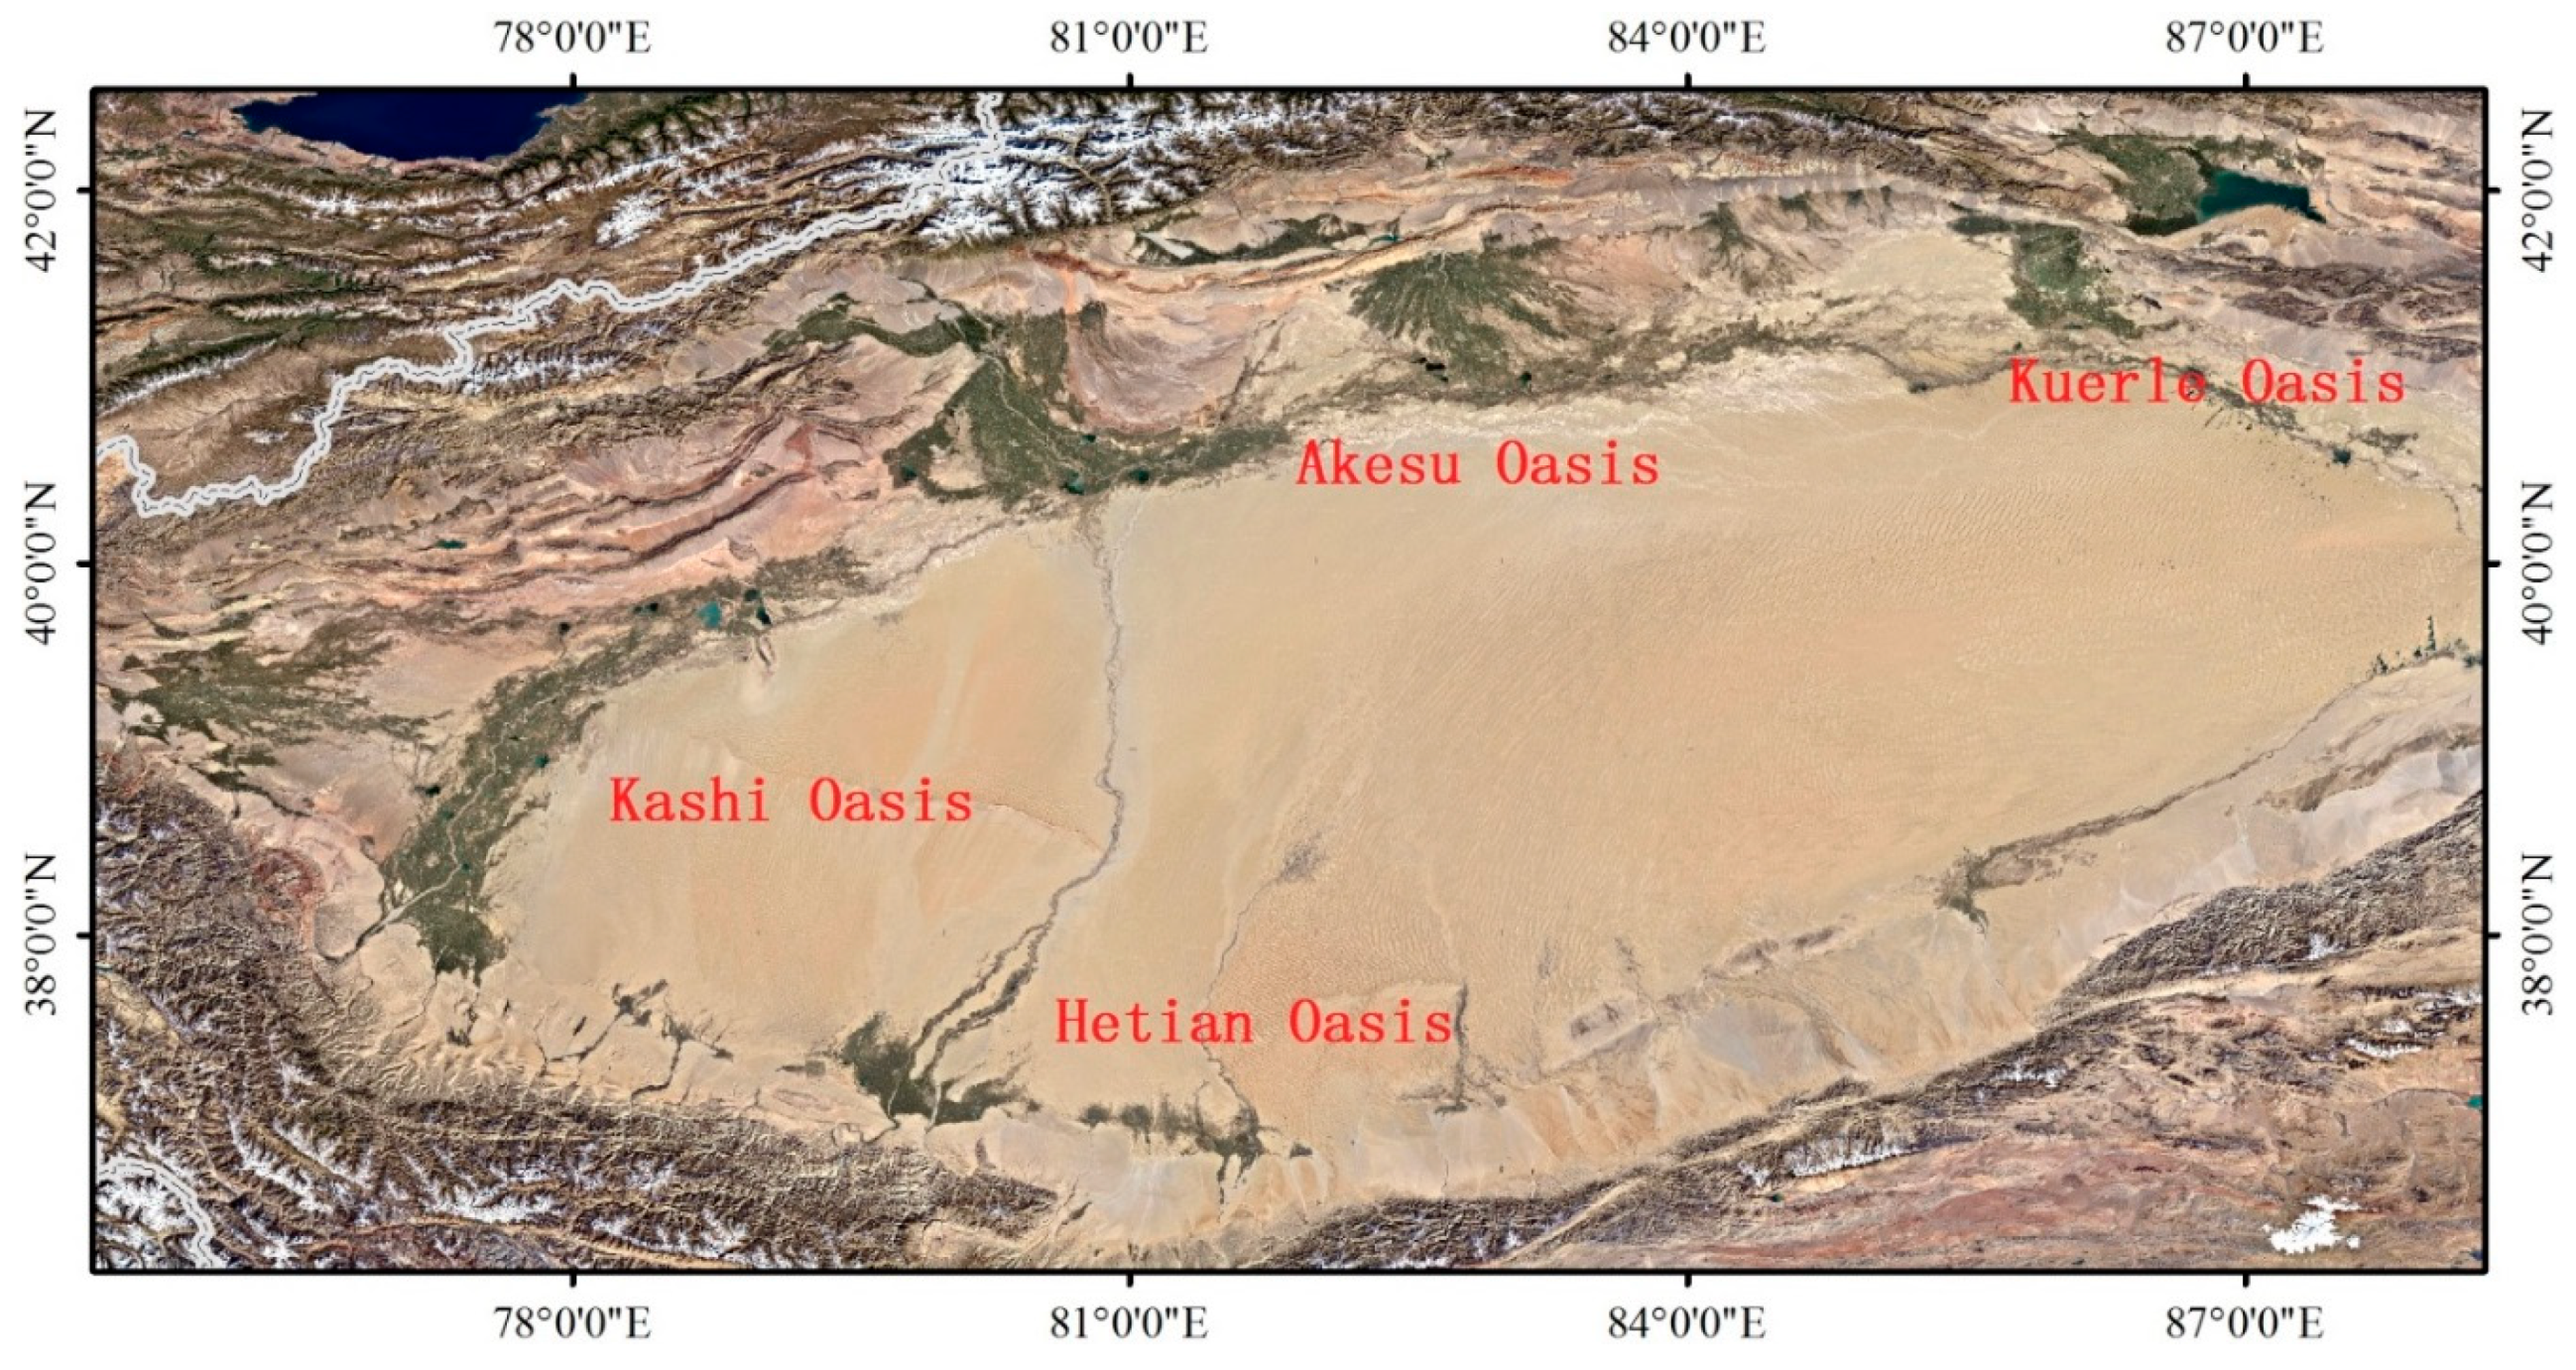
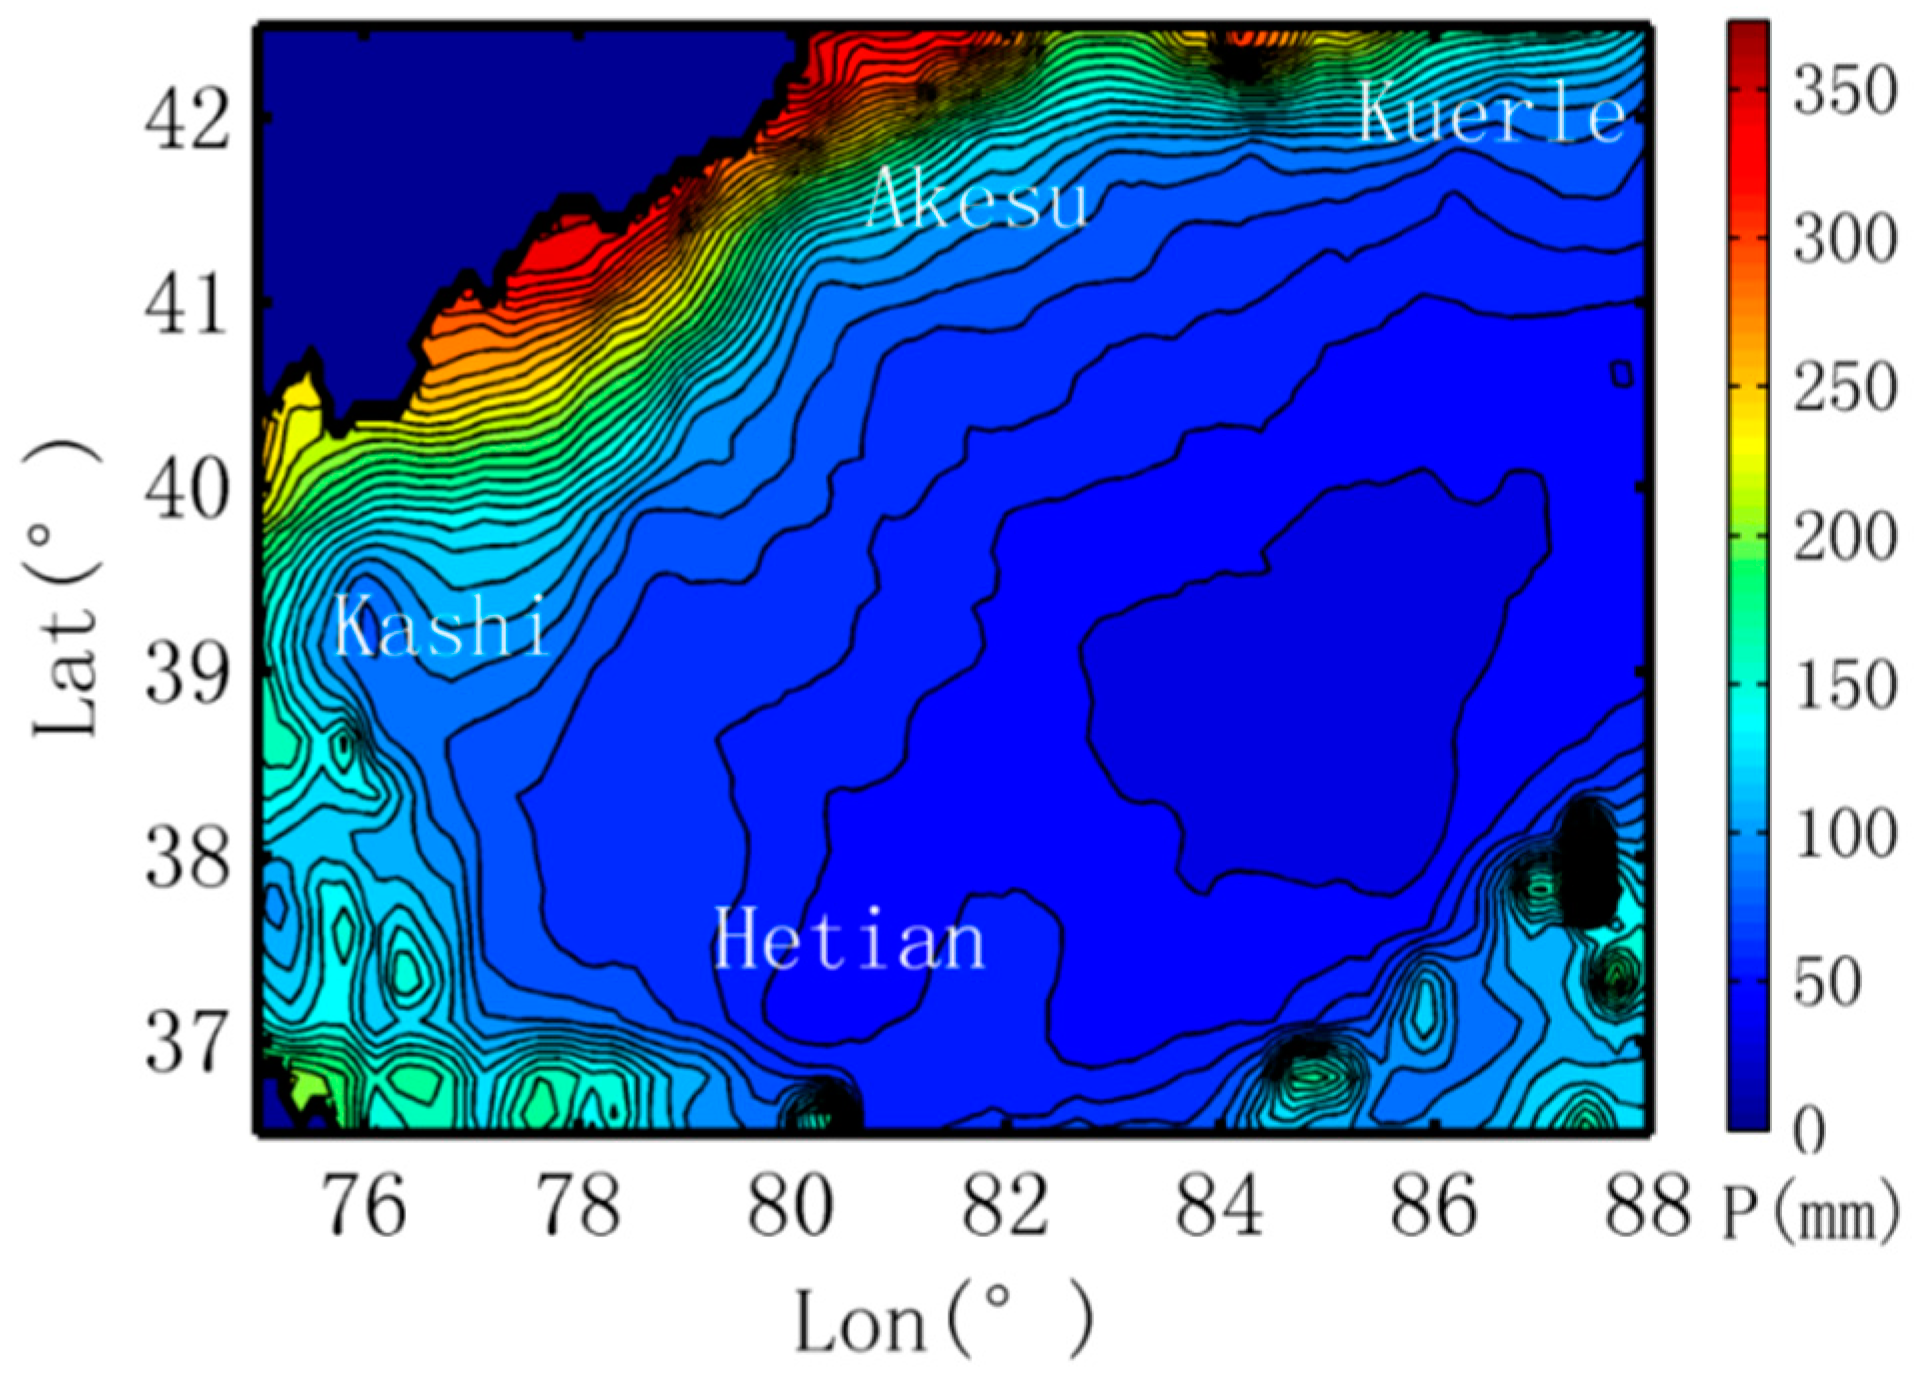
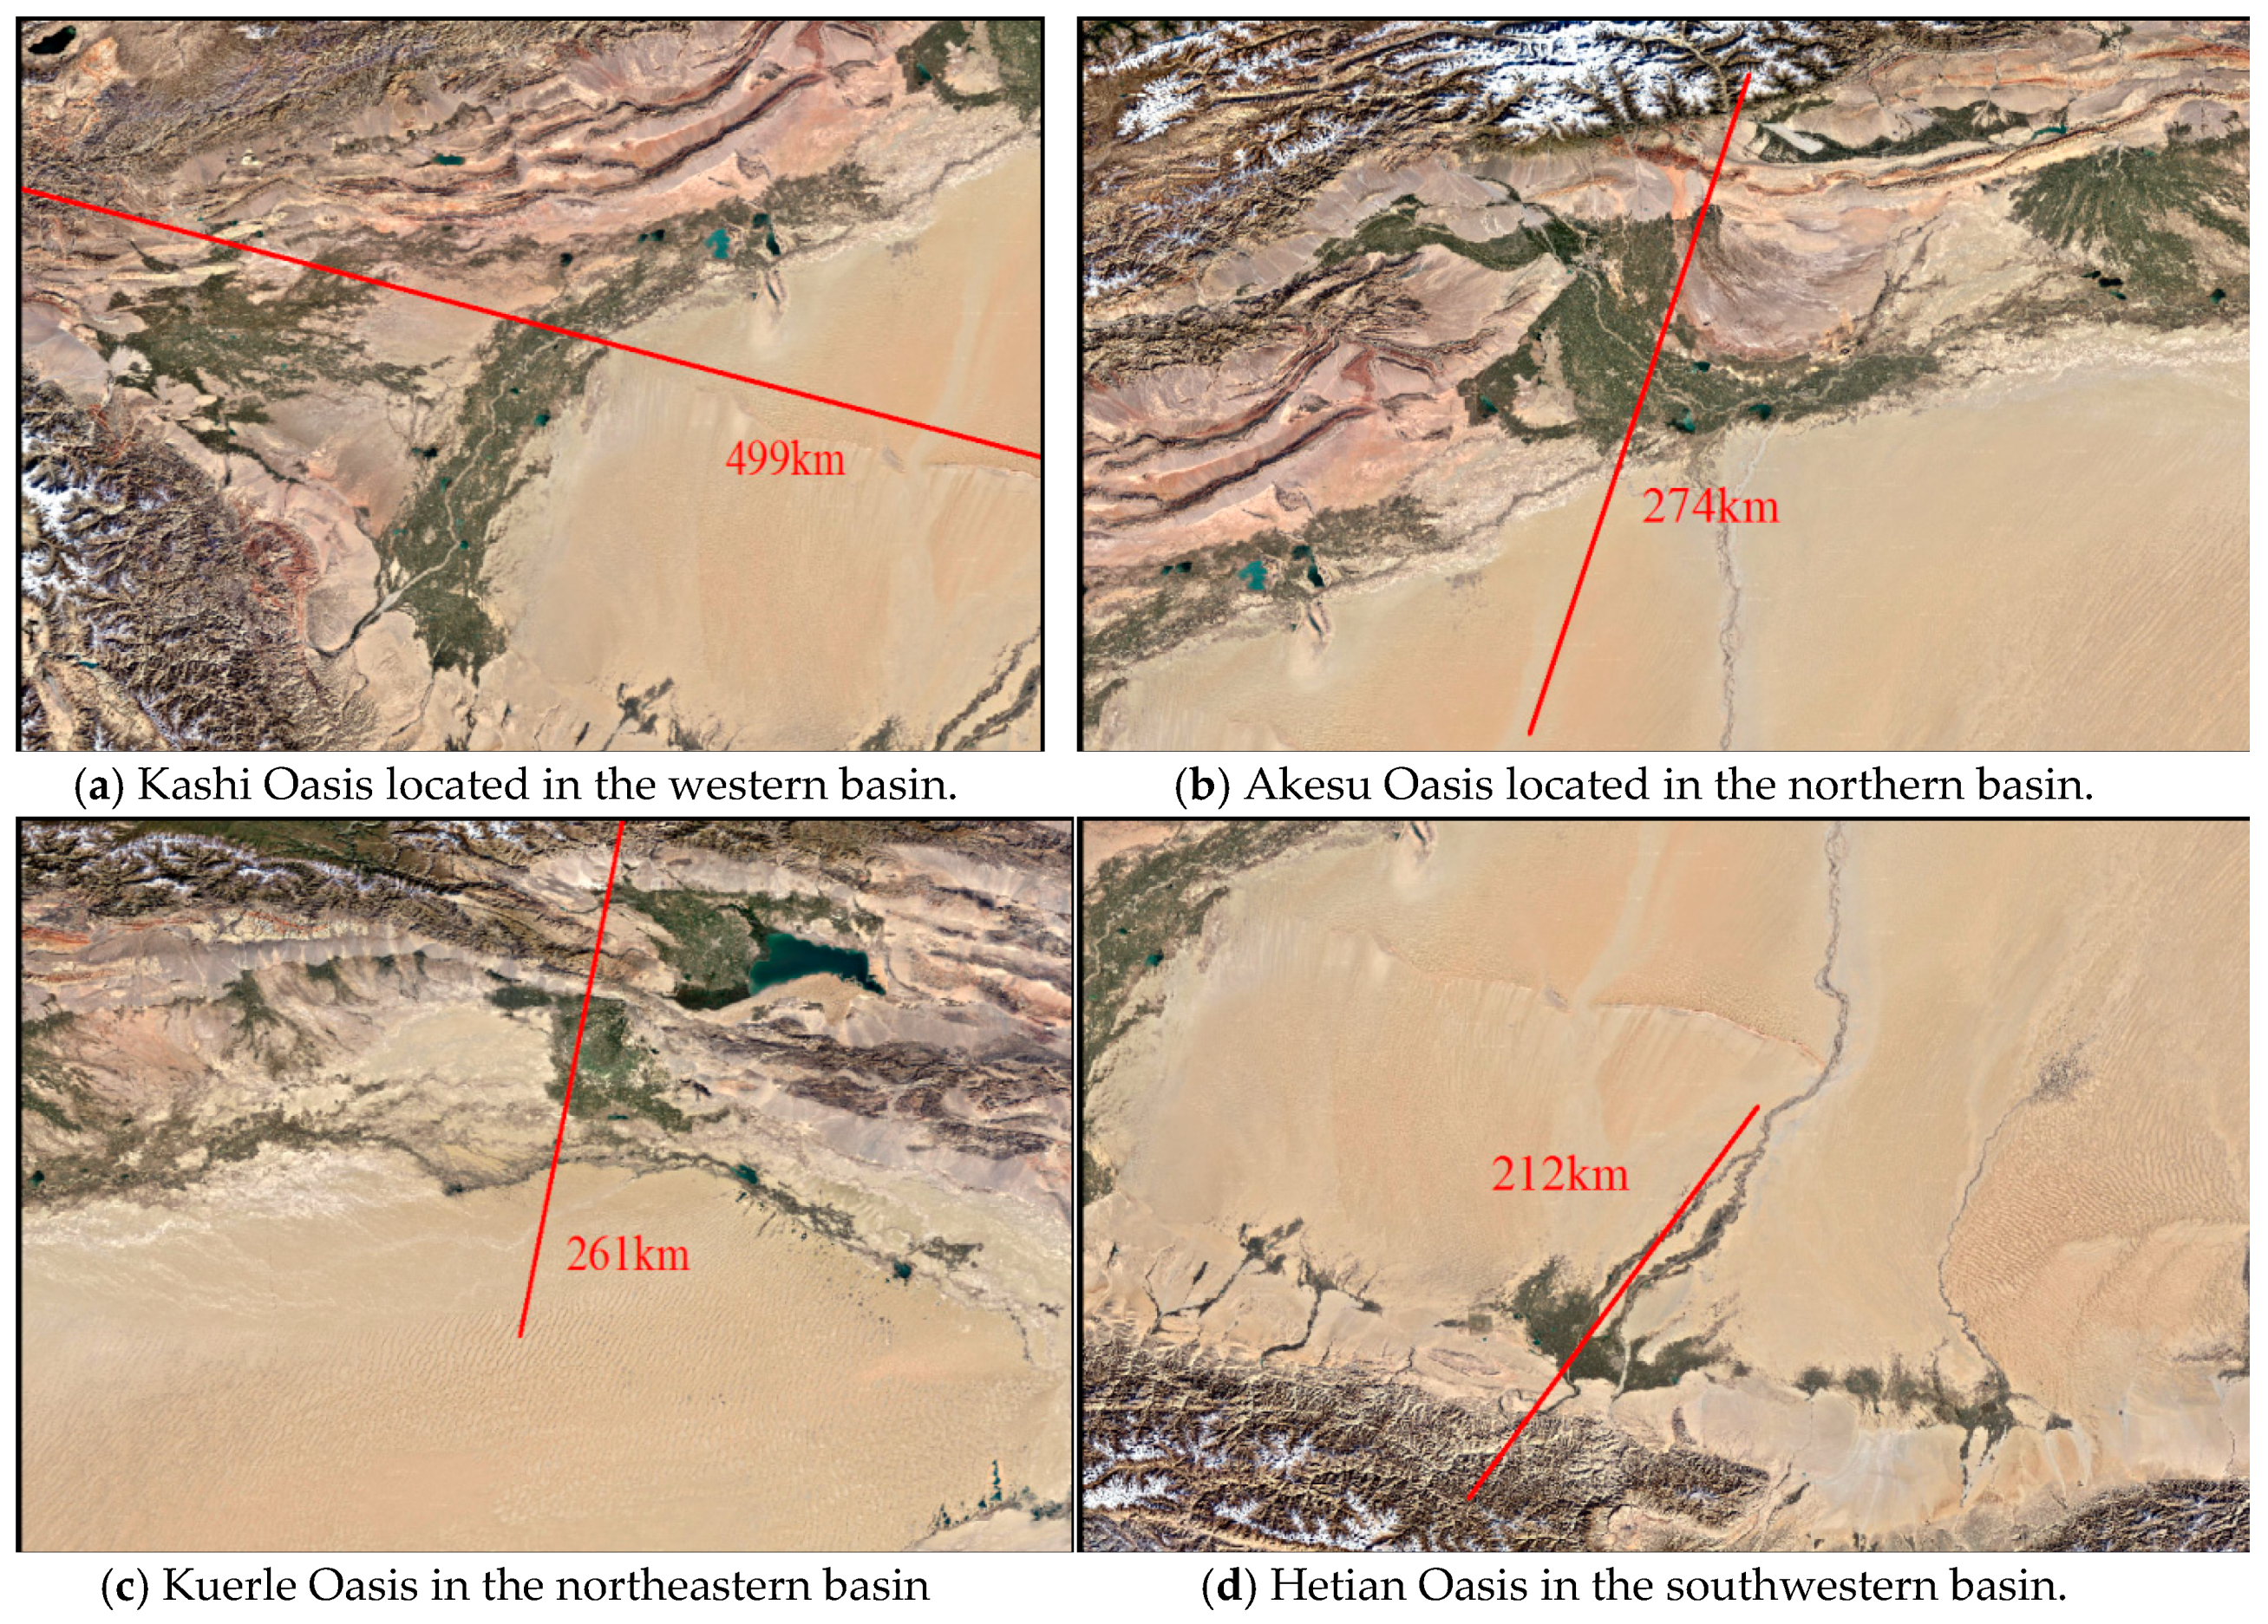
2.1. Study Area

The Tarim Basin, covering an area of approximately 560,000 km2, is located in the south of Xinjiang Province in northwestern China [45,46], as shown in Figure 1. The Taklamakan Desert, which formed at least 5.3 Ma years ago, is in the center of the Tarim Basin [47]. The total area of the oasis is approximately 103,900 km2 [11,48]. In the desert region, the annual precipitation is from less than 15 to 60 mm, increasing from the east to the west [49], and the increase rate is 10.15, 6.29, and 0.87 mm per decade in the mountain, oasis and desert areas, respectively, based on the observed data from 1960 to 2010 [50]. However, the annual potential evaporation is over 3200 mm based on the evaporation from water surface, and most of the basin is a generally unsuitable or extremely unsuitable area for human settlement [51]. Currently, the irrational reclamation of land and overuse of natural resources have led to the destruction of vegetation and shrinkage of the water area [52,53,54] and have threaten the security and sustainable development of oases [48].

2.2. Data

In this study, the China Meteorological Forcing Dataset, developed by the Data Assimilation and Modeling Center for Tibetan Multispheres, Institute of Tibetan Plateau Research, Chinese Academy of Sciences [23,24], was used to test the performance of the model and to calibrate the parameters of the precipitation evolution form the desert toward oasis. The dataset was produced by merging a variety of data sources. More details on the dataset are given in the user’s guide of the Dataset [55]. The spatial and temporal resolutions of the dataset are 0.1 degrees and 3 h, respectively, and the data length is 21 years (1990–2010). Based on the dataset, the spatial distributions of annual precipitation in Tarim basin are shown in Figure 2.

2.3. Information Entropy and Principle of Maximum Entropy

Assuming the probability density function of a continuous variable x is expressed by f(x), and the information entropy is calculated as [56,57]:
H ( x ) = a b f ( x ) ln ( x ) d x  
a b f ( x ) d x = 1  
where a and b and the lower and upper boundaries of the variable x, respectively.
In addition, the known information of the variable represented by gi(x), such as mean and standard deviation, can be given by the following formula:
a b g i ( x ) f ( x ) = N i  
Hence, the general solution of f(x) can be obtained by solving the conditional extreme values using the method of Lagrange multipliers: the objective function is the maximum information entropy, and the constraint is the known information in Equation (3). More details about the mathematical derivation is presented in the literature [40,58]. The general form of f(x) is given as:
f ( x ) = e i = 1 n g i ( x )  

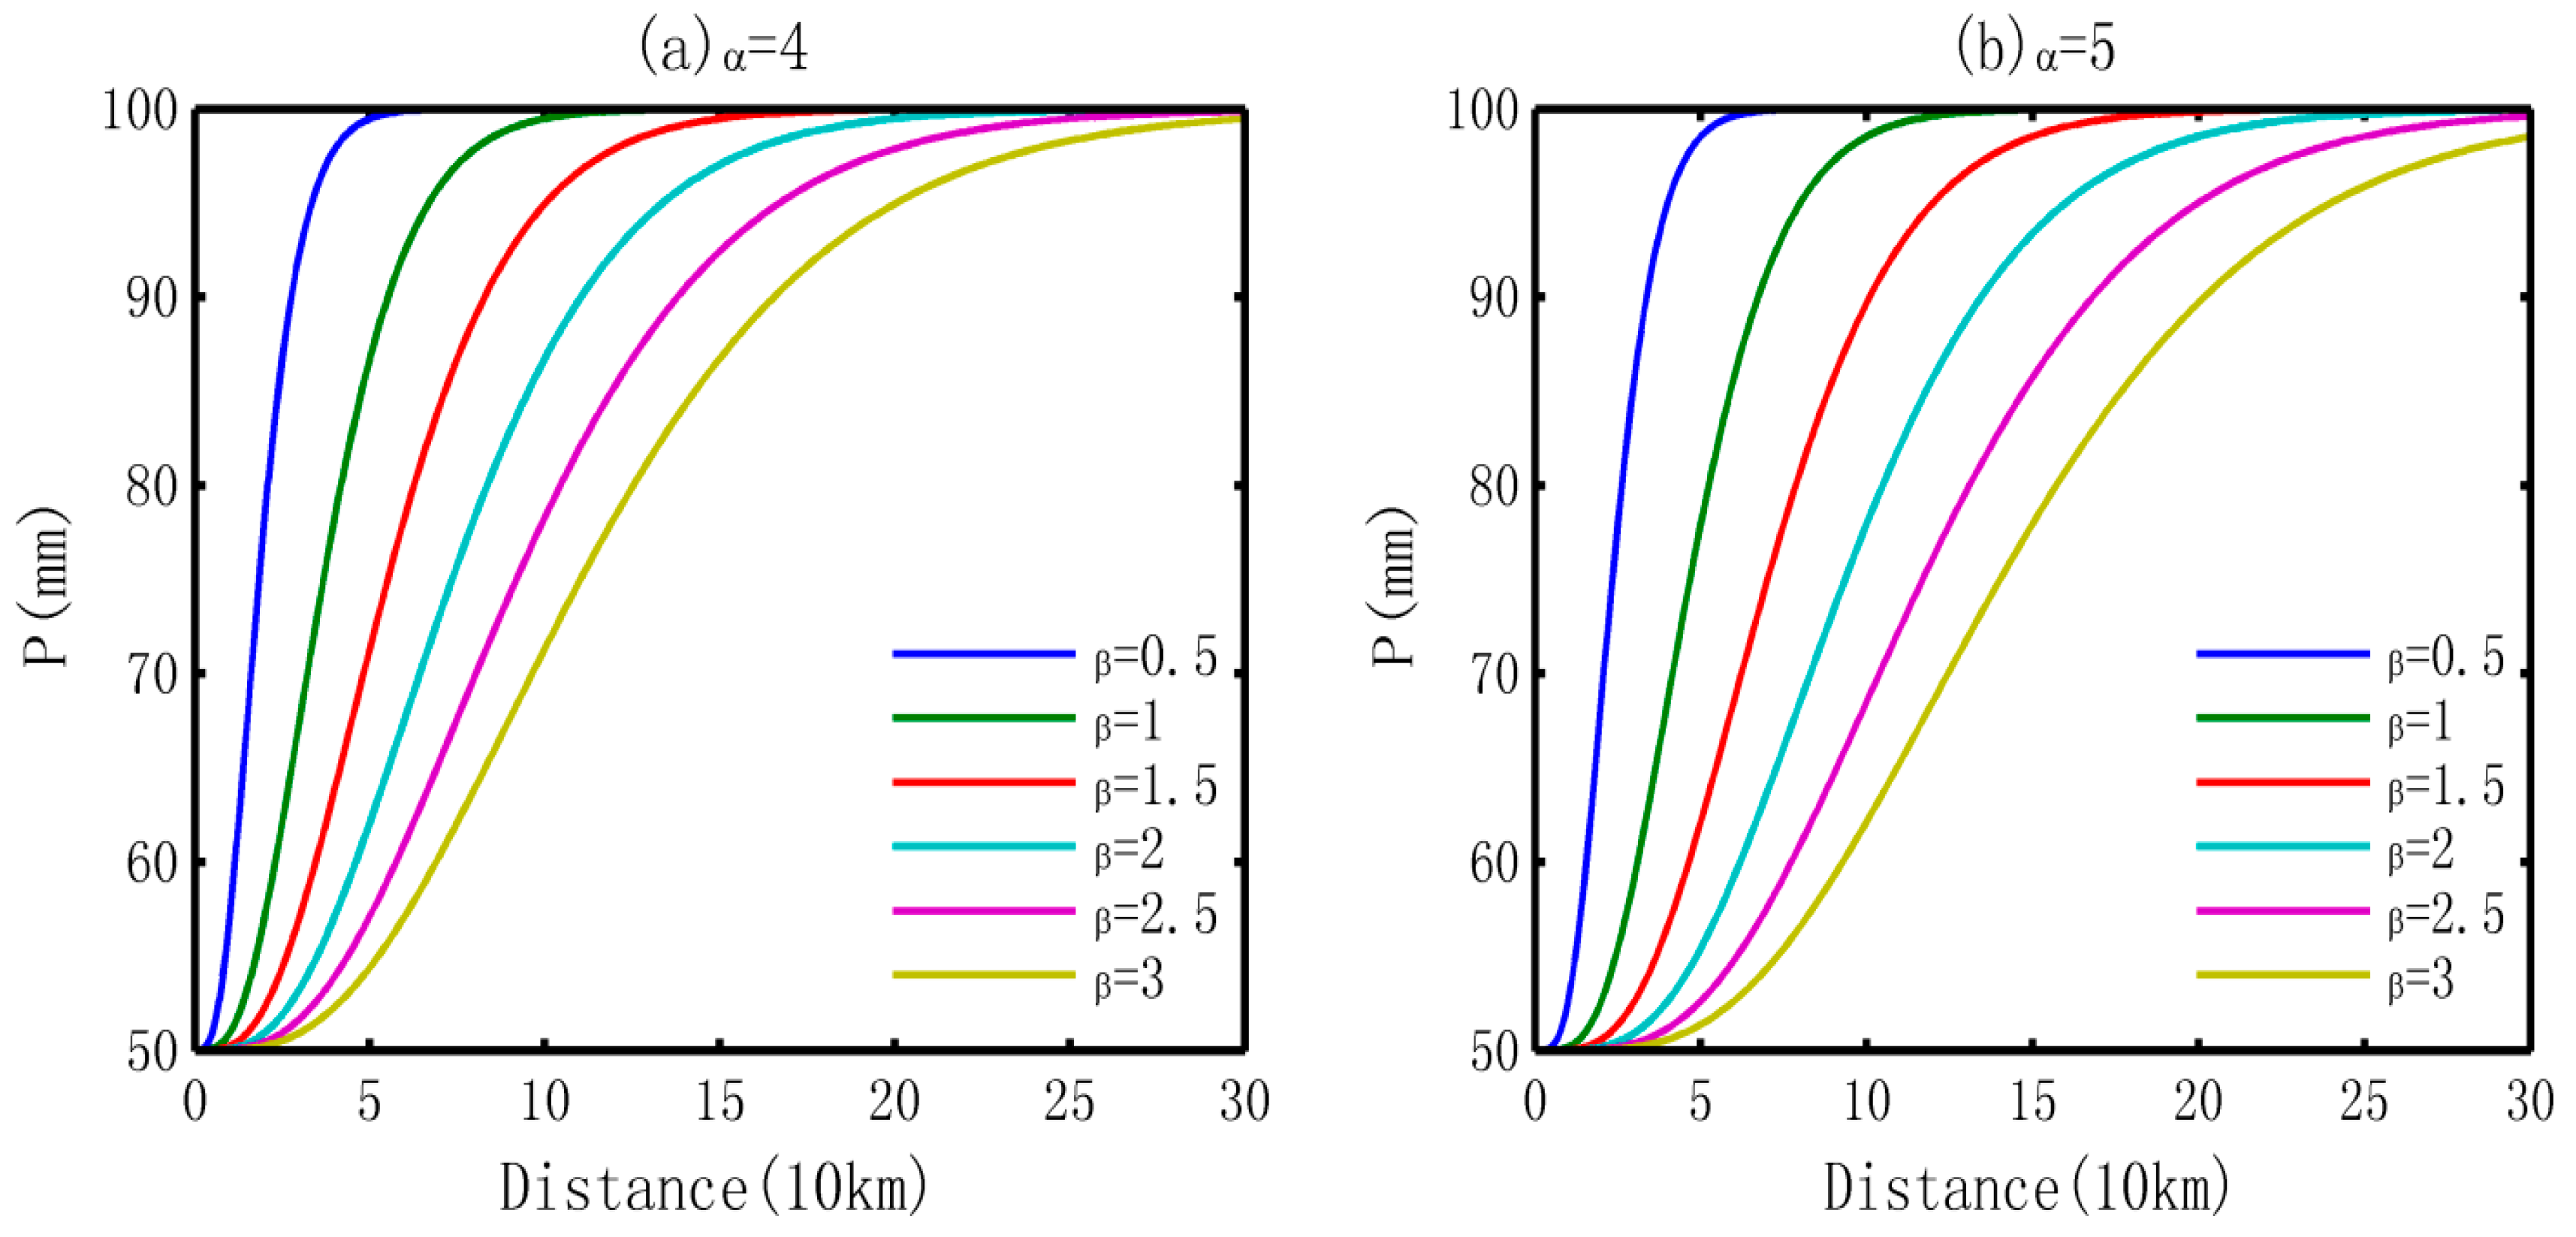
3. Establishment of the Model

Assuming the precipitation at the boundary area between oasis and desert is P0, the precipitation evolution from desert toward the oasis is represented by the integration of a function p(z), as given in Equation (5):
P ( z ) = P 0 + 0 Z p ( z ) d z  
where z represents the distance from the desert–oasis boundary to a certain point of the oasis. P(z) represents the precipitation at the location with distance z. Equation (5) can also be transformed into the following form:
P ( z ) P 0 = 0 Z p ( z ) d z  
Usually, P(z) reaches a constant approximately when the oasis is wide enough. Here, Equation (6) can be written as:
0 + p ( z ) d z = C  
where the constant C represents the maximum increment of precipitation with the increase of oasis width. Dividing both sides of the equation by the constant C, Equation (7) becomes:
1 C 0 + p ( z ) d z = 1  
Hence, the item of p(z)/C can be considered as a probability density function, and its information entropy is calculated by Equations (9) and (10):
H = 0 Z 1 C p ( z ) ln p ( z ) C d z  
H = 1 C 0 Z p ( z ) ln p ( z ) d z + 1 C ln C
As for a specific oasis, the spatial distribution can be considered as stable approximately in a mid-long term. Correspondingly, the arithmetic mean and geometric mean of precipitation evolution can be considered as constant, as given by Equations (11) and (12), respectively.
0 z C p ( z ) d z = μ z
0 ln ( z ) C p ( z ) d z = ν z
where μz and νz represent the arithmetic mean and geometric mean. Here, the Lagrange function is obtained based on the information entropy of precipitation evolution with the constraints of Equations (8), (11) and (12), as given by Equation (13).
L = 1 C 0 Z p ( z ) ln p ( z ) d z + 1 C ln C + λ 0 ( 0 Z 1 C p ( z ) d z 1 )   + λ 1 ( 0 Z z C p ( z ) d z μ z ) + λ 2 ( 0 Z ln ( z ) C p ( z ) d z ν z )
Let L p ( z ) = 0 , then the general solution of p(z)/C is obtained by solving the conditional extreme values, as given in Equation (14):
p ( z ) / C = e λ 0 1 + λ 1 z + λ 2 z ln z  
Equation (14) can also be written as:
p ( z ) / C = e λ 0 1 e λ 1 z z λ 2  
Let λ2 = α − 1, λ1 = −1. It is easy to obtain that eλ0−1 = −α/Γ(α). Thus, the probability density function p(z)/C can also be expressed as:
p ( z ) / C = 1 Γ ( α ) β α z α 1 e z / β  
Substituting Equation (16) into Equation (5), the evolution of precipitation with the oasis width increase is:
P ( z ) = P 0 + C 0 z 1 Γ ( α ) β α z α 1 e z β d z  
In fact, the right-hand term of Equation (16) is the probability density function of a gamma distribution. Therefore, Equation (17) shows that the precipitation evolution model is based on the scaled cumulative distribution function of a gamma distribution with an initial precipitation. In other words, the model is based on the linear transformation of the cumulative distribution function of a gamma distribution. The parameters of the model include the shape factor α, scale factor β, zooming constant C and initial precipitation P0 at the boundary between desert and oasis.
Assuming the initial precipitation P0 at the boundary between desert and oasis is 50 mm/year and the zooming constant C is 50, the illustration of the precipitation evolution are shown in Figure 3 with different shape and scale factors.

4. Calibration of the Model and the Simulated Results

4.1. Calibration of the Model

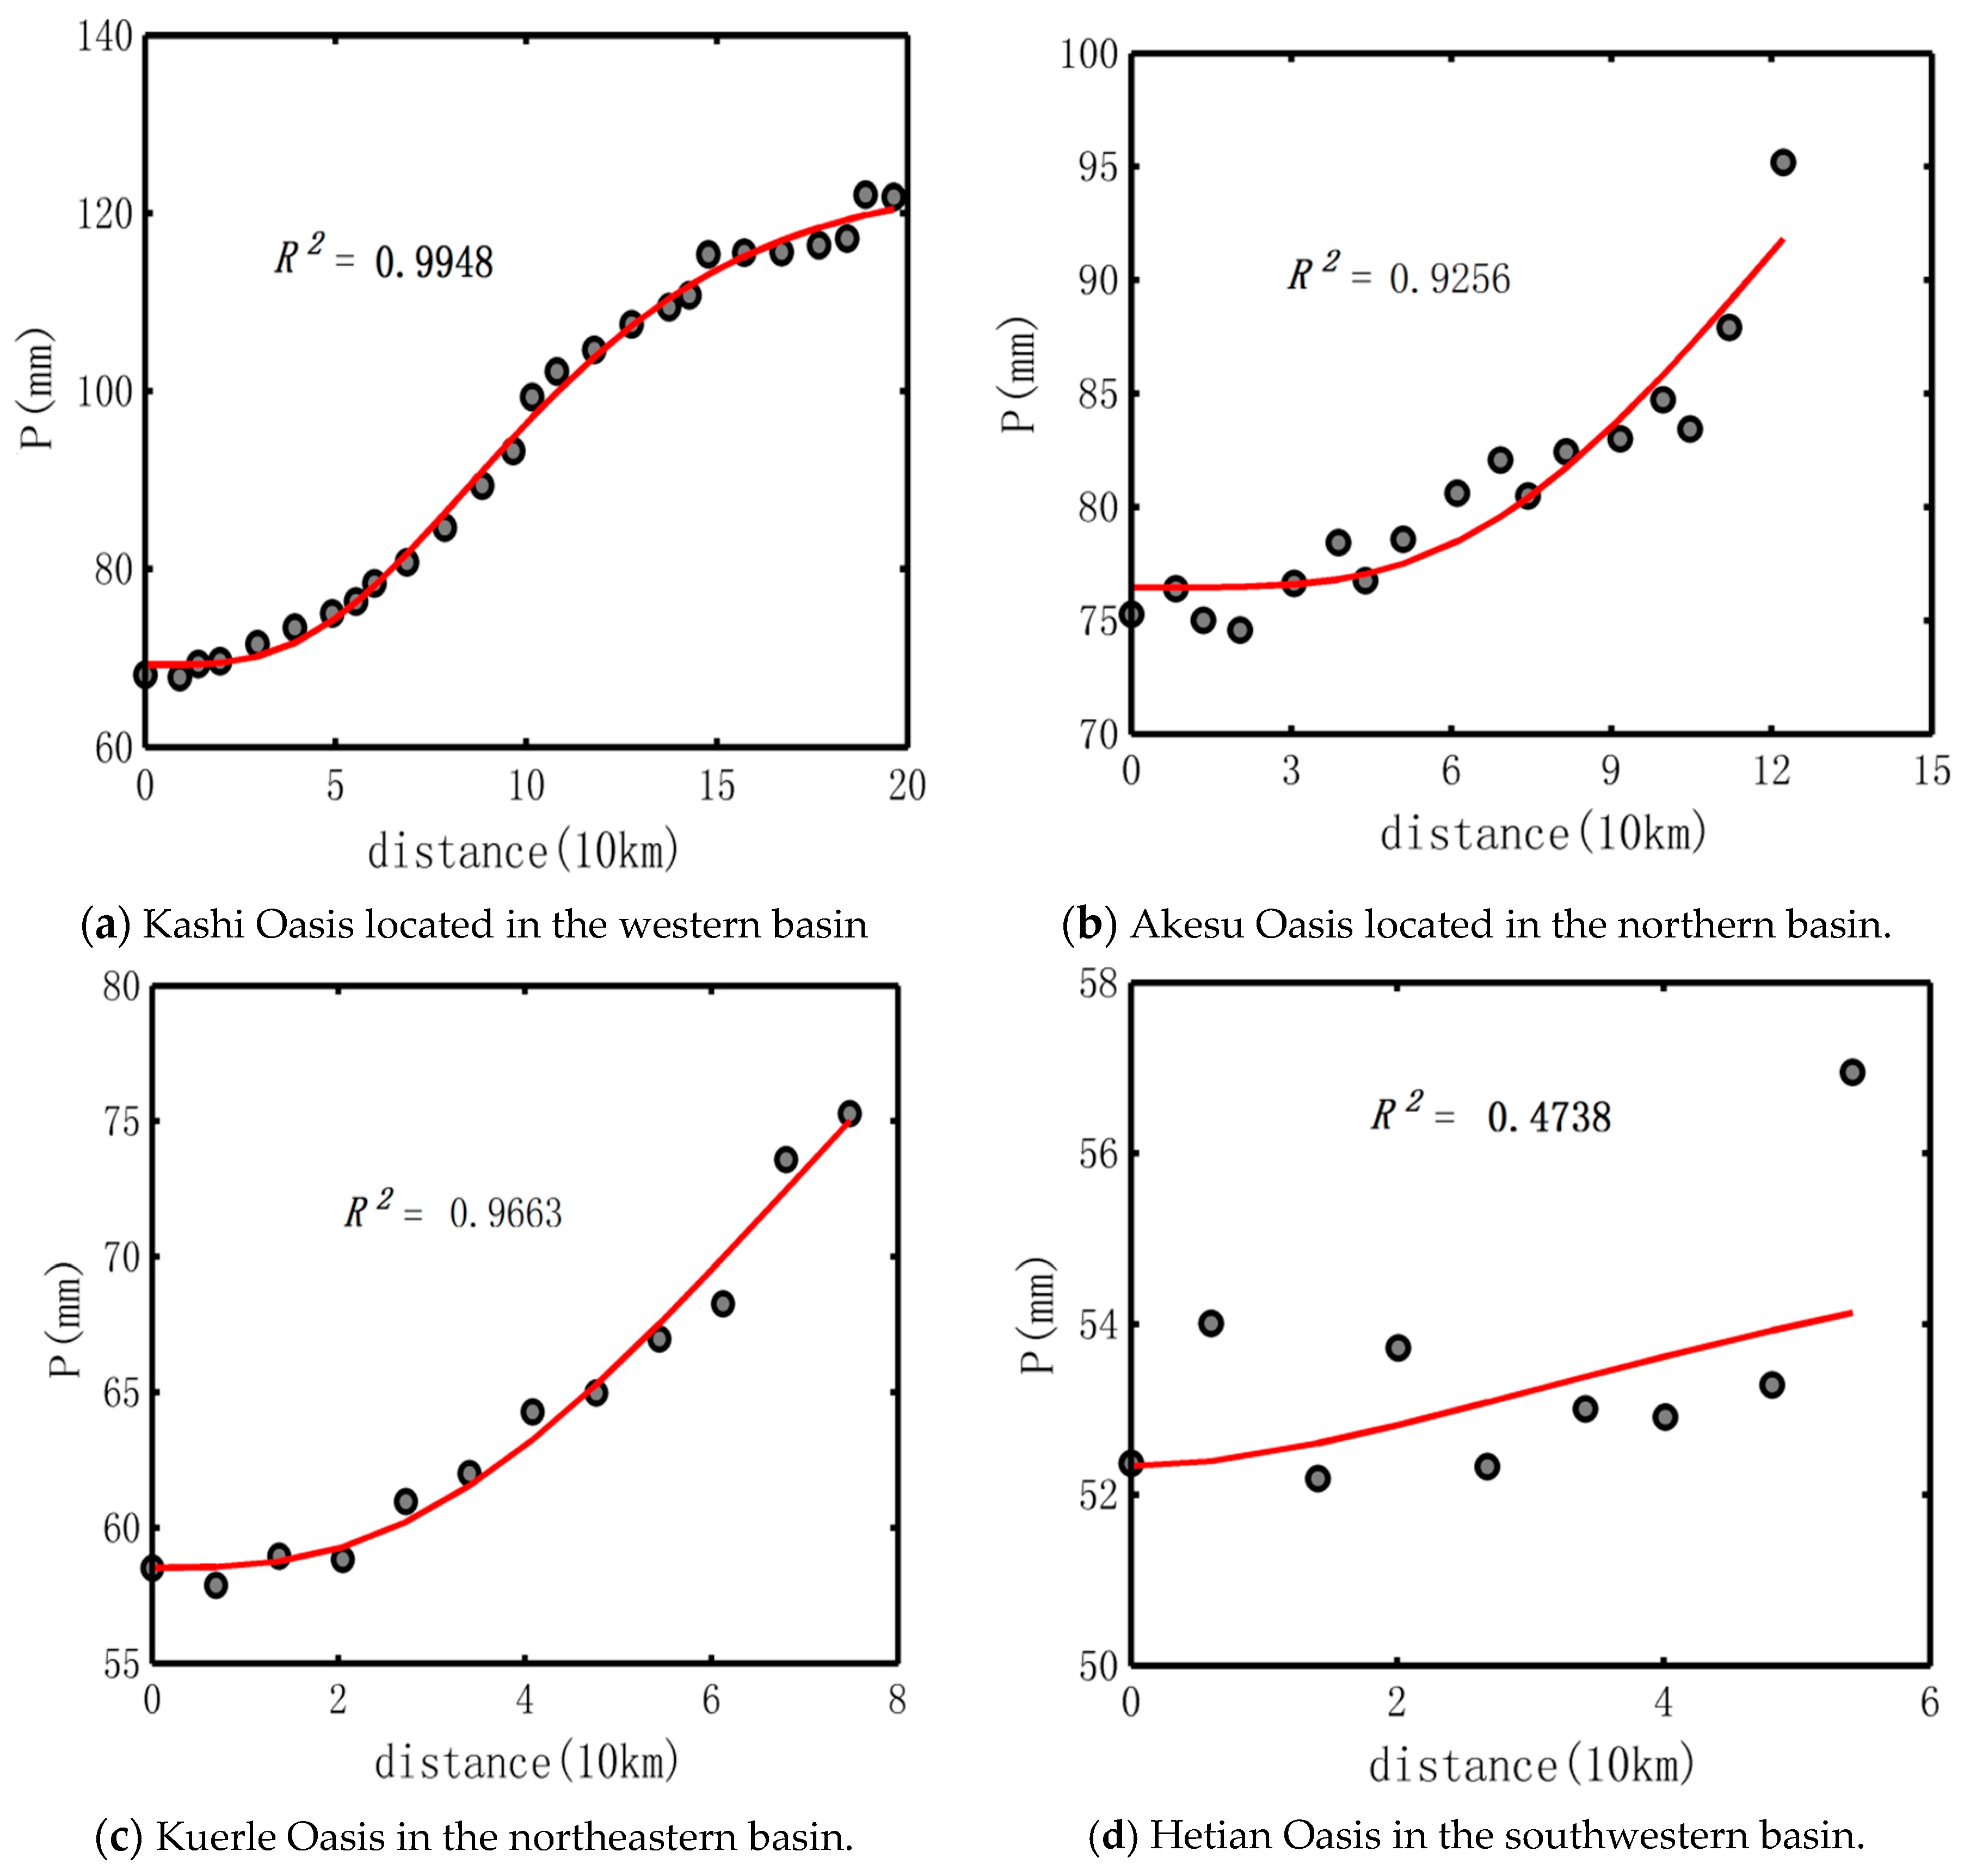
4.1.1. Performance of the Model

In this study, four main oases were used to test the performance of the model. These oases are Kashi Oasis located in the western basin, Akesu Oasis in the northern basin, Kuerle Oasis in the northeastern basin and Hetian Oasis in the southwestern basin. The evolution routes of precipitation from desert to oasis are shown in Figure 4. Generally, these routes are located in the middle of these oases.
Following the routes shown in Figure 4, the evolution of precipitation from desert to oasis is obtained, and the results are scattered in Figure 5. Here, the parameters of the model are obtained by nonlinear fitting. The correlation coefficient is used to evaluate the performance of the model given by Equation (17). The fitted results and the square of correlation coefficient, R2, of the four selected routes are also shown in Figure 5.
The model performs well in three oases: Kashi Oasis, Akesu Oasis and Kuerle Oasis, corresponding to R2 of 0.99, 0.93 and 0.97, respectively. However, the model does not perform well in Hetian Oasis and the R2 is 0.47. To improve the accuracy trend of precipitation evolution, the model should be calibrated further for the Hetian Oasis.

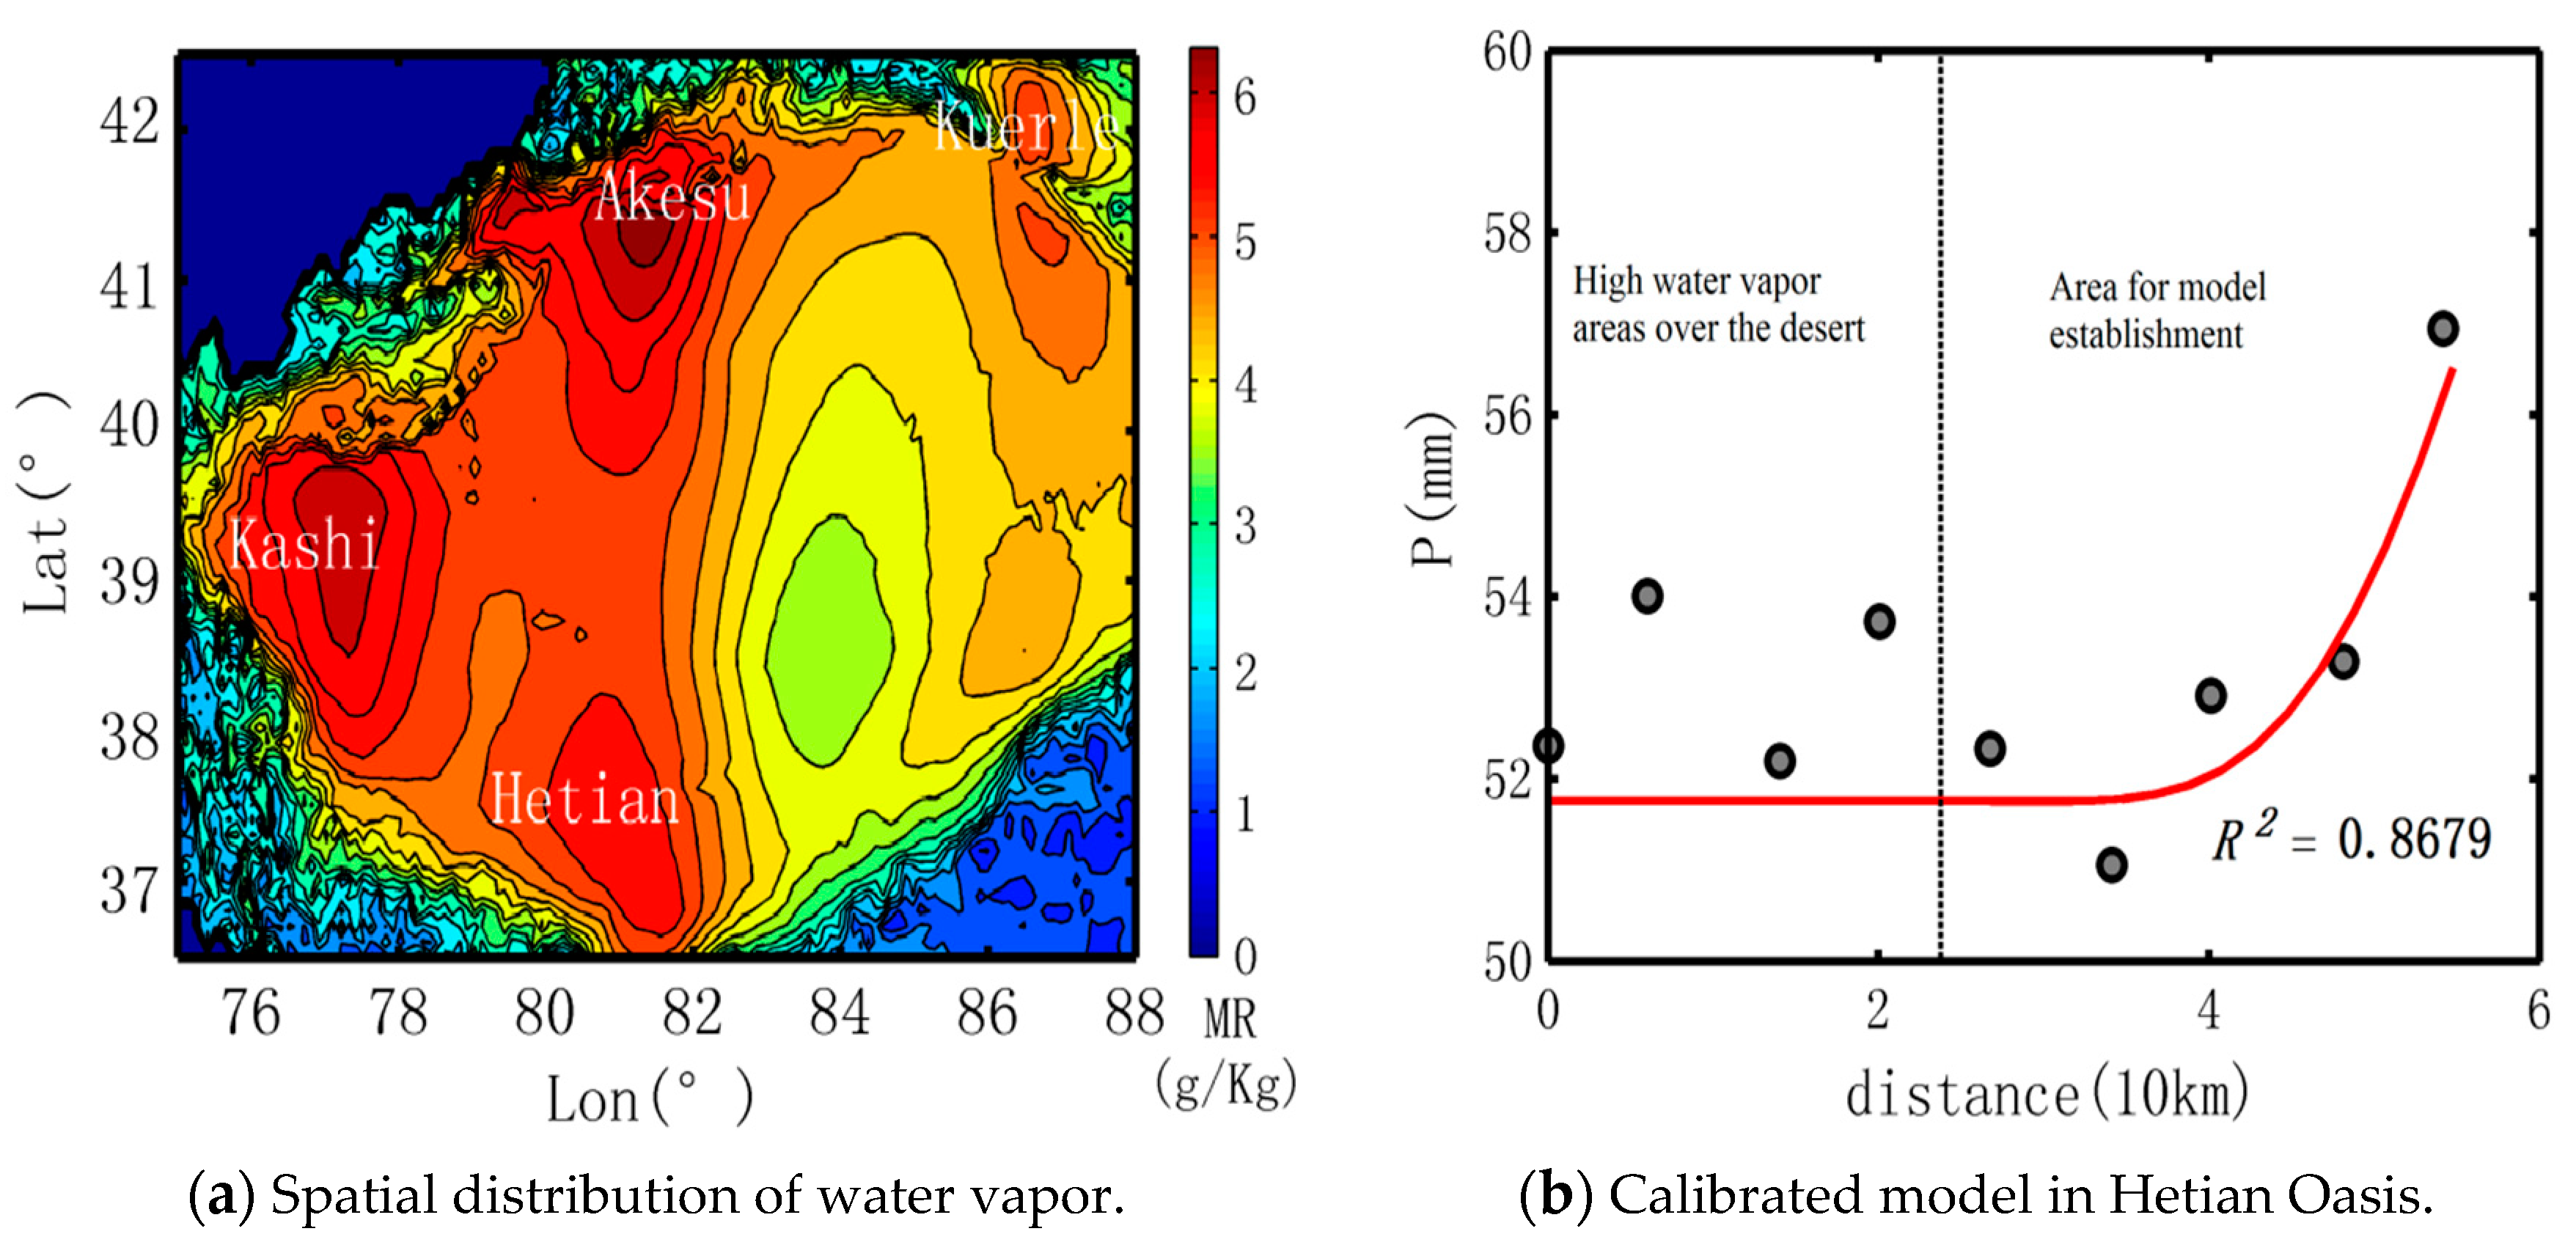
4.1.2. Calibration of Model for Hetian Oasis

Through combining the spatial distribution of oasis and the local hydrological cycle, two main reasons were found to lead to the poor performance of the model. The first is the much smaller width of Hetian Oasis. As shown in Figure 5, the Hetian Oasis is about 55 km wide, while Kashi Oasis is 200 km, Akesu Oasis is 120 km and Kuerle Oasis is 80 km. The second reason is that the prevailing wind direction of the Hetian Oasis is opposite to the cold effect of oasis [59,60,61]. Our previous study revealed that the opposite direction leads to water vapor from the local evapotranspiration accumulating over the buffer zone located in the down wind direction of the oasis [49], as shown in Figure 6a. Hence, the evolution of precipitation in the Hetian Oasis should be divided into two phases: the buffer zone with abnormal high precipitation and the regular pattern of the precipitation evolution after the buffer zone, as shown in Figure 6b.
By overlapping the spatial distribution of water vapor content and oasis layout, it was found that the first four grids should be removed to calibrate the model. After their removal, the calibrated model performs much better, and the R2 increased from 0.47 to 0.87, as shown in Figure 6b.

4.1.3. Parameter Inversion

Based on the results obtained by nonlinear fitting, the parameters of the model for all four oases are obtained, as shown in Table 1. According to Equation (17) and Figure 3, the meanings of these parameters are clear. P0 is the initial value that represents the precipitation at the boundary area between oasis and desert. Here, AKesu Oasis exhibits largest value, followed by Kashi, Kuerle and Hetian respectively. The zooming constant, C, represents the maximum potential increment of precipitation with the oasis width increase. The results of zooming constant C suggest the maximum promotion on local precipitation in Kashi, middle level in AKesu and Kuerle, and the minimum promotion in Hetian Oasis. Shape and scale factors represent the increase rate of the precipitation. A larger value is usually accompanied with a smaller increase rate, and vice versa (Figure 3).

4.1.4. Influence of the Local Terrain

Apart from the cold-wet effect of oasis, the significant uplift of the terrain would lead to a sharp decrease in temperature and result in a substantial increase in precipitation at the local scale. As given in our previous study [49], the increment of the elevation is about 80–100 m. Meanwhile, the widths of Kashi, Akesu, Kuerle and Hetian Oases are approximately 210, 120, 80 and 55 km, respectively, as shown in Figure 5. This indicates that the increase rate is ordered by: Hetian > Kuerle > Akesu > Kashi. However, this trend is opposite to the increment and increase rate of precipitation from desert to oasis. Hence, the increase of precipitation from desert to oasis is not dominated by the local terrain.

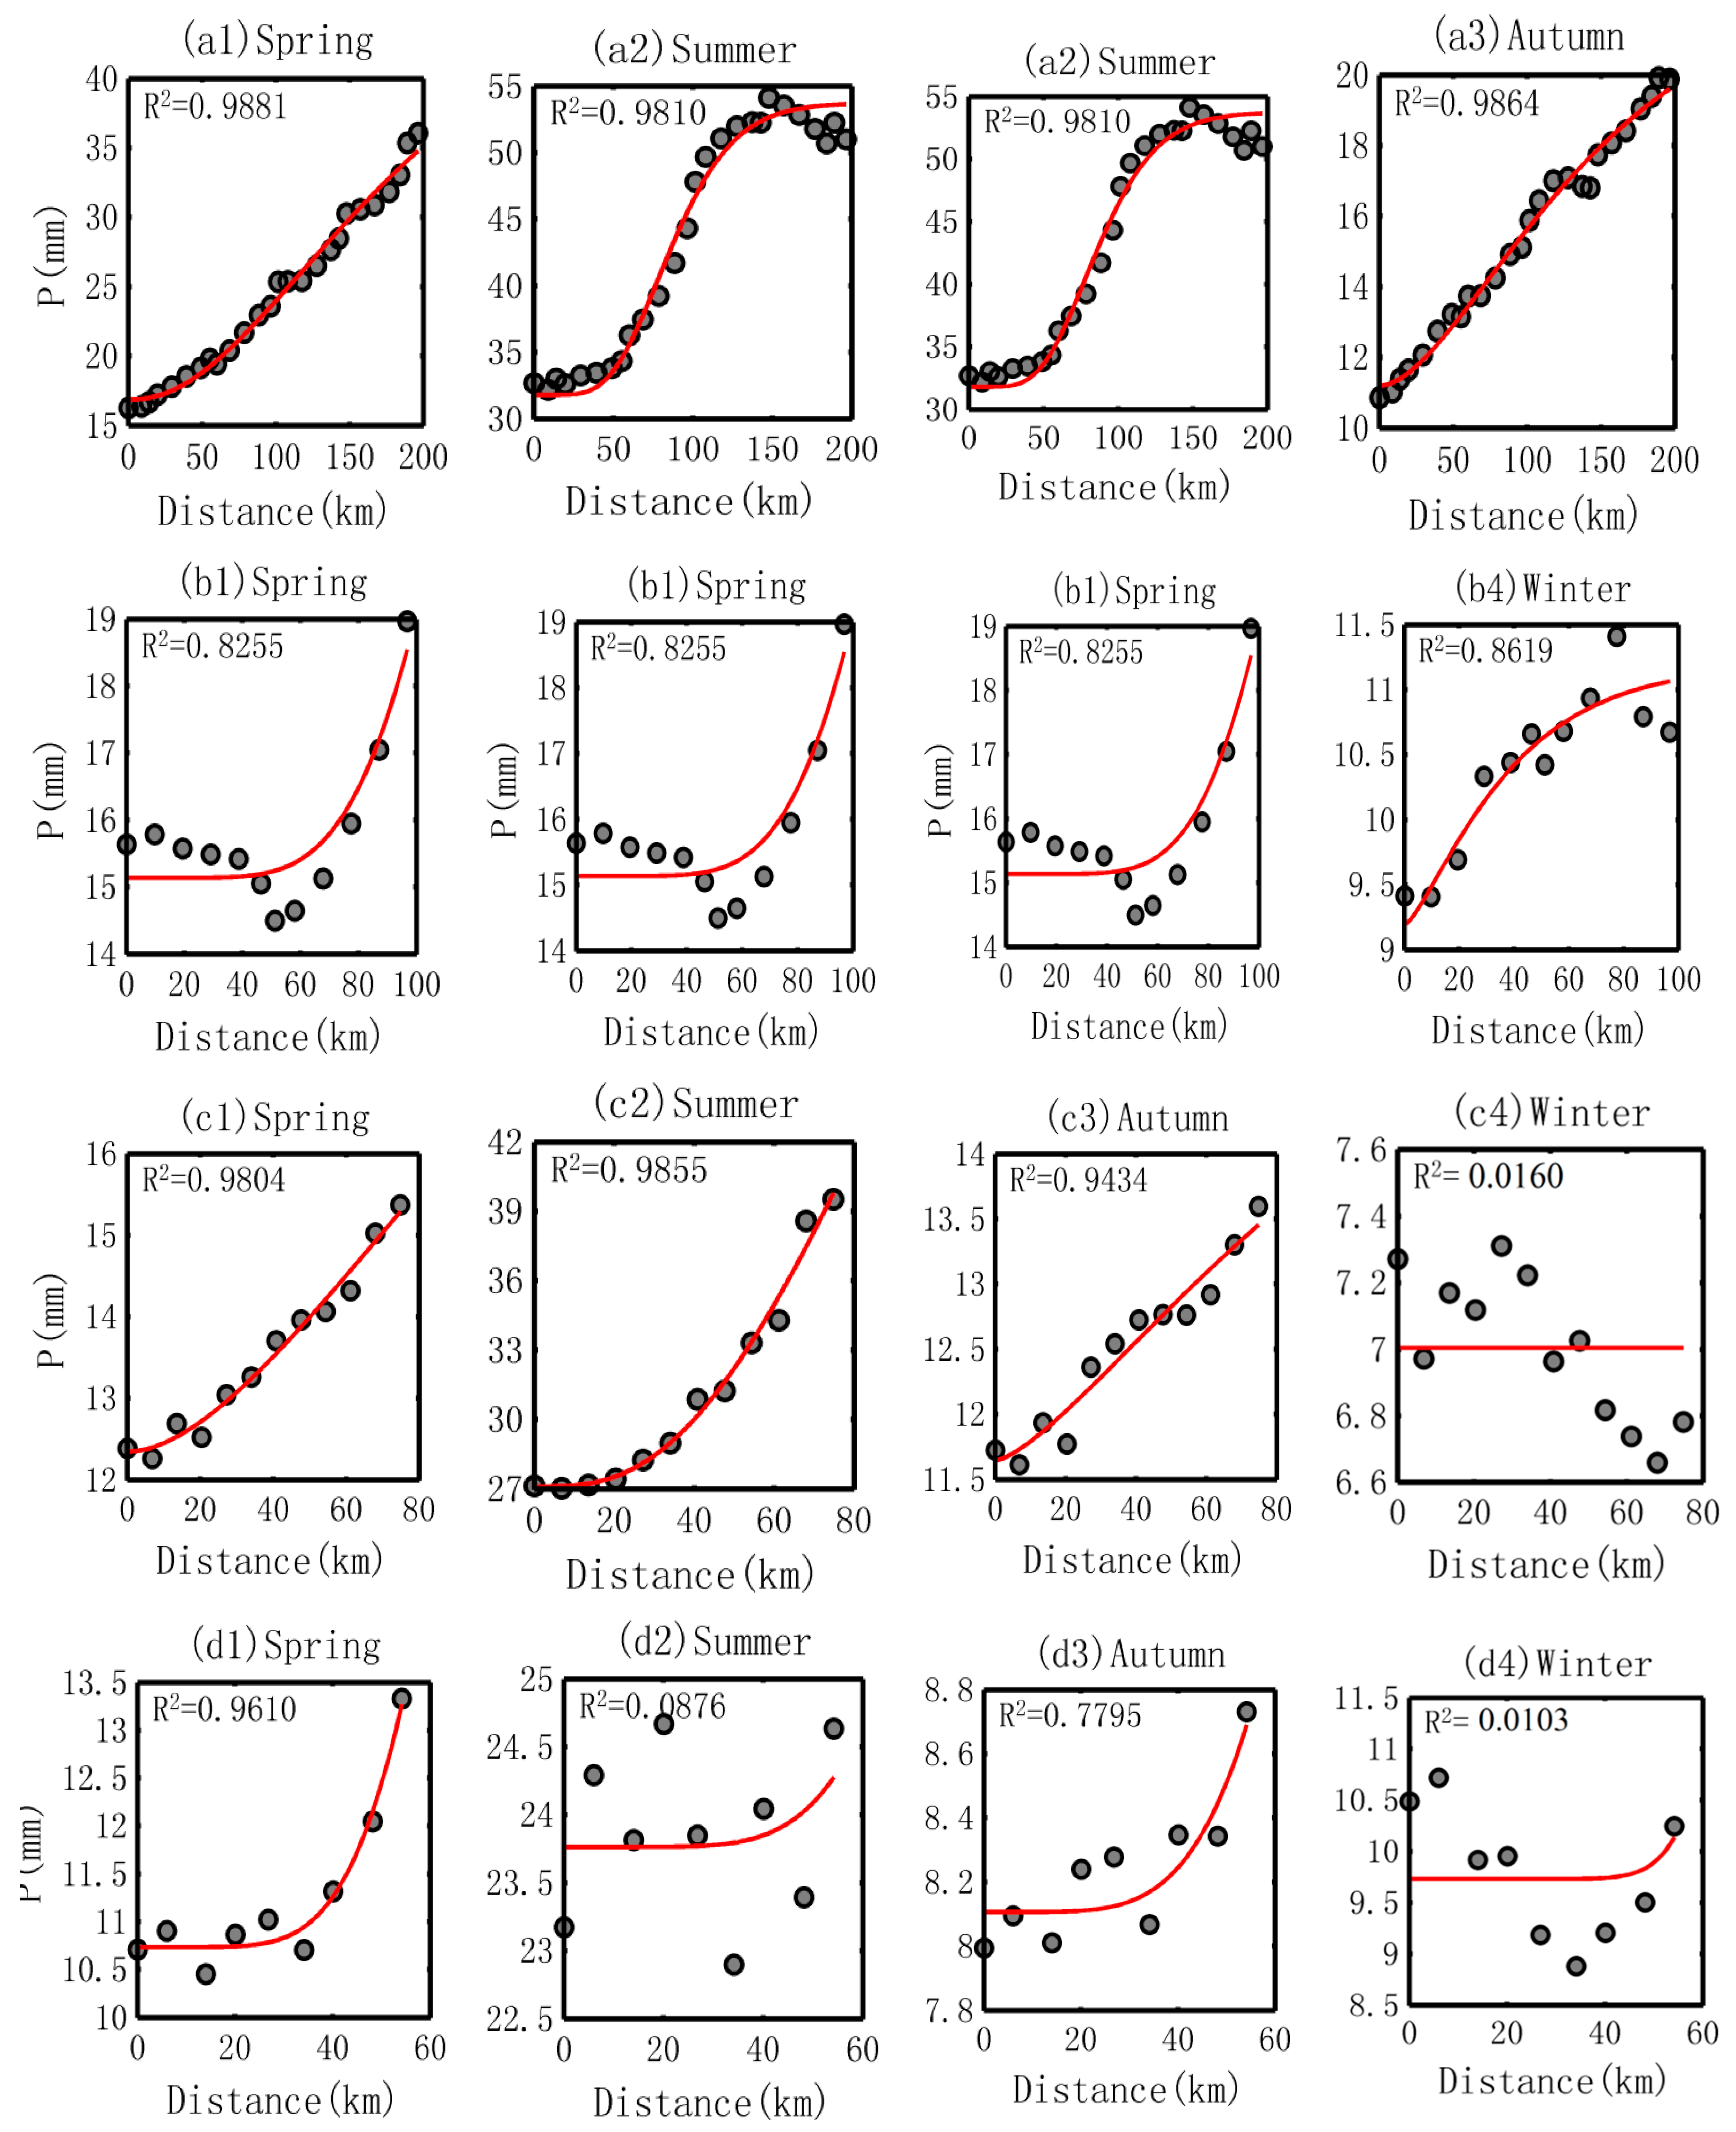
4.1.5. Performance of the Model at Seasonal Scale

The performance of the model at seasonal scale was also analyzed. The first problem confronted is that the result does not converge when solved by nonlinear fitting using MATLAB (MathWorks, Natick, MA, USA). Here, the results are based on least square method and the results are shown by Figure 7. Generally, the model seems to perform well with several exceptions, including the winter of Kuerle and Hetian Oases, and the summer of Hetian Oasis. The reason can be attributed to the transportation of water vapor. As discussed above, the wind blowing from the oasis to the desert would decrease the cold-wet effect of the oasis substantially [49].
However, the second problem is that the solutions of the model based on the least square method are substantially affected by the upper boundary conditions. Two examples based on different upper boundary conditions are given to illustrate this problem. As shown in Table 2, the initial precipitation P0 is not affected by the upper boundary conditions. The other three parameters, however, are influenced significantly. For example, the difference of the parameter C estimated for the summer of the Kuerle Oasis can be up to 140 mm, although the R2 is 0.99 for both solutions. Here, the failure of the model may be resulted from the resolution of the data or the more complex water vapor transportation. Hence, further studies should be carried out to explore the simulation of the season precipitation evolution from desert to the oasis.

4.2. Simulated Results

Based on the performance of the model at different scales, the parameters are reasonable at annual scale. The evolution of precipitation with the increase of oasis width was calculated by Equation (17) using the parameters given in Table 1. The results are shown in Figure 8, from which the basic patterns of precipitation evolution are revealed and the current stage of these oases are also obtained. More details on the two aspects are as follows.

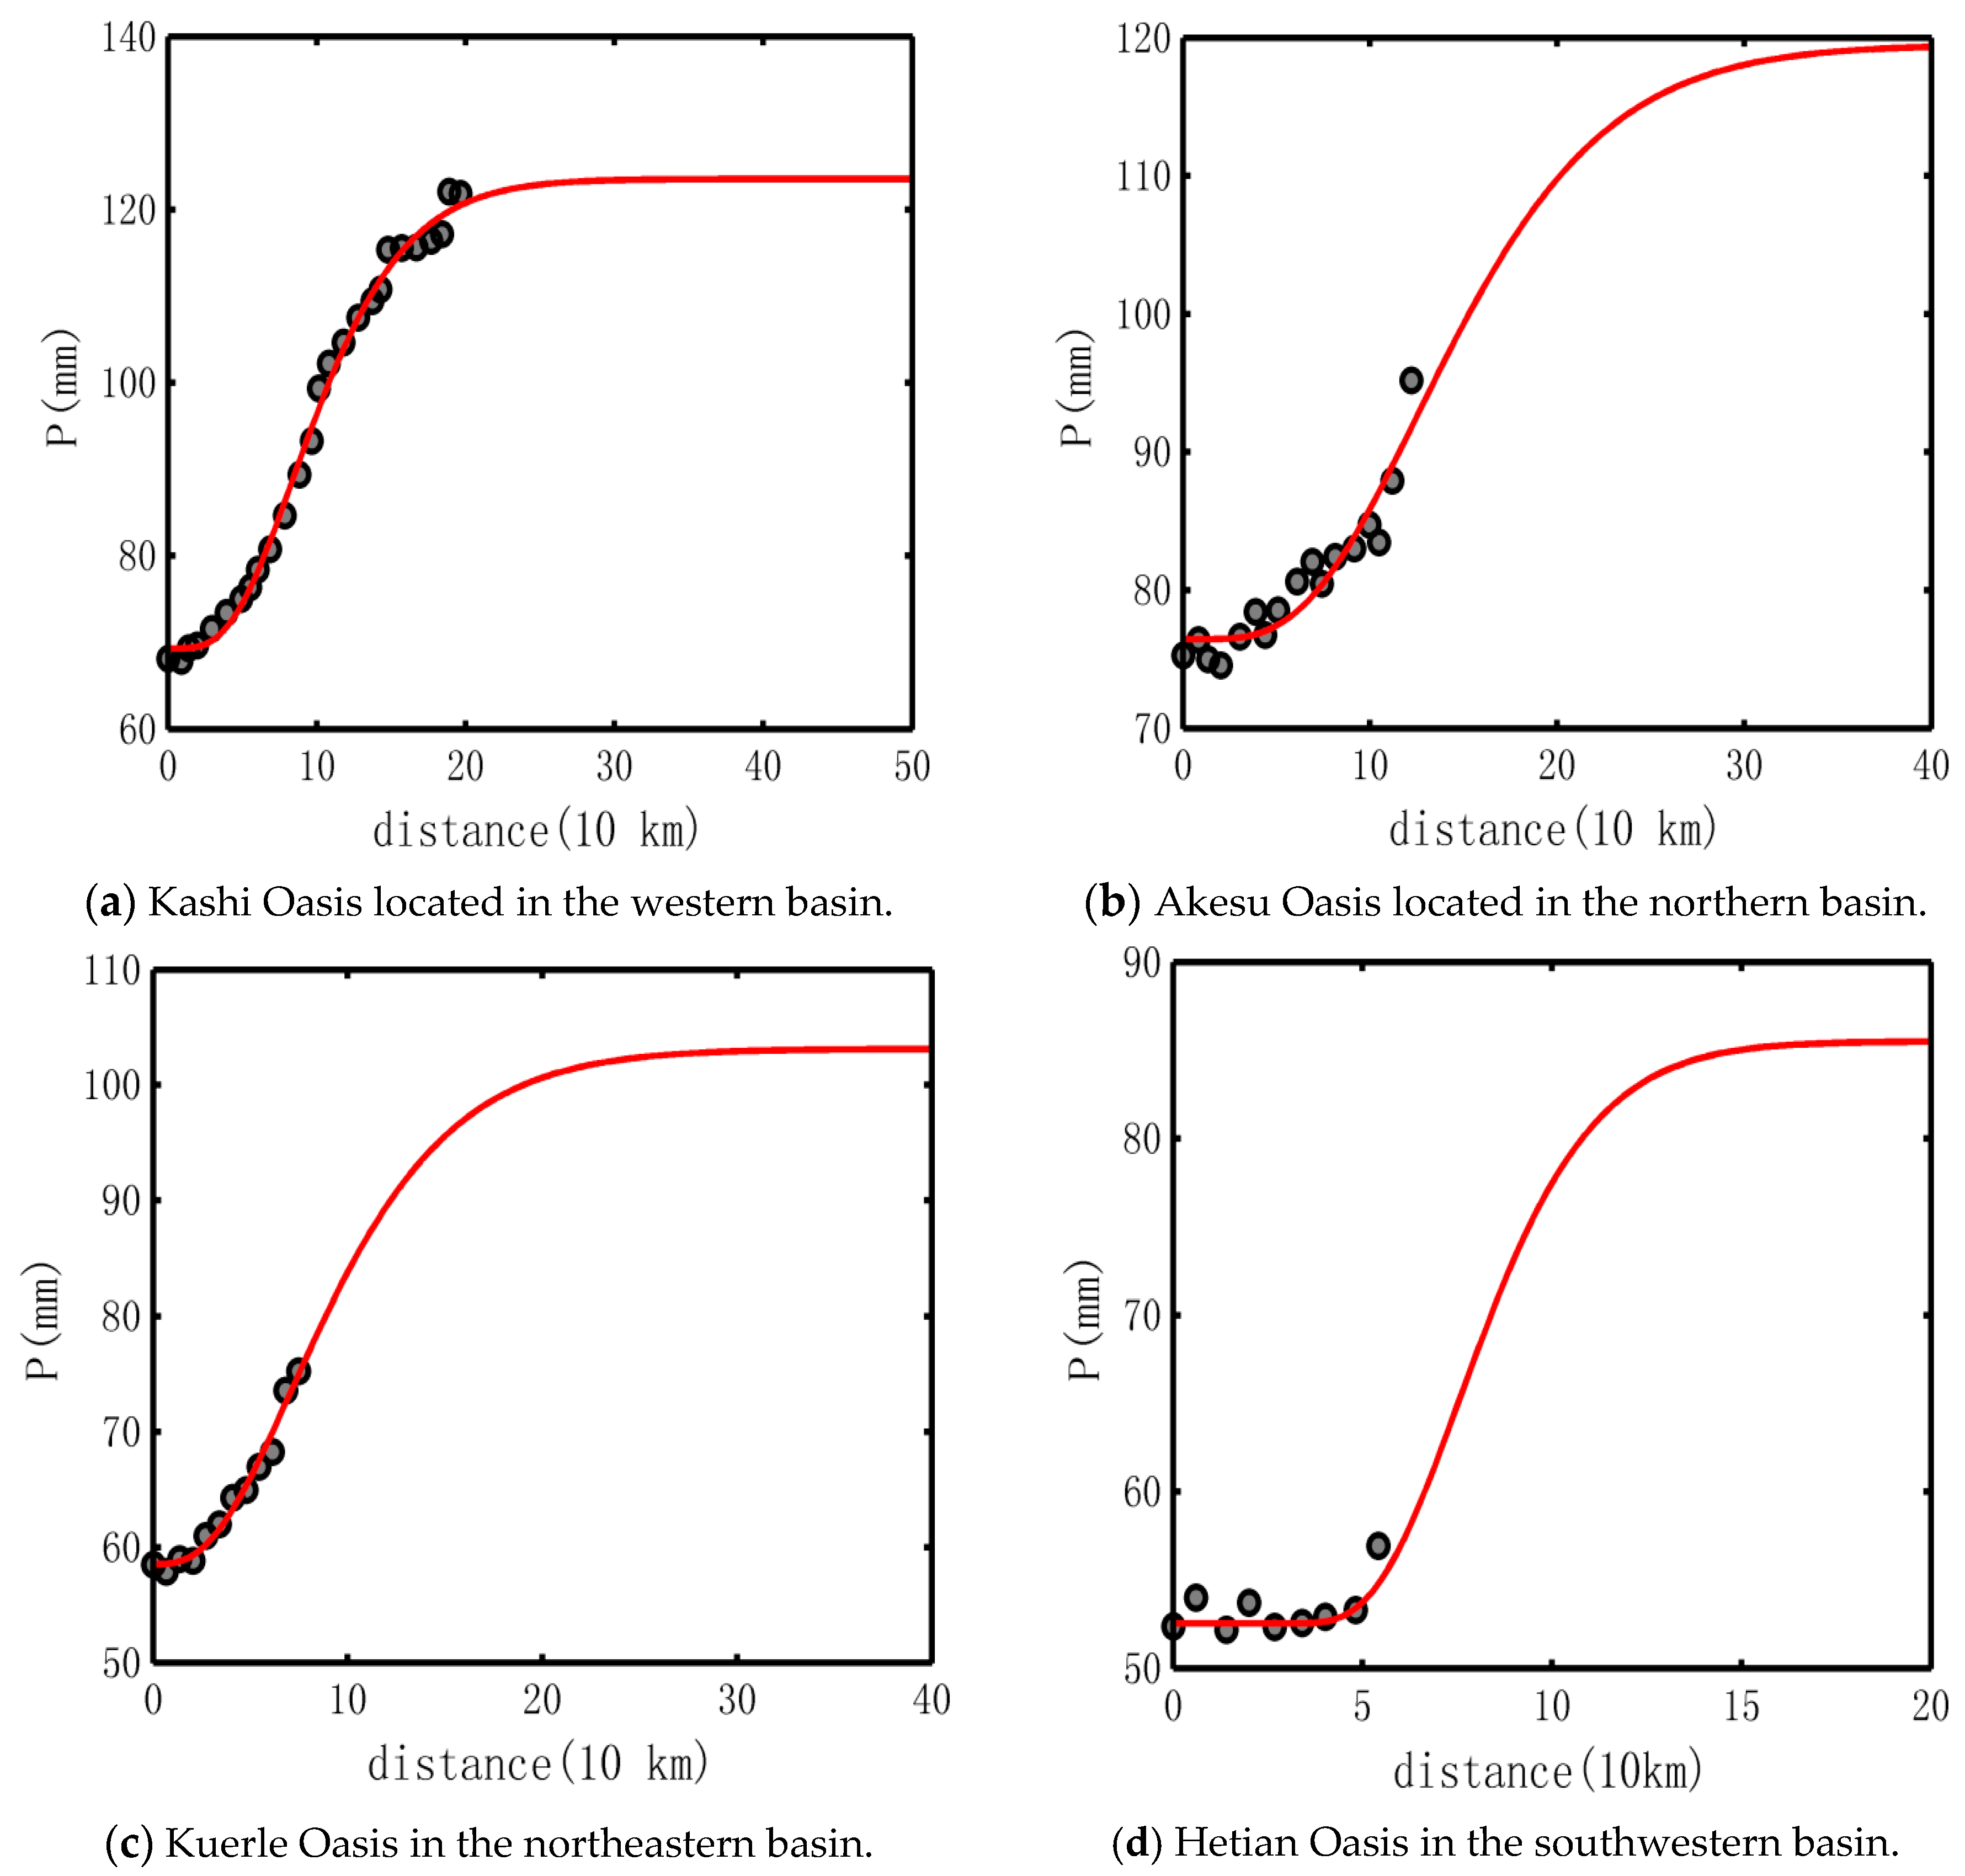
4.2.1. Basic Patterns of Precipitation Evolution

According to the simulated results (Figure 8), it could be found that the basic patterns of precipitation evolution exhibit four stages: a small increase at first, then a much faster increase after a threshold of oasis width, followed by a small increase rate again when the oasis width reaches a relatively large width, and finally the increase rate decreases to close to zero when the oasis is wide enough. The threshold values of the four stages are also obtained (Table 3).
  • The first stage: Small increase rate. The oasis width of the first stage (small increase rate) is about 30–50 km. This means that, if the oasis width is less than the threshold value, the promotion of oasis’ cold-wet effect on local precipitation is not substantial. More specifically, this width is about 40, 50, 40 and 55 km for Kashi, Akesu, Kuerle and Hetian Oases, respectively.
  • The second stage: Large increase rate. The second threshold value is about 150–185 km. In this period, the increase rate of precipitation is much larger than before. Generally, precipitation exhibits a linear trend with the oasis width increase. Hence, the increase rate of precipitation is approximately constant. As shown in Table 3, the increase rate varies substantially in the four oases, with the value of 3.32, 2.86, 1.76 and 0.65 mm/10 km corresponding to Kashi Oasis, Akesu Oasis, Kuerle Oasis and Hetian Oasis, respectively.
  • The third stage: Small increase rate again. The threshold value for the third stage is about 200–300 km. Two oases, Kashi and Hetian, display smaller value of about 200 km. The other two oases, Akesu and Kuerle, display larger values of 265 and 300, respectively. This means that Kashi and Hetian Oases would reach the maximum promotion on local precipitation easier than the other oases because of the smaller threshold value. However, the opposite direction between the cold effect of oasis and water vapor transportation lead to Hetian Oasis experiencing a longer first stage than the other three oases, as well as smaller precipitation locally.
  • The fourth stage: Stable status. When the oasis width is larger than the threshold value of the third stage, the precipitation evolution reaches the fourth stage, which is almost constant.

4.2.2. Current Stages of Different Oases

The widths of Kashi, Akesu, Kuerle and HetianOases are 200 km, 135 km, 80 km and 60 km, respectively, as shown in Figure 5. By contrast with Figure 8, it can be obtained that the four oases belong to different stages that are manifested by the following aspects.
  • Kashi Oasis. Kashi Oasis is at the beginning of the fourth stage, in which the precipitation is stable with the oasis width increase. This implies that the annual precipitation will be the same as the maximum value (about 120 mm/year) if the oasis expands towards the desert.
  • Akesu Oasis. The width of the Akesu Oasis is about 135 km. Hence, the evolution of precipitation in Akesu Oasis is at the first half of the second stage currently. The second stage means largest increase rate of precipitation with oasis width increase but the middle level precipitation amount. Hence, if the oasis expands towards the desert, the precipitation would increase substantially. However, the total increment of precipitation should be less than the increment precipitation in Kashi Oasis.
  • Kuerle Oasis. As shown in Figure 8 and Table 3, the current width of the oasis is at the first half of the second stage. Hence, it would exhibit similar characteristics to AKesu Oasis.
  • Hetian Oasis. Different from the other three oases, the Hetian Oasis is at the end of the first stage. With the oasis width increase, the precipitation would increase at a slope of approximately 0.65 mm/km. That means the total increment of precipitation is the least if the oasis expanded toward desert in Hetian Oasis because of the much smaller initial condition of precipitation.

5. Discussions

5.1. The Simulated Results for Desertification Prevention

In the Tarim Basin, affected by the substantial increase of local human activities, the destruction of oasis environments is increasing, resulting from the irrational reclamation of land and overuse of natural resources [62]. In fact, the irrigated oasis area has exceeded about 33.6% of the maximum carrying capacity of local precipitation [52]. The increase of the arable land is at the expense of the destruction of vegetation and shrinkage of the water area [53,54]. Even worse, the expansion of artificial oases has led to the degradation of natural oases and the oasis–desert ecotone, which may threaten the security and sustainable development of oases [48]. These problems require understanding the interaction between the oasis and local hydrological cycle, and to selecting the more appropriate areas for desertification prevention and layout of oasis expansion.
According to the simulated results shown in Figure 8 and the current stage of the oasis precipitation, it can be concluded that Kashi Oasis is at the beginning of the fourth stage, which implies that the increment of precipitation would be about 120 mm/year. The increment of precipitation in Akesu and Heian Oasis are the middle level because both oases are at the first half of the second stage. The least promotion would appear in the southwestern basin of Hetian Oasis because it is at the end of the first stage. Therefore, Kashi Oasis of the western basin is the most appropriate area for desertification prevention, while the southwestern basin, i.e., Hetian Oasis, presents a greater challenge.

5.2. The Model for Multisource Data Fusion

The considerable challenge to the data assimilation is the resolution [22]. In this study, the spatial resolution of the assimilated data is 0.1 degrees [23,24], and many researchers have used this dataset to analyze the regional hydrological processes, such as the impact of lake effects on the temporal and spatial distribution of precipitation in the Nam Co basin of the Tibetan Plateau [25], evaporation from the lake [26] and the impact of climatic factors on permafrost in the Tibetan Plateau [27]. The good spatial continuity of the dataset is reflected by gradual changes of the local hydrological processes.
However, the performance of the dataset is still not clear in the desert areas. In this study, the dataset agrees well with simulated results of the model based on information entropy, which is not only demonstrated by the good performance of the model, but also reflected by the good spatial continuity of annual precipitation evolution in the desert–oasis system. Furthermore, the poor performance of the model without the calibration is also an indicator of the different interaction between the oasis and water vapor transportation in the Hetian Oasis. In fact, opposite direction between the water vapor transportation and cold effect of the oasis leads to water vapor from local evapotranspiration accumulating near the desert boundary, where the higher temperature reduces the promotion of oasis on local precipitation substantially [49]. Hence, the model is a useful tool to test the spatial continuity of the dataset obtained from merging multisource data, especially in those areas with extreme natural conditions, for example, desert areas.

6. Conclusions

Based on the established model, parameter inversion, forward simulation, and the discussions on the potential applications of the method, the conclusions are as follows.
  • The model describing precipitation evolution from desert to oasis is based on information entropy theory: the evolution of precipitation is considered as a linear transformed cumulative distribution function, and the probability density function is obtained by solving the Lagrange conditioned extreme value with the objective function of maximum information entropy. The constraints are the constant arithmetic mean and geometric mean of precipitation evolution from desert to oasis when the oasis is wide enough. The general form of the model is a linear transformed cumulative distribution function of a gamma distribution.
  • The model performs well when the oasis is wide enough. The R2 between the simulated result and the dataset is 0.99, 0.93 and 0.97 for the Kashi Oasis, Akesu Oasis and Kuerle Oasis, respectively. In the Hetian Oasis, however, the model performs poorly with the R2 of 0.47. The reason is mainly the opposite direction between the oasis cold effect and the water vapor transportation that results in a buffer zone in the first several tens of kilometers. After removing the buffer zone, the model shows a good accuracy with the R2 of 0.87. However, the model fails to describe the seasonal precipitation evolution because of the non-convergence problem solved by nonlinear fitting and the influence of upper boundary condition solved by the least square method.
  • The simulated results indicate that the evolution of annual precipitation from desert to oasis includes four main stages: slow increase first, then fast increase, followed by a slow increase again and finally a stable stage. The threshold value of the first stage is 30–50 km, implying the promotion of local precipitation is very small if the width of the oasis is less than this value. The second stage can be approximated linearly, with the threshold value of 155–185 km and the slope of 3.32, 2.86, 1.76 and 0.65 mm/10 km for the Kashi Oasis, Akesu Oasis, Kuerle Oasis and Hetian Oasis, respectively. The upper boundary of the third stage is about 220–300 km, after which the precipitation evolution is almost constant.
  • Currently, the four main oases in the Tarim basin are at different stages. The Kashi Oasis has reached the fourth stage, the Akesu and Kuerle Oases are at the first half of the second stage, and the Hetian Oasis is at the end of the first stage. These current stages reflect different local hydrological effect when prevent desertification in the four main oases: maximum promotion on precipitation in the Kashi Oasis, middle promotion in the Akesu Oasis and Kuerle Oasis, and the least promotion in the Hetian Oasis.
Therefore, the theory of the model and simulated results would provide a deeper insight from the perspective of informatics into understanding the precipitation evolution from desert to oasis, which is not only helpful in preventing desertification but also helpful in merging multisource data in the extreme drought desert areas.

Author Contributions

X.Z. as the first author was responsible for establishing the model, collecting the data to calibrate the model, plotting the figures and writing of the main body of the manuscript. Z.N., the second author and corresponding author, searched the background of the hydrological effect of oasis and proposed the idea of this study, and helped to revise this manuscript. W.L., the third author, contributed to the data analysis and manuscript approving. All authors have read and approved the final manuscript.

Funding

The research was funded by National Natural Science Foundation of China (grant number 41701558), Science and Technology Funding of Water Resources Department of Guizhou Province (grant number KT201707), Science and Technology Funding of Guizhou Province (grant number LH [2017]7290) and the open funding of Guizhou Provincial Key Laboratory of Public Big Data (grant number NO2017BDKFJJ021).

Acknowledgments

The forcing dataset used in this study was developed by Data Assimilation and Modeling Center for Tibetan Multi-spheres, Institute of Tibetan Plateau Research, Chinese Academy of Sciences.

Conflicts of Interest

The authors declare no conflict of interest.

References

  1. Taha, H.; Akbari, H.; Rosenfeld, A. Heat island and oasis effects of vegetative canopies: Micro-meteorological field-measurements. Theor. Appl. Climatol. 1991, 44, 123–138. [Google Scholar] [CrossRef] [Green Version]
  2. Kai, K.; Matsuda, M.; Sato, R. Oasis Effect Observed at Zhangye Oasis in the Hexi Corridor, China. J. Meteorol. Soc. Jpn. 1997, 75, 1171–1178. [Google Scholar] [CrossRef]
  3. Chu, P.C.; Lu, S.; Chen, Y. A numerical modeling study on desert oasis self-supporting mechanisms. J. Hydrol. 2005, 312, 256–276. [Google Scholar] [CrossRef] [Green Version]
  4. Feng, Q.; Si, J.; Zhang, Y.; Yao, J.; Liu, W.; Su, Y.H. Microclimatic characteristics of the Heihe oasis in the hyperarid zone of China. J. Geogr. Sci. 2006, 16, 34–44. [Google Scholar] [CrossRef]
  5. Potchter, O.; Goldman, D.; Kadish, D.; Iluz, D. The oasis effect in an extremely hot and arid climate: The case of southern Israel. J. Arid. Environ. 2008, 72, 1721–1733. [Google Scholar] [CrossRef]
  6. Li, X.M.; Yang, J.S.; Liu, M.X.; Liu, G.M.; Yu, M. Spatiotemporal changes of soil salinity in arid areas of south Xinjiang using electromagnetic induction. J. Integr. Agr. 2012, 11, 1365–1376. [Google Scholar] [CrossRef]
  7. Hao, X.; Li, W. Oasis cold island effect and its influence on air temperature: A case study of Tarim Basin, Northwest China. J. Arid. Land 2016, 8, 172–183. [Google Scholar] [CrossRef]
  8. Li, X.; Yang, K.; Zhou, Y. Progress in the study of oasis-desert interactions. Agric. Forest. Meteorol. 2016, 230–231, 1–7. [Google Scholar] [CrossRef]
  9. Li, X.; Cheng, G.D.; Ge, Y.M.; Li, H.Y.; Han, F.; Hu, X.L.; Tian, W.; Tian, Y.; Pan, X.D.; Nian, Y.Y. Hydrological Cycle in the Heihe River Basin and Its Implication for Water Resource Management in Endorheic Basins. J. Geophys. Res. Atmos. 2018, 123, 890–914. [Google Scholar] [CrossRef]
  10. Zhang, H.; Wu, J.W.; Zheng, Q.H.; Yu, Y.Y. A preliminary study of oasis evolution in the Tarim Basin, Xinjiang, China. J. Arid. Environ. 2003, 55, 545–553. [Google Scholar]
  11. Qiu, G.Y.; Li, H.Y.; Zhang, Q.T.; Chen, W.; Liang, X.J.; Li, X.Z. Effects of evapotranspiration on mitigation of urban temperature by vegetation and urban agriculture. J. Integr. Agric. 2013, 12, 1307–1315. [Google Scholar] [CrossRef]
  12. Jin, X.M.; Hu, G.C.; Li, W.M. Hysteresis effect of runoff of the Heihe River on vegetation cover in the Ejina Oasis in Northwestern China. Earth Sci. Front. 2008, 15, 198–203. [Google Scholar] [CrossRef]
  13. Kong, Y.; Pang, Z.; Froehlich, K. Quantifying recycled moisture fraction in precipitation of an arid region using deuterium excess. Tellus B 2013, 65, 19251. [Google Scholar] [CrossRef]
  14. Gat, J.R.; Klein, B.; Kushnir, Y.; Roether, W.; Wernli, H.; Yam, R.; Shemesh, A. Isotope composition of air moisture over the Mediterranean Sea: An index of the air-sea interaction pattern. Tellus B 2003, 55, 953–965. [Google Scholar] [CrossRef]
  15. Worden, J.; Noone, D.; Bowman, K.; Beer, R.; Eldering, A.; Fisher, B.; Gunson, M.; Goldman, A.; Herman, R.; Kulawik, S.S. Importance of rain evaporation and continental convection in the tropical water cycle. Nature 2007, 445, 528–532. [Google Scholar] [CrossRef] [PubMed]
  16. Ueta, A.; Sugimoto, A.; Iijima, Y.; Yabuki, H.; Maximov, T.C. Contribution of transpiration to the atmospheric moisture in eastern Siberia estimated with isotopic composition of water vapor. Ecohydrology 2014, 7, 197–208. [Google Scholar] [CrossRef]
  17. Vallet-Coulomb, C.; Gasse, F.; Sonzogni, C. Seasonal evolution of the isotopic composition of atmospheric water vapour above a tropical lake: Deuterium excess and implication for water recycling. Geochim. Cosmochim. Acta 2008, 72, 4661–4674. [Google Scholar] [CrossRef]
  18. Li, X.; Liu, S.M.; Xiao, Q.; Ma, M.G.; Jin, R.; Che, T.; Wang, W.Z.; Hu, X.L.; Xu, Z.W.; Wen, J.G. A multiscale dataset for understanding complex eco-hydrological processes in a heterogeneous oasis system. Sci. Data 2017, 4, 170083. [Google Scholar] [CrossRef] [PubMed] [Green Version]
  19. Robinson, A.R.; Leslie, W.G. Estimation and prediction of oceanic eddy fields. Prog. Oceanogr. 1985, 14, 385–510. [Google Scholar] [CrossRef]
  20. Moore, A.M.; Cooper, N.S.; Anderson, D.L.T. Initialization and data assimilation in models of the Indian Ocean. J. Phys. Oceanogr. 1987, 17, 1965–1977. [Google Scholar] [CrossRef]
  21. Balsamo, G.; Mahfouf, J.F.; Belair, S. A land data assimilation system for soil moisture and temperature: An information content study. J. Hydrometeorol. 2007, 8, 1225–1242. [Google Scholar] [CrossRef]
  22. Moore, A.M. Some Challenges and Advances in Regional Ocean Data Assimilation. Seminar on Data Assimilation for Atmosphere and Ocean; European Centre for Medium-Range Weather Forecasts: Reading, UK, 2011. [Google Scholar]
  23. Yang, K.; He, J.; Tang, W.; Qin, J.; Cheng, C.C.K. On downward shortwave and long wave radiations over high altitude regions: Observation and modeling in the Tibetan Plateau. Agric. For. Meteorol. 2010, 150, 38–46. [Google Scholar] [CrossRef]
  24. Chen, Y.; Yang, K.; He, J.; Qin, J.; Shi, J.C.; Du, J.Y.; He, Q. Improving land surface temperature modeling for dry land of China. J. Geophys. Res. Atmos. 2011, 116, 132–147. [Google Scholar] [CrossRef]
  25. Dai, Y. The Impact of Lake Effects on the Temporal and Spatial Distribution of Precipitation at Nam Co, on the Tibetan Plateau; AGU: Washington, DC, USA, 2015. [Google Scholar]
  26. Ma, N.; Szilagyi, J.; Niu, G.Y.; Zhang, Y.S.; Zhang, T.; Wang, B.B.; Wu, Y.H. Evaporation variability of Nam Co Lake in the Tibetan Plateau and its role in recent rapid lake expansion. J. Hydrol. 2016, 537, 27–35. [Google Scholar] [CrossRef]
  27. Gao, S.; Wu, Q.; Zhang, Z.; Xu, X. Impact of climatic factors on permafrost of the Qinghai-Xizang Plateau in the time-frequency domain. Quatern. Int. 2015, 374, 110–117. [Google Scholar] [CrossRef]
  28. Singh, V.P. The use of entropy in hydrology and water resources. J. Hydrol. Process 1997, 11, 587–626. [Google Scholar] [CrossRef]
  29. Avseth, P.; Mukerji, T.; Mavko, G. Quantitative Seismic Interpretation. Episodes 2005, 3, 236–237. [Google Scholar]
  30. Ebrahimi, N. Stochastic properties of a cumulative damage threshold crossing model. J. Appl. Probab. 1999, 36, 720–732. [Google Scholar] [CrossRef]
  31. Crutchfield, J.; Feldman, D.P. Regularities unseen, randomness observed: Levels of entropy convergence. Chaos 2003, 13, 25–54. [Google Scholar] [CrossRef] [PubMed]
  32. Chapman, T.G. Entropy as a measure of hydrologic data uncertainty and model performance. J. Hydrol. 1986, 85, 111–126. [Google Scholar] [CrossRef]
  33. Maruyama, T.; Kawachi, T.; Singh, V.P. Entropy-based assessment and clustering of potential water resources availability. J. Hydrol. 2005, 309, 104–113. [Google Scholar] [CrossRef]
  34. Brunsell, N.A. A multiscale information theory approach to assess spatial-temporal variability of daily precipitation. J. Hydrol. 2010, 385, 165–172. [Google Scholar] [CrossRef]
  35. Hasan, M.M.; Dunn, P.K. Entropy consistency in rainfall distribution and potential water resource availability in Australia. J. Hydrol. Process. 2011, 25, 2613–2622. [Google Scholar] [CrossRef]
  36. Yang, Y.; Burn, D.H. An entropy approach to data collection network design. J. Hydrol. 1994, 157, 307–324. [Google Scholar] [CrossRef]
  37. Yoo, C.; Jung, K.; Lee, J. Evaluation of rain gauge network using entropy theory: Comparison of mixed and continuous distribution function applications. J. Hydrol. Eng. 2008, 13, 226–235. [Google Scholar] [CrossRef]
  38. Singh, V.P. Entropy theory for derivation of infiltration equations. Water Resour. Res. 2010, 46, W03527. [Google Scholar] [CrossRef]
  39. Singh, V.P. Entropy theory for movement of moisture in soils. Water Resour. Res. 2010, 46, W03516. [Google Scholar] [CrossRef]
  40. Zhou, X.; Lei, W.; Ma, J. Entropy Base Estimation of Moisture Content of the Top 10-m Unsaturated Soil for the Badain Jaran Desert in Northwestern China. Entropy 2016, 18, 323. [Google Scholar] [CrossRef]
  41. Zanette, D. Generalized Kolmogorov entropy in the dynamics of the multifractal generation. Phys. A Stat. Mech. Appl. 1996, 223, 87–98. [Google Scholar] [CrossRef]
  42. Guariglia, E. Entropy and Fractal Antennas. Entropy 2016, 18, 84. [Google Scholar] [CrossRef]
  43. Peng, Y.; Zhou, J.G.; Burrows, R. Modelling the free surface flow in rectangular shallow basins by lattice Boltzmann method. J. Hydraul. Eng. 2011, 137, 1680–1685. [Google Scholar] [CrossRef]
  44. Peng, Y.; Zhou, J.G.; Burrows, R. Modelling solute transport in shallow water with the lattice Boltzmann method. Comput. Fluids 2011, 50, 181–188. [Google Scholar] [CrossRef]
  45. Baumer, C. Southern Silk Road: In the Footsteps of Sir Aurel Stein and Sven Hedin; Orchid Press: Krung Thep Maha Nakhon, Thailand, 2001. [Google Scholar]
  46. Liu, J.Q.; Qin, X.G. Evolution of the environmental framework and oasis in the Tarim Basin. J. Quat. Sci. 2005, 25, 533–539. [Google Scholar]
  47. Zhu, Z.D.; Wu, Z.; Liu, S.; Di, X.M. An Outline of Chinese Deserts; Science Press: Beijing, China, 1980; Volume 107. (In Chinese) [Google Scholar]
  48. Ren, X.; Mu, G.J.; Xu, L.S.; Lin, Y.C.; Zhao, X. Characteristics of artificial oasis expansion in south Tarim Basin from 2000 to 2013. Arid Land Res. 2015, 38, 1022–1030. (In Chinese) [Google Scholar]
  49. Zhou, X.; Lei, W.J. Hydrological interaction between oases and water vapor transportation in the Tarim Basin, northwestern China. Sci. Rep. 2018, 8, 13431. [Google Scholar] [CrossRef] [PubMed]
  50. Li, B.; Chen, Y.; Shi, X.; Chen, Z.; Li, W. Temperature and precipitation changes in different environments in the arid region of northwest China. Theor. Appl. Climatol. 2013, 112, 589–596. [Google Scholar] [CrossRef]
  51. Halik, W.; Mamat, A.; Dang, J.H.; Deng, B.S.H.; Tiyip, T. Suitability analysis of human settlement environment within the Tarim Basin in Northwestern China. Quatern. Int. 2013, 311, 175–180. [Google Scholar] [CrossRef]
  52. Zhao, X.F.; Xu, H.L.; Wang, M.; Zhang, P.; Ling, H. Overloading analysis of irrigation area in basins of Tarim River in different years. Trans. CSAE 2015, 31, 77–81. (In Chinese) [Google Scholar]
  53. Yan, Z.L.; Huang, Q.; Chang, J.X.; Wang, Y. Analysis and dynamic monitoring of land use in the main stream of Tarim river valley using remote sensing. Trans. CSAE 2008, 24, 119–123. (In Chinese) [Google Scholar]
  54. Zhang, J.S.; Yan, Z.L.; Wang, X.G.; Huang, Q.A.; Gao, F. Remote sensing analysis of spatial-temporal changes of desertification land in Lower Reaches of Tarim River. Trans. CSAE 2009, 25, 161–165. (In Chinese) [Google Scholar]
  55. Yang, K. User’s Guide for China Meteorological Forcing Dataset. 2010. Available online: http://dam.itpcas.ac.cn/data/User_Guide_for_China_Meteorological_Forcing_Dataset.htm (accessed on 14 September 2018).
  56. Shannon, C.E. A mathematical theory of communication. Bell Syst. Technol. J. 1948, 27, 379–423. [Google Scholar] [CrossRef]
  57. Ben-Naim, A. Entropy, Shannon’s Measure of Information and Boltzmann’s H-Theorem. Entropy 2017, 19, 48. [Google Scholar] [CrossRef]
  58. Conrad, K. Probability distributions and maximum entropy. Entropy 2004, 6, 10. [Google Scholar]
  59. Shi, Y.F. Discussion on the present climate change from warm-dry to warm-wet in northwest China. J. Quat. Sci. 2003, 23, 152–164. (In Chinese) [Google Scholar]
  60. Zhang, J.C. Monsoon and Precipitation in China; China Meteorological Press: Beijing, China, 2010; Volume 16. (In Chinese)
  61. Shen, L.L.; He, J.H.; Zhou, X.Y.; Chen, L.; Zhu, C.W. The regional variabilities of the summer rainfall in China and its relation with anomalous moisture transport during the recent 50 years. Acta Meteorol. Sin. 2010, 68, 918–931. [Google Scholar]
  62. Lei, Z.D.; Hu, H.P.; Yang, S.X.; Tian, F.Q. Analysis on water consumption in oases of the Tarim Basin. J. Hydraul. Eng. 2006, 37, 1470–1475. [Google Scholar]
Figure 1. Spatial distribution of oasis in Tarim Basin, obtained from Google Earth. The linkage for Google’s permissions is: https://www.google.ca/permissions/geoguidelines.
Water 10 01258 g001
Figure 2. Spatial distribution of annual precipitation in Tarim Basin based on The China Meteorological Forcing Dataset.
Water 10 01258 g002
Figure 3. Illustration of precipitation evolution from desert to inner oasis. Assuming the initial precipitation P0 at the boundary between desert and oasis is 50 mm/year and the zooming constant C is 50, the precipitation evolution is shown with different shape factor and different scale factor.
Water 10 01258 g003
Figure 4. Selected routes of precipitation transition from the desert to oasis in different location of the Tarim Basin, obtained from Google Earth. The permission of Google to use Google Earth Periodicals is given at: https://www.google.ca/permissions/geoguidelines.
Water 10 01258 g004
Figure 5. Performance of the model simulating precipitation from desert to oasis in different areas of Tarim Basin.
Water 10 01258 g005
Figure 6. Spatial distributions of water vapor in Tarim Basin and the calibrated model in Hetian.
Water 10 01258 g006
Figure 7. Performance of the information entropy based model at seasonal scale: (a) Kashi Oasis located in the western basin; (b) Akesu Oasis located in the northern basin; (c) Kuerle Oasis in the northeast basin; and (d) Hetian Oasis in the southwestern basin.
Water 10 01258 g007
Figure 8. The simulated precipitation evolution from desert to oasis with the oasis width increase.
Water 10 01258 g008
Table 1. Performance of the model and the parameters inversion for precipitation evolution from desert to oasis in different locations of the Tarim Basin.
Main OasesInitial Precipitation P0 (mm)Zooming Constant C (-)Shape Factor α (-)Scale Factor β (-)Correlation R2
Kashi Oasis (Western Basin)69.3154.244.642.320.99
Akesu Oasis (Northern Basin)76.4643.045.163.000.93
Kuerle Oasis (Northeastern Basis)58.5444.603.363.000.97
Hetian Oasis without calibration (Southwestern Basin)52.343.342.003.000.47
Hetian Oasis after calibration
(Southwestern Basin)
51.7632.571.025.410.87
Table 2. Comparisons on the sensitivity of parameter with different upper boundary conditions (UBC) at seasonal scale. R2 are indicated in italics and Bold.
OasisSeasonUBC: P0u = 10; Cu = 60, αu = 8, βu = 8UBC: P0u = 10; Cu = 200, αu = 20, βu = 20
P0
(mm)
C (-)α (-)β (-)R2P0
(mm)
C (-)α (-)β (-)R2
(a)
Kashi
Spring16.8730.802.478.000.9916.5357.551.7820.000.99
Summer31.8121.938.001.120.9831.8121.939.110.990.98
Autumn11.2011.591.918.000.9910.9418.181.3320.000.99
Winter8.447.395.492.550.998.447.395.492.550.99
(b)
Akesu
Spring15.1460.008.002.370.8315.2432.2220.000.650.89
Summer35.0314.360.748.000.9734.9419.320.6020.000.98
Autumn13.5960.008.002.380.8713.66200.0010.082.120.88
Winter9.192.001.422.800.869.192.001.422.800.86
(c)
Kuerle
Spring12.3511.051.918.000.9812.3328.211.6520.000.98
Summer27.1060.003.324.110.9927.03199.942.719.940.99
Autumn11.654.411.478.000.9411.645.871.3611.830.94
Winter7.010.658.008.000.027.012.9117.1516.990.01
(d)
Hetian
Spring10.7460.008.001.410.9610.76199.358.151.730.96
Summer23.7660.008.001.920.0923.76200.0020.000.540.16
Autumn8.1160.006.023.030.788.11200.005.604.520.78
Winter9.7660.008.002.330.019.73200.0020.000.570.05
Table 3. Typical patterns of precipitation evolution with the increase of oasis width in different oases of the Tarim Basin based on the simulated results.
StagesThreshold Value
and Average Slope
Kashi OasisAkesu OasisKuerle OasisHetian Oasis
(1) Small Increase RateThreshold value0–40 km0–50 km0–40 km0–55
Average slopeNot substantialNot substantialNot substantialNot substantial
(2) Large Increase RateThreshold value40–185 km50–185 km40–180 km55–155 km
Average slope3.32 mm/10 km1.76 mm/10 km2.86 mm/10 km0.65 mm/10 km
(3) Small Increase Rate AgainThreshold value185–220 km185–300 km180–265 km155–200 km
Average slopeNot substantialNot substantialNot substantialNot substantial
(4) Stable StatusThreshold value>220 km>300 km>265 km>200 km
Average slopeClose to 0Close to 0Close to 0Close to 0

