Article

Flood Vulnerability, Environmental Land Use Conflicts, and Conservation of Soil and Water: A Study in the Batatais SP Municipality, Brazil

by
Anildo Monteiro Caldas
1,
Teresa Cristina Tarlé Pissarra
2,
Renata Cristina Araújo Costa
2,
Fernando Cartaxo Rolim Neto
1,
Marcelo Zanata
3,
Roberto Da Boa Viagem Parahyba
4,
Luis Filipe Sanches Fernandes
5 and
Fernando António Leal Pacheco
6,*
1
Departamento de Tecnologia Rural, Universidade Federal Rural de Pernambuco, Rua Manuel de Medeiros, s/n-Dois Irmãos, Recife-PE 52171-900, Brazil
2
Departamento de Engenharia Rural, Universidade Estadual Paulista, Faculdade de Ciências Agrárias e Veterinárias, Via de Acesso Prof.Paulo Donato Castellane s/n, Jaboticabal-SP 14884-900, Brazil
3
Instituto Florestal, Rua do Horto, 931, São Paulo-SP 02377-000, Brazil
4
Empresa Brasileira de Pesquisa Agropecuária, Centro Nacional de Pesquisa de Solos, Unidade de Execução de Pesquisa e Desenvolvimento de Recife, Rua Antônio Falcão, 402-Boa Viagem, Recife-PE 51020-240, Brazil
5
Centro de Investigação e Tecnologias Agroambientais e Biológicas, Universidade de Trás-os-Montes e Alto Douro, Ap 1013, Vila Real 5001-801, Portugal
6
Centro de Química de Vila Real, Universidade de Trás-os-Montes e Alto Douro, Ap 1013, Vila Real 5001-801, Portugal
*
Author to whom correspondence should be addressed.
Water 2018, 10(10), 1357; https://doi.org/10.3390/w10101357
Submission received: 12 September 2018 / Revised: 27 September 2018 / Accepted: 28 September 2018 / Published: 29 September 2018

Abstract

:
In many regions across the planet, flood events are now more frequent and intense because of climate change and improper land use, resulting in risks to the population. However, the procedures to accurately determine the areas at risk in regions influenced by inadequate land uses are still inefficient. In rural watersheds, inadequate uses occur when actual uses deviate from land capability, and are termed environmental land use conflicts. To overcome the difficulty to evaluate flood vulnerability under these settings, in this study a method was developed to delineate flood vulnerability areas in a land use conflict landscape: the Batatais municipality, located in the State of São Paulo, Brazil. The method and its implementation resorted to remote sensed data, geographic information systems and geo-processing. Satellite images and their processing provided data for environmental factors such as altitude, land use, slope, and soil class in the study area. The importance of each factor for flood vulnerability was evaluated through the analytical hierarchy process (AHP). According to the results, vast areas of medium to high flood vulnerability are located in agricultural lands affected by environmental land use conflicts. In these areas, amplified flood intensities, soil erosion, crop productivity loss and stream water deterioration are expected. The coverage of Batatais SP municipality by these vulnerable areas is so extensive (60%) that preventive and recovery measures were proposed in the context of a land consolidation–water management plan aiming flood control and soil and water conservation.

1. Introduction

Natural floods occur when stream flow exceeds the river channel’s capacity, and consequently spills over the natural or artificial embankments. Floods are particularly related with extreme precipitation events and specific geomorphologic settings. When floods reach the marginal urban and rural areas they can cause significant economic damage and even human deaths [1,2].
Land uses, which are forms of land occupation and refer to the management and modification of a natural environment, influence the intensity of processes such as infiltration and runoff. The areas of greater impermeability, such as settlements, favor the runoff process and, hence, cause a substantial accumulation of rainwater in drainage channels, especially during periods of intense rainfall. The same holds for intensively tilled grounds, such as arable fields or pastures, as well as for managed woods. Therefore, the spatial distributions of urban and agricultural areas at the neighborhood of a river channel, and especially their dynamic changes over time can be the cause of frequent and often unexpected overflows with crop and property losses [3,4,5,6,7,8,9,10,11,12].
The frequency and magnitude of floods can increase where environmental land use conflicts have developed. In general, a land use conflict occurs when there are conflicting views on land use policies, such as when an increasing population creates competitive demands for the use of the land, causing a negative impact on other land uses nearby [13]. However, a different definition has been presented to describe land use conflicts in rural watersheds mostly occupied by agriculture, pastures, and forests [14,15]. In that context, an environmental land use conflict develops where the current land use differs from a natural use set up on the basis of specific morphometric parameters, namely drainage density and hill slope. In the same watersheds, conflicts were also associated with changes in permanent preservation areas, such as destruction of riparian vegetation. The consequences of conflicts for floods are apparent. For example, in the long term the conversion of forest into agricultural land reduces soil permeability, because the use of heavy machines over many years increases compaction of topsoil layers and deteriorates the soil structure [4,16,17]. The stability of the soil influences its infiltration capacity [3,4] and its ability to preserve structure under the impact rain drops [18,19]. The overall result is increased runoff and soil erosion. Thus, flood prevention as a priority measure should be emphasized to avoid environmental land use conflicts. To accomplish this goal, it is important to improve design solutions for natural drainage by enhancing and promoting innovative forms of land use structures, as well as the correction of riverbeds and specific sectors along the river, especially riparian and floodplain areas [20].
A pre-requisite for the proposition and implementation of flood control solutions and conservation of soil and water measures, is the evaluation and mapping of flood vulnerability and land uses [21,22], besides environmental land use conflicts [14,15] if the focus problem is to assess human-induced impacts on flood prone agro-systems triggered by land use changes. However, if the analysis of flood vulnerability and environmental land use conflicts, taken separately, is relatively abundant, the potential amplifying factor of environmental land use conflicts on flood frequency and intensity, as well as the feedback of amplified floods on agro-systems has barely been discussed. This study aims contributing to fill in this gap. To accomplish this general goal the study established the following specific objectives, using a geographic information system (GIS) to implement them: (1) prepare a flood vulnerability map for the studied area, using multi-criteria analysis based on relevant flood-control attributes (e.g., terrain slope, land use); (2) prepare a map of environmental land use conflicts based on comparisons between land capabilities (natural uses) and actual uses [23]; (3) cross-tabulate the data on flood vulnerability and environmental land use conflicts to verify if flood prone regions extend beyond the areas in environmental land use conflict and estimate the overlapping areas; and (4) Using Pareto diagrams, identify the regions requiring priority action as regards flood control/soil and water conservation and propose preventive or recovery methods.
The studied area comprises the Batatais SP municipality, located in Brazil, which is a flood prone region with severe environmental land use conflicts caused by replacement of natural vegetation with sugar cane plantations. The local population and government have the right and the duty to perceive the risks they are vulnerable to, to plan flood control and adapt land uses in the sequel. It is expected that the identification of areas susceptible to flooding and areas of conflicts, offered in this study, subsidize decision-making in a context of land consolidation–water management.

2. Material and Methods
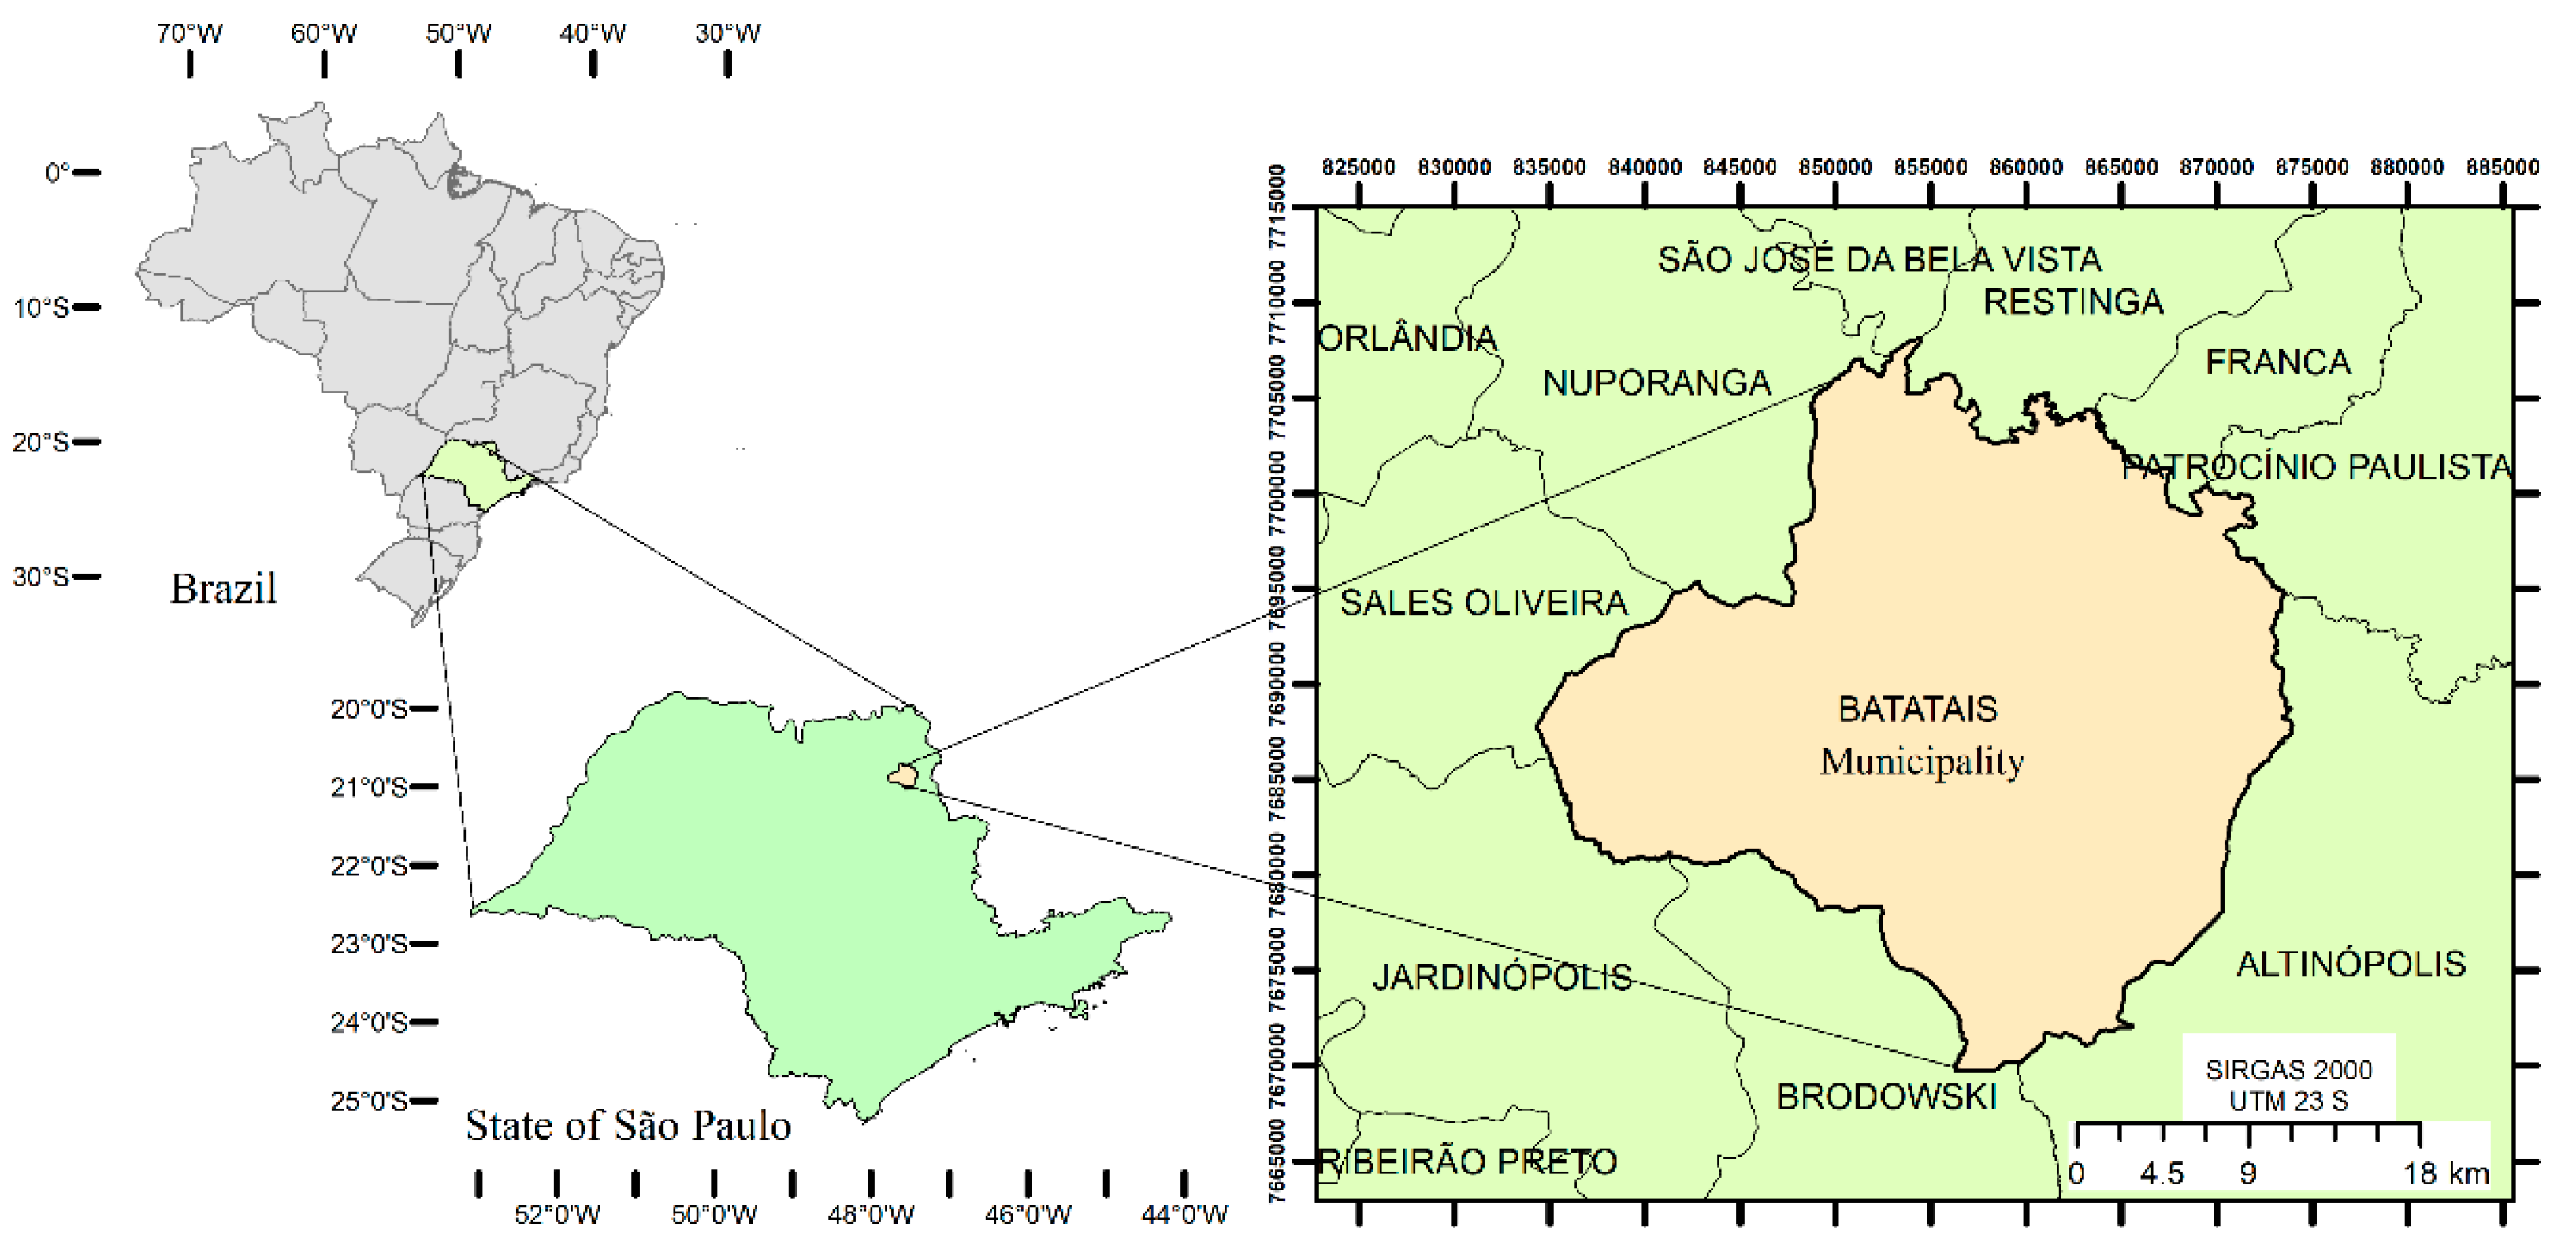
2.1. Study Area

The study area is located in the northeast of São Paulo State, Brazil (Figure 1), in the municipality of Batatais, at the latitude 20°53′28′′ S, longitude 47°35′06′′ W of Greenwich, and average altitude of 862 meters. The Batatais municipality covers an area of approximately 851 km² and has a population of 56,476 inhabitants [24]. The climate is considered Cwa in the classification of Köppen-Geiger, described as tropical (mild) with dry winter. The rainy period runs from November to March. The average precipitation (period 1970–2017) is 1972 mm/year and 100.4 mm/day. The average annual temperature is 21.9 °C (http://www.inmet.gov.br). In the past century precipitation has steadily increased on the annual and daily basis. Both trends are displayed in Figure 2 and point to an average increase of 10 mm/year and 0.7 mm/day. Within this period, most years after 1995 were characterized by precipitation above the average, while before that most years received rainfall below the average. Relief comprises the structural plateaus of Ribeirão Preto, characterized by 500–700 m of altitude and shallow incised stream valleys, and the residual plateaus of Franca/Batatais installed at higher altitudes (800–1100 m) and characterized by deep incised valleys (http://www.abagrp.cnpm.embrapa.br). According to the Prefeitura Municipal da Estância Turística de Batatais (https://www.batatais.sp.gov.br), in 2014 land use was largely dominated by sugar cane plantations (49,065 hectares; 57.7% of municipality area) and brachiaria pastures (10,437 hectares; 12.3%). Other agriculture activities were much less represented, such as coffee (2625 hectares; 3.1%), corn (2247 hectares; 2.6%) or soya (1349 hectares; 1.6%). The predominant type of vegetation cover is the Cerrado, composed of forest savanna, wooded savanna, park savanna and gramineous-woody savanna. The Batatais municipality hosts a Conservation Unit called the State Forest of Batatais, which occupies an area of approximately 1353.3 hectares (1.6%). Other forested areas are occupied by pine (976 hectares; 1.1%) or eucalyptus (419 hectares; 0.5%), while the urban centers occupy 751 hectares (0.9%). The dominant soil type is distroferric red latosols with sandy to sandy-loam texture.
The scientific studies on floods are not abundant for the Batatais municipality, but several videos on the consequences of urban and rural flood events can be viewed through Brazilian television websites (e.g., the Globo Tv). Based on comparisons between daily precipitation records (e.g., Figure 2) and reported flood events, a precipitation >140 mm/day can be used as reference for the occurrence of a severe flood in Batatais. Figure 2 points to the occurrence of four major events in the 1970–2017 period (labeled peaks), which represents approximately one major event per decade. Figure 3 illustrates the severe flood occurred in 29 January 2008, when the daily precipitation reached 174 mm, the largest value registered in the Batatais Forest Station in the 1970–2017 period. Besides the four events highlighted in Figure 2, some local newspapers have reported the occurrence of floods in 20 January 2014, 9 January 2016, or 29 December 2016, presumably at lower daily precipitations. This is indication that moderate floods can occur at rather short return periods (e.g., 1–2 years).

2.2. Raw Data and Software

The image dataset comprises radar images from the SRTM (Shuttle Radar Topography Mission), with a spatial resolution of 30 m, referring to the WGS84-Zone 23K (SF-23-VA and SF-23-VC); and a mosaic of images from the Landsat 8 optical sensor, with a spatial resolution of 30 m and temporal resolution of 16 days, referred to Datum WGS84. These datasets were used to prepare all the maps and to extract data on environmental attributes. The images were obtained using public data sources and processed in ArcGIS software from ESRI, licensed to Universidade Estadual Paulista (UNESP), Departamento de Engenharia Rural, Campus Jaboticabal. The public data sources comprised the websites of EMBRAPA—Empresa Brasileira de Pesquisa Agropecuária (http://www.relevobr.cnpm.embrapa.br) and of INPE—Instituto Nacional de Pesquisas Espaciais (http://www.dgi.inpe.br/CDSR).

2.3. Preparation of Workable Data

The flood risk map was calculated and drawn for the municipality of Batatais SP, based on four variables, called environmental attributes, represented by altitude, slope class, land use/occupation and soil type. The maps of all environmental attributes were prepared in raster format as described in the next paragraph.
The altitude and slope classes were developed from a 30 m resolution digital elevation model (DEM), following Brazilian principles and rules on cartography. The DEM images were first corrected for relief depressions and then submitted to the slope routine of ArcGIS that calculated and projected the slopes. The map of land use was drawn with four classes: agriculture, pasture, forest and urban. It was generated from the Landsat 8 images using the supervised classification method, whereby statistical algorithms are run for the recognition of spectral patterns that subsequently are labeled as land uses. The map of soil units was obtained from [25] in paper format and then scanned, geo-referenced, vectorized, and finally transformed into the required raster format. The four maps are illustrated in Figure 4.

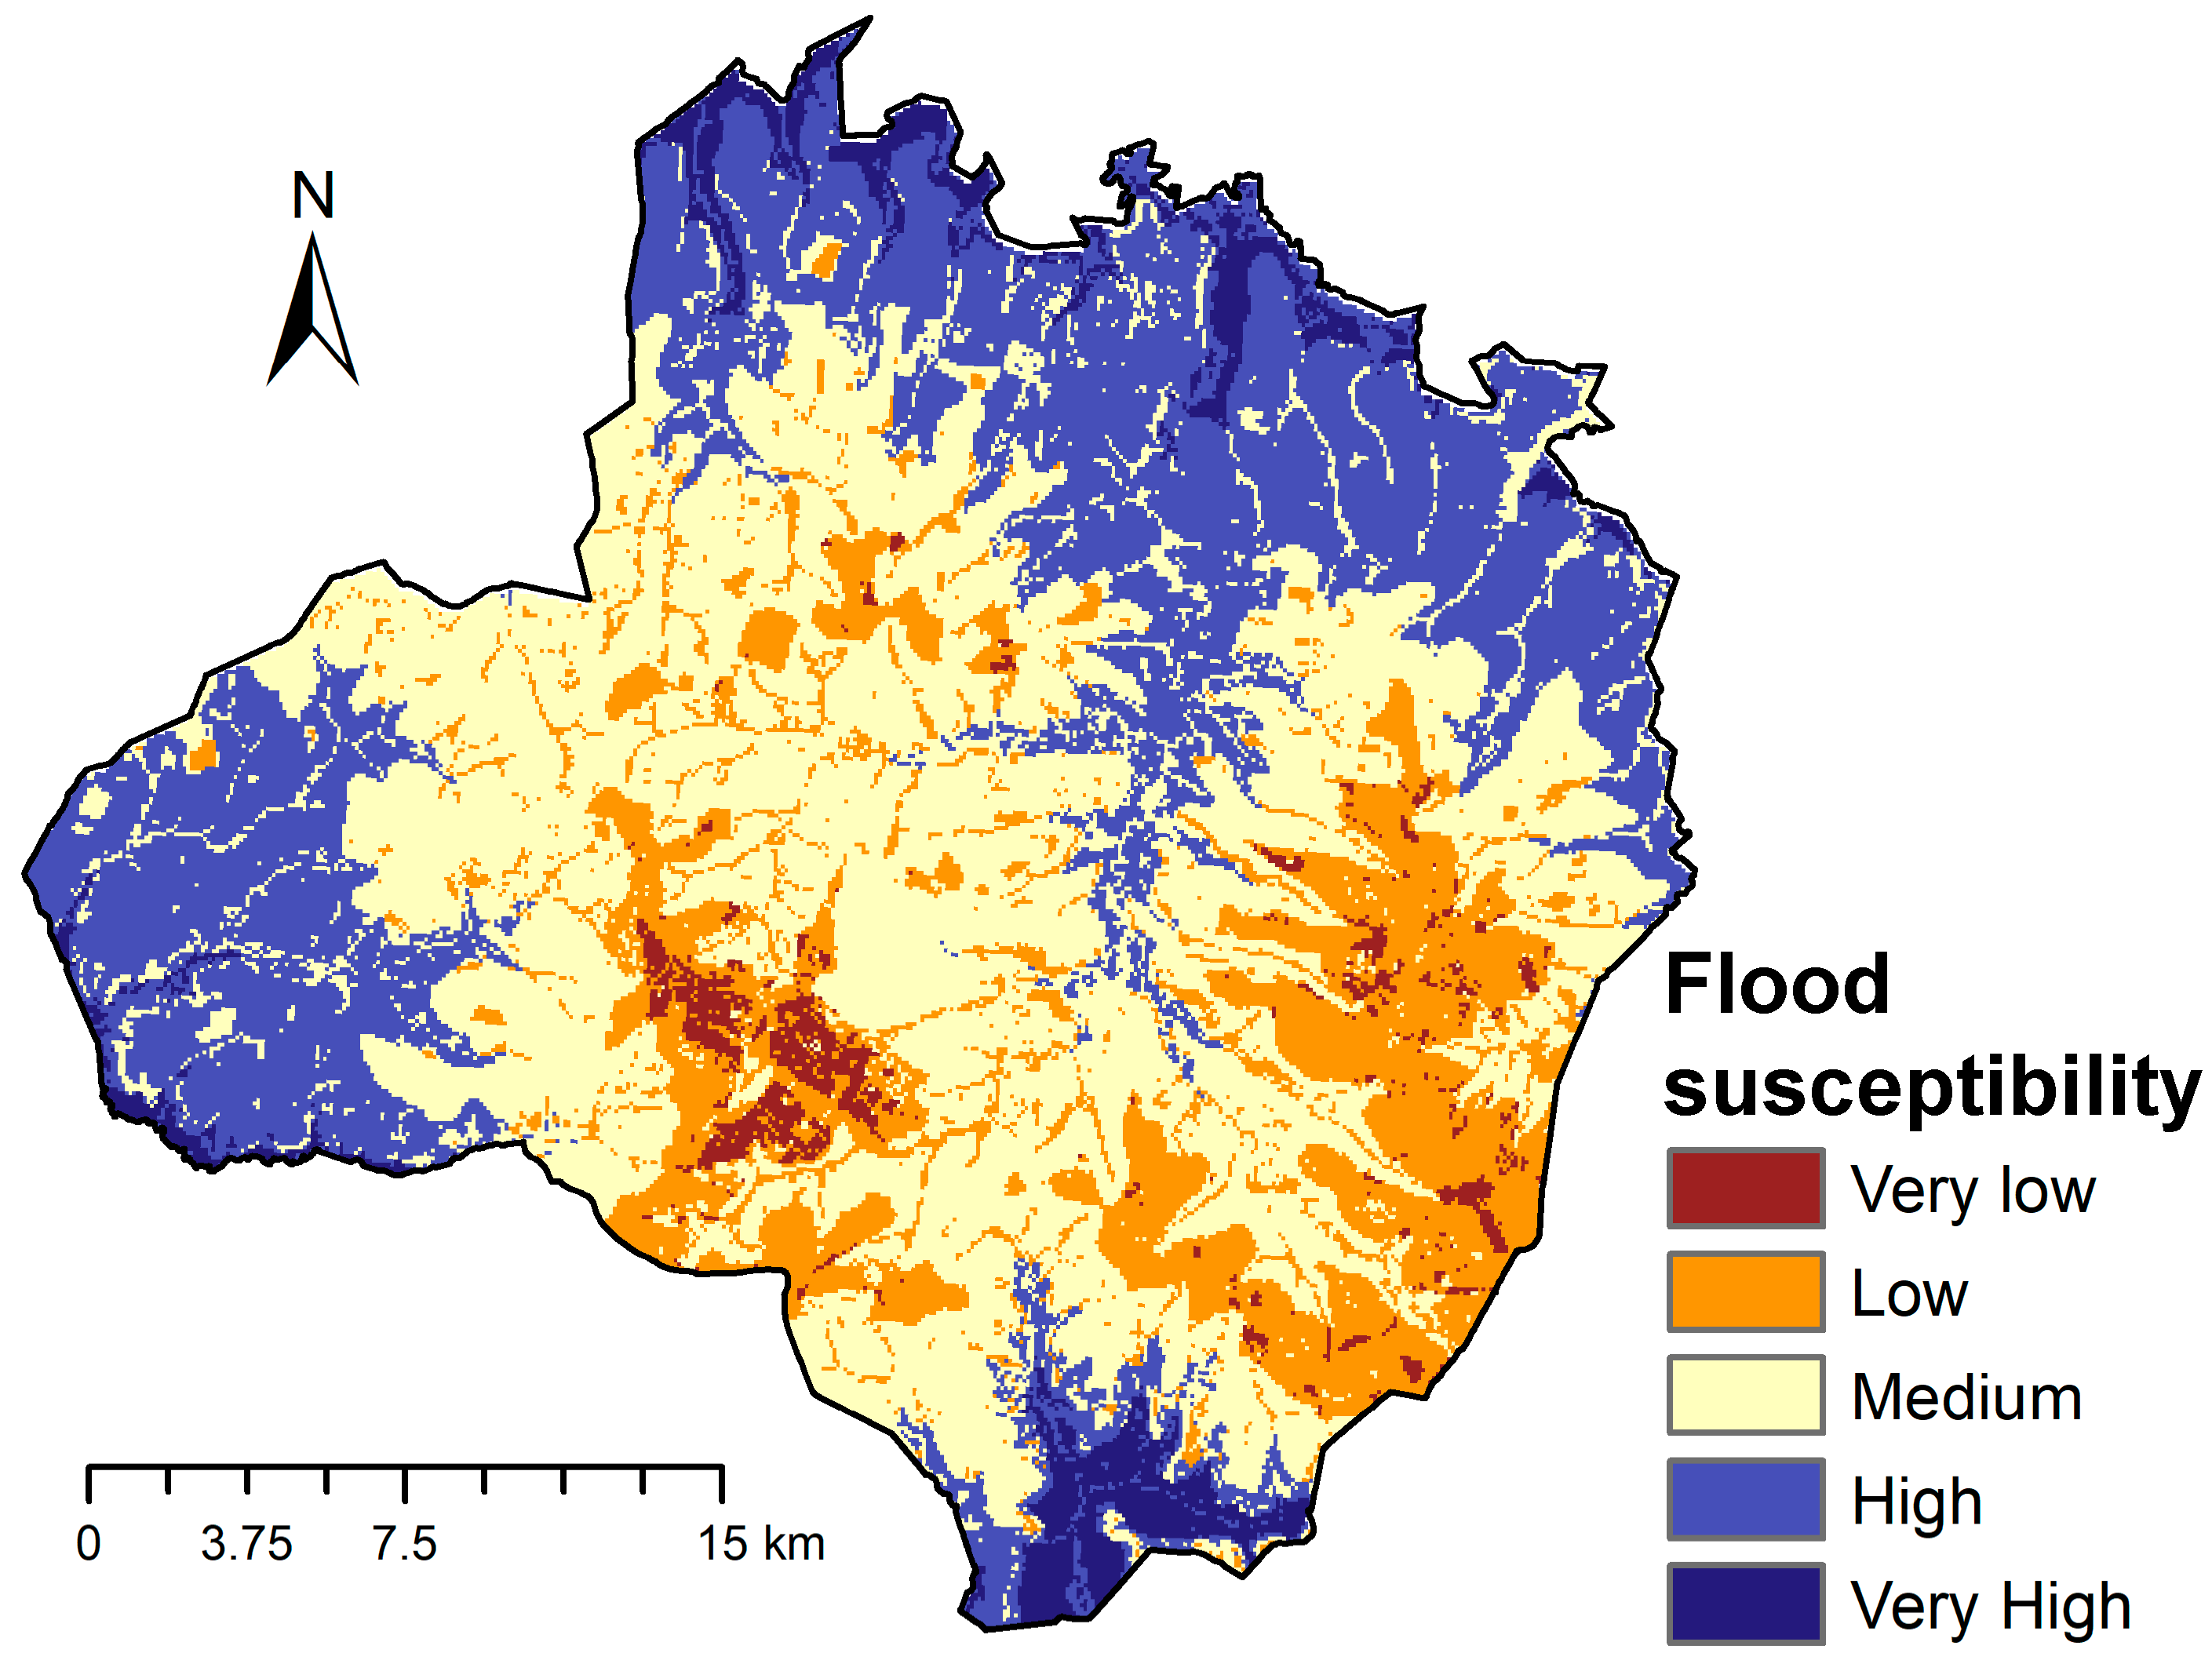
2.4. Flood Vulnerability

The mapping of flood vulnerability involved a weighted combination of the environmental attribute maps (Figure 4) operated in ArcGIS using map algebra tools. The selection of attributes was based on the judgment of experts who know the region and could empirically relate historical flood events to these variables. The processing of attributes to produce the map of vulnerable areas followed a conventional multi-criteria analysis (MCA), whereby the original variables are first harmonized into a common dimensionless scale (rated), then are allocated a specific importance (weight), and finally are aggregated into a global vulnerability index. The MCA is used in many environmental applications [26,27].
The first step in the MCA comprised the reclassification of environmental attributes into a dimensionless scale ranging from 1 to 10, where “1” means least susceptible to floods and “10” most susceptible to floods. This common range allows equivalence among attributes that otherwise would not be comparable given the different scales. The range 1–10 is arbitrary but is regularly used in MCA analyses. The reclassification scheme is depicted in Table 1 and resulted from bibliographical surveys and debates within a multidisciplinary team composed of agronomists, forestry engineers, biologists, lawyers, and geographers.
As regards the altitude attribute, the lower elevations were given the highest susceptibility (rated as 10) because they receive runoff from the higher altitudes (rated as susceptibility 1) and therefore are more prone to flooding. The attribution of susceptibility ratings to the land use attribute was based on potential infiltration capacity of land covers, assessed through curve numbers (https://swat.tamu.edu). The larger the curve number, the larger was rated the susceptibility, because big curve numbers are in favor of big overland flows. In that context, the urban areas were ascribed the largest possible susceptibility (10) because these areas comprise large portions of impermeable surface (e.g., street pavements, commercial and industrial areas), characterized by very large curve numbers (>80 in a maximum of 100). The low susceptibility end-member (rated as susceptibility 1) was the forested areas because vegetation has the capability to retain water in the canopy promoting infiltration and reducing runoff downstream. These areas are frequently characterized by low curve numbers (e.g., between 30 and 60 for forests and bushes located on permeable soils). The occupations by agriculture or pasture were given high susceptibility ratings because characteristic curve numbers in these areas are intermediate to high (60–75). The distribution of susceptibility ratings per slope classes considered the effect of topography in the share of overland flow between exportation and accumulation. The steepest slopes (>75%) were attributed the lowest rating (1) because overland flow in these areas is mostly exported under the action o gravity towards the plains where the surface is leveled promoting deceleration of water velocity, accumulation and floods in the sequel. For the opposite reasons, the low slope areas (slope < 10%) were assigned a high susceptibility rating (8–9). The susceptibility ratings of soil classes took into account the expected permeability of dominant soil types, deduced from soil texture. The textures of red and yellow-red latosols are mostly sandy or sandy-loam, which means the soils are permeable. For that reason, the susceptibility ratings of both soil types were small (3–4).
The analytic hierarchy process AHP; 29 was used to weight the importance of environmental attributes as regards flood susceptibility. This method is based on pairwise comparisons among the attributes according to the fundamental scale of absolute numbers (Table 2). Firstly, a hierarchy of attributes is defined according to expert’s judgment. In this study, ranks were assigned to the four environmental attributes as indicated in the last column of Table 1. The altitude attribute was given the largest relative importance (7), because altitude determines where the overland flow is likely to accumulate producing floods. The smallest importance (1) was attributed to soils, because soil types in the studied region are relatively homogeneous as regards permeability. A similar rationale was used to rate the slope class parameter. In this case, the assignment of a rating 3 was related to the observation that the Batatais municipality is generally a flat to undulated region, incised by deep valleys only in specific sectors (e.g., the south limit). An assignment of a large relative importance to these steady attributes would tend to smooth the final susceptibility map masking important contributions from the other attributes. Land use was given the second largest relative importance (5), because the role of vegetation cover is prominent in the control of overland flow, but also because land use/occupation is a dynamic attribute that can change overtime. A large relative importance assigned to this parameter highlights the impact of a land use change, and therefore is likely to improve the efficacy of decision support systems focused on the flood control versus land use management issue.
Secondly, the ranks are assembled in a pairwise comparison matrix, denoted matrix A of aij elements (Table 3). Thirdly, matrix A is normalized as matrix B with elements bij (Table 4), as follows:
b i j = a i j i a i j   with   i   and   j   =   1 ,   2 ,   ,   p
Fourthly, attribute weights (w) are obtained from the main eigenvector of matrix B as follows (last column of Table 4):
w i = j b i j i j b i j   with   i   and   j   =   1 ,   2 ,   ,   p
with:
i w i = 1   with   i   =   1 ,   2 ,   ,   p
Finally, a consistency ratio (CR) is computed to check whether the elements of matrix B have been randomly generated, in which case the attribute weights are not statistical significant and for that reason are invalid within the MCA. The consistency ratio ranges from 0 and 1 and invalidate the weights when CR ≥ 0.1 [29]. The details on the calculation of CR are beyond the scope of this paper and can be consulted elsewhere [30]. For the weights depicted in Table 4, a CR = 0.043 was estimated, which means the weights are valid.
Having validated the weights the vulnerability index is calculated using the following aggregation equation:
Flood susceptibility = 0.06 × soil + 0.12 × slope + 0.26 × land use + 0.57 × altitude
where the numeric coefficients represent the attribute weights (last column of Table 4).

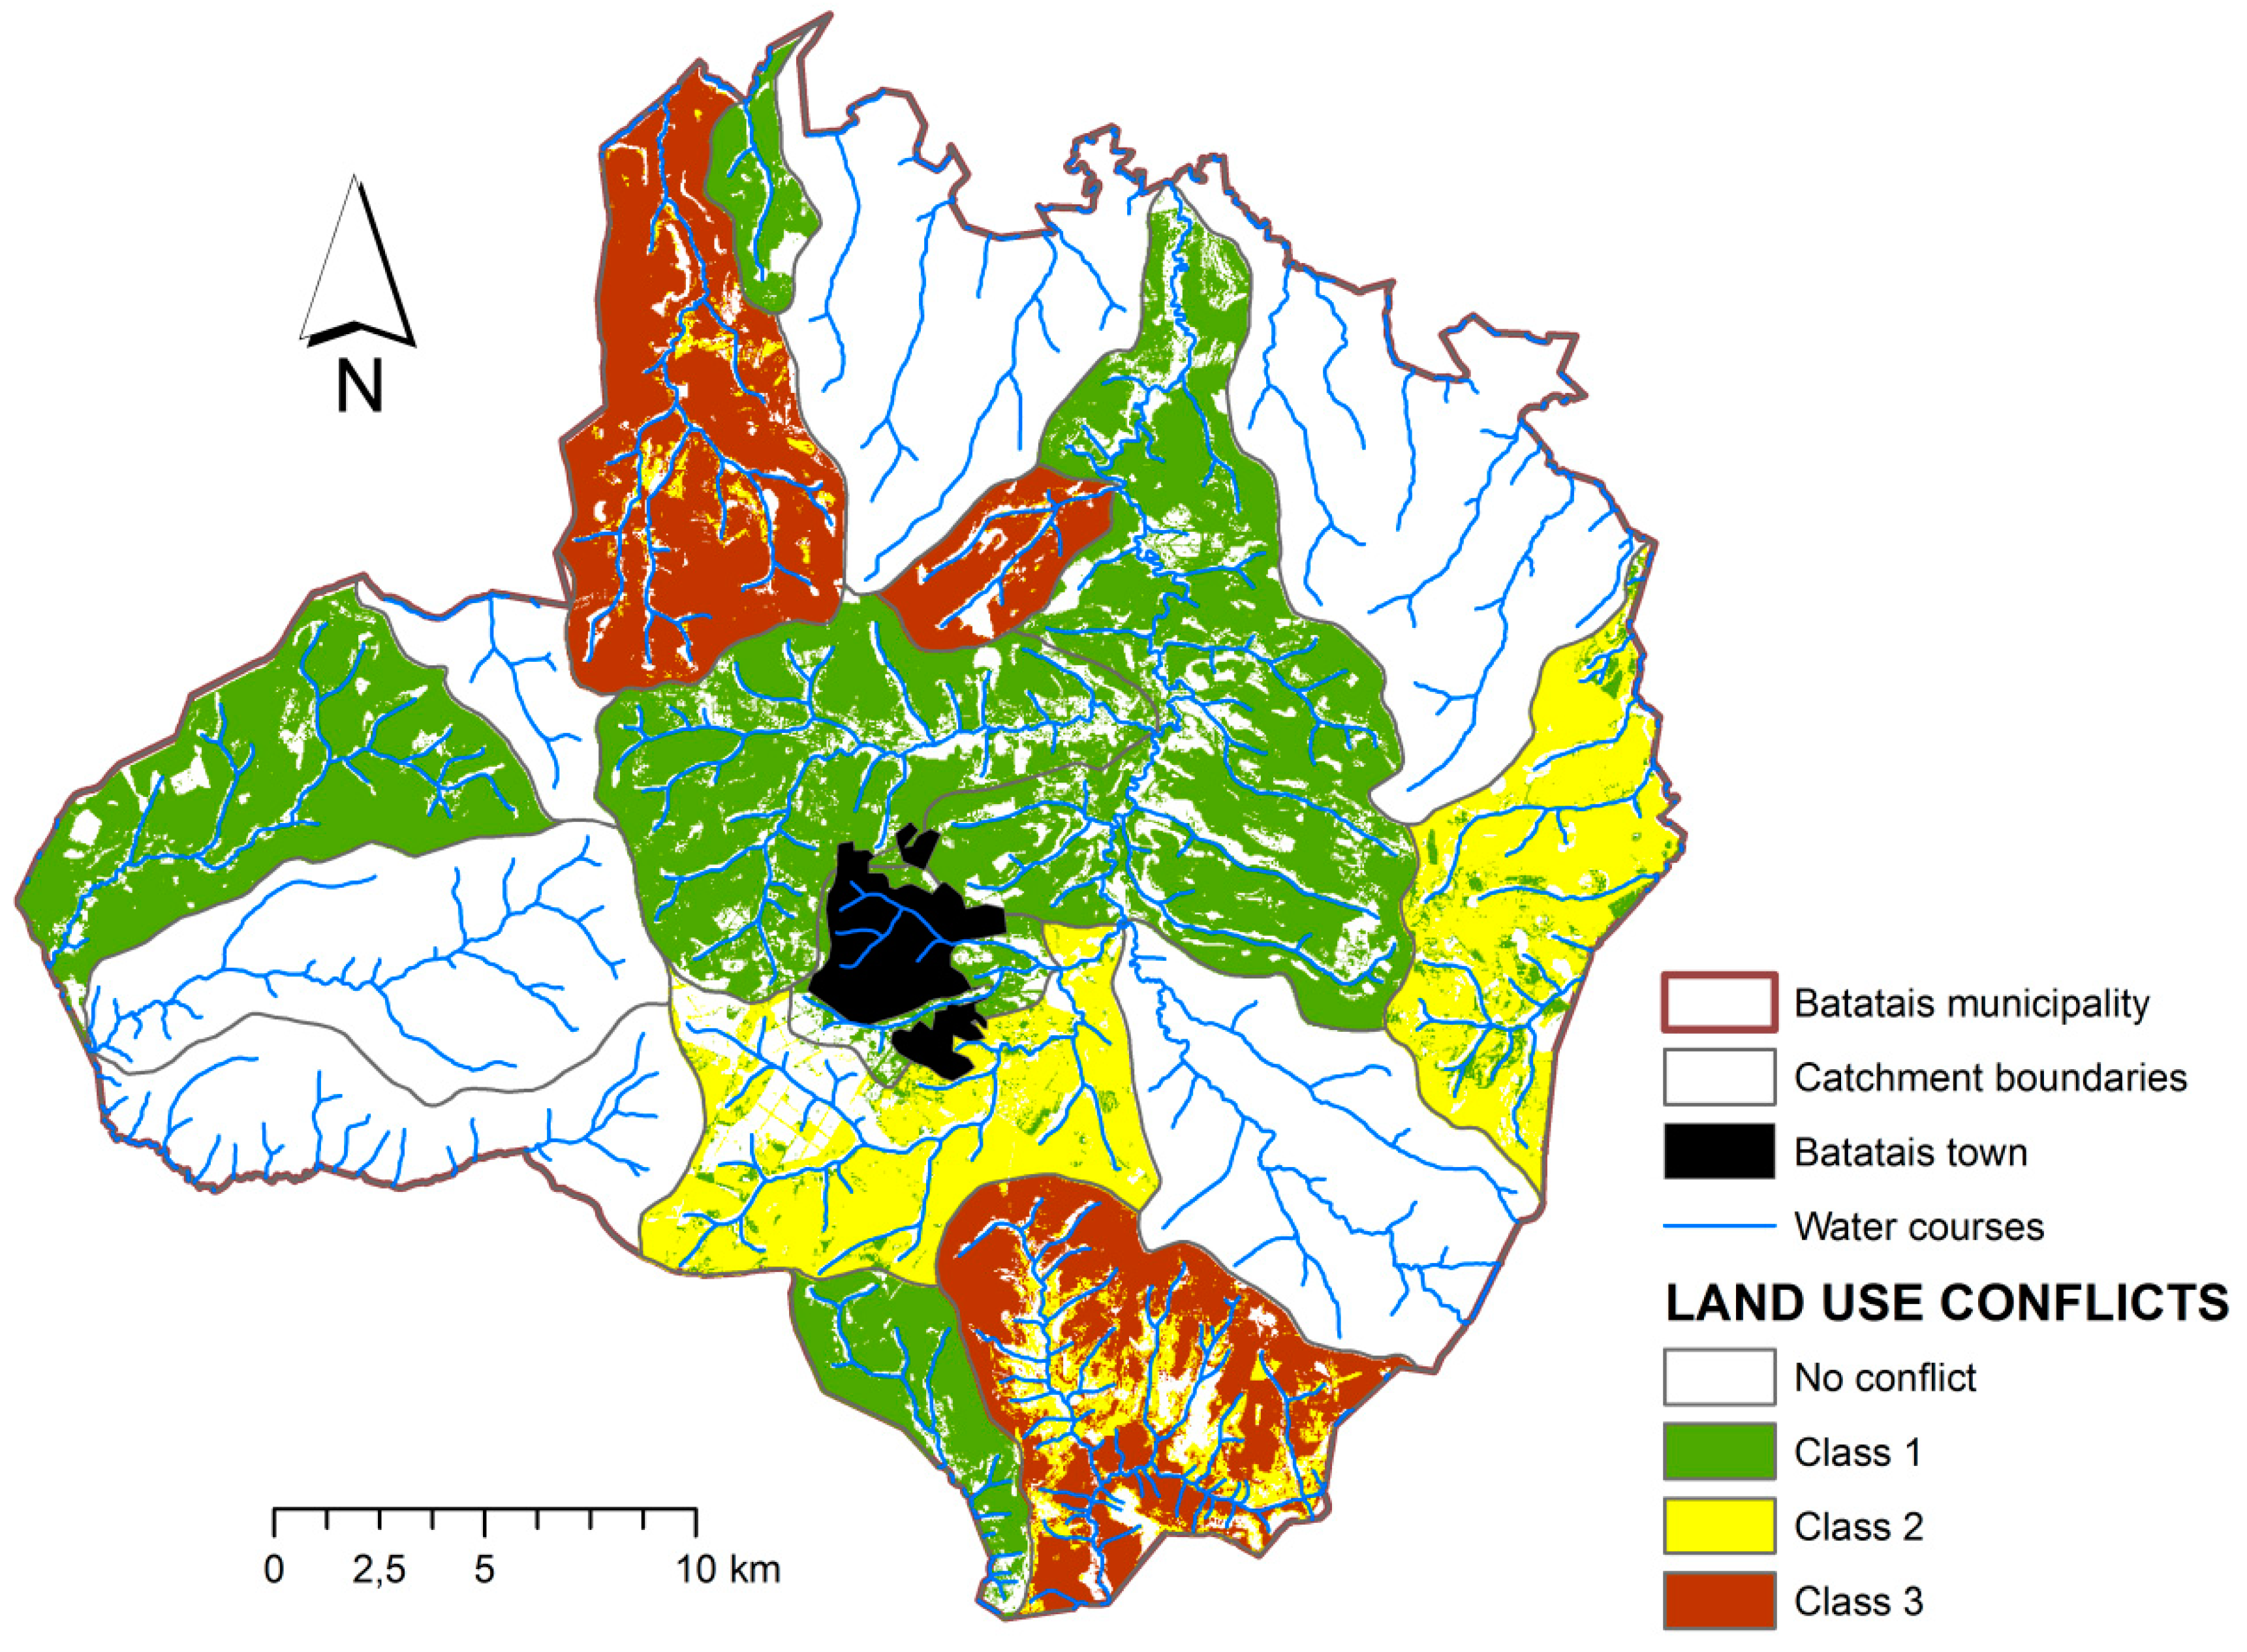
2.5. Environmental Land Use Conflicts

Environmental land use conflicts relate to uses of the land that ignore land capability. In this study, land capability was assessed using the ruggedness number concept (RN = Sl × Dd) based on the morphometric parameters hill slope (Sl) and drainage density (Dd). The RN is easily estimated from a digital elevation model (e.g., Figure 4; top-left map) using the adequate terrain modeling tools within the GIS software, namely the slope and density functions of ArcGIS. The relationship between the RN and land capability can be described as follows [31]: sectors of a watershed with a low RN are assumed capable for the practicing of cropping agriculture as they correspond to undulated low dissected areas. When the RN is high the sectors are found proper for an occupation by forests because they are sloping and considerably dismembered. Finally, sectors of the basin with intermediate RN values are adequate for livestock pasturing or for a mosaic of natural pastures and forests. The boundaries of each RN class are set up in four consecutive steps: (a) a number of sub-basins is identified and delineated across the watershed in study; (b) the mean Sl and Dd of each sub-basin are estimated, from which the corresponding RN is obtained; (c) the RN amplitude (maxRN–minRN) is estimated, where maxRN is the highest and minRN the lowest RN, and then divided by a pre-defined number of land capability classes (n), for example the four classes used in this study (n = 4): 1—Agriculture, 2—Pastures for livestock production, 3—Pastures for livestock production/Forestry and 4—Forestry; (d) the sub-basins are assigned to these classes, based on their individual RN scores, from which a land capability map is prepared.
The environmental land use conflict is the divergence of an actual use (e.g., Figure 4; top-right image) from land capability. This conflict can be graduated to express the departure between the natural and actual land uses. The steps required to accomplish this goal were thoroughly described in the study of [15]. Firstly, land capabilities (labeled N) and actual uses (labeled A) were ranked in ascending order of their resemblance with agriculture, and given the codes N = A = 1 (agriculture), 2 (livestock production), 3 (mixed livestock production and forestry), and 4 (forestry). Secondly, the conflict was equated to the difference between codes of capability (1≤ N ≤ 4) and actual land use (1≤ A ≤ 4). According to this method, (a) the no conflict areas are represented by regions where N − A ≤ 0, with the negative values representing areas with potential for a sustainable expansion of agriculture or livestock pasturing; (b) areas where the value of the difference between capability and actual use is equal to 1 or 2 are classified as Class 1 (N – A = 1) or Class 2 (N – A = 2) conflict areas, respectively; (c) areas with potential for forestry (N = 4) but occupied with a farm (A = 1) are referred to as Class 3 (N – A = 3). According to [23], the risks and limitations allocated to conflict classes 1 to 3 are: (Class 1) these lands represent a low risk for surface water contamination and riverine ecosystem degradation when used for annual crops or pastures. The attenuation of the risks may be accomplished by the implementation of soil conservation measures resorting to vegetative and(or) mechanical techniques; (Class 2) these lands represent a medium risk for surface water contamination and riverine ecosystem degradation and, hence, are incapable for the practice of agriculture, although being adapted for livestock pasturing, reforestation or environmental preservation; (Class 3) these lands represent a high risk for surface water contamination and riverine ecosystem degradation and therefore are not capable of being used for cropping or livestock pasturing; nonetheless, they are still capable of being reforested or used for environmental preservation.

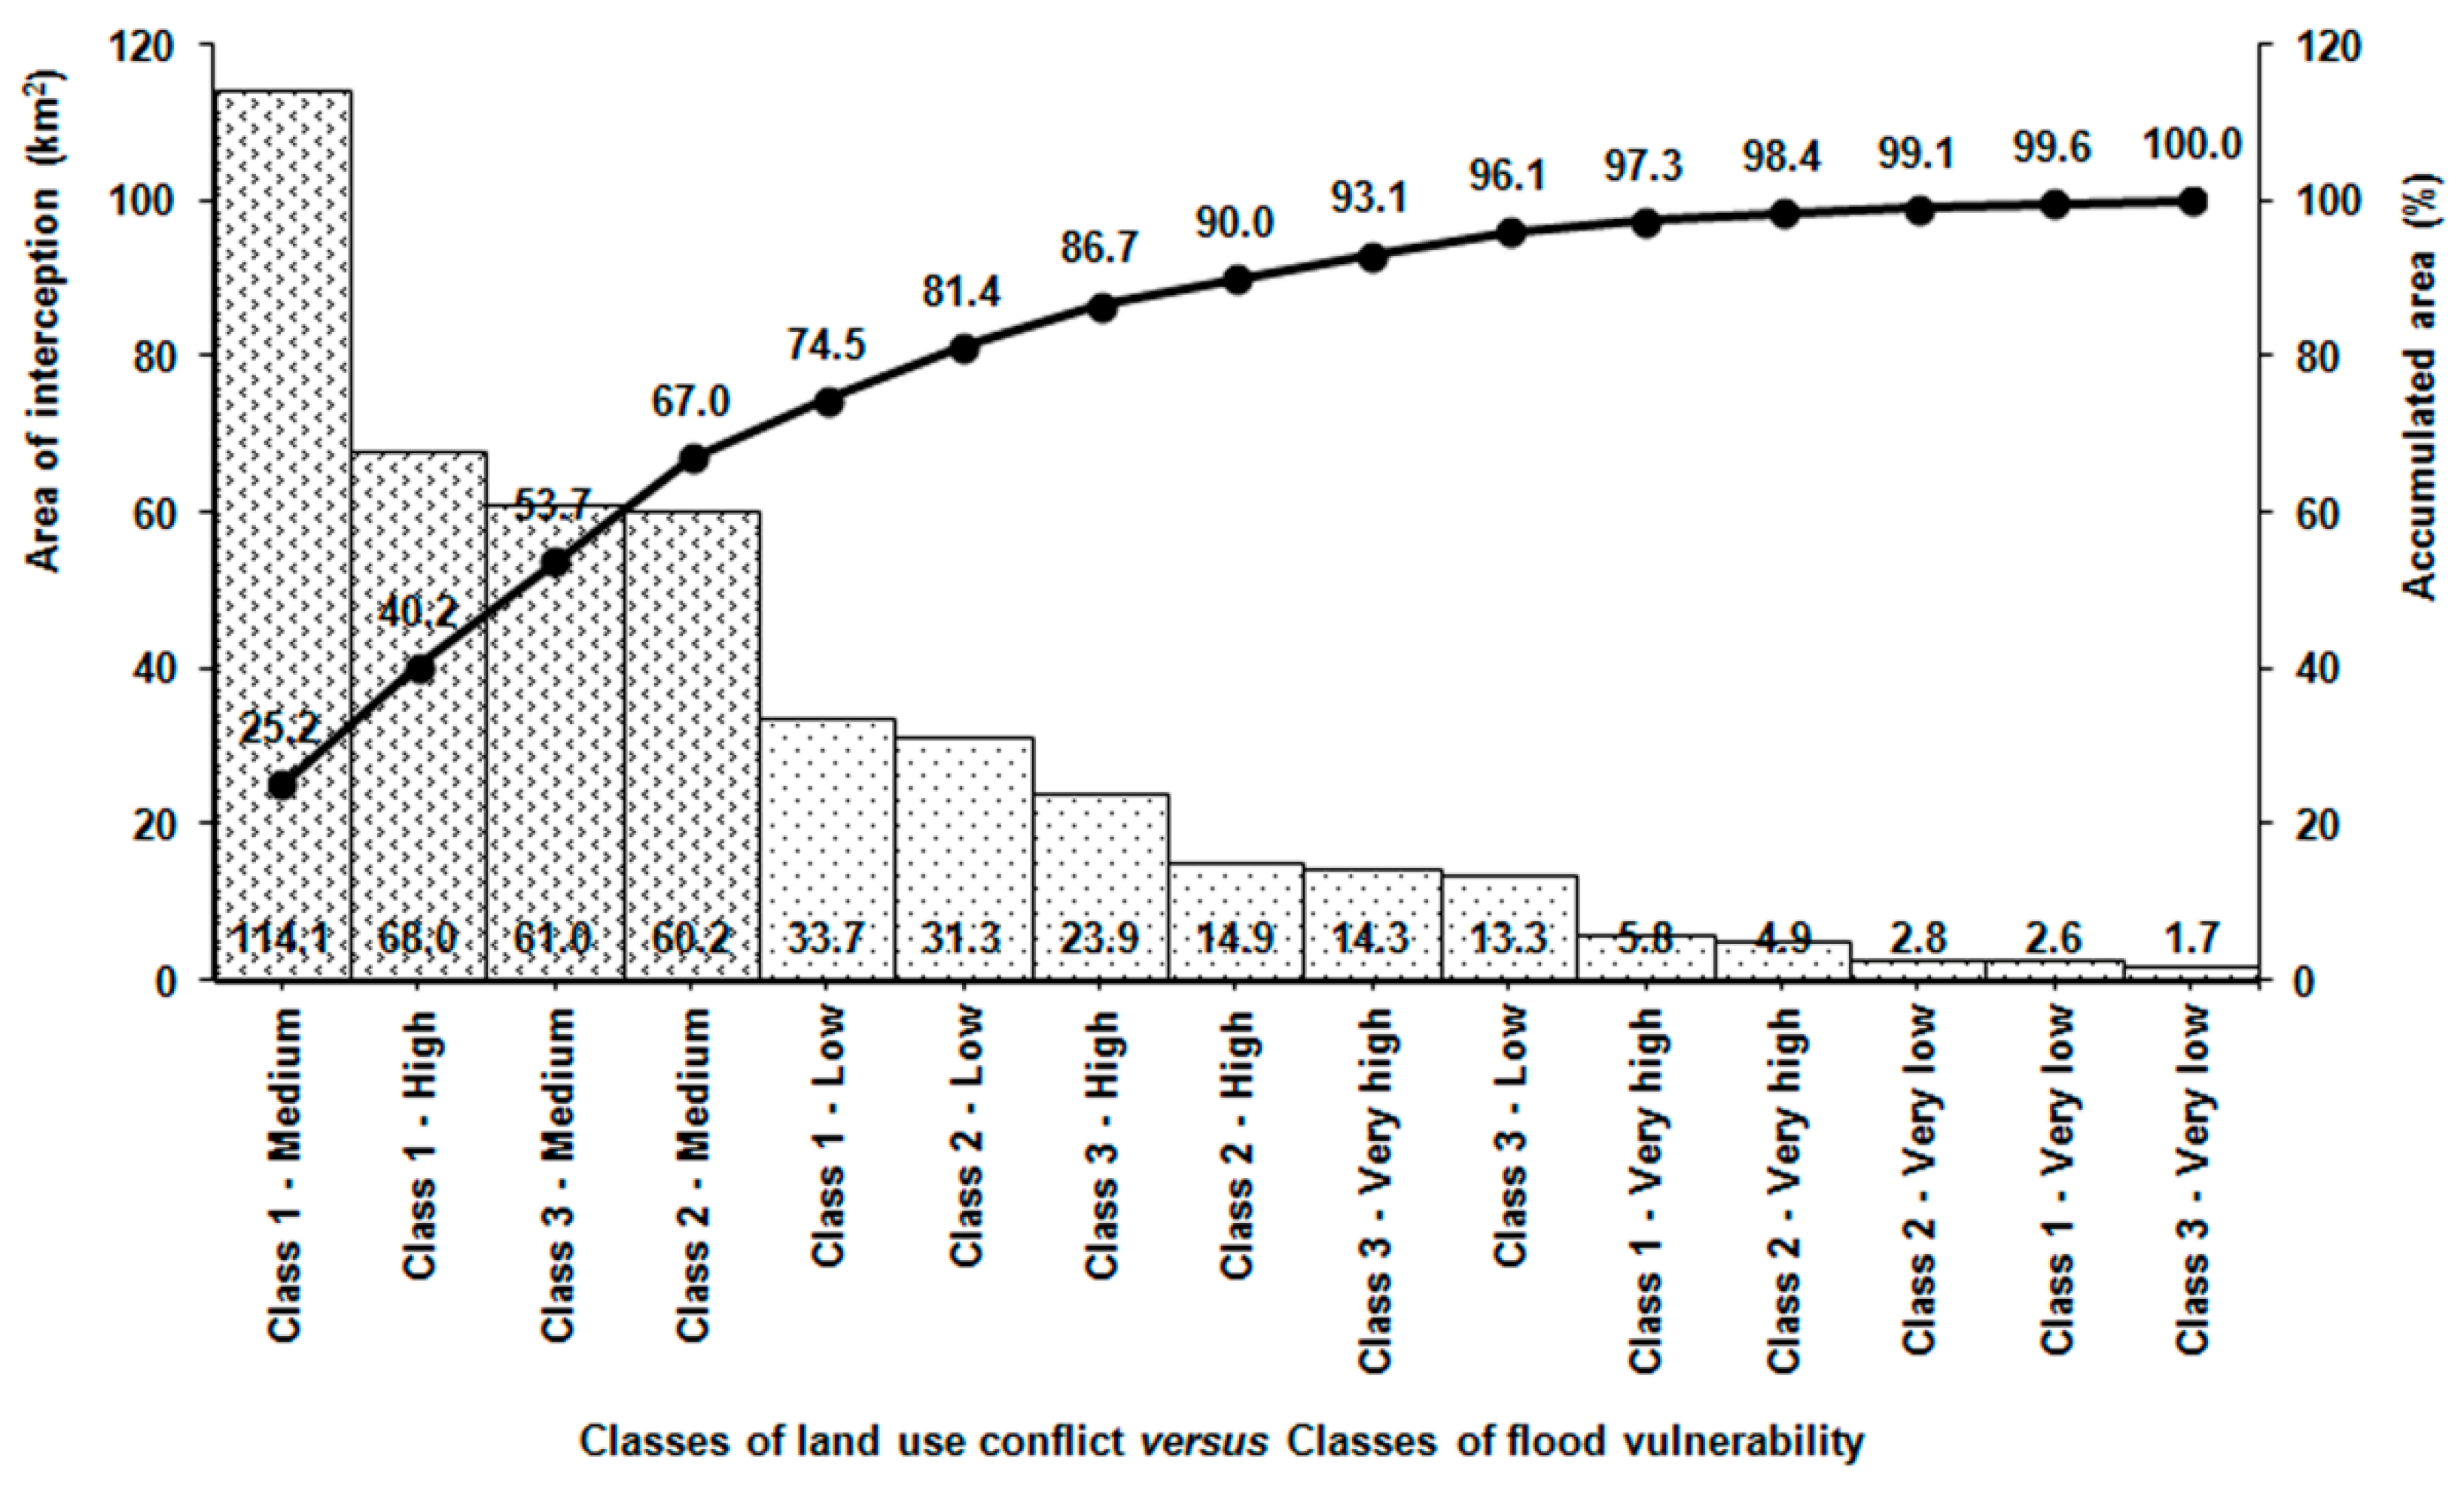
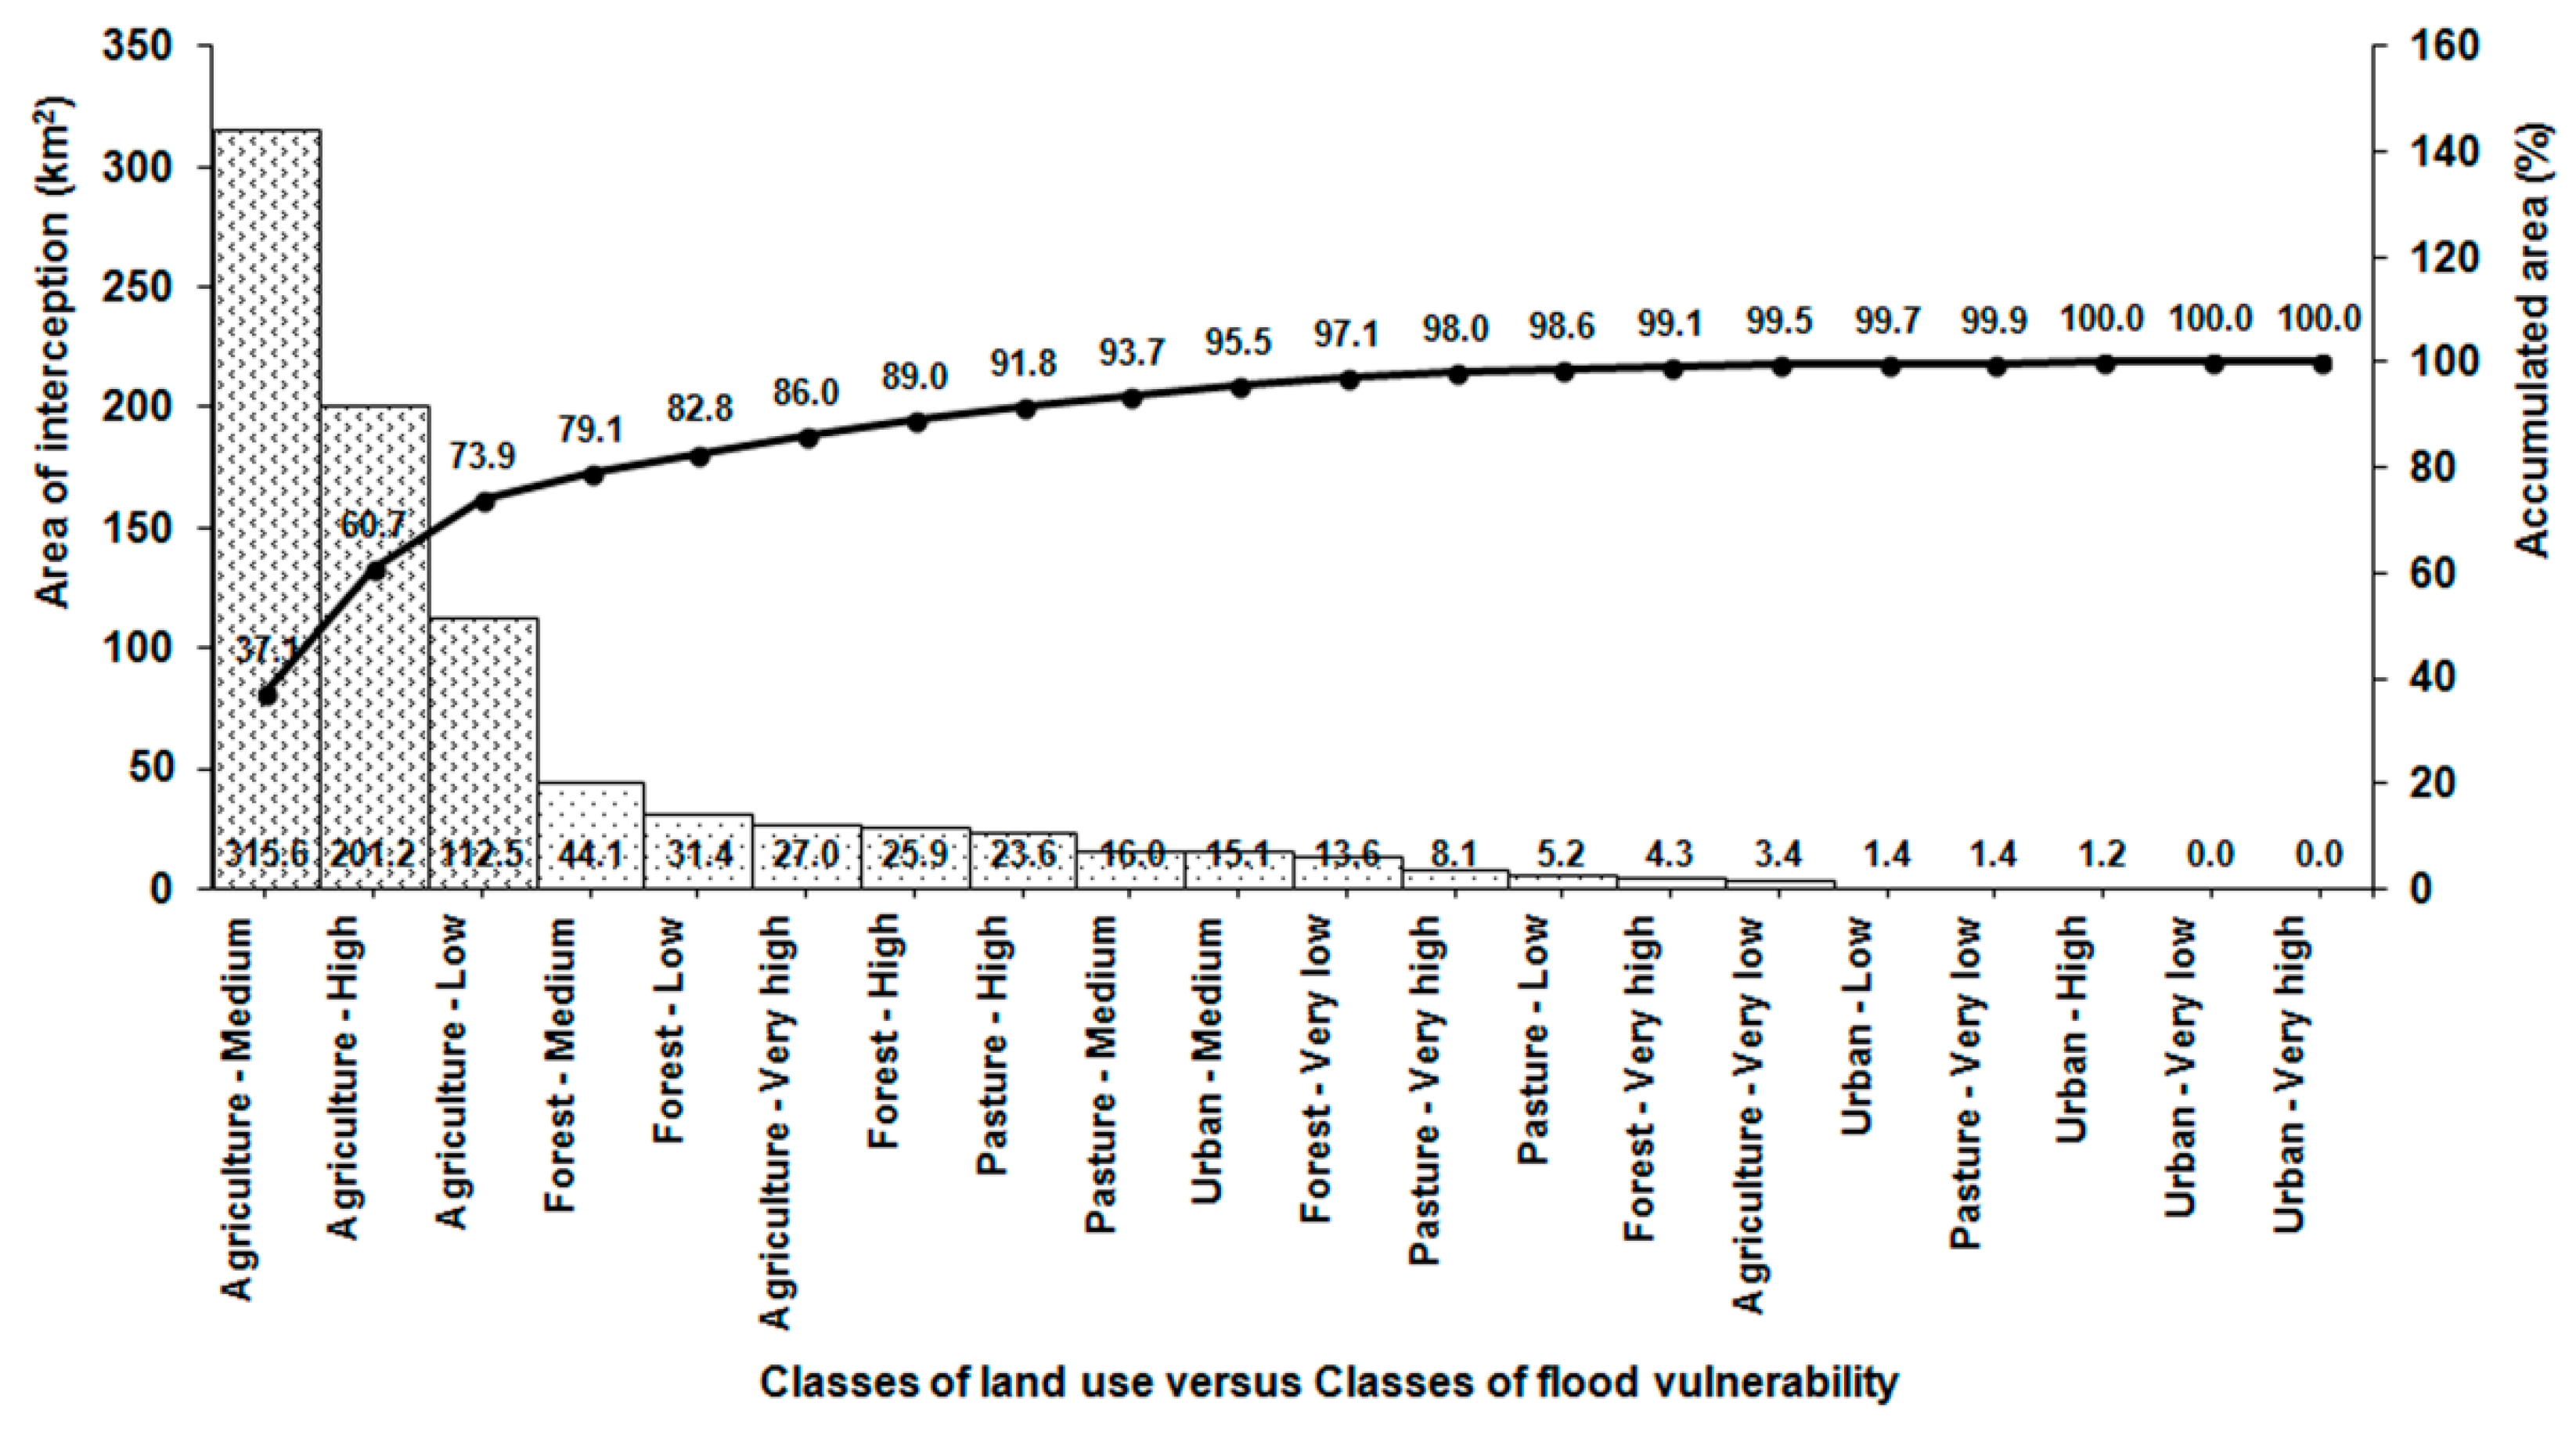
2.6. Combined Analysis of Flood Vulnerability, Land Use, and Land Use Conflicts

The potential impact of floods on agricultural systems, with or without eventual amplification caused by environmental land use conflicts, was assessed through a combined analysis of flood vulnerability, land use and environmental land use conflicts, using Pareto diagrams. A Pareto chart, also called a Pareto distribution diagram, is a vertical bar graph in which values are plotted in decreasing order of relative frequency from left to right. A point-to-point graph, which shows the cumulative relative frequency, may be superimposed on the bar graph. Pareto charts are extremely useful for analyzing what problems need attention first because the taller bars on the chart, which represent frequency, clearly illustrate which variables have the greatest cumulative effect on a given system. The Pareto chart provides a graphic depiction of the Pareto principle, a theory maintaining that 80% of the output in a given situation or system is produced by 20% of the input (https://whatis.techtarget.com).

3. Results

The vulnerability to floods in the Batatais SP municipality is represented in Figure 5 and the associated areas quantified in Table 5. The areas with higher vulnerability (levels high and very high) are concentrated in sectors around the municipal boundary where altitudes are lower, namely the west, south, and northeast sectors. The highest vulnerability level (very high, displayed in dark blue in Figure 5) occupies an area of 39.45 km2, which represents 4.64% of municipal territory. These areas are located along the water course margins where the relief is smooth. They represent a serious problem concerning human, structural, or material losses, should an anomalous natural phenomenon occur, namely an intense and very prolonged rainfall event.
The very low (20.31 km2; 2.39%) and low (152.77 km2; 17.95%) vulnerability levels occupy the southwest and southeast sectors of Batatais SP municipality. Vulnerability in these areas is generally low (sometimes very low) because these regions occupy areas of high altitude where accumulation of runoff less likely. The southwest region comprises a particularly low vulnerability sector (the dark brown area), because vegetation cover (Cerrado), permeable forest soil, and low slope gradients all potentiate infiltration increase and runoff decrease, which combined with the high altitudes further reduce flood vulnerability. The medium vulnerability level occupies the largest area (388.92 km2) representing 45.7% of municipal area. This outcome is strongly influenced by the MCA options, whereby altitude and land use were ranked as most relevant factors in the flood vulnerability assessment while agriculture and medium altitudes were ascribed relatively large ratings (Table 3 and Table 4). Therefore, a large portion of medium vulnerability areas occupies agricultural areas located at medium altitudes. It is worth mentioning that the urban area of Batatais SP municipality is also described as medium vulnerability area. This is enough reason for civil defense agencies to implement monitoring programs, as well as to adopt prevention measures to minimize the potential losses of floods and the transmission of communicable diseases, such as water-borne (e.g., typhoid fever, cholera) and/or vector-borne (e.g., malaria, dengue) diseases.
Overall, the flood vulnerability analysis reveals a flood-prone municipality where the total area susceptible to floods is much larger than the less susceptible areas, since the regions of medium and high flood vulnerability account for 75.03% of all municipal area. Additionally, the most vulnerable regions, although representing a small area, are located in the vicinity of drainage channels requiring special attention from local authorities.
The map describing environmental land use conflicts within the Batatais SP municipality is illustrated in Figure 6. The percentage of municipal area occupied by conflicts is 65%, distributed as follows per conflict class: class 1—32.3%; class 2—16.4%, and class 3—16.4% (Table 6). The cross-classification of flood vulnerability and environmental land use conflict exposes large percentages of municipality area (78.78%) occupying medium (52.01%), high (23.6%), or very high (3.17%) vulnerability regions where land use is in moderate (class 1; 40.23%), high (class 2; 16.61%) or severe (class 3; 21.94%) conflict with the soils’ natural use.
The illustration of land use conflict-flood vulnerability cross classification in the form of a Pareto diagram is depicted in Figure 7. In this case the Pareto 80/20 rule does not provide an unique solution, because the number of classes representing 20% of input (land use conflict–flood vulnerability classes) is different from the number of classes representing 80% of output (cross-classified area). The high frequency classes representing 20% of input comprise three classes, namely the areas of conflict classes 1 and 3 located in regions of medium flood vulnerability and the areas of conflict class 1 occupying regions of high flood vulnerability. The higher frequencies representing 80% of the cross classified area comprehend the previous three classes plus the areas of conflict class 2 occupying the regions of medium flood vulnerability and the areas of conflict class 1 and 2 located in regions of low flood vulnerability. From a decision-making standpoint, it was assumed that the optimal Pareto solution gathers four classes, namely all regions of medium flood vulnerability affected by land use conflicts (classes 1–3) and the regions of high flood vulnerability affected by class 1 conflict class. Under the Pareto principle, these would be the areas of Batatais SP, municipality requiring the implementation of mitigation measures in the first place.
The cross classification of land use and flood vulnerability is quantified in Table 7 and illustrated in Figure 8 in the form of a Pareto diagram. In this case, the Pareto principle applies because the 80% of cross-classified area is associated with 20% of land use classes, namely agriculture located in regions of low to high flood vulnerability and forest occupation in regions of medium vulnerability.

4. Discussion

The areas occupied by agriculture and simultaneously vulnerable to floods represent 516.80 km2 of Batatais SP area, which means 60.73% of this municipality. From a decision-making stand point, these areas require intervention in the first place because they are agricultural areas located in regions of medium and high flood vulnerability. Although the scientific literature is scarce on actual or potential damage of floods in this region, the news periodically communicated by the social media (e.g., local television, newspapers) is enough reason to expose concerns about the potential harmful effects of recurrent floods for local agricultural systems and stream waters. Following the Pareto principle and common sense, these vulnerable areas require priority attention of public policies regarding decision making of preventive measures, public education and occupational rearrangement of the soil at catchment scale.
Floods submerge the fields used for agriculture, frequently causing production losses. The fields stay submersed for variable periods of time depending on factors such as topography, hydrologic barriers (e.g., dams), or return periods of the flood. The actual percentage of production loss will also depend on a number of factors, including crop variety, stage of plant development, flooded area, level of inundation and length of flooding period [32]. The present study does not provide numbers for all these factors but certainly indicate that large areas of Batatais SP municipality mostly used for sugar cane can be periodically submerged, especially where vulnerability is high. It is worth mentioning that the economic effects of river floods for sugar cane producers can be noteworthy. In a study in Pakistan [33], a reduction of sugar recovery from sugarcane was attributed to excessive water absorbed by a flooded sugarcane crop which reduced the sugar contents in the cane and increased in the cane weight. The overall consequence was more payments to the local growers with less sugar recovery. In the context of a changing climate, this economic damage can aggravate if extreme precipitation events become longer and more intense [34]. Besides the direct tangible losses, the flood consequences for farmers also comprise direct intangible (e.g., business interruption), and indirect (clean up and recovery, soil and water remediation) losses [35].
Land-use changes contribute to an increased frequency and intensity of floods by increasing surface runoff [36]. Flood hazard events often occur in areas with dense population or high levels of agricultural land reclamation [37,38]. This gives urbanization and expansion of agriculture decisive roles in increasing the intensity and frequency of floods. A common cause of flood change response in modern agriculture areas relate to soil compaction from ploughing and heavy machinery [39,40,41]. However, flood response to land use changes in the rural environment usually begins during land conversion. Land use changes such as shifts from forestry to agriculture, from pasture to arable land, from rain fed to irrigated agriculture or from agricultural use to urbanized areas act as drivers of flood frequency and intensity increases [42,43], because these changes reduce land capacity to attenuate runoff. Some of these changes can produce amplified flood responses in case they correspond to environmental land use conflicts. In these cases, the change is performed in disagreement with land capability (natural use), for example when agriculture expands to steep forested hillsides. Flood intensity under these settings is amplified because land reduces the runoff attenuation capacity offered by forest cover while the large slope gradients accelerate runoff increasing flood potential downstream. Given the large area occupied of class 3 conflicts (Figure 6), characterized by forest-agriculture conversions, the Batatais SP municipality is presumably very prone to amplified flood intensities.
Land use conflicts may accelerate runoff and amplify flood response, but floods can feedback and amplify soil, water and biodiversity damages in areas where the conflicts have developed. Land use conflicts trigger changes in the soil composition and structure, namely reduction of organic matter and the capacity of soil to form stable aggregates [31]. Consequently, a cascade of environmental impacts develop, such as amplified soil loss [14,15], deterioration of water quality [44,45], and biodiversity decline [46]. Under these settings, recurrent floods will tend to aggravate these damages. If no prevention or recovery measures are taken, the flood-conflict issue may turn into a negative spiral ultimately leading to land degradation [47]. The return of a degraded land to a neutral condition is a priority given the economic and social costs of land degradation [48]. The neutral condition implies no net loss of the land-based natural capital relative to a reference state. Actions to achieve land degradation neutrality include sustainable land management practices that avoid or reduce degradation, coupled with efforts to reverse degradation through restoration or rehabilitation of degraded land. This rationale is independent from the causes of land degradation and hence applies to flood-related causes. However, to achieve land degradation neutrality is important to have a strong engagement of planners, stakeholders and the society, and may need to involve law enforcement initiatives [49].
The first step towards flood prevention is to map flood vulnerability [5,6]. In the present study, a map of flood vulnerability was prepared for application in a rural environment, using flood control attributes already adopted by other work groups [50], and a similar multi-criteria analysis [51]. However, to our knowledge this was the first time a flood vulnerability map has been coupled with a land use conflict map to investigate the potential impact of these inadequate land use changes on floods, and vice versa. Following the production of vulnerability maps the next step should be focused on the implementation of measures to actively control the floods, as well as measures to improve soil conservation and rural households’ flood preparedness.
In general, active flood control can be accomplished through construction of detention basins (structural measures), and recent models attempt to optimize their location in a catchment [52]. However, besides the construction costs of these dams concerns exist about installing large detention basins in catchments, because stream water stored in the dam reservoir can deteriorate extensively and rapidly [53]. To overcome this problematic situation, other recent models propose the construction of small, low-cost, and sustainable water detention basins, termed rainwater harvesting systems [54,55]. These models comprise tools to optimize the location of rain water harvesting systems in a catchment as to maximize their flood-control capacity and the complementary use for agro-forestry applications (irrigation, wildfire combat). In addition to flood control at the catchment scale, rain water harvesting systems can also be used to attenuate urban floods, which are important in various neighborhoods of Batatais town. In this case, water reservoirs are installed in rooftops to collect rainwater during storm events, thus reducing rainwater reaching the ground to become runoff. Furthermore, flood control in the urban environment the stored rainwater can be complementary used for sanitary or other purposes [56]. Therefore, the planning and installation of urban and rural rainwater harvesting systems is recommended as active flood-control measure in the studied area, especially in the context of a changing climate [57]. Other measures include non-structural flood management initiatives such as afforestation and restriction of urban development on floodplains. This set of measures has gained recognition in many countries as viable and cost-effective approaches to flood risk management [3,4,7].
For effective soil conservation, flood prone areas require the implementation of multiple complementary measures. Eventually, the most cost-effective measure is the reinforcement of manuring and composting of soil to raise the levels of organic matter [58] and produce stable aggregates that are resistant to detachment by rain drop action. Level plantation is another measure of soil erosion control, frequently used to reduce laminar erosion and increase soil water uptake. Level plantation can be successfully coupled with strip cropping [59] that involves the alternation of forages with strips of row crops, such as sugar cane. The control of soil erosion also comprises implementation of techniques that prevent soil compaction, such as no-tillage treatments [60], maintenance of crop residue to keep organic matter and nutrients in the topsoil, or more costly measures such as terraces in level or gradient since they reduce the ramp length reducing the surface drag of particles and nutrients [14].
The aforementioned measures of soil conservation act indirectly as stream water quality protective measures, because they tend to reduce sediment and nutrient loads transported in runoff. A direct protection of stream water quality from eroded soils and nutrients can be accomplished through creation of buffer strips along stream reaches [61]. Regardless of being a reliable measure to reduce deterioration of stream water quality, there is some debate around the buffer strip width capable to render these filters notable efficiency. For example, the new Forest Code in Brazil (Brazilian Law No. 12.651/12) has defined a minimum width of 30 m for efficient buffer strips, but some recent studies state that the reference should be raised to 50 m, at least [62].
All measures described above are likely to produce the proposed results (flood control and conservation of soil and water) if they can be aggregated as land consolidation–water management (LC-WM) plan capable to realize a multifunctional climate resilient rural area [63]. A decision support system will be required to adequately put this plan into practice [64,65]. Additionally, to be properly planned in the study area local watershed, committees, on which watershed management expectations stand, need to gain legitimacy to become mediators of sectorial and land use policies. To get such legitimacy, these committees need to acquire the status of State public entities offered by Brazilian Law No. 9433/97. Finally, to ensure effective implementation, a LC-WM plan needs to engage local communities, politicians and stakeholders in participatory design approaches [66] to evaluate the rural households’ flood preparedness.

5. Conclusions

The Batatais SP municipality is a flood prone region characterized by environmental land use conflicts. Moderate floods can occur every 1–2 years, while severe floods have occurred every 10 years in this region. Natural flood vulnerability results from abundant precipitation over a territory with contrasting reliefs and altitude ranges. The most sensitive areas in this regard are the lower altitude lands that occupy 289 km2 (34% of the municipal area). Environmental land use conflicts developed because a vast portion of land became occupied by sugar cane plantations, even where land capability (the natural use) advised occupation by native forest vegetation. The conflicts potentiate amplification of flood intensity and inundation levels, because they reduce runoff retention capacity of soils. The study revealed 60% occupation of Batatais SP municipality with areas in environmental land use conflicts. This very large coverage is preoccupying. The study also exposed the situation and alerted for the need to engage state water planners, municipality authorities, and local communities in a process of land consolidation–water management involving a diversity of specific flood control, as well as soil and water conservation measures. The implementation of such plan would constitute a notable contribution to the sustainable use of soil and water resources in the region, with unquestionable benefits for the environment and Batatais society.

Author Contributions

A.M.C. contributed data curation, investigation, conceptualization, methodology, and writing original draft; T.C.T.P. and F.C.R.N. contributed to formal analysis, supervision, project administration and funding acquisition; M.Z. and R.d.B.V.P. contributed to resources and formal analysis; R.C.A.C. contributed to software and visualization; F.A.L.P. and L.F.S.F. contributed to formal analysis, validation, writing-review, editing, and funding acquisition.

Funding

As regards the Portuguese authors, the research was funded by national funds (FCT-Portuguese Foundation for Science and Technology) under the strategic project of the Vila Real Chemistry Research Center (PEst-OE/QUI/UI0616) and the CITAB (Centre for the Research and Technology of Agro-Environmental and Biological Sciences) project UID/AGR/04033.

Acknowledgments

The Brazilian authors wish to thank the São Paulo State University (Unesp)/School of Agricultural and Veterinarian Sciences, Campus Jaboticabal, São Paulo, Brazil; the CAPES—Coordenação de Aperfeiçoamento de Pessoal de Nível Superior; and the CNPq—Conselho Nacional de Desenvolvimento Científico e Tecnológico IF—Instituto Florestal, São Paulo, Brazil. The authors also wish to thank the University of Trás-Montes and Alto Douro (UTAD), the Chemistry Research Center and the Center for the Research and Technology of Agro-Enviromental and Biological Sciences (CITAB), for technical support.

Conflicts of Interest

The authors declare no conflicts of interest.

References

  1. Alfieri, L.; Cohen, S.; Galantowicz, J.; Schumann, G.J.; Trigg, M.A.; Zsoter, E.; Rudari, R. A global network for operational flood risk reduction. Environ. Sci. Policy 2018, 84, 149–158. [Google Scholar] [CrossRef]
  2. Erdlenbruch, K.; Grelot, F. Economic Assessment of flood prevention projects. Floods 2017, 2-Risk Management, 321–335. [Google Scholar]
  3. DAEE—Departamento de Águas e Energia Elétrica. Caracterização dos Recursos Hídricos do Estado de São Paulo; Departamento de Águas e Energia Elétrica: Centro, São Paulo, 1984. [Google Scholar]
  4. Libardi, P.L. Dinâmica da água no Solo; Editora da Universidade de São Paulo: São Paulo, Brazil, 2005. [Google Scholar]
  5. Samu, R.; Kentel, A.S. An Analysis of the Flood Management and Mitigation Measures in Zimbabwe for a Sustainable Future. Int. J. Disaster Risk Reduct. 2018, 31, 691–697. [Google Scholar] [CrossRef]
  6. Solín, Ľ.M.; Sládeková, M.; Michaleje, L. Vulnerability assessment of households and its possible reflection in flood risk management: The case of the upper Myjava basin, Slovakia. Int. J. Disaster Risk Reduct. 2018, 28, 640–652. [Google Scholar]
  7. Shaw, S.B.; Marrs, J.; Bhattarai, N.; Quackenbusch, L. Longitudinal study of the impacts of land cover change on hydrologic response in four mesoscale watersheds in New York State, USA. J. Hydrol. 2014, 519, 12–22. [Google Scholar] [CrossRef]
  8. Ramos, M.C.; Martínez-Casasnovas, J.A. Nutrient losses from a vineyard soil in Northeastern Spain caused by an extraordinary rainfall event. Catena 2004, 55, 79–90. [Google Scholar] [CrossRef]
  9. Marques, M.J.; García-Muñoz, S.; Muñoz-Organero, G.; Bienes, R. Soil conservation beneath grass cover in hillside vineyards under mediterranean climatic conditions (Madrid, Spain). Land Degrad. Dev. 2010, 21, 122–131. [Google Scholar] [CrossRef]
  10. Bagagiolo, G.; Biddoccu, M.; Rabino, D.; Cavallo, E. Effects of rows arrangement, soil management, and rainfall characteristics on water and soil losses in Italian sloping vineyards. Environ. Res. 2008, 166, 690–704. [Google Scholar] [CrossRef] [PubMed]
  11. Novara, A.; Gristina, L.; Saladino, S.S.; Santoro, A.; Cerdà, A. Soil erosion assessment on tillage and alternative soil managements in a Sicilian Vineyard. Soil Tillage Res. 2011, 117, 140–147. [Google Scholar] [CrossRef] [Green Version]
  12. Blavet, D.; De Noni, G.; Le Bissonnais, Y.; Leonard, M.; Maillo, L.; Laurent, J.Y.; Asseline, J.; Leprun, J.C.; Arshad, M.A.; Roose, E. Effect of land use and management on the early stages of soil water erosion in French Mediterranean vineyards. Soil Tillage Res. 2009, 106, 124–136. [Google Scholar] [CrossRef]
  13. Brown, G.; Raymond, C.M. Methods for identifying land use conflict potential using participatory mapping. Landsc. Urban Plan. 2013, 122, 196–208. [Google Scholar] [CrossRef]
  14. Pacheco, F.A.L.; Varandas, S.G.P.; Sanches Fernandes, L.F.; Valle Junior, R.F. Soil losses in rural watersheds with environmental land use conflicts. Sci. Total Environ. 2014, 485–486C, 110–120. [Google Scholar] [CrossRef] [PubMed]
  15. Valle Junior, R.F.; Varandas, S.G.P.; Sanches Fernandes, L.F.; Pacheco, F.A.L. Environmental land use conflicts: A threat to soil conservation. Land Use Policy 2014, 41, 172–185. [Google Scholar] [CrossRef]
  16. Calzolari, C.; Ungaro, F. Predicting shallow water table depth at regional scale from rainfall and soil data. J. Hydrol. 2012, 414, 374–387. [Google Scholar] [CrossRef]
  17. Chan, F.K.S.; Chuah, C.J.; Ziegler, A.D.; Dąbrowski, M.; Varis, O. Towards resilient flood risk management for Asian coastal cities: Lessons learned from Hong Kong and Singapore. J. Clean. Prod. 2018, 187, 576–589. [Google Scholar] [CrossRef]
  18. Wadt, P.G.S.; Frade, E.F.; Marcolan, A.L. A relação pesquisa e extensão na Amazônia. Boletim da Sociedade Brasileira de Ciência do Solo Viçosa 2012, 37, 42–47. [Google Scholar]
  19. Erdlenbruch, K.; Bonté, B. Simulating the dynamics of individual adaptation to floods. Environ. Sci. Policy 2018, 84, 134–148. [Google Scholar] [CrossRef]
  20. Ehsanzadeh, E.; Spence, C.; van der Kamp, G.; Mcconkey, B. On the behaviour of dynamic contributing areas and flood frequency curves in North American Prairie watersheds. J. Hydrol. 2012, 414, 364–373. [Google Scholar] [CrossRef]
  21. Rudari, R.; Gabellani, S.; Delogu, F. A simple model to map areas prone to surface water flooding. Int. J. Disaster Risk Reduct. 2014, 10, 428–441. [Google Scholar] [CrossRef]
  22. Bodoque, J.M.; Díez-herrero, A.; Eguibar, M.A.; Benito, G.; Ruiz-Villanueva, V.; Ballesteros-Cánovas, J.A. Challenges in paleoflood hydrology applied to risk analysis in mountainous watersheds—A review. J. Hydrol. 2015, 529, 449–467. [Google Scholar] [CrossRef]
  23. Valle Junior, R.F. Diagnóstico de Áreas de Risco de erosão e Conflito de uso dos Solos na Bacia do rio Uberaba. Ph.D. Thesis, Agronomy, State University of São Paulo, Faculty of Agrarian and Veterinary Sciences, Jaboticabal, Brazil, 2008; 70p. [Google Scholar]
  24. IBGE—INstituto Brasileiro de Geografia E Estatística. Levantamento Sistemático da Produção Agrícola; INstituto Brasileiro de Geografia E Estatística: Rio de Janeiro, Brazil, 2012; Volume 25, pp. 1–88. [Google Scholar]
  25. Zanata, M.; Pissarra, T.C.T. (Coord.). In formações Básicas Para o Planejamento Ambiental; Município de Batatais. Jaboticabal: Funep, Brazil, 2012; 70p. [Google Scholar]
  26. Siqueira, H.E.; Pissarra, T.C.T.; Valle Junior, R.F.; Fernandes, L.F.S.; Pacheco, F.A.L. A multi criteria analog model for assessing the vulnerability of rural catchments to road spills of hazardous substances. Environ. Impact Assess. Rev. 2017, 64, 26–36. [Google Scholar] [CrossRef]
  27. Machado, E.R.; Valle Júnior, R.F.; Sanches Fernandes, L.F.; Pacheco, F.A.L. The vulnerability of the environment to spills of dangerous substances on highways: A diagnosis based on Multi Criteria Modeling. Transp. Res. Part D 2018, 62, 748–759. [Google Scholar] [CrossRef]
  28. FAO—Food and Agriculture Organization. World Reference Base for Soil Resources. International Soil Classification System for Naming Soils and Creating Legends for Soil Maps; World Soil Resources Reports No. 106; Food and Agriculture Organization: Rome, Italy, 2015. [Google Scholar]
  29. Saaty, T.L. Decision making with the analytic hierarchy process. Int. J. Serv. Sci. 2008, 1, 83–98. [Google Scholar] [CrossRef]
  30. Alonso, J.A.; Lamata, M.T. Consistency in the analytic hierarchy process: A new approach. Int. J. Uncertain. Fuzziness Knowl.-Based Syst. 2006, 14, 445–459. [Google Scholar] [CrossRef]
  31. Valera, C.A.; Valle Junior, R.F.; Varandas, S.G.P.; Sanches Fernandes, L.F.; Pacheco, F.A.L. The role of environmental land use conflicts in soil fertility: A study on the Uberaba River basin, Brazil. Sci. Total Environ. 2016, 562, 463–473. [Google Scholar] [CrossRef] [PubMed]
  32. Chau, V.N.; Holland, J.; Cassells, S.; Tuohy, M. Using GIS to map impacts upon agriculture from extreme floods in Vietnam. Appl. Geogr. 2013, 41, 65–74. [Google Scholar] [CrossRef]
  33. Raza Zaidi, S.M.; Saeed, A.; Shahid, S.M.; Ali, N. Impact of flood on sugarcane industry of Pakistan. Interdiscip. J. Contemp. Res. Bus. 2013, 4, 92–105. [Google Scholar]
  34. Zhang, Q.; Gu, X.; Singh, V.P.; Liu, L.; Kong, D. Flood-induced agricultural loss across China and impacts from climate indices. Glob. Planet. Chang. 2016, 139, 31–43. [Google Scholar] [CrossRef] [Green Version]
  35. Nga, P.H.; Takara, K.; Van, N.C. Integrated approach to analyze the total flood risk for agriculture: The significance of intangible damages—A case study in Central Vietnam. Int. J. Disaster Risk Reduct. 2018, 31, 862–872. [Google Scholar] [CrossRef]
  36. Wu, F.; Sun, Y.; Sun, Z.; Wu, S.; Wu, Q.Z.F.; Sun, Y.; Sun, Z.; Wu, S.; Zhang, Q. Assessing agricultural system vulnerability to floods: A hybrid approach using emergy and a landscape fragmentation index. Ecol. Indic. 2017, in press. [Google Scholar] [CrossRef]
  37. Adger, W.N.; Quinn, T.; Lorenzoni, I.; Murphy, C.; Sweeney, J. Changing social contracts in climate-change adaptation. Nat. Clim. Chang. 2013, 3, 330–333. [Google Scholar] [CrossRef] [Green Version]
  38. Dankers, R.; Arnell, N.W.; Clark, D.B.; Falloon, P.D.; Fekete, B.M.; Gosling, S.N.; Heinke, J.; Kim, H.; Masaki, Y.; Satoh, Y.; et al. First look at changes in flood hazard in the Inter-Sectoral Impact Model Intercomparison Project ensemble. Proc. Natl. Acad. Sci. USA 2014, 111, 3257–3261. [Google Scholar] [CrossRef] [PubMed]
  39. O’connell, P.; Ewen, J.; O’donnell, G.; Quinn, P. Is there a link between agricultural land-use management and flooding? Hydrol. Earth Syst. Sci. 2007, 11, 96–107. [Google Scholar] [CrossRef]
  40. Pattison, I.; Lane, S.N. The link between land-use management and fluvial flood risk: A chaotic conception? Prog. Phys. Geogr. 2011, 30. [Google Scholar] [CrossRef] [Green Version]
  41. Lee, Y.; Brody, S.D. Examining the impact of land use on flood losses in Seoul, Korea. Land Use Policy 2018, 70, 500–509. [Google Scholar] [CrossRef]
  42. EEA (European Environment Agency). Flood Risks and Environmental Vulnerability—Exploring the Synergies Between Floodplain Restoration, Water Policies and Thematic Policies; EEA Rep. No. 1/2016; European Environment Agency: Copenhagen, Denmark; Publications Office of the European Union: Luxembourg, 2016; ISSN 1977-8449. [Google Scholar]
  43. Akter, T.; Quevauviller, P.; Eisenreich, S.J.; Vaes, G. Impacts of climate and land use changes on flood risk management for the Schijn River, Belgium. Environ. Sci. Policy 2018, 89, 163–175. [Google Scholar] [CrossRef]
  44. Pacheco, F.A.L.; Sanches Fernandes, L.F. Environmental land use conflicts in catchments: A major cause of amplified nitrate in river water. Sci. Total Environ. 2016, 548–549, 173–188. [Google Scholar] [CrossRef] [PubMed]
  45. Valle Junior, R.F.; Varandas, S.G.P.; Sanches Fernandes, L.F.; Pacheco, F.A.L. Groundwater quality in rural watersheds with environmental land use conflicts. Sci. Total Environ. 2014, 493, 812–827. [Google Scholar] [PubMed]
  46. Valle Junior, R.F.; Varandas, S.G.P.; Pacheco, F.A.L.; Pereira, V.R.; Santos, C.F.; Cortes, R.M.V.; Fernandes, L.F.S. Impacts of land use conflicts on riverine ecosystems. Land Use Policy 2015, 43, 48–62. [Google Scholar] [Green Version]
  47. Pacheco, F.A.L.; Sanches Fernandes, L.F.; Valle Junior, R.F.; Pissarra, T.C.T.; Valera, C.A. Land degradation: Multiple environmental consequences and routes to neutrality. Curr. Opin. Environ. Sci. Health 2018, 5, 79–86. [Google Scholar] [CrossRef]
  48. Sutton, P.C.; Anderson, S.J.; Costanza, R.; Kubiszewski, I. The ecological economics of land degradation: Impacts on ecosystem service values. Ecol. Econ. 2016, 129, 182–192. [Google Scholar] [CrossRef]
  49. Valera, C.A.; Pissarra, T.C.T.; Martins Filho, M.V.; Valle Junior, R.F.; Sanches Fernandes, L.F.; Pacheco, F.A.L. A legal framework with scientific basis for applying the ‘polluter pays principle’ to soil conservation in rural watersheds in Brazil. Land Use Policy 2017, 66, 61–71. [Google Scholar] [CrossRef]
  50. González-Arqueros, M.L.; Mendoza, M.E.; Bocco, G.; Castillo, B.S. Flood susceptibility in rural settlements in remote zones: The case of a mountainous basin in the Sierra-Costa region of Michoacán, Mexico. J. Environ. Manag. 2018, 223, 685–693. [Google Scholar] [CrossRef] [PubMed]
  51. Mahmoud, S.H.; Gan, T.Y. Multi-criteria approach to develop flood susceptibility maps in arid regions of Middle East. J. Clean. Prod. 2018, 196, 216–229. [Google Scholar] [CrossRef]
  52. Bellu, A.; Sanches Fernandes, L.F.; Cortes, R.M.V.; Pacheco, F.A.L. A framework model for the dimensioning and allocation of a detention basin system: The case of a flood-prone mountainous watershed. J. Hydrol. 2016, 533, 567–580. [Google Scholar] [CrossRef]
  53. Santos, R.M.B.; Sanches Fernandes, L.F.; Cortes, R.M.V.; Varandas, S.G.P.; Jesus, J.J.B.; Pacheco, F.A.L. Integrative assessment of river damming impacts on aquatic fauna in a Portuguese reservoir. Sci. Total Environ. 2017, 601–602, 1108–1118. [Google Scholar] [CrossRef] [PubMed]
  54. Terêncio, D.P.S.; Sanches Fernandes, L.F.; Cortes, R.M.V.; Pacheco, F.A.L. Improved framework model to allocate optimal rainwater harvesting sites in small watersheds for agro-forestry uses. J. Hydrol. 2017, 550, 318–330. [Google Scholar] [CrossRef]
  55. Terêncio, D.P.S.; Sanches Fernandes, L.F.; Cortes, R.M.V.; Moura, J.P.; Pacheco, F.A.L. Rainwater harvesting in catchments for agro-forestry uses: A study focused on the balance between sustainability values and storage capacity. Sci. Total Environ. 2018, 613–614, 1079–1092. [Google Scholar] [CrossRef] [PubMed]
  56. Sanches Fernandes, L.F.; Terêncio, D.P.S.; Pacheco, F.A.L. Rainwater harvesting systems for low demanding applications. Sci. Total Environ. 2015, 529, 91–100. [Google Scholar] [CrossRef] [PubMed]
  57. Sanches Fernandes, L.F.; Pereira, M.G.; Morgado, S.G.; Macário, E.B. Influence of Climate Change on the Design of Retention Basins in Northeastern Portugal. Water 2018, 10, 743. [Google Scholar] [CrossRef]
  58. Damodar Reddy, D.; Subba Rao, A.; Rupa, T.R. Effects of continuous use of cattle manure and fertilizer phosphorus on crop yields and soil organic phosphorus in a vertisol. Bioresour. Technol. 2000, 75, 113–118. [Google Scholar] [CrossRef]
  59. Lenka, N.K.; Satapathy, K.K.; Lal, R.; Singh, R.K.; Singh, N.A.K.; Agrawal, P.K.; Choudhury, P.; Rathore, A. Weed strip management for minimizing soil erosion and enhancing productivity in the sloping lands of north-eastern India. Soil Tillage Res. 2017, 170, 104–113. [Google Scholar] [CrossRef]
  60. Bogunovic, I.; Pereira, P.; Kisic, I.; Sajko, K.; Sraka, M. Tillage management impacts on soil compaction, erosion and crop yield in Stagnosols (Croatia). Catena 2018, 160, 376–384. [Google Scholar] [CrossRef]
  61. Alemu, T.; Bahrndorff, S.; Alemayehu, E.; Ambelu, A. Agricultural sediment reduction using natural herbaceous buffer strips: A case study of the east African highland. Water Environ. J. 2017, 31, 522–527. [Google Scholar] [CrossRef]
  62. Valera, C.A. Avaliação do Novo Código Florestal: As Áreas de Preservação Permanente—APPS, e a Conservação da Qualidade do solo e da água Superficial. Ph.D. Thesis, Universidade Estadual Paulista “Júlio De Mesquita Filho” (UNESP), Faculdade De Ciências Agrárias E Veterinárias Câmpus De Jaboticabal, Jaboticabal, Brazil, 2017; 135p. (In Portuguese). [Google Scholar]
  63. Stańczuk-Gałwiaczek, M.; Sobolewska-Mikulska, K.; Henk Ritzema, H.; Van Loon-Steensma, J.M. Integration of water management and land consolidation in rural areas to adapt to climate change: Experiences from Poland and the Netherlands. Land Use Policy 2018, 77, 498–511. [Google Scholar] [CrossRef]
  64. Sanches Fernandes, L.F.; Marques, M.J.; Oliveira, P.C.; Moura, J.P. Decision support systems in water resources in the demarcated region of Douro—Case study in Pinhão River Basin, Portugal. Water Environ. J. 2014, 28, 350–357. [Google Scholar]
  65. Sanches Fernandes, L.F.; Santos, C.; Pereira, A.; Moura, J. Model of management and decision support systems in the distribution of water for consumption: Case study in North Portugal. Eur. J. Environ. Civ. Eng. 2011, 15, 411–426. [Google Scholar]
  66. Monde Patrina Mabuku, M.P.; Senzanje, A.; Mudhara, M.; Jewitt, G.; Mulwafu, W. Rural households’ flood preparedness and social determinants in Mwandi district of Zambia and Eastern Zambezi Region of Namibia. Int. J. Disaster Risk Reduct. 2018, 28, 284–297. [Google Scholar] [CrossRef]
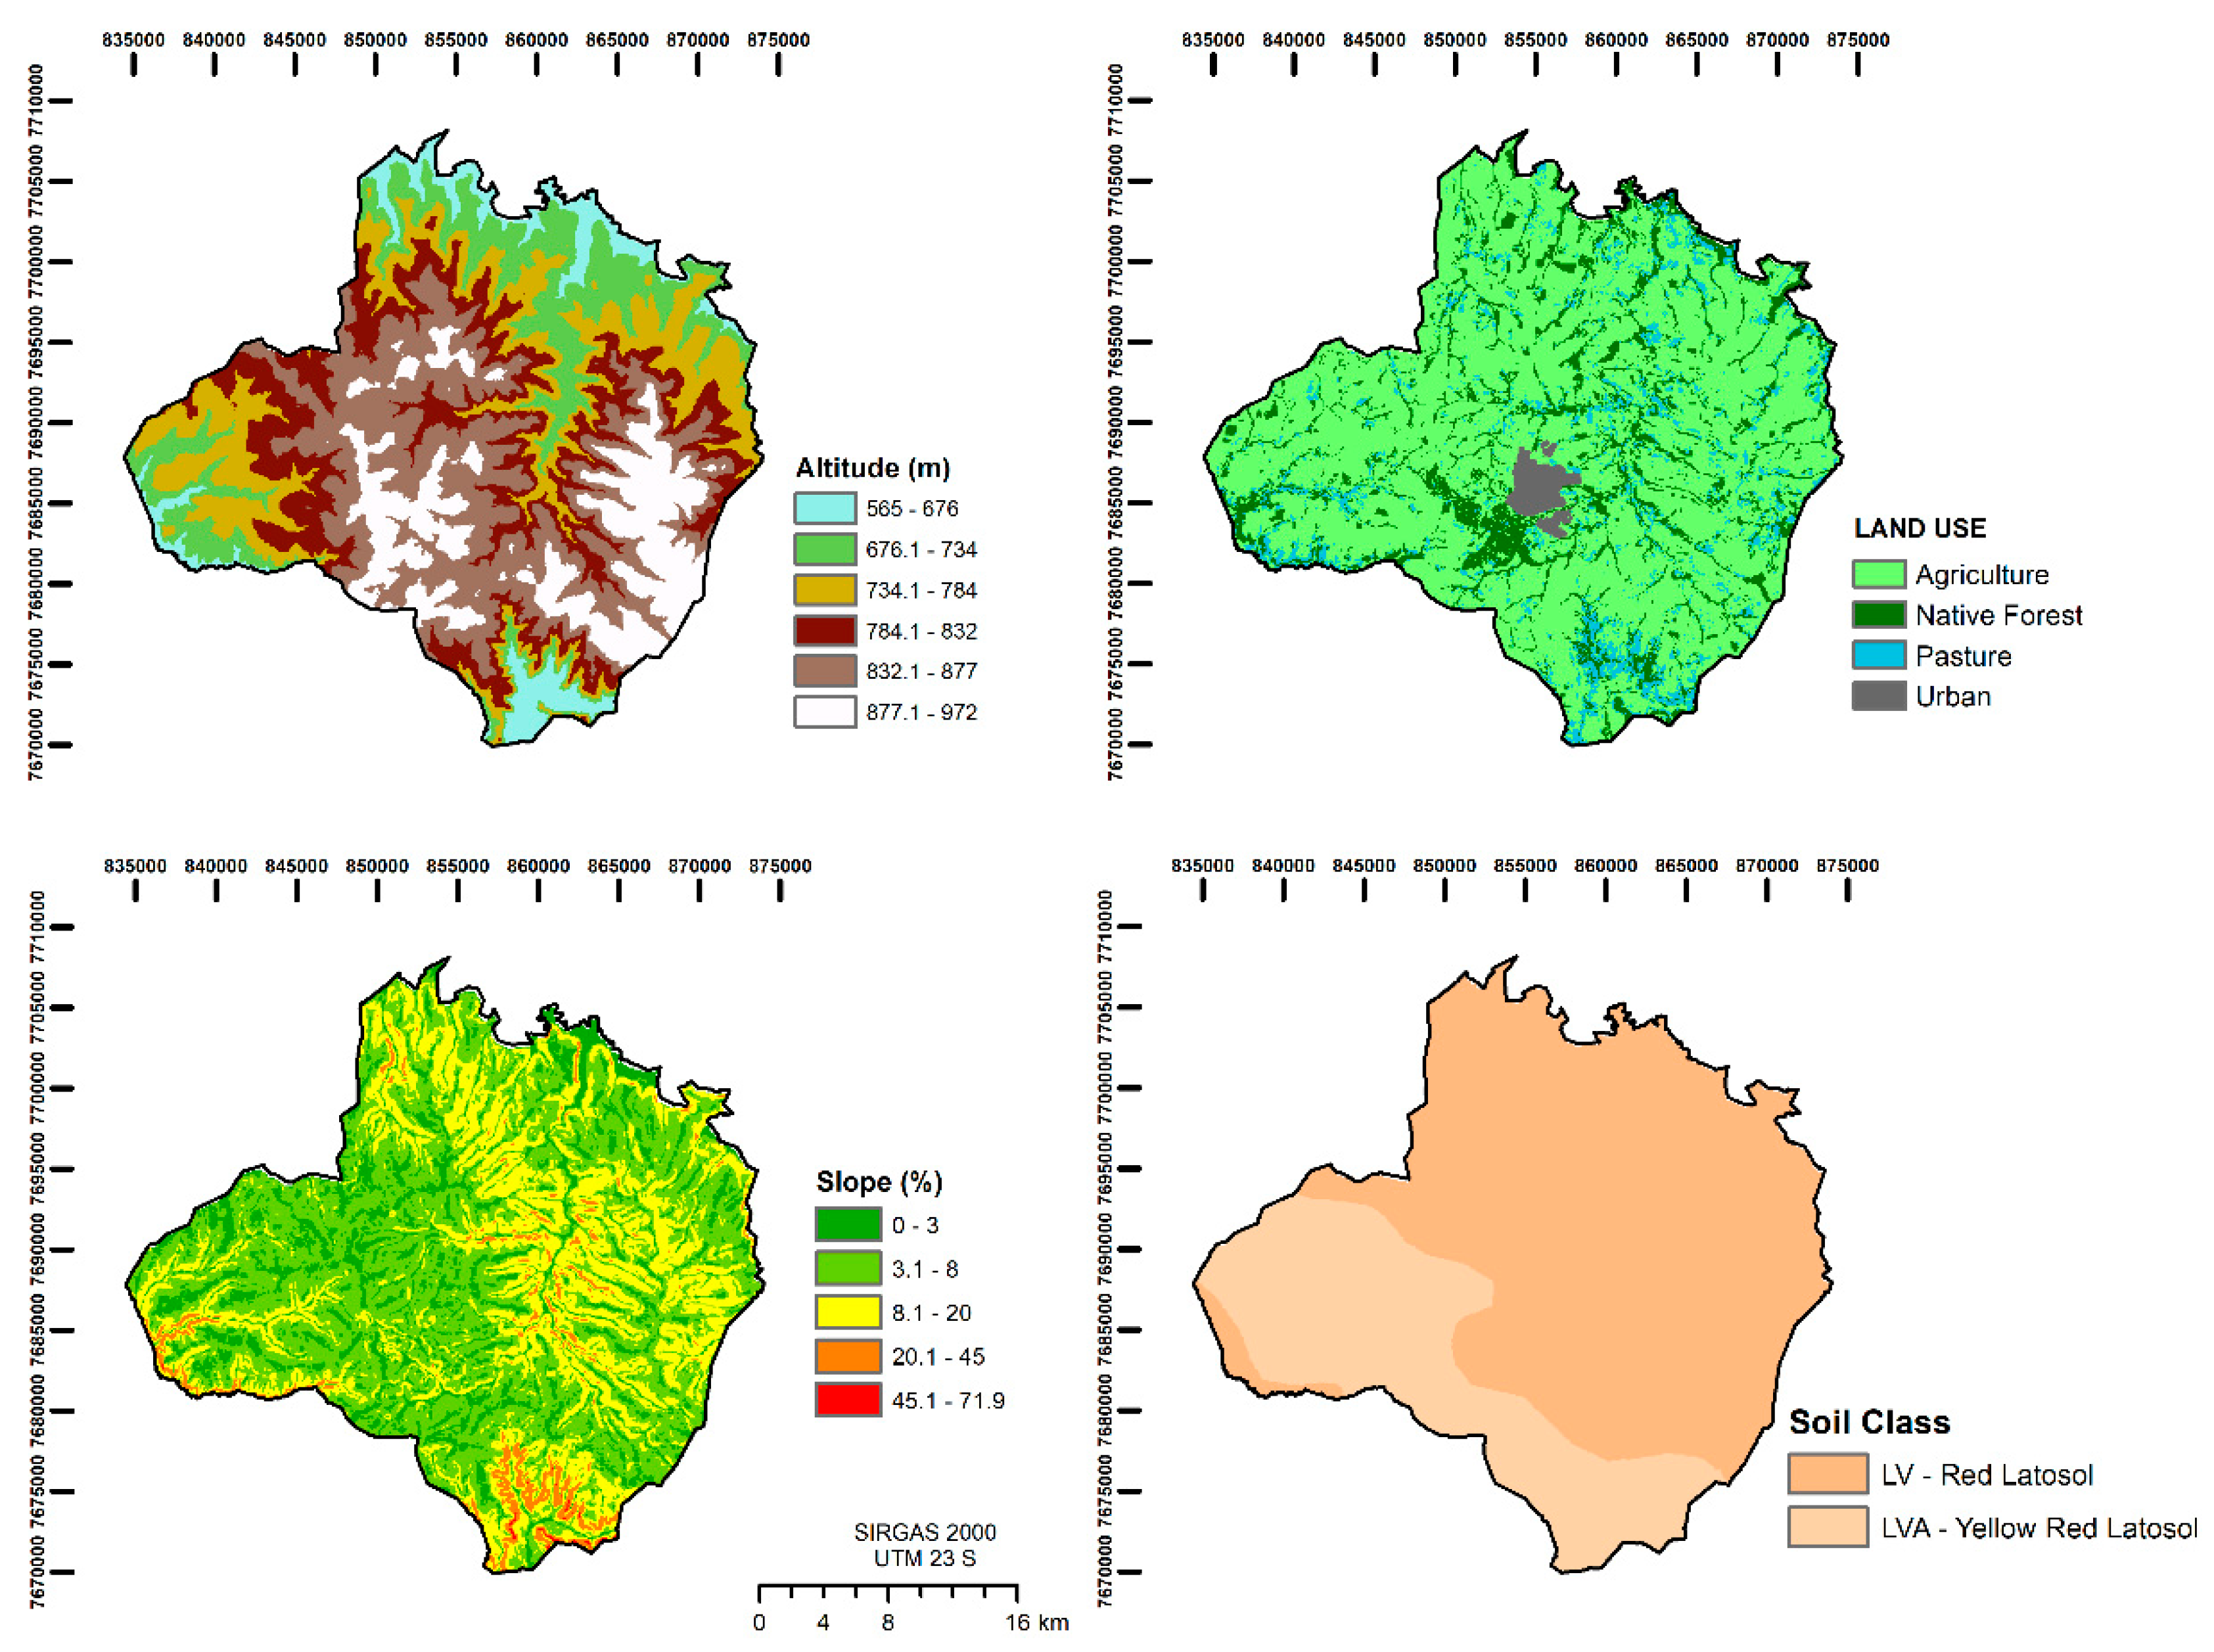
Figure 1. Study area, municipality of Batatais, São Paulo State, Brazil.
Water 10 01357 g001
Figure 2. Precipitation records of Batatais State Forest Station relative to period 1970–2017 (red and blue lines), and associated increase trends (dashed black lines). The labels close to blue line peaks refer to precipitations at reported major flood events. The daily precipitation of 174 mm occurred in 29 January 2008 and provoked a severe flood in Batatais.
Water 10 01357 g002
Figure 3. Illustration of 29 January 2008 severe flood in the Batatais town.
Water 10 01357 g003
Figure 4. Maps of environmental attributes within the municipality of Batatais SP.
Water 10 01357 g004
Figure 5. Flood vulnerability map of Batatais SP municipality.
Water 10 01357 g005
Figure 6. Map of land use conflicts within the Batatais municipality.
Water 10 01357 g006
Figure 7. Pareto diagram illustrating the frequency of land use conflict versus flood vulnerability classes in the municipality of Batatais SP.
Water 10 01357 g007
Figure 8. Pareto diagram illustrating the frequency of land use conflict versus flood vulnerability classes in the municipality of Batatais SP.
Water 10 01357 g008
Table 1. Reclassification of environmental attributes according to their flood susceptibility. The source for the soil classes is [28].
Altitude Attribute
Classes (m)RatingRank
565–676107
676–7347
734–7846
784–8324
832–8773
877–9721
Land Use Attribute
ClassesRatingRank
Urban105
Pasture9
Agriculture8
Native Forest1
Slope Attribute
Classes (%)RatingRank
0–393
3–88
8–207
20–455
45–751
> 751
Soil Class Attribute
ClassesRatingRank
Red latosols41
Yellow-red latosols3
Table 2. The fundamental scale of absolute numbers, according to [29].
ImportanceDefinitionExplanation
1Equal importanceTwo activities contribute equally to the objective
2Weak or slight
3Moderate importanceExperience and judgment slightly favor one activity over another
4Moderate plus
5Strong importanceExperience and judgment strongly favor one activity over another
6Strong plus
7Very strong or demonstrated importanceAn activity is favored very strongly over another; its dominance demonstrated in practice
8Very, very strong
9Extreme importanceThe evidence favoring one activity over another is of the highest order of affirmation
Reciprocals of aboveIf the activity i has one of the above non-zero numbers assigned to it when compared with activity j, then j has the reciprocal value when compared with i
1.1–1.9If the activities are very closeMay be difficult to assign the best value but when compared with other contrasting activities the size of the small numbers would not be too noticeable, yet they can still indicate the relative importance of the activities.
Table 3. Pairwise comparison matrix based on the attribute ranks listed in the last column of Table 1.
AttributesSoilSlopeLand UseAltitude
Soil11/31/51/7
Slope311/31/5
Land Use5311/3
Altitude7531
Table 4. AHP to obtain the attribute weights. The values under the heading of each attribute represent bij scores calculated by Equation (1). In these columns, the nominator values to the left of the equal sign are aij scores transported from Table 3, while the corresponding denominator values represent the sum of nominator values. The attribute weights (w) are depicted in the last column. They result from application of Equation (2) to the bij scores calculated previously.
AttributesSoilSlopeLand UseAltitudeWeight (w)
Soil1/16 = 0.06250.33/9.33 = 0.03570.20/4.53 = 0.04410.14/1.68 = 0.08520.0553
Slope3/16 = 0.18751/9.33 = 0.10750.33/4.53 = 0.07350.20/1.68 = 0.11930.1175
Land Use5/16 = 0.31253/9.33 = 0.32141/4.53 = 0.22060.33/1.68 = 0.19880.2622
Altitude7/16 = 0.43755/9.33 = 0.53573/4.53 = 0.66181/1.68 = 0.59660.5650
Table 5. Quantification of flood vulnerability areas within the municipality of Batatais SP, as function of vulnerability class. The spatial incidence of vulnerability classes is represented in Figure 5.
Vulnerability ClassArea of Incidence
(km2)
Percentage of Municipal Area
(%)
Very low20.312.39
Low152.7717.95
Medium388.9245.70
High249.5729.33
Very High39.454.64
Total851100
Table 6. Cross-classification of land use conflict and flood vulnerability in the municipality of Batatais SP. The grey shaded cells represent concern situations because they combine medium to very high flood vulnerability and land use conflict.
Land Use ConflictFlood vulnerabilityTotal
Very lowLowMediumHighVery High
km2%km2%km2%km2%km2%km2%
Class 12.560.5733.667.44114.0725.2167.9715.025.781.28273.5632.2
Class 22.790.6231.276.9160.2313.3114.923.34.931.09139.3716.4
Class 31.730.3813.342.9561.0213.4923.875.2814.333.17139.5616.4
Table 7. Cross-classification of land use and flood vulnerability in the municipality of Batatais SP. The grey shaded cells represent concern situations because they correspond to medium and high flood vulnerability over large agricultural areas.
Land UseFlood VulnerabilityTotal
Very LowLowMediumHighVery High
km2%km2%km2%km2%km2%km2%
Agriculture3.40.4112.4713.22315.637.09201.223.6426.973.17659.6477.5
Forest13.631.631.393.6944.095.1825.933.054.290.5119.3314.0
Pasture1.360.165.170.6116.041.8823.632.788.140.9654.346.4
Urban001.390.1615.131.781.160.140017.682.1

