Article

Mechanochemical Reactions of Lithium Niobate Induced by High-Energy Ball-Milling

1
Wigner Research Centre for Physics, Hungarian Academy of Sciences, Konkoly-Thege Miklós út 29-33, 1121 Budapest, Hungary
2
Hevesy György PhD School of Chemistry, Eötvös Loránd University, Pázmány Péter sétány 1/A, 1117 Budapest, Hungary
3
Department of Materials Physics, Eötvös Loránd University, Pázmány Péter sétány 1/A, 1117 Budapest, Hungary
*
Author to whom correspondence should be addressed.
Crystals 2019, 9(7), 334; https://doi.org/10.3390/cryst9070334
Submission received: 24 May 2019 / Revised: 26 June 2019 / Accepted: 26 June 2019 / Published: 28 June 2019
(This article belongs to the Special Issue Recent Progress in Lithium Niobate)

Abstract

:
Lithium niobate (LiNbO3, LN) nanocrystals were prepared by ball-milling of the crucible residue of a Czochralski grown congruent single crystal, using a Spex 8000 Mixer Mill with different types of vials (stainless steel, alumina, tungsten carbide) and various milling parameters. Dynamic light scattering and powder X-ray diffraction were used to determine the achieved particle and grain sizes, respectively. Possible contamination from the vials was checked by energy-dispersive X-ray spectroscopy measurements. Milling resulted in sample darkening due to mechanochemical reduction of Nb (V) via polaron and bipolaron formation, oxygen release and Li2O segregation, while subsequent oxidizing heat-treatments recovered the white color with the evaporation of Li2O and crystallization of a LiNb3O8 phase instead. The phase transformations occurring during both the grinding and the post-grinding heat treatments were studied by Raman spectroscopy, X-ray diffraction and optical reflection measurement, while the Li2O content of the as-ground samples was quantitatively measured by coulometric titration.

1. Introduction

Lithium niobate (LN, LiNbO3) crystals have countless non-linear optical and acoustic applications due to their versatile optical and ferroelectric properties. In recent decades nanocrystalline materials have attracted considerable interest as their properties greatly differ from their coarse-grained counterparts. The reduction of the grain size may cause, e.g., increased mechanical strength, higher specific heat and larger electrical resistivity [1]. Nonlinear optical nanocrystals may have many applications such as building blocks of coherent subwavelength light sources [2,3,4,5,6] and nonresonant markers in second harmonic generation microscopy [4,7,8]. Rare-earth-doped LN nanocrystals could play an important role in coherent quantum optical experiments, e.g., as single photon sources, providing sharply defined wavelengths [9,10].
Many wet chemical synthesis methods are known for the preparation of nanocrystalline materials. In these methods, nanocrystals are assembled from single atoms or molecules (bottom-up methods). The other way to prepare dispersed nanograined material is to reduce the particle size by mechanical grinding (top-down method). High-energy ball-milling is one of these methods. This is a simple, general and easy-handling technique for nanocrystal preparation, while another advantage of this method is the possibility to produce large quantities of nanopowders. However, it is known that mechanical grinding may also induce phase transformations and chemical reactions beside particle and grain size reduction [11,12,13,14]. An example for a phase transformation without composition change was the occurrence of various phases in ball-milled TiO2 (rutile, anatase and srilankite) whereas the starting material contained a single phase only [11,15]. The mechanochemical transformation can also be used for the synthesis of nanocrystals, as it was demonstrated by grinding a (1−x)Li2O: xB2O3 mixture resulting in the formation of Li2B4O7 [15].
Ball-milling was proved to be a successful method also for the preparation of lithium niobate. De Figueiredo et al. reported that ball-milling of Li2CO3 and Nb2O5 resulted in the formation of LiNbO3, but non-reacted starter materials also remained in the milled powder [16]. Pure LiNbO3 can still be prepared by mechanochemical methods if the milling process is followed by calcination at high temperature [17,18,19].
High-energy ball-milling was used in several works to produce nano-LN. Spex Mixer Mill 8000 is one of the most commonly used ball mills for this purpose. In general, dry grinding with one ball with a diameter of around 1 cm was used in these processes with grinding times as long as 5–20 h [13,15,20,21,22] and even longer than 100 h [23]. At the beginning, the grain size rapidly decreased with increasing grinding time as determined by X-ray diffraction measurements. Five and 20 h of grinding resulted in grain sizes of about 60 and 20 nm, respectively, but longer ball-milling did not decrease the grain size considerably. It should be noted that the grain size deduced from X-ray diffraction data is informative for the coherently scattering domains but does not characterize the size of the particles obtained.
Pooley and Chadwick reported that the sample ball-milled for five hours in a stainless steel vial contained a significant amount of amorphous material [13] and traces of iron [20]. Other experiments also proved that contamination from the vial’s material may appear: a sample ball-milled for 16 h in an alumina vial contained 5% of alumina [22]. In these reports, however, there is no further information about whether either a phase transformation or any mechanochemical reaction occurred.
The aim of the present work is a systematic characterization of LN nanocrystals prepared by high-energy ball-milling. For the sake of simplicity, small pieces of the residue of Czochralski-grown single crystals with identical purity are used as starting material, since the milling experiments did not require large, perfect single crystalline LN. Besides the determination of both particle and grain sizes and contamination from the vial’s material, the possible phase transformation and structural changes induced by the mechanochemical process are also studied using dynamic light scattering (DLS), powder X-ray diffraction (pXRD), energy-dispersive X-ray spectroscopy (EDS), Raman spectroscopy, optical diffuse reflectance measurements and coulometric acid-base titration.

2. Materials and Methods

2.1. Sample Preparation

Lithium niobate was prepared by solid-state reaction at 800 °C from Li2CO3 (Merck, Darmstadt, Germany, Suprapur, 99.99%) and Nb2O5 (Starck, Goslar, Germany, LN grade, 99.99%) raw materials by mixing them in the congruent 48.6:51.4 molar ratio. These high-purity materials contain impurities such as Fe, Al, W, relevant in our studies, in concentrations less than 1–2 ppm. Water-clear single crystals of congruent composition have been grown from platinum crucible by the Czochralski method, leaving the crucible residue also congruent and of single phase. LiNbO3 nanocrystals were prepared from such polycrystalline crucible residue slowly cooled down to room temperature. Pieces of sizes of several millimeters were selected and ball-milled, using a Spex 8000 Mixer Mill (Metuchen, NJ, USA). Dry ball-milling was carried out using different types of vials and balls (SS: stainless steel, ALO: alumina, WC: tungsten carbide). The grinding time was 5 or 20 h with interruptions of 30 min after every hour of grinding to avoid overheating (the ball mill was not equipped with a temperature sensor). Further milling parameters are given in Table 1. During the milling process and thereafter the samples were kept in air (no protecting atmosphere was used).
After the milling process, some samples showed greyish coloration usually observed for LN single crystals after reduction (i.e., decomposition with oxygen release and a concomitant formation of Nb (IV) in the lattice). This indicates that the samples underwent a change concerning the oxidation state of niobium during the grinding process. For this reason, annealing was applied for restoring or modifying the oxidation state of niobium in the ground samples. Annealing treatments in either oxidative or non-oxidative atmospheres were performed for 3 h at 800 °C in either air or in vacuum of about 10−4 mbar, respectively. Samples were put into the furnace in a form so that any possible reaction between the material and its containment could be avoided. Powder samples were held in a platinum crucible for the oxidative treatments, while pellets were placed on a platinum plate inside the quartz tube used for evacuation in the case of the application of non-oxidative conditions. Samples subjected to one of these annealings will be called hereafter oxidized and reduced samples. Oxidized-reduced and reduced-oxidized samples underwent two subsequent heat treatment processes separated by periods long enough to let the samples cool down to room temperature. This way, a series of five differently treated samples was obtained for each vial material (see Scheme 1).

2.2. Sample Characterization

The phase analysis of the samples was carried out by X-ray diffraction (XRD) using a Rigaku (Tokyo, Japan) Smartlab X-ray diffractometer with CuKα radiation (wavelength: λ = 0.15418 nm). The XRD patterns were measured in the Bragg-Brentano diffraction geometry. The crystalline phases were identified from the peak positions and intensities using an ICDD PDF-2 database. The grain sizes were determined by using the Williamson-Hall method.
The Raman spectra of ground and heat-treated samples were collected at room temperature using a Renishaw (Wotton-under-edge, UK) inVia Raman Microscope in backscattering geometry. A 633 nm laser beam was used as excitation source using a 50× lens. The excitation spot size was 2 µm at the sample surface. The Raman data were recorded in the range of 20−460 cm−1 with a low-wavenumber filter and in the range of 100−1200 cm−1 with a notch filter.
Dynamic light scattering measurements in the range of 0.1–10000 nm (Malvern Zetasizer Nano S, Worcestershire, UK) were performed to determine the particle size distribution. The ground samples were suspended in water assuming the nanoparticles to be perfect spheres leaving the viscosity of water unchanged. The refractive index of the particles was taken as ~2.2 corresponding to that of bulk LiNbO3 in the given wavelength region.
Since the LN samples were discolored after the grinding procedure, possible contamination from the vials was suspected. This was checked by EDS measurements in a Zeiss Leo scanning electron microscope (Jena, Germany). Depending on the vial used, the presence of Fe, Al and W was scrutinized for the stainless steel, alumina and tungsten carbide vials, respectively. The sensitivity of the EDS method for the above listed elements is 0.1 at%, while the relative error of the EDS measurement in the x < 0.5 at% concentration range can be as high as 20%.
To characterize the optical reflectance properties of the samples, an Avantes (Apeldorn, The Netherlands) HS-1024X122 TEC UV-VIS fiber-optic modular spectrophotometer was used. The measurements were carried out on pellets pressed from the ground and heat-treated samples. The samples were illuminated in the 190–1100 nm wavelength range using an Avantes AvaLight-D(H)-S deuterium-halogen light source. To determine the reflectance spectra, we used an Avantes WS-2 diffuse white tile as a reference. The spectral data recorded were used without any further processing.
The secondary phase occurring during the grinding process (Li2O or any other compound it may be transformed to) was quantitatively measured by semi-micro coulometric acid-base titration with current control. For this procedure, portions of the powder samples were weighted in a microbalance with a precision of 2 μg and suspended in a few milliliters of 0.3 mol/dm3 Na2SO4 solution in the anode compartment of a diaphragm-divided two-chamber electrochemical cell. The pH in the anode compartment was measured with a combined glass pH electrode and a Consort 860 pH tester. A platinum anode was used for acid generation by the following electrode reaction: 2H2O = O2+ 4H+ + 4e−. The Na2SO4 solution was boiled prior to the measurement in order to remove any dissolved CO2 that may interfere with the measurements, then cooled to room temperature for the titration. The solution in the anode compartment was stirred with a magnetic stirrer bar. Blank measurements and known quantities of both Na2HPO4 and NaOH were used to verify that no solution intermixing took place between the anode and cathode chambers.

3. Results and Discussion

3.1. Result of the Ball Milling: Size Parameters

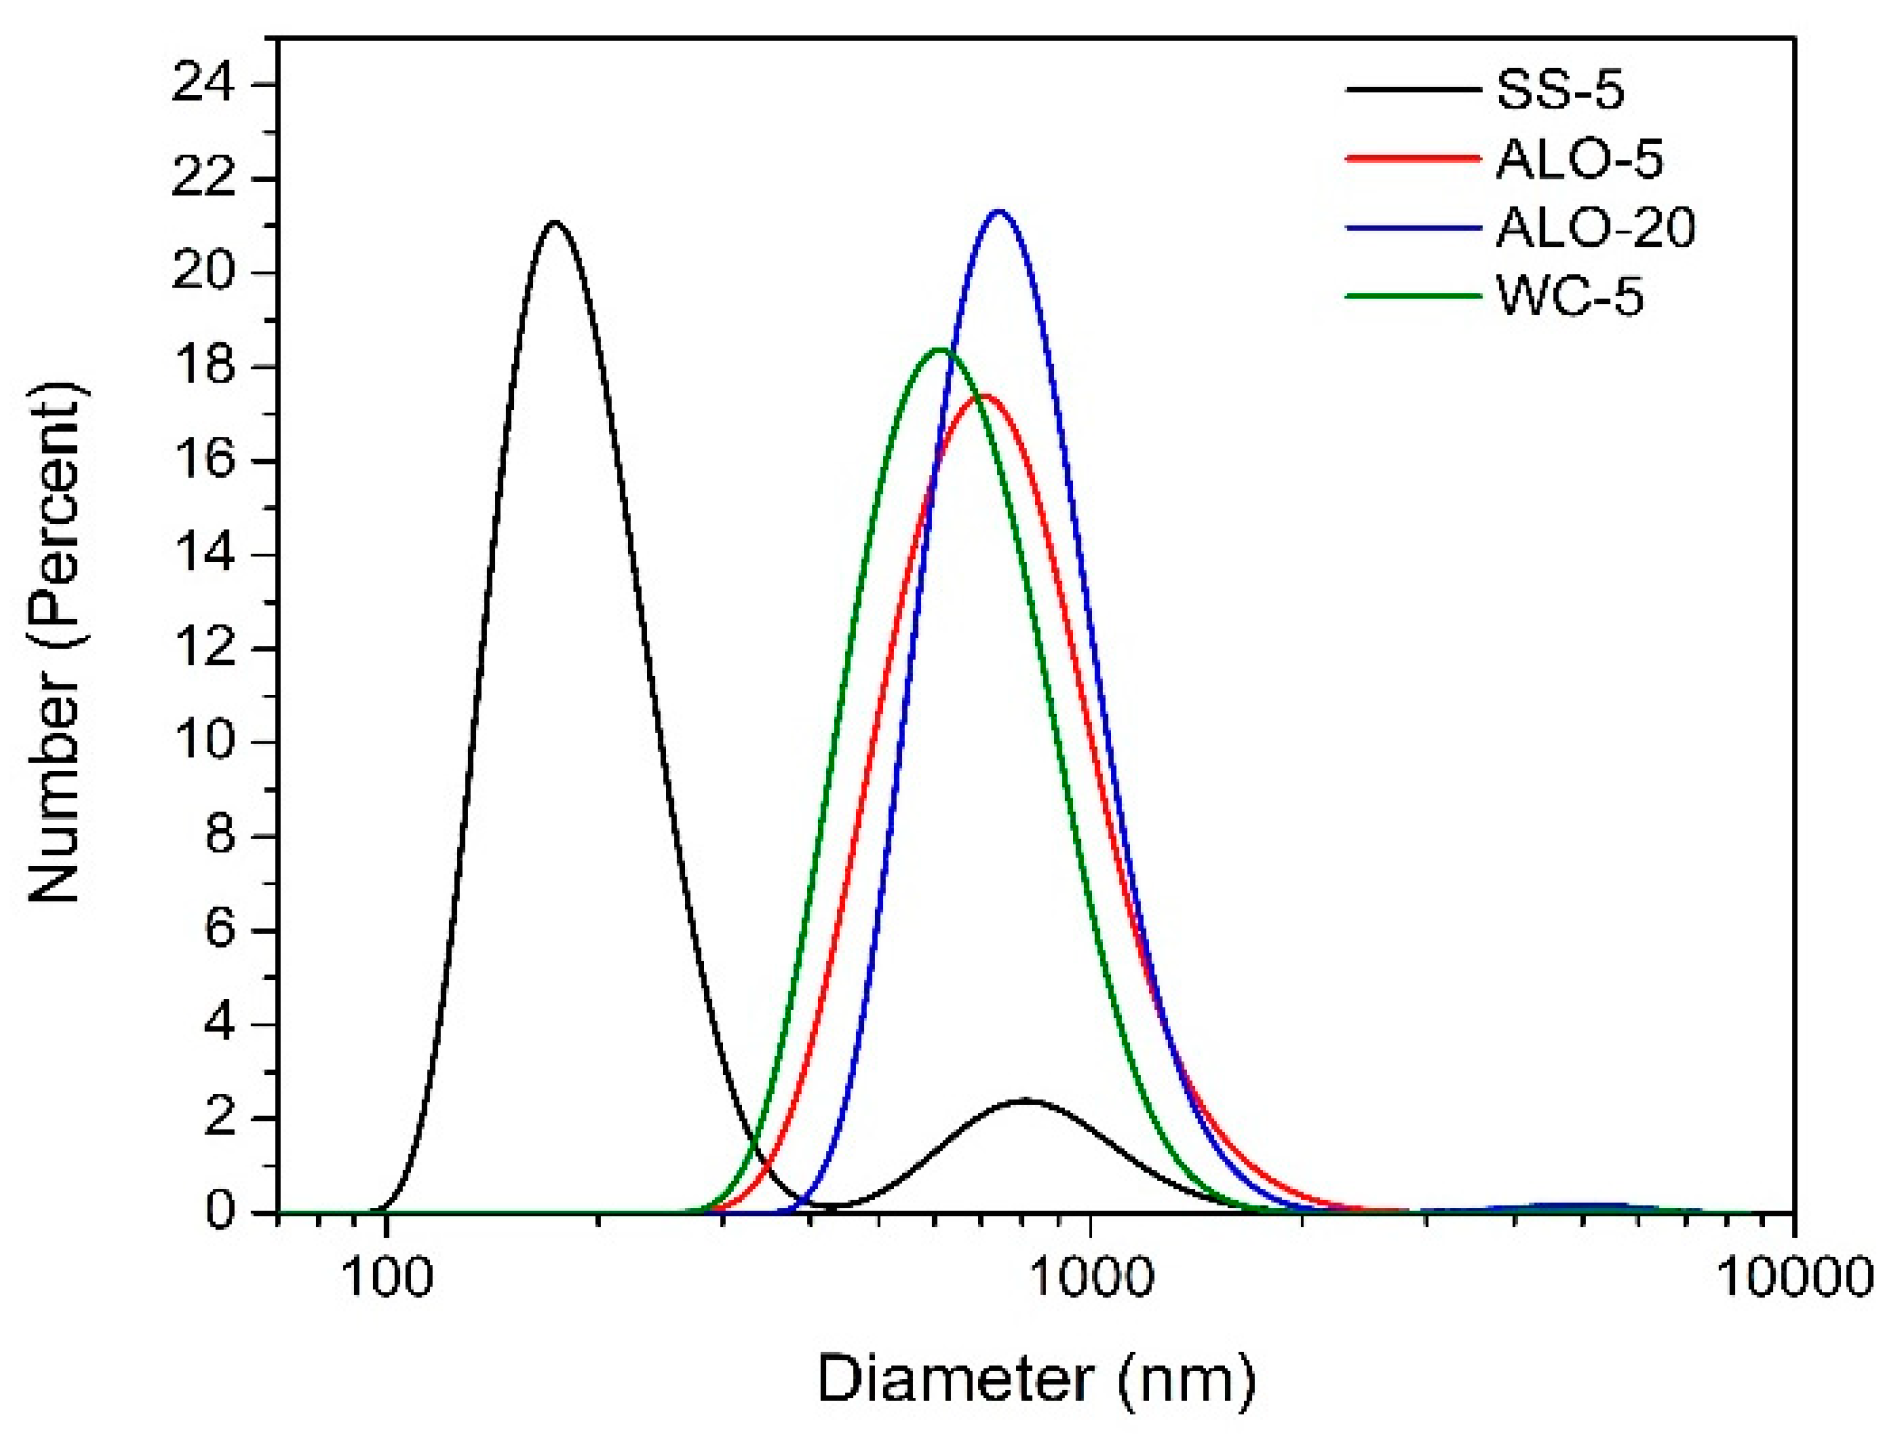
Figure 1 shows the as-received particle diameter distributions of the ground samples determined by the DLS method. All of them have a broad distribution in the range of a few hundred nanometers while the smallest particle diameter can be achieved by the ball-milling in stainless steel vial. Ball-milling in alumina or tungsten carbide vial resulted in similar particle diameter distributions which did not change considerably if a milling time longer than 5 h was chosen.
Since the samples darkened as a result of the grinding process, it was checked whether the greyish color was related to sample contamination originating from the ball or the vial. EDS results showed that no characteristic impurity element at x > 0.1 at% concentration was present in the LN powders ground in either the tungsten carbide or the stainless steel vials, while aluminum could be detected when alumina vial was used in the milling process. This also means that the large fraction corresponding to smaller particle sizes observed in sample SS-5 milled in the stainless steel vial (see Figure 1) cannot be ascribed to the presence of an impurity but has to be considered as LN, too.
Neither the occurrence of alumina contamination nor the absence of any stainless steel residue can be explained on the basis of the hardness properties of the materials involved in the ball milling process. Taking into account the order of the Vickers hardness values of the relevant materials (stainless steel: 200–240, LN: ~630 [24], tungsten carbide: 1200–1700, alumina: 1400–1900), one might expect that stainless steel would cause the largest impurity level. However, alumina was the only vial material resulting in sample contamination, although it was the hardest material used. Al contamination was also confirmed by the XRD measurements as indicated by the presence of α-Al2O3 in the XRD pattern. This phenomenon was also proved by Heitjans and co-workers [22]. Although the alumina impurity level was sufficiently high for both XRD and EDS detection (at least 2 vol% which was the detection limit of the XRD method), it did not appear as a discernible fragment in the size distribution curves of the samples ALO-5 and ALO-20 (see Figure 1).
Although the alumina contamination cannot be explained on the basis of the hardness of the unmodified materials, it is understood by taking into account the mechanochemical reactions taking place in the system. As it will be shown in the forthcoming sections, lithium oxide is released from LN during the milling process that can react with the amphoteric alumina, resulting in the modification of its structure and facilitating its degradation. Various mixed oxide compounds of aluminum and lithium are known (such as LiAlO2, LiAl5O8, Li3AlO4; see Ref. [25]). In particular, the synthesis of LiAlO2 is well described by using either sol-based [26] or solid phase reaction-based [27] routes. Although the quantitative yield of the solid-phase reaction is given for temperatures higher than 370 °C, a surface-limited reaction can be assumed for the milling conditions applied in the present work. The hardness data of LiAlO2 is not known to the authors, but the Vickers hardness of other alkali aluminates (Na or K) is reported to be quite small (< 100, see [28]). Hence, the sites where the released Li2O reacts with the Al2O3 ball/vials can be assumed to serve as degradation initiation spots during the milling process.
While the particle size of a few hundred nm observed by light scattering did not diminish further for milling times longer than 5 h, a Williamson-Hall type evaluation of the X-ray diffractograms resulted in mean grain sizes decreasing from at about 63 nm to 37 nm for milling times increasing from 5 to 20 h (see Table 2). This reflects the fact that the diffraction-based size analysis provides the diameter of the coherently scattering grains which differs from the much larger particle diameter visible by light scattering or imaging methods. This is direct evidence that the particles formed during high-energy milling consist of a multitude of small grains. The grain diameters found in the present work are in good agreement with those reported before [13,15,20,21,22,23] for ball-milled LN crystals.

3.2. Structure of the Samples: XRD, Raman and Optical Reflectance Measurements

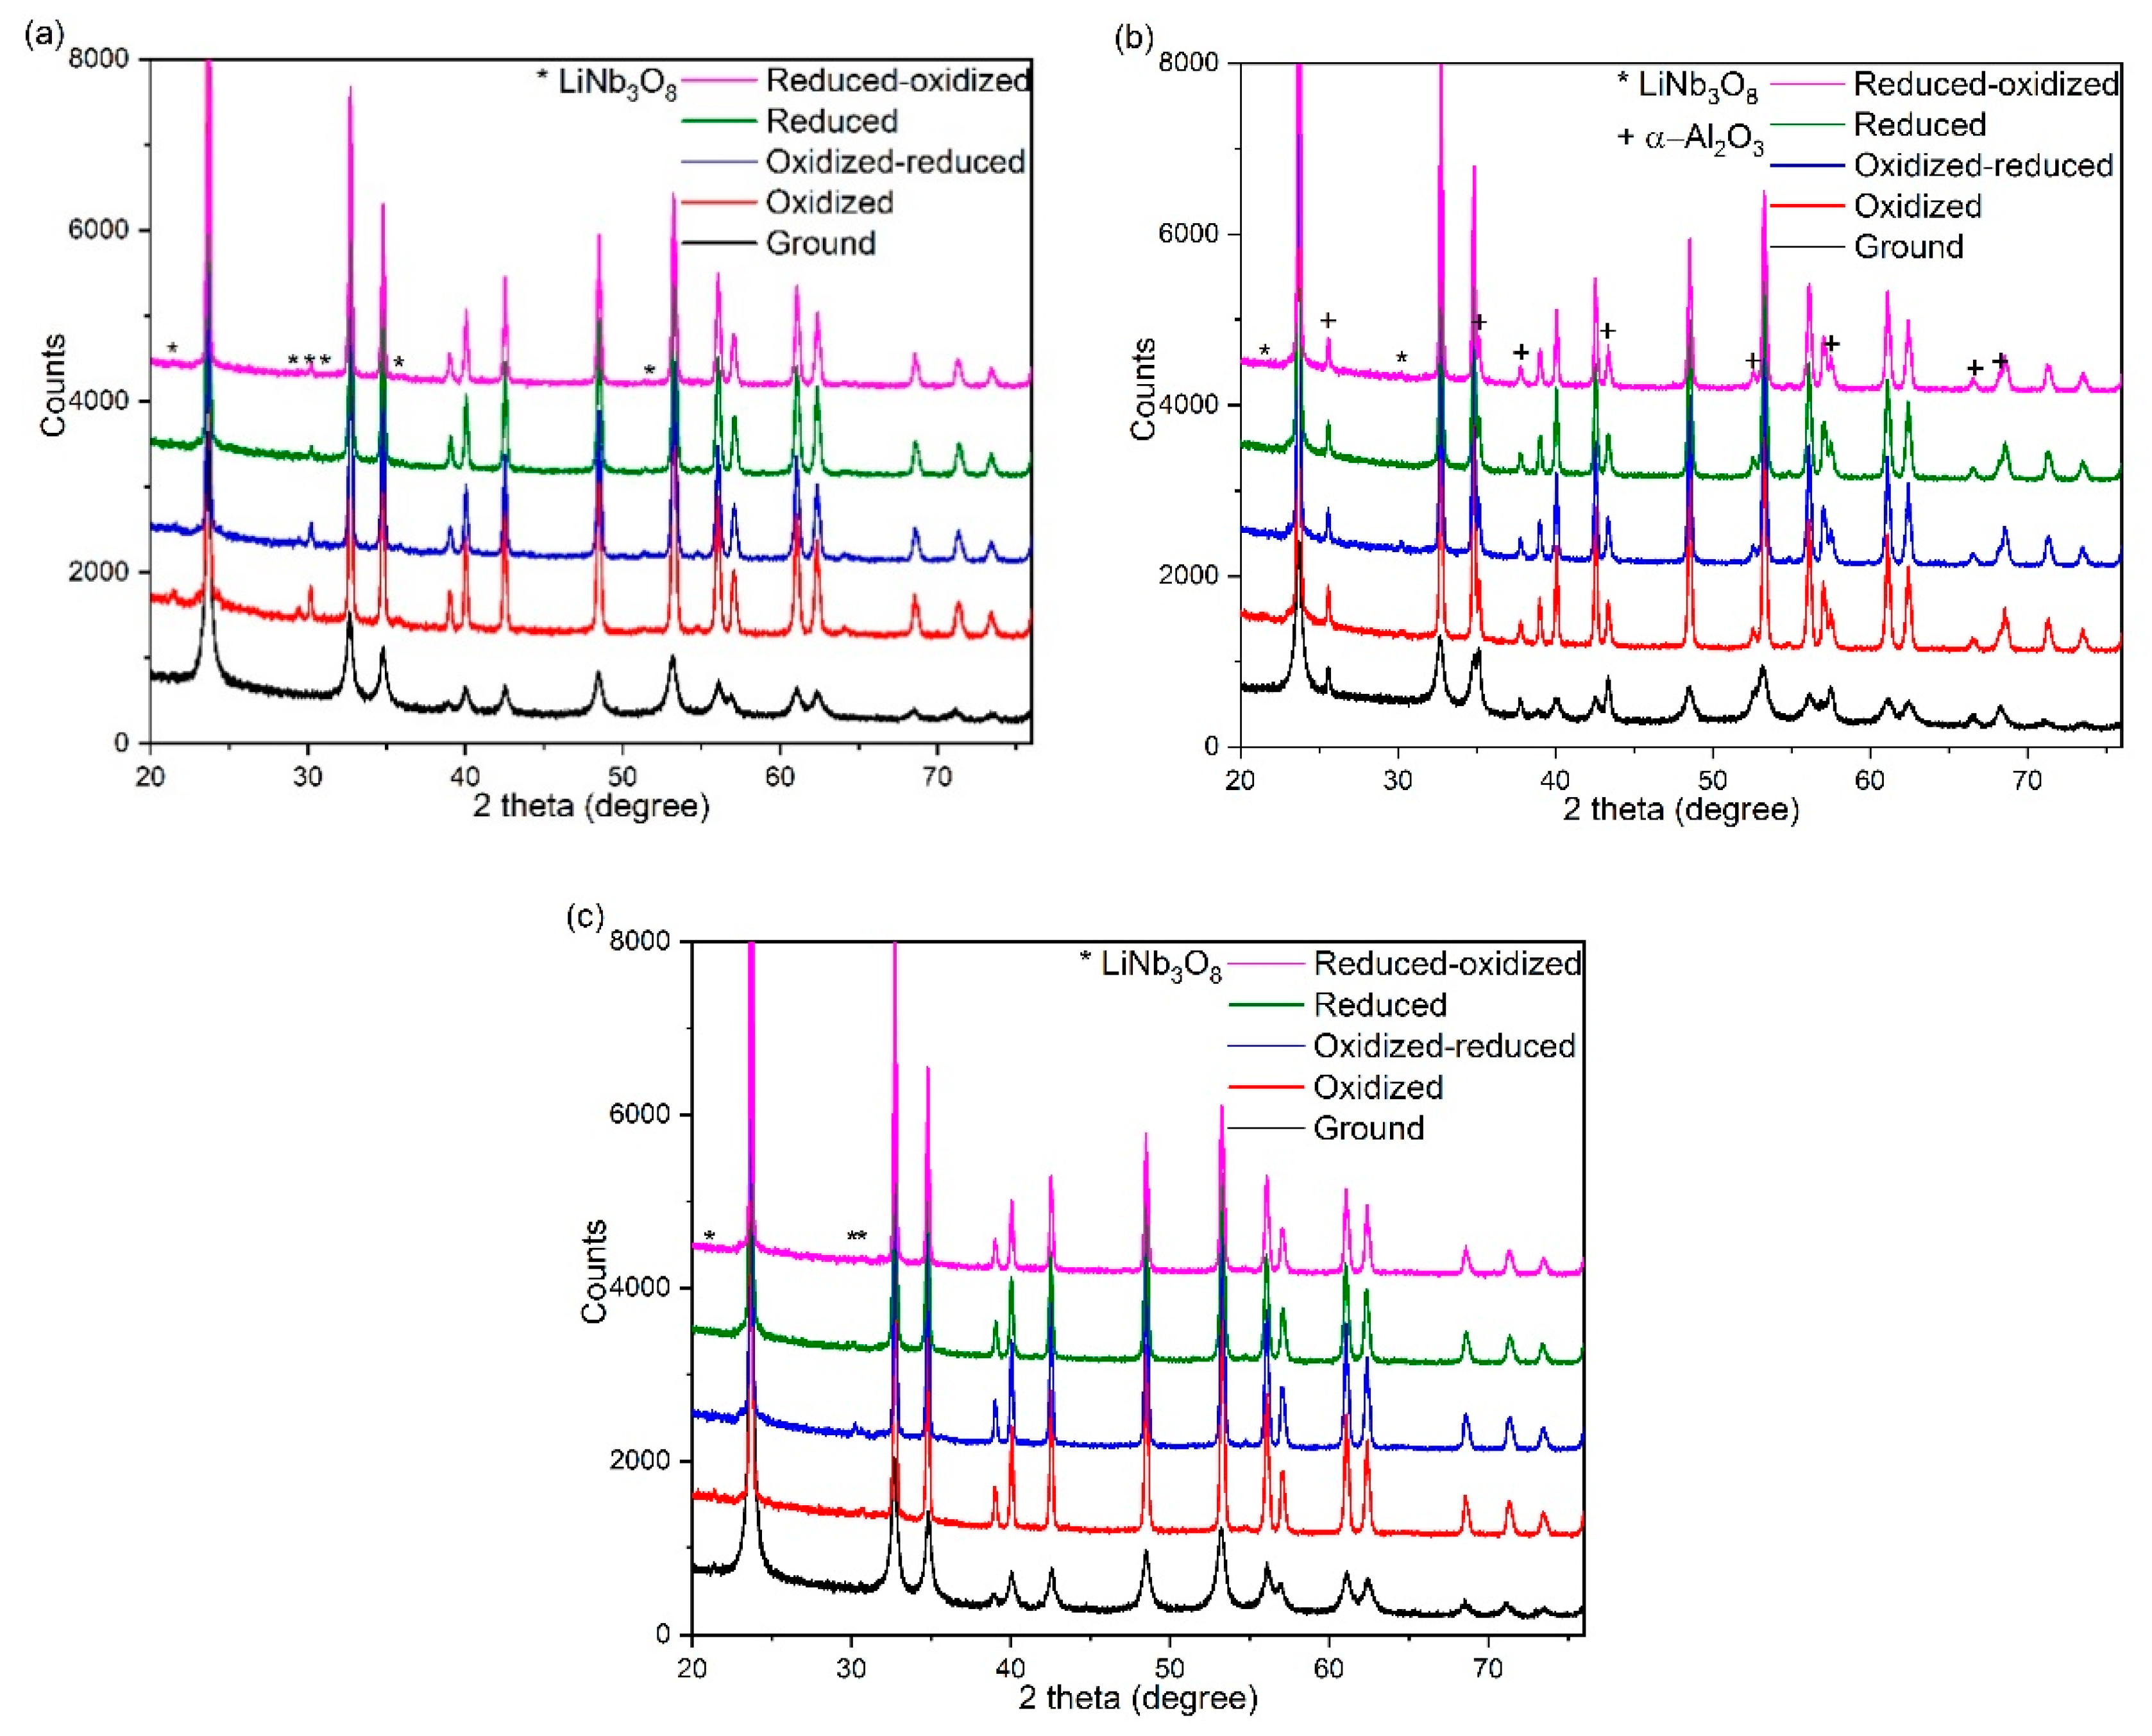
Figure 2 shows the XRD patterns of the ground materials compared with those oxidized and/or reduced at 800 °C for 3 h. The broad peaks of the XRD patterns of the as-ground samples indicate small grain sizes as determined numerically using the Williamson-Hall method (see Table 2). Heat-treatment processes resulted in narrower diffraction lines due to increased grain sizes. The reflections of a LiNb3O8 (lithium triniobate) phase appeared in the diffraction patterns of all annealed samples (best seen for oxidized samples, especially for those ground in the stainless steel vial, see Figure 2a). The formation of the LiNb3O8 phase taking place as a result of the combined ball-milling and annealing procedure can be described as
3 LiNbO3 = LiNb3O8 + Li2O,
where lithium oxide is a volatile byproduct.
The fact that the lithium triniobate can only be identified in the heat-treated samples indicates that the structural rearrangement of the residual Nb containing oxides is not completed in the as-ground samples. However, the annealing process provides the activation energy required for crystallization of the new phase with sufficiently large crystallites to yield strong enough reflections in the diffraction patterns.
In the XRD pattern of the sample ball-milled in alumina vial the reflections of α-Al2O3 can be clearly identified due to abrasion of the vial and balls during the milling process already before the heat-treatments (see Figure 2b). The fact that alumina was present in a crystalline form already in the as-ground samples indicates that the milling destroyed the ball/vial material and the majority of this impurity does not arise as a result of the side reaction that weakened the alumina structure. The lack of further crystalline compounds of aluminum in the annealed samples shows that the amount of possibly reacted alumina was insignificant as compared to alumina that entered the ground mixture by the mechanical effect of milling.
Figure 3 shows the Raman spectra of the as-ground and heat-treated samples ball-milled in stainless steel and tungsten carbide vials. The Raman intensities of the as-ground samples are weak, the bands are broad, not showing all characteristic features of LiNbO3 crystals. The heat-treatment process resulted in line narrowing and increased intensity of the bands corresponding to the pure LiNbO3 phase. In addition, in the oxidized samples some weak bands appeared at 59, 79 and 96 cm−1 corresponding to the LiNb3O8 phase (Figure 3a) [29]. This confirms the XRD results, where the presence of the LiNb3O8 phase predicted by Equation (1) was best seen for oxidized samples, especially for those ground in stainless steel vial.
Equation (1) suggests that at least one new component without any niobium content has to appear during the milling process. Lithium oxide, Li2O, may be present as the primary byproduct and can be transformed in air to another lithium compound (LiOH·xH2O, Li2CO3·xH2O) by water and/or CO2 uptake. Indeed, the water suspensions of all ball-milled LN powders were found to be alkaline, regardless of the chemical state of the Li-rich segregate, which is an unambiguous confirmation of the decomposition of LN via Li2O separation during the milling process. The as-ground LN particles were structurally disordered in the decomposed region but recrystallized upon annealing, hence both the Raman and XRD lines of LiNb3O8 could manifest themselves. The CO2 uptake of Li2O produced during ball-milling can also be observed, viz. in the Raman spectrum of the LN powder ground in tungsten carbide vial shown in Figure 3b. The bands at about 190 and 1090 cm−1 present in the as-ground samples are attributed to Li2CO3 generated from Li2O (Figure 3b) [30]. Heat-treatments at 800 °C either in air or in vacuum resulted in the loss of CO2 evidenced by the disappearance of those bands from the Raman spectra. The presence of α-Al2O3 contamination in the powder ball-milled in alumina vial was observed in the XRD diffractogram; however, it could not be detected by Raman spectroscopy as the corresponding bands at about 383 and 420 cm−1 overlap with the larger bands of LN [31].
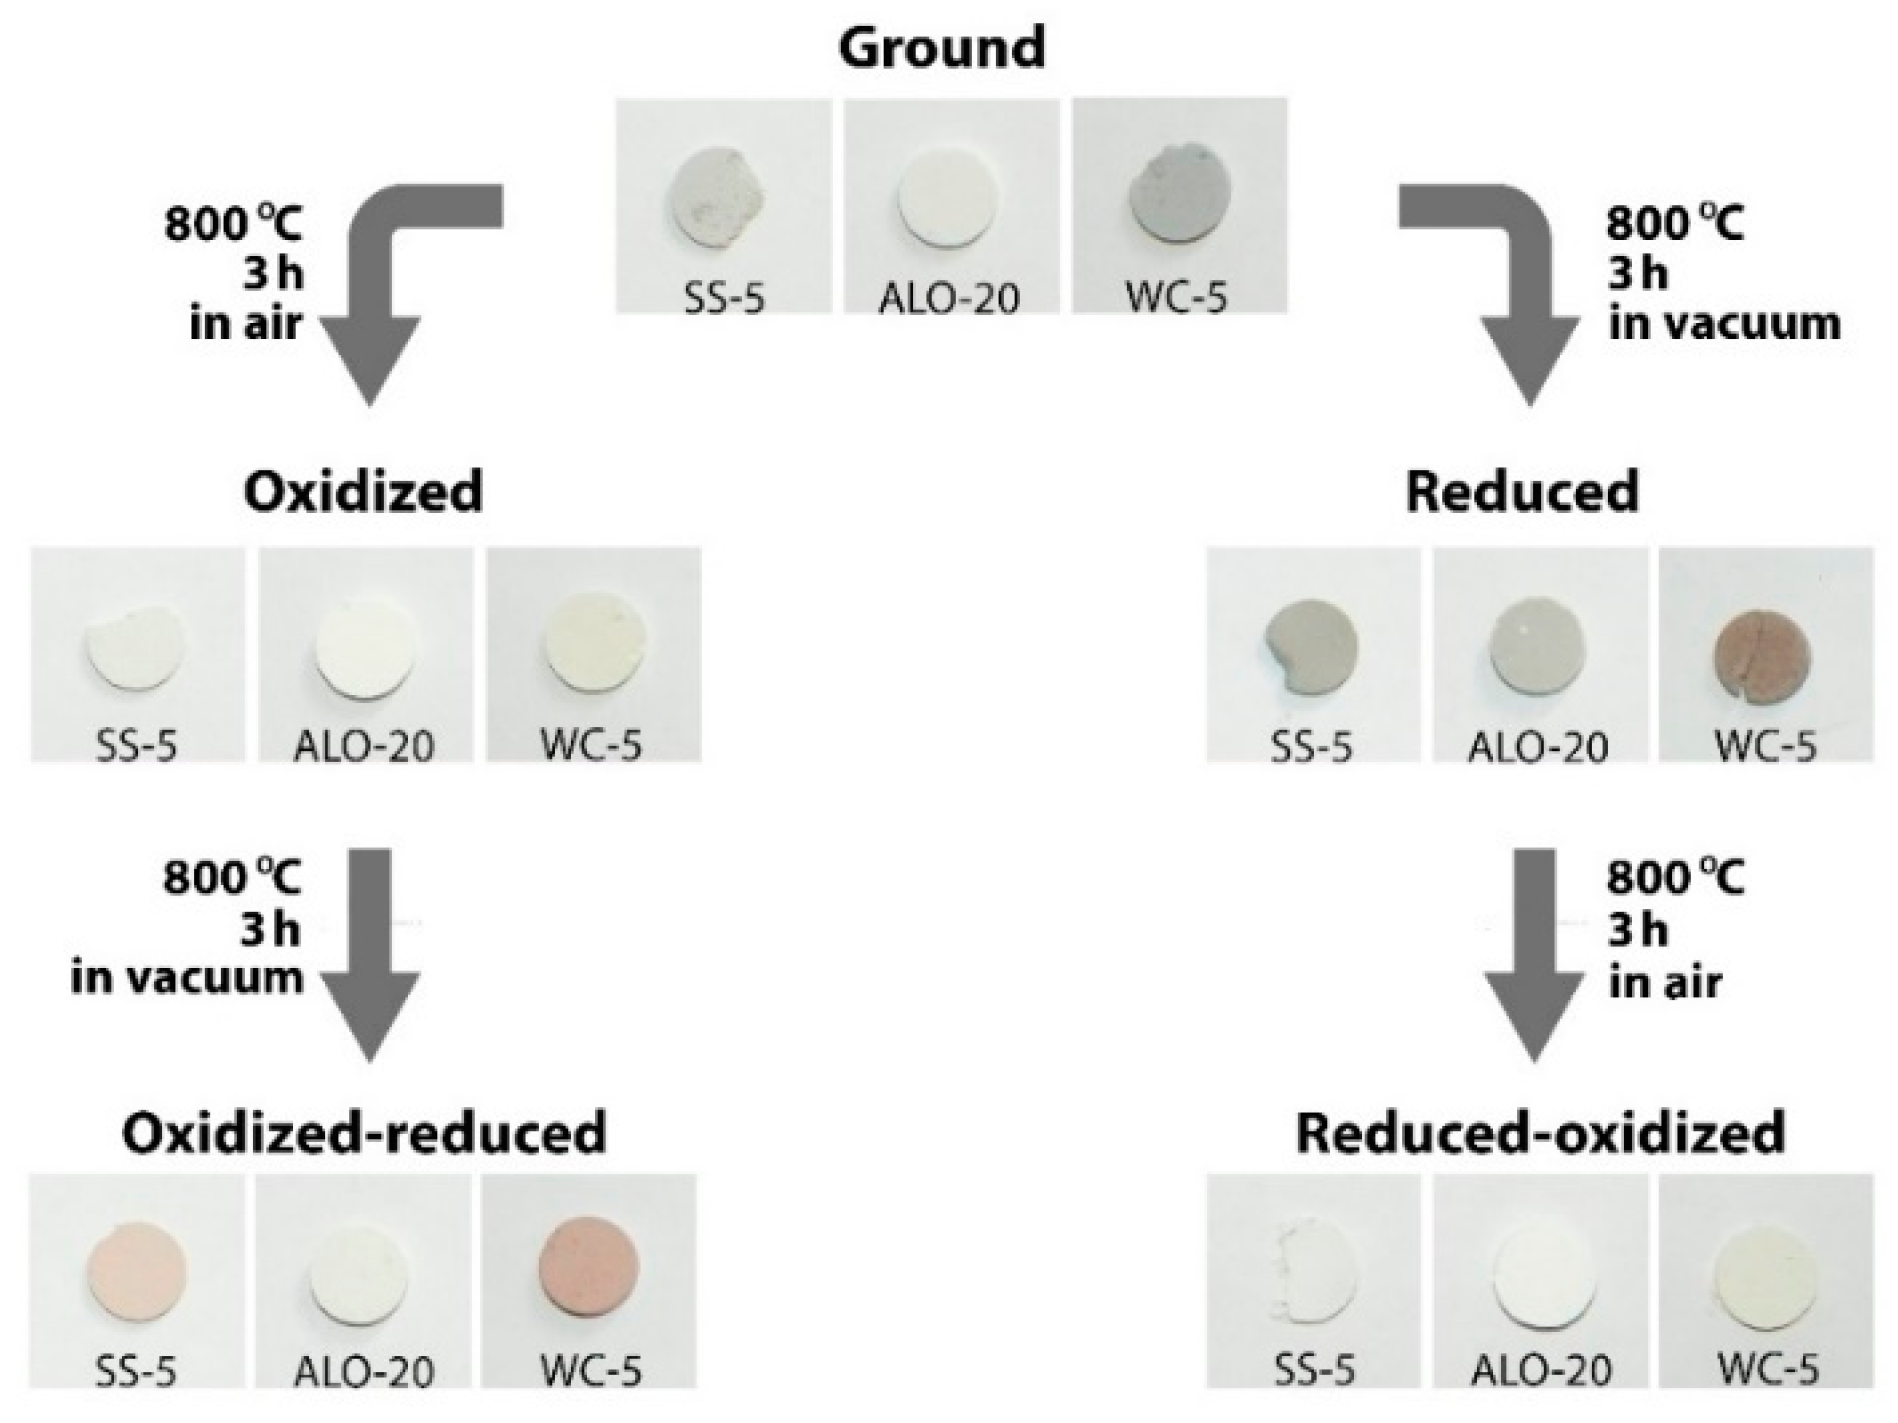
Equation (1) does not account for the redox processes indicated by color changes seen during ball-milling and annealing treatments. The colors of samples ground in alumina, stainless steel and tungsten carbide vials varied from light gray to dark gray (see Scheme 1), evidenced by their optical reflection spectra (Figure 4a)—the darker the sample, the lower its reflection in the whole spectral range. As mentioned above, the samples underwent a change concerning the oxidation state of niobium during the grinding process. This partial reduction could be compensated by oxidizing the sample applying a heat-treatment in air at 800 °C. The oxidative annealing resulted in white color for the powder ground in stainless steel vial (Scheme 1). Upon subsequent reduction, the sample became brownish, while the pellet pressed from the as-ground powder became gray when reduced directly. The oxidation process resulted in a white color even in the case of the previously reduced sample. As an example, the optical reflection spectra of the as-ground and annealed samples ball-milled in stainless steel vial are shown in Figure 4b. Similar effects were observed for powders ground in the other two vials: the change of color was less evidenced for alumina vial but was stronger for tungsten carbide vial.
In Figure 4a no distinctive feature characteristic for Fe2+ having an absorption band near 500 nm can be discerned for any of the as-ground samples. The comparison of reduced samples also shows very small differences in this respect. Instead, differences in amplitude of the whole spectrum dominate. Still some change of coloration induced by the redox treatments may be related to the iron contamination at least partly coming from the starting material. For the preparation of LiNbO3 high- purity raw materials with less than 2 ppm, Fe was used. Since the effective distribution coefficient of Fe between the molten and solid lithium niobate of congruent composition is around 1, it is not expected to be enriched in the crucible residue during the growth process. On the other hand, even 10 ppm iron does not induce a sizable increase of the optical absorption. According to Phillips et al. [32] the difference in the absorption coefficient at about 500 nm between oxidized and reduced LN containing about 0.5 mol% Fe is less than 4 cm−1, i.e. less than 0.001 cm−1/ppm Fe, which cannot cause dominant coloration changes in our case.

3.3. Discussion of the Mechanochemical Reaction Including Redox Processes

Congruent LiNbO3 crystals are strongly Li deficient and can be described by the Li1−5xNb1+xO3 formula, where x ≈ 0.01. The excess Nb ions occupy Li sites and are charge compensated by Li vacancies. The antisite NbLi ions may trap electrons, forming small polarons. Moreover, NbLi—NbNb pairs, consisting of an antisite and its regular nearest-neighbor along the ferroelectric c axis, are capable to form stable bipolarons (for a review see [33]). The strongly localized polaron/bipolaron models can evidently be applied for the redox processes in LN nanocrystals.
Already before the appearance of the LiNb3O8 phase the LN particles underwent partial reduction as a result of ball-milling. During reduction, oxygen gas and lithium oxide are formed, the latter leaving the sample only upon annealing treatments. This leads to the appearance of various polarons with elementary cell loss at the surface [33,34]
2LiNbO3 → NbNb4+ + NbLi4+ + 3OO2‒ + 2e + Li2O↑+ O2
where the NbNb4+ + NbLi4+ pair makes a bipolaron. The remaining electrons may also form either a further bipolaron or two NbLi4+ polarons on pre-existing NbLi antisite defects in the congruent bulk. Their broad absorption bands near 500 nm and 760 nm and the disordered structure result in uniform gray color as observed for the as-ground samples (see Scheme 1 and reflection spectra in Figure 4a). In this stage the surface is disordered and consists of strongly subcongruent lithium niobate, while Li2O forms a different phase.
The structure of the particles consisting of a large number of grains can be understood to result from an interplay of disturbed ferroelectric surface fields. The grains may be assumed to be monodomain regions of LN pairwise attracted by the strong electric fields acting on most blank surfaces of this ferroelectric. Structural damage does not allow exact fitting of the attached surfaces, resulting also in crystallographic misorientation of the grains in touch. During ball milling, the particles constantly break up and recoalesce in different arrangements, while reduction may only proceed on surfaces where oxygen evaporation is possible for a sufficiently long period. Li2O segregation on such exposed grain surfaces may finally shield the electric fields and hamper further attachments with neighboring grains. During prolonged grinding, this may result in a structure where a large part of the Li2O phase is on the external surface of the particles.
Oxidation of the samples leads to the evaporation of the segregated Li2O phase and in parallel the disappearance of all polarons. The latter recovers the white color by reverting the reduction described by Equation (2) and promotes the formation of the LiNb3O8 phase according to Equation (1) whereby a further LN formula unit is used up:
LiNbO3 + NbNb4+ + NbLi4+ + 3OO2‒ + 2e + O2 → LiNb3O8
as observed by XRD, Raman and optical reflection measurements prominently for the oxidized samples. The LiNb3O8 phase may form an epitaxial layer on the LiNbO3 surface as described by Semiletov et al. [35].
In all other preparation stages various mixtures of bipolarons and polarons are present mainly absorbing in the blue-green and red range, respectively (Figure 4b). While the as-ground state has a balanced mixture, its direct reduction leads to a larger bipolaron portion (less reflection in the blue-green region, see the curve with lowest reflection in Figure 4b. The same reduction, if preceded by oxidation, reproduces only bipolarons but very few NbLi4+ polarons (high reflection only in the red region, see blue curve). Some additional structure observed near 350 nm and 670 nm in samples having an oxidizing step in their history might be attributed to absorption related to the LiNb3O8 phase. As shown by Sugak et al. [36] the coloration is formed near the crystal surface and its distribution depends on annealing temperature. Annealing is assumed to attack the exposed surface of the particles without essentially changing their deeper structure. It should be noted that the large formation enthalpy of oxygen vacancies in LN compared to that of similar defects of the cation sublattice prevents the diffusion of oxygen within the bulk, while diffusing cations may easily occupy the empty Li sites amply available in congruent LN (see [33] and references therein).
Reaction (2) is an equivalent version of Equation (2) in Sugak et al.’s paper, separately showing near-surface formation of polarons by Nb displacement to a Li site on the one hand, and electrons available for diffusion to more deeply situated antisites causing similar coloration on the other hand. This distinction, together with the overlooked fact that elementary cells are lost upon reduction, resolves the problems of Sugak et al. about unrealistic properties of coloration allegedly following from their Equation (2). In contrast to the opinion of Sugak et al., reduction-oxidation cycles are not completely reversible processes due to possible Li oxide loss especially at higher temperatures and in closely stoichiometric LiNbO3, the latter being also much more resistant to reduction. Thermal reduction was shown to increase off-stoichiometry which, in turn, leads to larger density [37,38], quantitatively supporting Equation (2). All this gives full support to the cationic model of coloration excluding any diffusion of oxygen in the bulk. A further argument for reaction (2) specifically in our case is the expected higher density of Li-poor grain kernels, taken into account that they are produced by mechanical pressing exerted by the vials.

3.4. Quantitative Determination of the Degree of Decomposition During Ball-Milling

The quantity of lithium oxide segregated at the particle surfaces during ball-milling was determined by coulometric titration in the as-ground samples. No similar measurements were attempted for the annealed samples since the Li2O has a fairly large volatility at the annealing temperature. All titration curves exhibited a single neutralization step as the acid was produced in-situ by the current passing through the cell. This indicates that the primary decomposition product was Li2O and no significant amount of Li2CO3 was present, despite long storing times of several weeks in air elapsed after grinding prior to the titration procedure. The presence of carbonate should have led to a two-stage neutralization process, first leading to bicarbonate formation, but this was never observed. Although the decomposition product detected by the Raman measurement was lithium carbonate, this is no counterargument, as the Raman intensity of the various lithium-containing compounds may be very different and hence, the sensitivity of the Raman measurement may not be comparable for the various possible phases. The weight of dissolved Li2O (mOX) was calculated with the following equation:
mOX = MQ/2F
where M is the molar weight of Li2O, Q is the charge passed until the equivalence point, F is the Faraday-constant (96485 C/mol), while the number in the denominator indicates that the hydrolysis of 1 mol of Li2O results in 2 mols of hydroxide ions. Four measurements were performed for each batch ground in different vials. The measured Li2O mass ratios wox, expressed as weight percent of the as-ground powder are given in Table 3. The uncertainty of the measurements is given as the standard deviation of the consecutive titration results.
The total surface of particles in the sample is proportional to 1/R, where R is the average particle radius as measured by DLS. The values of wOX in Table 3 indeed increase monotonously with 1/R, though a fully quantitative trend cannot be established. No similar trend related to the inverse grain radius 1/r can be seen in the given range of r values obtained by XRD. These observations can be understood if segregation mainly occurs on the outer particle surfaces where both Li2O and O2 may freely leave, giving rise to a niobium-rich layer. However, it is also possible that part of the newly created surfaces, together with part of the Li2O formed, gets buried during later stages of milling and cannot be dissolved for titration.
The quantitative determination of the lithium oxide loss enables us to estimate the thickness of the lithium triniobate layer in the oxidized samples. We use a simplified model of compact, uniform, spherical LN particles of unmodified composition covered by a uniformly thick LiNb3O8 phase. The shell thickness is calculated with the assumption that only the Li2O equivalent to this outer shell could be dissolved and analyzed by titration.
From the reaction indicated in Equation (1) it follows that
nOX = nLTN
where n stands for the molar quantity of the relevant materials, while the indices OX and LTN refer to the lithium oxide segregate and the lithium triniobate shell of the particles, respectively. For the weight of the particle shell we obtain
mOX = mLTN MOX/MLTN
where M is the molar weight. The weight ratio of the lithium oxide in the ground material, wOX, is as follows:
w OX = m LTN M OX M LTN m LN + m LTN ( 1 + M OX M LTN )
The weight of each particle component can be expressed with the geometric parameter of the core-shell structure, d being the shell thickness and ρ the density:
m LN = 4 3 π ( R d LTN ) 3 ρ LN 4 3 π R 3 ρ LN 4 π R 2 d LTN ρ LN
m LTN   4 π ( R d LTN ) 2 d ρ LTN 4 π R 2 d LTN ρ LTN
The higher order terms with respect to dLTN have been neglected since dLTNR. The weight ratio of the lithium oxide is then
w OX = d LTN ρ LTN M OX M LTN R 3 ρ LN + d LTN [ ρ LTN ( 1 + M OX M LTN ) ρ LN ]  
Again, the dLTNR relation justifies the neglection of the second term in the denominator, leading to
d LTN R 3 ρ LN ρ LTN M LTN M OX w OX
By assuming that the Li2O leaving the particle also forms a similar shell in the as-ground sample, for the thickness of this shell we calculate
d OX ρ LTN ρ OX M OX M LTN   d LTN   d LTN 5.6
where we take ρ OX   ρ Li 2 O 2.01 g/cm3, ρ LN = 4.65 g/cm3 and ρ LTN = 4.975 g/cm3 [39]. The values of dLTN and dOX are also included in Table 3 and correspond to a layer thickness of at most a few unit cells.
The same amount of segregate (either Li2O or LiNb3O8), if spread evenly on all grain boundaries, would result in a much thinner layer. Neither the corresponding LiNb3O8 layer would be seen as XRD peaks nor would the equivalent amount of Li2O be readily soluble due to its hindered accessibility.
This finding gives further support to our previous assumption that the processes described by Equations (2) and (3) essentially occur on the outer surfaces. Accordingly, particle and grain size reduction proceeds as long as surfaces freshly broken up during ball milling have enough time to pile up a non-ferroelectric surface layer preventing them from stable recoalescing. Below a certain size limit, depending on the detailed properties of the milling system, this becomes impossible as recoalescence becomes too fast. The thickness of the outer segregate layer apparently has a narrow range defined by a similar requirement of sufficient atmospheric contact of the polar surface.
The proposed formation of the core-shell structure would require direct experimental evidence. However, the particle size achieved by the ball-milling process was too large for a direct transmission electron microscopic study of the particles.
Finally, we remark that the given description corresponds to the surface-screening mechanisms in ferroelectric thin films reviewed by Kalinin [40]. In particular, very similar processes seem to occur in prospective lithium-ion batteries using LiNb3O8 as an anode material [41].

4. Conclusions

Nano-LN was prepared by ball-milling using a Spex 8000 Mixer Mill with different milling parameters. The resulting particle size has a broad distribution in the range of a few hundred nanometers. Five and 20 h of ball-milling resulted in mean grain sizes of about 60 and 40 nm, respectively. Longer ball-millings do not decrease the particle size but only reduce the grain size. α-Al2O3 contamination was found for the sample ground in alumina vial due to the chemically induced abrasion of the vial and the balls during ball-milling. During the milling process the material suffers partial reduction that leads to a balanced formation of bipolarons and polarons yielding gray color together with Li2O segregation on the open surfaces. Upon high-temperature oxidation, the volatile Li2O phase and the polarons get eliminated and the Li deficiency is accommodated by the formation of a more stable LiNb3O8 shell. Darker or brownish color appearing upon high-temperature reduction is caused by the preferential formation of bipolarons. The Li2O loss was observed to increase with the growing total surface of the particles. The average thickness of the non-ferroelectric surface segregate corresponds to a layer of a few unit cells forming the passivating shell of the particles. These findings provide a comprehensive explanation of the physicochemical behavior of the system during grinding and annealing in different atmospheres.

Author Contributions

Conceptualization, L.K. (László Kovács), L.P. and G.C.; methodology, L.K. (Laura Kocsor) and J.G.; formal analysis, L.K. (Laura Kocsor); investigation, L.K. (Laura Kocsor); writing—original draft preparation, L.K. (László Kovács), L.P. and G.C.; visualization, L.K. (László Kovács); supervision, L.P.; project administration, Z.K.; funding acquisition, Z.K.

Funding

This research was supported by the National Research, Development and Innovation Fund of Hungary within the Quantum Technology National Excellence Program (Project No. 2017-1.2.1-NKP-2017-00001) and the Ministry of Human Capacities of Hungary within the ELTE University Excellence program (1783-3/2018/FEKUTSRAT).

Acknowledgments

The authors are grateful to Gábor Piszter and Levente Illés for the optical diffuse reflectance and EDS measurements, respectively.

Conflicts of Interest

The authors declare no conflict of interest.

References

  1. Kar, S.; Logad, S.; Choudhary, O.P.; Debnath, C.; Verma, S.; Bartwal, K.S. Preparation of Lithium Niobate Nanoparticles by High Energy Ball Milling and Their Characterization. Univers. J. Mater. Sci. 2013, 1, 18–24. [Google Scholar]
  2. Bonacina, L.; Mugnier, Y.; Courvoisier, F.; Le Dantec, R.; Extermann, J.; Lambert, Y.; Boutou, V.; Galez, C.; Wolf, J.P. Polar Fe(IO3)3 Nanocrystals as Local Probes for Nonlinear Microscopy. Appl. Phys. B Lasers Opt. 2007, 87, 399–403. [Google Scholar] [CrossRef]
  3. Zielinski, M.; Oron, D.; Chauvat, D.; Zyss, J. Second-Harmonic Generation from a Single Core/Shell Quantum Dot. Small 2009, 5, 2835–2840. [Google Scholar] [CrossRef] [PubMed]
  4. Tripathi, S.; Davis, B.J.; Toussaint, K.C.; Carney, P.S. Determination of the Second-Order Nonlinear Susceptibility Elements of a Single Nanoparticle Using Coherent Optical Microscopy. J. Phys. B At. Mol. Opt. Phys. 2011, 44, 015401. [Google Scholar] [CrossRef]
  5. Nakayama, Y.; Pauzauskie, P.J.; Radenovic, A.; Onorato, R.M.; Saykally, R.J.; Liphardt, J.; Yang, P. Tunable Nanowire Nonlinear Optical Probe. Nature 2007, 447, 1098–1101. [Google Scholar] [CrossRef] [PubMed]
  6. Le, X.L.; Brasselet, S.; Treussart, F.; Roch, J.F.; Marquier, F.; Chauvat, D.; Perruchas, S.; Tard, C.; Gacoin, T. Balanced Homodyne Detection of Second-Harmonic Generation from Isolated Subwavelength Emitters. Appl. Phys. Lett. 2006, 89, 121118. [Google Scholar]
  7. Hsieh, C.L.; Grange, R.; Pu, Y.; Psaltis, D. Three-Dimensional Harmonic Holographic Microcopy Using Nanoparticles as Probes for Cell Imaging. Opt. Express 2009, 17, 2880–2891. [Google Scholar] [CrossRef]
  8. Kijatkin, C.; Eggert, J.; Bock, S.; Berben, D.; Oláh, L.; Szaller, Z.; Kis, Z.; Imlau, M. Nonlinear Diffuse Fs-Pulse Reflectometry of Harmonic Upconversion Nanoparticles. Photonics 2017, 4, 11. [Google Scholar] [CrossRef]
  9. Aharonovich, I.; Castelletto, S.; Johnson, B.C.; McCallum, J.C.; Simpson, D.A.; Greentree, A.D.; Prawer, S. Chromium Single-Photon Emitters in Diamond Fabricated by Ion Implantation. Phys. Rev. B 2010, 81, 121201. [Google Scholar] [CrossRef]
  10. Kolesov, R.; Xia, K.; Reuter, R.; Stöhr, R.; Zappe, A.; Meijer, J.; Hemmer, P.R.; Wrachtrup, J. Optical Detection of a Single Rare-Earth Ion in a Crystal. Nat. Commun. 2012, 3, 1027–1029. [Google Scholar] [CrossRef]
  11. Begin-Colin, S.; Girot, T.; Mocellin, A.; Le Caër, G. Kinetics of Formation of Nanocrystalline TiO2 II by High Energy Ball-Milling of Anatase TiO2. Nanostructured Mater. 1999, 12, 195–198. [Google Scholar] [CrossRef]
  12. Girot, T.; Bégin-Colin, S.; Devaux, X.; Le Caër, G.; Mocellin, A. Modeling of the Phase Transformation Induced by Ball Milling in Anatase TiO2. J. Mater. Synth. Process. 2000, 8, 139–144. [Google Scholar] [CrossRef]
  13. Pooley, M.J.; Chadwick, A.V. The Synthesis and Characterisation of Nanocrystalline Lithium Niobate. Radiat. Eff. Defects Solids 2003, 158, 197–201. [Google Scholar] [CrossRef]
  14. Gutman, E.M. Mechanochemistry of Materials; Cambridge International Science Publishing: London, UK, 1998. [Google Scholar]
  15. Indris, S.; Bork, D.; Heitjans, P. Nanocrystalline Oxide Ceramics Prepared by High-Energy Ball Milling. J. Mater. Synth. Process. 2000, 8, 245–250. [Google Scholar] [CrossRef]
  16. De Figueiredo, R.S.; Messai, A.; Hernandes, A.C.; Sombra, A.S.B. Piezoelectric Lithium Niobate Obtained by Mechanical Alloying. J. Mater. Sci. Lett. 1998, 17, 449–451. [Google Scholar] [CrossRef]
  17. Luo, J.H. Preparation of Lithium Niobate Powders by Mechanochemical Process. Appl. Mech. Mater. 2011, 121–126, 3401–3405. [Google Scholar] [CrossRef]
  18. Diaz-Moreno, C.A.; Farias-Mancilla, R.; Elizalde-Galindo, J.T.; González-Hernández, J.; Hurtado-Macias, A.; Bahena, D.; José-Yacamán, M.; Ramos, M. Structural Aspects LiNbO3 Nanoparticles and Their Ferromagnetic Properties. Materials 2014, 7, 7217–7225. [Google Scholar] [CrossRef]
  19. Fierro-Ruiz, C.; Sánchez-Dena, O.; Cabral-Larquier, E.; Elizalde-Galindo, J.; Farías, R. Structural and Magnetic Behavior of Oxidized and Reduced Fe Doped LiNbO3 Powders. Crystals 2018, 8, 108. [Google Scholar] [CrossRef]
  20. Chadwick, A.V.; Pooley, M.J.; Savin, S.L.P. Lithium Ion Transport and Microstructure in Nanocrystalline Lithium Niobate. Phys. Status Solidi C Conf. 2005, 2, 302–305. [Google Scholar] [CrossRef]
  21. Heitjans, P.; Indris, S. Fast Diffusion in Nanocrystalline Ceramics Prepared by Ball Milling. J. Mater. Sci. 2004, 39, 5091–5096. [Google Scholar] [CrossRef]
  22. Heitjans, P.; Masoud, M.; Feldhoff, A.; Wilkening, M. NMR and Impedance Studies of Nanocrystalline and Amorphous Ion Conductors: Lithium Niobate as a Model System. Faraday Discuss. 2007, 134, 67–82. [Google Scholar] [CrossRef] [PubMed]
  23. Bork, D.; Heitjans, P. NMR Relaxation Study of Ion Dynamics in Nanocrystalline and Polycrystalline LiNbO3. J. Phys. Chem. B 2002, 102, 7303–7306. [Google Scholar] [CrossRef]
  24. Subhadra, K.G.; Kishan, R.K.; Sirdeshmukh, D.B. Systematic Hardness Studies on Lithium Niobate Crystals. Bull. Mater. Sci. 2000, 23, 147–150. [Google Scholar] [CrossRef]
  25. Weber, M.J. CRC Handbook of Laser Science and Technology Supplement 2: Optical Materials; CRC Press: Boca Raton, FL, USA, 1995; p. 18. [Google Scholar]
  26. Chatterjee, M.; Naskar, M.K. Novel technique for the synthesis of lithium aluminate (LiAlO2) powders from water-based sols. J. Mater. Sci. Lett. 2003, 22, 1747–1749. [Google Scholar] [CrossRef]
  27. Kinoshita, K.; Sim, J.W.; Ackerman, J.P. Preparation and characterization of lithium aluminate. Mat. Res. Bull. 1978, 13, 445–455. [Google Scholar] [CrossRef]
  28. Bishay, A. Recent Advances in Science and Technology of Materials; Plenum Press: New York, NY, USA, 1974; p. 281. [Google Scholar]
  29. Bartasyte, A.; Plausinaitiene, V.; Abrutis, A.; Stanionyte, S.; Margueron, S.; Boulet, P.; Kobata, T.; Uesu, Y.; Gleize, J. Identification of LiNbO3, LiNb3O8 and Li3NbO4 Phases in Thin Films Synthesized with Different Deposition Techniques by Means of XRD and Raman Spectroscopy. J. Phys. Condens. Matter 2013, 25, 205901. [Google Scholar] [CrossRef] [PubMed]
  30. Brooker, M.H.; Bates, J.B. Raman and Infrared Spectral Studies of Anhydrous Li2CO3 and Na2CO3. J. Chem. Phys. 1971, 54, 4788–4796. [Google Scholar] [CrossRef]
  31. Cava, S.; Tebcherani, S.M.; Souza, I.A.; Pianaro, S.A.; Paskocimas, C.A.; Longo, E.; Varela, J.A. Structural Characterization of Phase Transition of Al2O3 Nanopowders Obtained by Polymeric Precursor Method. Mater. Chem. Phys. 2007, 103, 394–399. [Google Scholar] [CrossRef]
  32. Phillips, W.; Amodei, J.J.; Staebler, D.L. Optical and Holographic Storage Properties of Transition Metal Doped Lithium Niobate. RCA Rev. 1972, 33, 94–109. [Google Scholar]
  33. Schirmer, O.F.; Imlau, M.; Merschjann, C.; Schoke, B. Electron Small Polarons and Bipolarons in LiNbO3. J. Phys. Condens. Matter 2009, 21, 123201. [Google Scholar] [CrossRef]
  34. Smyth, D.M. Defects and Transport in LiNbO3. Ferroelectrics 1983, 50, 93–102. [Google Scholar] [CrossRef]
  35. Semiletov, S.A.; Bocharova, N.G.; Rakova, E.V. Decomposition of a Solid Solution on the Surface of Lithium Niobate Crystals: Structure, Morphology, and Mutual Orientation of Phases. Growth Cryst. 2012, 17, 95–103. [Google Scholar]
  36. Sugak, D.Y.; Syvorotka, I.I.; Buryy, O.A.; Yakhnevych, U.V.; Solskii, I.M.; Martynyuk, N.V.; Suhak, Y.; Suchocki, A.; Zhydachevskii, Y.; Jakiela, R. Spatial Distribution of Optical Coloration in Single Crystalline LiNbO3 after High-Temperature H2/Air Treatments. Opt. Mater. 2017, 70, 106–115. [Google Scholar] [CrossRef]
  37. Holmes, R.J.; Minford, W.J. The effects of boule to boule compositional variations on the properties of LiNbO3 electro-optic devices – An interpretation from defect chemistry studies. Ferroelectrics 1987, 75, 63–70. [Google Scholar] [CrossRef]
  38. Kovács, L.; Polgár, K. Density Measurements on LiNbO3 Crystals Confirming Nb Substitution for Li. Cryst. Res. Technol. 1986, 21, K101–K104. [Google Scholar] [CrossRef]
  39. Lundberg, M. The Crystal Structure of LiNb3O8. Acta Chem. Scand. 1971, 25, 3337–3346. [Google Scholar] [CrossRef]
  40. Kalinin, S.V.; Kim, Y.; Fong, D.D.; Morozovska, A.N. Surface-Screening Mechanisms in Ferroelectric Thin Films and Their Effect on Polarization Dynamics and Domain Structures. Reports Prog. Phys. 2018, 81, 36502. [Google Scholar] [CrossRef] [PubMed]
  41. Jian, Z.; Lu, X.; Fang, Z.; Hu, Y.S.; Zhou, J.; Chen, W.; Chen, L. LiNb3O8 as a Novel Anode Material for Lithium-Ion Batteries. Electrochem. Commun. 2011, 13, 1127–1130. [Google Scholar] [CrossRef]
Scheme 1. The series of samples ground in different vials (see Table 1) with subsequent heat treatments. Pellets were pressed for optical reflectance measurements.
Crystals 09 00334 sch001
Figure 1. Particle diameter distributions of the ground samples in different vials determined by the dynamic light scattering (DLS) method.
Crystals 09 00334 g001
Figure 2. Diffraction patterns of Lithium niobate (LN) ground in different vials, stainless steel (a), alumina (b), and tungsten carbide (c). The unmarked peaks are the reflections of LiNbO3.
Crystals 09 00334 g002
Figure 3. Raman spectra of ground and heat-treated samples ball-milled for five hours in stainless steel vial, shown in the range of 40–460 cm−1 (a), and in tungsten carbide vial, shown between 125–1150 cm−1 (b).
Crystals 09 00334 g003
Figure 4. Optical reflection spectra of samples ball-milled in different vials (a) and of ground and heat-treated samples ball-milled in stainless steel vial (SS-5) (b).
Crystals 09 00334 g004
Table 1. Grinding parameters used for high-energy ball-milling.
SampleGrinding Parameters
VialBall (Same Material as the Vial)Time (h)Number of BallsBall-to-Powder Mass RatioBall-to-Powder Volume RatioSample Quantity (g)
SS-5Stainless steel11 mm
5.5 g
523.8:12.2:12.9
ALO-5Alumina12.5 mm
4.2 g
523.8:14.4:12.2
ALO-2020
WC-5Tungsten carbide11 mm
10.7 g
523.8:11.2:15.65
Table 2. Particle and grain sizes of samples ground in different vials.
SampleResulting Particle Diameter (nm)
DLS
Resulting Grain Diameter (nm)
XRD
SS-5190, (800)55 ± 18
ALO-570063 ± 21
ALO-2070037 ± 2
WC-550051 ± 6
Table 3. Measured and estimated parameters of the nanocrystalline LiNbO3 samples ground in different vials. The weight of the Li2O segregate was measured by titration before annealing, while the LiNb3O8 shell crystallized only upon annealing.
Sample100wox Li2O in As-Ground Samples (Weight%)R Mean Particle Radius, DLS (nm) **r Mean Grain Radius, XRD (nm) **dLTN LiNb3O8 Shell Thickness (nm)dOX Li2O Shell Thickness (nm)
ALO-20 *0.97 ± 0.0535018.514.62.6
WC-51.05 ± 0.1025025.511.32.0
SS-51.52 ± 0.2195 ***27.56.21.1
* Alumina contamination neglected. ** Taken for convenience from Table 2. *** Smaller peak in the size distribution neglected.

