1. Introduction
Semi-crystalline polymers are used in a large number of applications for their stiffness, strength and toughness. Their mechanical properties have been widely studied: plastic deformation, formation of crazes, cracks and cavitation, formation of fibrils and fracture [
1,
2,
3,
4,
5]. Micromechanisms governing these properties are complex due to the biphasic and hierarchical structure of these materials. Indeed, semi-crystalline polymers are composed of crystalline and amorphous phases.
Entanglements, conformational or chemical defects and chain mobility prevent macromolecular chains to crystallize over their entire length. Only limited segments of the macromolecular chains can crystallize, the chains fold and organize with each other to form crystalline lamellae growing perpendicular to the chain direction. Chain segments that cannot crystallize are expelled from the crystalline lamellae and form the inter-lamellae amorphous phase. Most of the macromolecular chains are engaged in both phases and are essential for the mechanical behavior [
6,
7]. These crystalline lamellae are periodically organized to form spherulites or shish-kebab morphologies [
8]. Crystal cell dimensions of a polymer are about 1 to 20 Å while the thickness of crystalline lamellae is a few tens of Angstroms. The stacking period of the crystalline lamellae is a few hundreds of Angstroms. The lateral extension of crystalline lamellae can reach the micrometer, incorporating defects and curvatures to form mesoscopic objects like spherulites. All levels of this hierarchical organization can have an impact on mechanical properties. For example, the cavitation depends on the density of entanglements inside the amorphous phase, thus it can be modified by annealing [
9]. It is also well established that yielding in semi-crystalline polymers is attributed to crystallinity degree and to crystalline lamellae thickness [
10]. To understand and perfect the mechanical behavior of semi-crystalline polymers, it is, therefore, crucial to have a good knowledge of their hierarchical organization. This is the aim of this work.
These different levels of organization constitute what we call the “crystalline organization”, or the structure/morphology of polymers. The crystalline structure can be studied using Wide Angle X-rays Scattering (WAXS), while the morphology, related to the size of the crystalline lamellae and their periodic organization, can be studied by Small Angle X-ray Scattering (SAXS) and microscopy.
The purpose of this article is double. First, to show how to obtain a precise knowledge of the hierarchical organization in semi-crystalline polymer from in situ simultaneous SAXS-WAXS experiment. Second, to show which are the relevant structural parameters that can evolve with processing, with temperature, during the lifetime of material or after heat treatment and thus influence the mechanical behavior of the polymer material.
In this study, we used as semi-crystalline polymer the Polyamide 11. Developed by Arkema more than 70 years ago, Rilsan® PA11 is a high-performance reference in the world of technical polymers. Produced from a renewable source (castor oil), Rilsan® PA11 is used in a large number of applications thanks to its outstanding properties, including excellent chemical resistance, easy processing, high- and low-temperature performance (−40 °C/ + 130 °C), high-dimensional stability, and low density. Many industries around the world (e.g., in the automotive, textile, oil and gas, wire and cables, and electronics sectors) have used Rilsan® PA11 for many decades for its long-term durability. Rilsan® PA11 is easy to process using most processing technologies (extrusion, extrusion-blow molding, injection molding, rotomolding and 3D printing).
PA11 displays five crystalline phases extensively studied since 1959 [
11,
12]. Three of them are of interest for this study, the α triclinic phase obtained at room temperature by a slow cooling from the melt, the high temperature hexagonal δ phase and the δ’ smectic phase obtained by quenching from the melt. A precise description of these phases can be obtained in the literature [
11,
12,
13]. PA11 is scientifically particularly interesting and informative because it exhibits a crystal–crystal transition induced by temperature, which is undetectable by thermal analysis. This transition, called the Brill transition, has already been studied by wide-angle X-ray diffraction and thermal analysis [
13,
14], but never studied by small-angle scattering. In this study, we will monitor this Brill transition with simultaneous SAXS-WAXS experiments. Indeed, in a recent publication, we showed the interest of such an experiment to study crystal–crystal transition of fluorinated copolymers [
15].
In this article, we will first show how to analyze the SAXS and WAXS data in order to obtain quantitative values, which are haracteristic of the structural organization of the material. We will thus determine the crystalline parameters (interplanar distances, crystal extension and crystallinity), the thickness of the crystalline lamellae and the period of their organization. We will show how a simultaneous SAXS-WAXS experiment during a temperature ramp, performed in the laboratory, is crucial to study the structural evolution of polymer undetectable by thermal analysis. Finally, we will show the interest and importance of thermal treatments on the structure and morphology of PA11 semi-crystalline polymer and their implications on the mechanical behavior.
2. Materials and Methods
Material: the Polyamide 11 (PA11), Rilsan® BESNO TL used in this study was provided by Arkema (Colombes, France). The density is 1.03 g·cm−3 at room temperature. Rilsan® BESNO TL film was extruded by Arkema at a thickness of 500 μm. Films were studied as-received and after 1 h 00 of annealing at 150 °C or 165 °C in a Heraeus-VTR5036 oven.
Differential Scanning Calorimetry (DSC): Measurements were performed using a Q2000 series (TA Instruments, New Castle, DE, USA). Heating and cooling ramps were performed on polymer sample at 10 °C/min under helium flow.
SAXS-WAXS: Simultaneous Small and Wide-Angle X-ray Scattering experiments were performed on the Nano-inXider SW (Xenocs, Sassenage, France) system in transmission mode using Cu Kα radiation (λ = 1.54 Å) from an X-ray microsource (GeniX3D) operating at 50 kV-0.6 mA (30 W) (Xenocs, Sassenage, France). Scattering patterns were collected using the combination of two detectors Pilatus3 (Dectris) operating simultaneously in SAXS and WAXS positions. Distances between the sample and SAXS and WAXS detectors are fixed allowing a continuous q range between 0.01 Å−1 and 4.2 Å−1 (2θ range between 0.15° to 62°) and the collimation was chosen to maximize intensity.
For the in situ thermal experiments, sample with a thickness of 500 µm was placed on a Linkam hot stage (HFSX350, Linkam Scientific Instruments Ltd, Epstom, United Kingdom) and submitted to thermal ramp (rate 20 °C/min) with plateaus every 10 °C to allow SAXS-WAXS data acquisitions. After stabilizing the temperature, the SAXS and WAXS patterns were recorded during 120 seconds at each defined temperature.
2D data were corrected for invalid pixels, cosmic radiation, pixel dead time and detector flat-field. The corrected 2D data were azimuthally integrated and corrected for geometrical effects (solid angle and Ewald sphere), using Foxtrot data reduction software (Version 3.4.9, Xenocs Soleil Synchrotron, Sassenage, France) [
16], then normalized to the number of transmitted photons. After subtraction of blank (spectra without sample), the SAXS and WAXS profiles were treated to extract structural quantitative values.
The scattering vector q is defined as and 2θ is the Bragg angle.
From SAXS profiles and using the Strobl model [
17] developed for semi-crystalline polymers organized in two phases, crystalline and amorphous, periodically structured, we calculated the one-dimensional electron density correlation function, K(z) along the lamellae normal direction z:
where L
P is the long period of the structure and
is the fluctuation of the scattering length density ρ from its mean
.
Otherwise, according to Vonk [
18], the autocorrelation function can be expressed as:
with the Invariant, Q defined as:
The calculation of K(z) is integrated in the XSACT software developed by Xenocs [
19]. The crystalline lamellae thickness (L
c) and periodicity (L
P) can be derived from K(z) [
17].
with L
a, the thickness of the amorphous phase intercalated between two crystalline lamellae.
For semi-crystalline polymers with amorphous and crystalline phases with respective electronic densities ρ
a and ρ
c, the invariant can also be written as [
20]:
(ρ
c − ρ
a)
2 is defined as the contrast,
is the volume fraction of crystalline phase. If all the crystalline and the amorphous phases are localized into the lamellae stacks, then
can be deduced from the correlation function formalism as:
WAXS patterns were fitted using the Fityk 0.9.8 software (Version 0.9.8 website:
http://fityk.nieto.pl/) [
21] in a wide 2θ range between 5° and 60°. With this software, we decompose WAXS spectrum into crystalline and amorphous contributions. The crystalline peaks are associated with sharp peaks, located at the Bragg angle 2θ
hkl, while amorphous signal is fitted by broad peaks. Interplanar distance d
hkl is deduced from the Bragg angle 2θ
hkl using the Bragg law:
If a Bragg peak is associated with only one (hkl) family of planes, its corrected full width at half maximum (FWHM) Δ2θ
hkl gives the extension of crystal domains, D
hkl, perpendicular to (hkl) planes, using the Scherrer formula [
22]:
with
being the full width corrected for the instrumental resolution [
15]. A weight crystallinity
is calculated using the following equation:
in which A
c and A
a are the areas under fitted crystalline peaks and amorphous halos, respectively. The relationship between the volume fraction of crystalline phase and the weight crystallinity is:
Polarized optical microscopy: Spherulitic structure was observed on 2 μm thin sections manufactured at low temperature using a Leica RM2265 microtome (Leica Biosystems, Wetzlar, Germany). The thin section was placed between crossed polarizers in a Zeiss Imager M2 optical microscope (Carl Zeiss, Oberkochen, Germany) equipped with a camera system.
Tensile tests were conducted according to ISO 527 standard with 1BA specimen die cut from the 500µm thick extruded sheet on a Zwick Z010 dynamometer (Zwick GmbH & Co, Ulm, Germany). Crosshead speed was 25 mm/min, elongation was followed with an optical extensometer and the load was measured with a 10 kN load cell. Stress and strain are calculated with initial dimensions of the specimen (nominal values).
It is interesting to compare the sample volume analyzed with these various methods (SAXS-WAXS, DSC and optical microscopy) to the volume deformed during a mechanical test. The volume of the sample analyzed by X-ray is around 0.25 mm3 (diameter of the X-ray beam 800 μm and thickness of sample 500 μm). The sample volume analyzed with the DSC is around 5 mm3 (5 mg mass). In optical microscopy, the thickness of the sample is reduced to around 2 μm in order to visualize small spherulites, so the volume observed is around 10−5 mm3. The useful volume of the dog bone tensile test sample is around 65 mm3, six orders of magnitude larger than the volume analyzed by microscopy. On the other hand, the volumes analyzed by SAXS-WAXS and DSC are only slightly smaller than the deformed volume in a tensile test, we consider that the results of these experiments are relevant to explain the mechanical behavior of polymers as long as samples are taken from a pertinent part of the piece.
3. Results
The as-received extruded PA11 film was characterized by DSC, SAXS and WAXS. Results of this preliminary study are reported in
Figure 1. 2D-SAXS and 2D-WAXS raw data exhibit a very slight orientation induced by the extrusion process. Since this orientation is weak, we never consider it in this study. All SAXS and WAXS spectra presented hereafter were obtained after radial integration.
The first heating (
Figure 1a) characterizes the structural state of the as-received film. On the first heating curve, the glass transition temperature is located around 50 °C. A small endothermic peak is observed above the glass transition, related to film ageing at room temperature. This endothermic signal commonly associated with the relaxation of dense domains in the materials appears just above the glass transition temperature and only on the first heating of aged samples [
23]. At higher temperature, the melting peak is located at T
m = 189 °C, the integration of the signal leads to an enthalpy around 57 J/g. After a 10 min isotherm at 238 °C, the thermal history is erased, the cooling at 10 °C/min shows a crystallization at T
c = 162 °C with an enthalpy around 59 J/g. The second heating until 230 °C characterizes the melting of PA11 crystals obtained during cooling from the melt at 10 °C/min. While the melting enthalpy (59 J/g) is comparable with those measured during the first heating, the melting temperature, 183 °C, is lower than the temperature measured at the first heating. Crystals created during the film extrusion are more stable than those created from the isotropic melt crystallization at 10 °C/min.
The SAXS spectrum, shown
Figure 1b, presents a correlation peak characterizing the periodic organization of crystalline lamellae. The correlation function calculated from this SAXS spectrum is shown in the insert. The long period L
P, estimated at the position of the first maximum of K(z), is measured around 72 Å. The thickness of the crystalline lamellae, L
c = 23 Å, is measured at the intersection between the two tangents as shown in
Figure 1b.
The WAXS spectrum is reported in
Figure 1c. Using Fityk software [
21], we decomposed the spectrum in broad and sharp peaks respectively associated with amorphous and crystalline phases. The sum of the broad peaks is filled in grey in
Figure 1c, with the amorphous contribution around 20° corresponding to the superposition of two peaks. This is usually the case for polyamide 11, in which the non-crystalline phase is composed of a smectic phase and an amorphous phase. This smectic phase, δ’, is a phase described as microcrystals or bundle with a hexagonal order at short distance [
24,
25]. The width of the broad peak associated with this δ’ phase (Δ2θ
δ’ ~ 5°) is intermediate between the width of the amorphous peak (Δ2θ
a = ~ 10°) and the width of crystalline peaks (Δ2θ
c ~ 1.5°). The three main crystalline peaks could be indexed considering the triclinic α phase initially published by Aelion [
26], Little [
27] and Slichter [
11], confirmed and improved later by other authors [
28,
29,
30]. The corresponding cell parameters are summarized in
Table 1. These three main peaks are indexed as d
001, d
200 and d
210/d
010, considering the unit cell proposed by all these authors (except Slichter, who described “a” parameter twice as small, and hence different distances d
001, d
100 and d
110/d
010). For the as-received PA11, interplanar distances are:
The two Bragg peaks d200 and d210/d010 are not well separated due to a poor perfection of the crystallization. We will discuss this point later. From the decomposition of the WAXS spectra in amorphous and crystalline peaks, we deduced a weight crystallinity .
3.1. As-Received Sample: Thermal Cycle until 170 °C
Since no endothermic signal is observed during the first heating between 0 °C and 170 ° C (red arrow in
Figure 1a), with the exception of the small endotherm caused by physical ageing of the amorphous phase, no structural change is expected. However, significant evolutions were measured by performing simultaneous SAXS-WAXS experiment during a cycle up to 170 ° C.
3.1.1. In Situ SAXS-WAXS Experiment
SAXS and WAXS signals evolution during the thermal cycle from 25 °C to 170 °C is shown in
Figure 2 with a 3D representation. Along this thermal cycle, the sample is never melted, but the initial state of the as-received sample (white filing in
Figure 2a,b) and the final state after the temperature cycle (black filing in
Figure 2c,d) are not the same, both at SAXS and WAXS.
In
Figure 2a,c, the general shape of the SAXS signal is the same as in
Figure 1b, the broad peak characterizes the periodic organization of the crystalline lamellae and the position of this peak, q
max, is approximatively 2π/L
P. The intensity of this peak depends on crystallinity and on contrast, i.e., the difference of electronic densities between crystalline and amorphous phases. We observe a significant evolution of this peak during heating: its position decreases towards smaller q while its intensity increases. This evolution is roughly irreversible.
At wide angles, in
Figure 2b,d, we observe mostly the Brill transition. The two Bragg peaks associated with d
200 and d
210/d
010 interplanar distances progressively get closer as the temperature increases to form a single peak. This single peak is associated with the interplanar distance d
δ of the high temperature hexagonal δ phase. Moreover, this α to δ phase transition is reversible during cooling to room temperature. The final WAXS spectrum, highlighted in black, in
Figure 2d shows a significant improvement of the crystalline perfection (higher separation of (200) and (210)/(010) lines), compared to the initial WAXS spectrum (
Figure 2b).
Therefore, after processing and without post-treatment, the polymer material evolves irreversibly during the thermal cycle, even if no enthalpic event occurs during the cycle (
Figure 1a).
3.1.2. Quantitative SAXS Analysis
For each temperature along the cycle, SAXS spectrum is analyzed and the correlation function, K(z), is calculated as well as the invariant Q. We deduced the thickness of the crystalline lamellae, L
c, and the long period L
P from K(z). The thickness of the amorphous region L
a is deduced from Formula (4). The thermal evolution of these four physical values is plotted in
Figure 3 during heating and cooling.
Between 25 °C and 105 °C, the long period L
P, the crystalline and amorphous thickness L
c and L
a increase slightly, respectively from 74 Å to 81 Å for L
P, from 25 Å to 28 Å for L
c and from 49 Å to 53 Å for L
a. At high temperature, from 110 °C to 170 °C, the increase is more significant: L
P,L
c and L
a reach, respectively, 115 Å, 38 Å and 77 Å at 170 °C. During cooling, these three distances decrease slowly and almost linearly without any significant failure. As already observed in
Figure 2, the evolution is not reversible, L
P and L
c are, respectively, 95 Å and 31 Å after cooling. The evolution of the invariant Q is also significant during the thermal cycle. Q does not evolve from room temperature to 100 °C, then Q increases until 170 °C. During cooling, Q increases very slightly and linearly throughout the entire temperature range.
During heating between 45 °C and 65 °C, we observe an increase with a jump for L
P and L
a, while only a linear small increase is observed for L
c. We interpret this jump of L
a and hence of L
p by the relaxation of the constrained amorphous phase associated with the small endothermic signal above T
g (
Figure 1a). Except for this accident, the linear evolutions of L
c and L
a during heating between 25 °C and 105 °C and during cooling from 170 °C to room temperature can be interpreted as thermal dilation and contraction of crystalline and amorphous phases. However, between 110 °C and 170 °C, during the first heating, the significant increases of L
P and L
c are probably due to the melting of small crystals and the reorganization of the crystalline lamellae distribution. It is interesting to note that through the thermal cycle, the ratio L
c/L
P remains almost constant at 0.3. That means that the reorganization keeps constant the crystalline ratio in the lamellae stacks. As L
c/L
P ratio does not change, the irreversible increase of the invariant Q may be due to an increase of the contrast, (ρ
c − ρ
a)
2, at crystal/amorphous interface (see Formulas (5) and (6)) associated with the improvement of the crystalline perfection.
3.1.3. Quantitative WAXS Analysis
The thermal evolution of WAXS spectra observed in
Figure 2b,d corresponds to the Brill transition, which is a crystal-to-crystal non-endothermic transition from the triclinic α phase to the hexagonal δ phase. The accurate analysis of WAXS spectra carried out below allows a precise quantification of the evolution of the amorphous and crystalline phases.
WAXS spectra were decomposed in crystalline and amorphous contribution in order to measure the interplanar distances d
001, d
200 and d
210/d
010 and the amorphous distance d
Am deduced from the amorphous peak position. From this decomposition, the crystal extension D
001 along the chain direction and D
200 perpendicular to the chain direction are also deduced (Formula (8)) as well as the weight crystallinity
(Formula (9)). The thermal evolution of these quantities is reported in
Figure 4. In
Figure 4a, upon heating, d
200 decreases while d
210/d
010 increases and these two distances become equal around 70 °C. For higher temperature, only one Bragg peak is observed with an increase of the associated interplanar distance until 170 °C (thermal expansion). Upon cooling, this Brill transition is reversible with the unique Bragg peak splitting in two peaks around 110 °C. At room temperature, d
200 is higher (4.33 Å) than the initial value (4.30 Å) in the as-received sample and d
210/d
010 is significantly smaller (3.90 Å) than the initial distance (3.99 Å).
The distance d001 along the chain direction evolves continuously with temperature with a change at the Brill temperature. After heating to 170 °C and then cooling, the characteristic distance d001 is reduced from 12.4 Å to 12.3 Å.
The distance dAm, characteristic of the amorphous phase, increases continuously with the temperature, with a small plateau at the Brill temperature. Its reversible evolution with the temperature upon heating and cooling reflects the expansion and compression of the amorphous phase with the temperature. We added to this graph a value measured in the melt with another sample, dAm evolves from 4.3 Å at room temperature to 4.7 Å at 200 °C.
In PA11, the gap between the two main diffraction peaks, d
200 and d
210/d
010 characterizes a crystalline quality. This notion previously introduced for polyamide 6 [
31] is used for polyamide 11 and named crystal perfection index (CPI) [
13]. The CPI for the triclinic phase is defined as follows:
where the constant Ω is chosen (at 0.177) to adjust the CPI value to 1, for the «more perfect» α phase obtained on cast films from m-cresol solution [
11,
14]. With this criterion, the perfection index of the initial PA11 sample is 0.44 before the thermal cycle and 0.62 after the full 170 °C thermal cycle.
From the decomposition of WAXS spectra into crystalline and amorphous contributions, we deduce the weight crystallinity,
(Formula (9)). The evolution of this crystallinity during the cycle to 170 °C is reported in
Figure 4b. While
decreases slightly during heating, a significant increase is measured during cooling. The crystallinity obtained after the cycle at 170 °C is 29% compared to 23% for the as-received film. The evolution of D
001, the crystal extension along the chain direction is reported in
Figure 4c. This value increases significantly during cooling like the crystallinity.
During the experiment, heating to 170 °C without melting and cooling down to room temperature on the as-received extruded film, we observed the reversible Brill transition from the α to the δ phase and also a significant improvement of the quality of the crystalline phase and of the weight crystallinity (). We also note a significant increase of the crystalline lamellae thickness (Lc) and of their periodicity (LP) keeping approximately constant the ratio Lc/LP. The heating to 170 °C and the cooling down seems to have acted as an annealing on the as-received PA11.
3.2. In Situ SAXS-WAXS Experiments during Annealing
We monitored in situ the evolution of the SAXS and WAXS pattern during 1 h 00 annealing at 150 °C, 160 °C, 170 °C and 180 °C. For each annealing condition, SAXS-WAXS acquisitions were recorded at 25 °C before and after annealing, and every 10 minutes during the isotherm. For each annealing, the evolutions observed during the isotherm at high temperatures (150 °C, 160 °C, 170 °C and 180 °C) in the δ phase do not seem very marked both on the WAXS spectra as on the SAXS spectra. However, evolutions after annealing and cooling down to 25 °C are significant and especially for high annealing temperatures (T > 160 °C). In
Table 2, we compare the evolution of the main structural parameters, measured at 25 °C, before and after each annealing.
The annealing temperature seems to be more important than the annealing duration for this short isotherm (1h00). The annealing step induces an increase of the weight crystallinity (
), of the crystalline perfection (CPI) and of the crystalline density (Q). This crystallization improvement results in a thickening of the crystalline lamellae with only a slight increase of the ratio L
c/L
P. In
Table 2, we compare the evolution of the lamellae thickness L
c with the evolution of D
001. These two dimensions evolve similarly with an increase after the annealing.
3.3. Annealed Samples at 150 °C and 165 °C in An Oven
To better study the influence of annealing on the mechanical and on the structural properties of PA11, we conducted a 1 h 00 annealing, at 150 °C and 165 °C, in an oven to obtain larger samples to perform SAXS-WAXS, DSC and tensile test.
The SAXS-WAXS and DSC results summarized in
Table 3 are nearly the same as the results shown in
Table 2. Small differences can be explained by the shift between the effective temperature of the sample in the Linkam hot stage under vacuum in the Nano-inXider (
Table 2) and in the oven under atmospheric pressure (
Table 3). The annealing induces a significant increase of the weight crystallinity (
), of the crystalline perfection (CPI) and of the crystalline lamellae thickness and organization (L
c and L
P) with only a slight increase of the L
c/L
P ratio. Once again, D
001 and L
c evolve in the same way.
3.3.1. Effect of Annealing on Thermal Stability
We performed a thermal cycle, heating to 150 °C and cooling down on the sample annealed for 1 h 00 at 150 °C in an oven. During this experiment, the temperature never exceeded the annealing temperature.
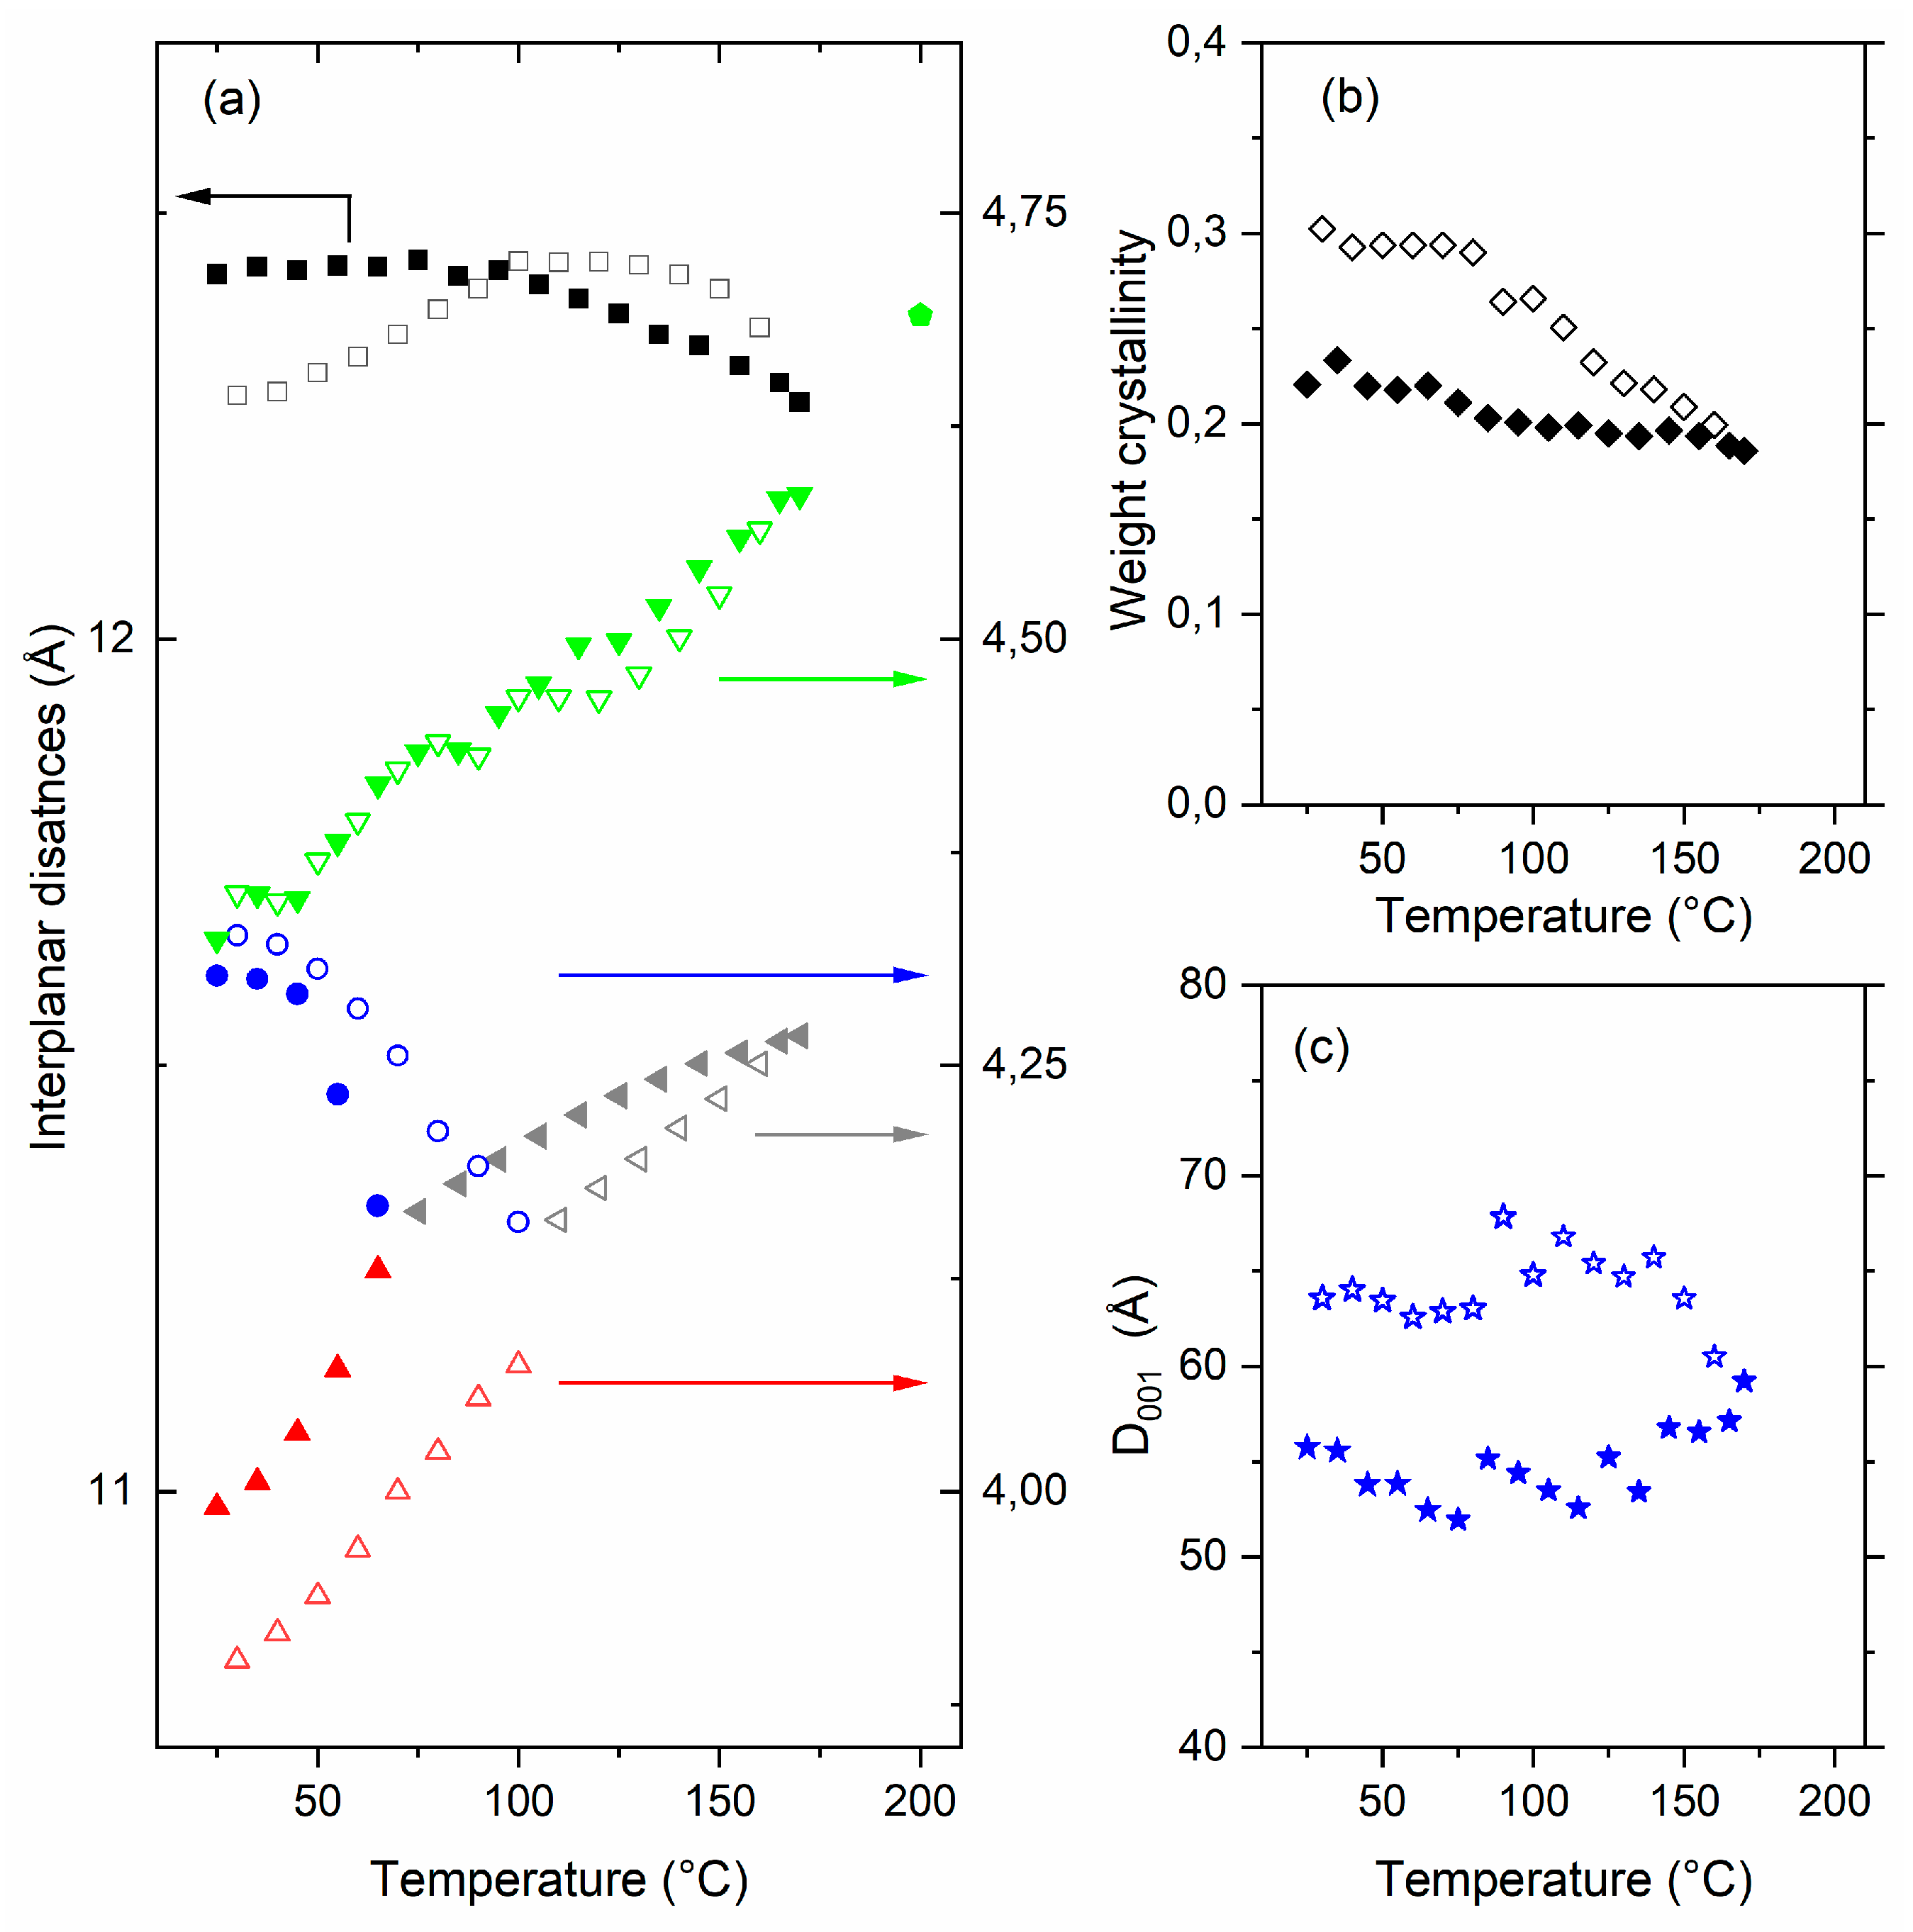
The evolution of characteristic distances measured with WAXS and SAXS experiments are reported in
Figure 5a,b. Evolutions are reversible and with similar initial and final states. In that case, evolutions are only due to the Brill transition. The amount and the quality of the crystalline phase are the same before and after the thermal cycle, as well as the lamellae organization.
Upon heating, d200 decreases while d210/d010 increases, d200 and d210/d010 become equal at the Brill transition (95 °C). Above the transition, the δ phase interplanar distance, dδ, increases with the temperature. In the amorphous phase, the distance dAm increases similarly to d210/d010 below the Brill transition, then a small decrease and a plateau are observed between 90 °C and 125 °C, and finally dAm increases again at higher temperature. The interplanar distance along the chain direction, d001, increases below the Brill transition and does not evolve above. The weight crystallinity at about 0.25 below the Brill transition decreases to 0.20 between 90 °C and 125 °C, then it is constant above 125 °C.
From SAXS (
Figure 5b), we observe that the period of the crystalline lamellae, L
P, increases slightly below the Brill transition, then it increases from 87 Å at 80 °C to 94 Å at 125 °C and remains constant above 125 °C. In the same time, the thickness of the crystalline lamellae continuously increases from 30 Å at 25 °C to 34 Å at 150 °C. These two variations lead to an expansion of L
a, the thickness of the amorphous region intercalated between the crystalline lamellae, between 80 °C and 125 °C. L
a is constant below 80 °C and above 125 °C.
In contrast to weight crystallinity, which significantly decreases during heating, the ratio Lc/LP and the invariant, Q, do not change significantly along the thermal cycle. We will discuss later the correlation between the WAXS and the SAXS data, in particular dAm, , La and Lc/LP.
This experiment shows that annealing at a given temperature, T
anneal, improves significantly the crystal perfection (
Table 3) and guarantees the stability of the structure and morphology of the polymer material up to this annealing temperature T
anneal (
Figure 5) during the material lifetime.
3.3.2. Effect of Annealing on Mechanical Properties
Although the aim of this work was not to study in detail the mechanical behavior of PA11, it is interesting to show that changes in structure and morphology induce significant changes in mechanical behavior. We carried out tensile test experiments on these three samples (as-received and annealed at 150 °C and 165 °C) at room temperature (
Figure 6).
Two successive yields are observed on these tensile curves. The first one at a strain around 5 % (see insert in
Figure 6) can be attributed to plastic deformation into the glassy amorphous phase, because the test temperature is below the glass transition of PA11. The yield stress associated with this “glassy” yield is higher for the as-received sample than for annealed ones. Indeed, the yield stress of a glassy polymer increases with the ageing time [
32]. The ageing time is higher in the as-received PA11 than in the recently annealed ones. At higher strain, this “glassy” yield is followed by a second yield associated with plastic deformation in the crystalline phase.
In polyamide 11, this yield point is diffuse, and it appears at high strain of around 30–40% [
32]. A structural transition from the triclinic α phase to the pseudo-hexagonal δ’ smectic phase takes place during this necking [
32,
33,
34]. Stress and strain at second yield increase significantly after annealing, respectively from 35 MPa to 40 MPa and from 30% to 40%. This mechanical enhancement is mainly due to the perfection of the crystal and to the thickening of the crystalline lamellae. Finally, the post-yield behavior is characterized by a plateau followed by strain hardening. The plateau strain range and the strain hardening slope depend on the annealing temperature. Both chain entanglements and inter-crystalline tie molecules, that have a major influence in this high strain range, have probably been modified during high temperature annealing [
35].
4. Discussion and Conclusions
Influence and importance of thermal treatment. The essential role of the heat treatment performed after the processing of a polymer part is to stabilize structural properties of this part. We have clearly shown that the annealing step at 150 °C stabilized PA11 structural properties. Heating and cooling to a temperature lower than the annealing temperature is reversible and does not change the structure and morphology. In this study, only short annealing, less than 1h00, was studied. For this kind of annealing, the temperature reached during annealing defines the morphology, particularly the thickness of the crystalline lamellae L
c and their periodicity L
P. Indeed, it is interesting to note that the values of L
P and L
c measured at 150 °C on the PA11 sample annealed at 150 °C (
Figure 5b) respectively 95 Å and 34 Å are the same than the values reached at 150 °C for the as-received PA11 (see
Figure 3a). Annealing induces a perfection of the crystalline phase, an increase of the weight crystallinity, a thickening of the crystalline lamellae, but also the modification of the lamellae distribution with the disappearance of the smallest ones.
Weight and volume crystallinity. It is possible to evaluate the crystallinity of a semi-crystalline polymer using WAXS, SAXS and DSC experiments. While WAXS and SAXS give crystallinity values at the temperature of the measurement, DSC experiment measures the amount of crystalline material that melts at the melting temperature. WAXS and DSC experiments measure weight crystallinities. From SAXS experiment, we measure L
c/L
P, and if we consider that all the amorphous phase is located only between the crystalline lamellae into spherulites, thus this ratio L
c/L
P gives the volume crystallinity. According to Formula (10), the weight crystallinity,
, is always larger than the volume crystallinity (ρ/ρ
c < 1). In the case studied here, for all PA11 samples and whatever the temperature (
Table 2 and
Table 3 and
Figure 5c–e), the weight crystallinity is smaller than the ratio L
c/L
P, which supposes the existence of an inter-spherulite amorphous phase. We conducted polarized light optical microscopy to confirm or not the existence of this inter-spherulite amorphous phase.
In the polarized optical microscopy picture (
Figure 7) obtained on a 2 μm thin section, the sample appears birefringent with characteristic “Maltese cross”. The small birefringent objects (1 to 3 μm) are identified as spherulites. It is not easy to observe the separation between these objects. It is, therefore, difficult to conclude by microscopy whether or not there is an amorphous phase between spherulites.
However, based on previous SAXS-WAXS results, , we can conclude that there might exist an inter-spherulite amorphous phase in addition to the amorphous phase located between the crystalline lamellae in the spherulites. Lc/LP remains only a measure of the volume crystallinity into spherulites and cannot be considered as a macroscopic value for the entire sample.
From the DSC experiment, we measure the melting enthalpy that is proportional to the weight fraction of crystalline phase that melts at the melting temperature. To calculate a weight crystallinity from DSC, we have to normalize measured enthalpy by the enthalpy of a 100% crystallized PA11, ΔH
100%. This value can be obtained by extrapolating the linear relationship between the heat of fusion, ΔH
m and the specific volume, 1/ρ, of various samples with different amount of crystalline phase, to the 100 % crystalline sample. To do that, the calculated full crystalline density is used. Two previous publications used this method and obtained two different values of ΔH
100%: 226.4 J/g [
36] and 189.05 J/g [
37]. Using ΔH
100% = 226.4 J/g (189.05 J/g) the DSC weight crystallinity of the as-received PA11 is 25 % (30 %), while after annealing at 150 °C it increases to 28% (33%). A better agreement between WAXS and DSC weight crystallinity is obtained using ΔH
100% = 226.4 J/g.
Crystal–crystal transition. The Brill transition is a crystal–crystal transition that occurs in several polyamides and co-polyamides [
38,
39,
40], including PA11 [
13,
14,
41]. It has been widely studied in particular using WAXS and DSC experiments [
13,
39,
41]. At low temperature, in the α phase, hydrogen bonds between adjacent chains are located in the (
) planes. During heating, interplanar distances evolve differently, depending on the nature of interactions between planes: H bonds between (200) planes or van der Waals interactions between (010) planes. The structural evolution at the Brill transition, from the α phase to the δ phase, can be achieved by a decrease of γ = (
,
) angle toward 60°, by a thermal expansion between the (010) planes and by an increase of the α = (
,
) angle toward 90° between chains and (
,
) plane [
13,
42]. The evolution of the chain orientation, i.e., of the α angle is confirmed by our experiment and the behavior of d
001, indeed d
001 increase from 25 °C to the Brill transition and is constant above the transition. Above the Brill transition, the random distribution of H bonds around the axis of the chains is well-established [
13] and confirmed by the single thermal evolution of the single interplanar distance. The disappearance of this sheet-like structure at the Brill transition modifies the stretching of this polyamide. The biaxial stretching of PA11 becomes possible if the draw temperature is chosen beyond the Brill transition temperature [
37]. This evolution shows the essential influence of structural properties on the mechanical behavior of semi-crystalline polymers.
In this study, we confirm the correlation, previously reported by Pepin et al. [
13], between the Brill transition temperature and the crystalline perfection. Indeed, during heating, we measured a Brill transition temperature of about 70 °C and 90 °C for PA11 having respectively a crystal perfection index (CPI) of 0.44 (as-received PA11) and 0.69 (annealed at 150 °C).
The advantage of simultaneous SAXS-WAXS experiments is to correlate the SAXS and WAXS data obtained in the same volume at the same temperature. One can thus compare the evolutions of the intra-spherulites’ volume crystallinity, L
c/L
P, with the weight crystallinity,
, measured respectively by SAXS and WAXS (
Figure 5c,e).
decreases from 0.25 to 0.20 (−25%) above the Brill transition (between 90 °C and 125 °C) while L
c/L
P appears constant (−3%) in the same temperature range.
Lc/LP is nearly constant between 85 °C and 125 °C, while it increases slightly below 80 °C and above 125 °C. This evolution corresponds to a small decrease of La/Lc below 80 °C and above 125 °C and no evolution between these two temperatures. We conclude that, between 80 °C and 125 °C, the crystallinity in the spherulites does not evolve, nor does the contrast between the amorphous and the crystalline phase.
From WAXS, we observe that below 90 °C and above 125 °C, the interplanar distances in the crystal and the distance dAm in the amorphous phase increase. So in these two temperature ranges, the crystalline and amorphous densities, respectively ρc and ρa, decrease. Between 90 °C and 125 °C, dδ increases, while dAm is constant. In this temperature domain, the ρc decreases, while ρa appears constant. The weight crystallinity measures the weight proportion of the crystalline phase in the volume analyzed by the X-ray beam. In this volume, the crystal and amorphous weights evolve as the densities ρc and ρa. The non-variation of ρa, and the decrease of ρc explain the decrease of the weight crystallinity between 90 °C and 125 °C.
From SAXS, we measured a decrease of the intra-spherulites amorphous phase density between 90 °C and 125 °C. The density of the total amorphous phase, intra- and inter-spherulites, deduced from WAXS experiment, appears constant in the same temperature range. We deduce a probable increase of the inter-spherulites amorphous phase density. We conclude that the free volume of the amorphous phase evolves at the Brill transition, both in the intra- and inter-spherulites, but not in the same way.
Recently, we studied another crystal–crystal transition by simultaneous SAXS-WAXS experiments, which was the Curie transition in vinylidene-based copolymers [
15]. We showed that a first-order discontinuous transition induces a jump of the invariant Q at the transition temperature while only a small change of the slope is observed for a continuous structural transition, due to change of the crystalline and amorphous densities at the crystal/amorphous phase interface. PA11 behaves differently; the invariant Q does not evolve at the Brill transition.
WAXS and SAXS measurements. This study reveals that a simultaneous SAXS-WAXS analysis is very effectiveness to monitor the structural evolution of semi-crystalline polymers during a temperature cycle or after thermal annealing. For example, the evolution of the amorphous phase described in the previous paragraph can only be obtained thanks to the simultaneous SAXS and WAXS acquisition. Moreover, simultaneous SAXS-WAXS experiments provide interesting comparison between the thickness of the crystalline lamellae, L
c, and the extension of the crystal along the chain direction D
001. The chains are perpendicular to the crystalline lamellae (in the high-temperature δ phase); thus, L
c and D
001 correspond to the same dimension, but these two numerical values are different, even if they evolve in the same way with the temperature. The reason is that these two values are deduce from different models. L
c is deduced from the correlation function calculation interpreted in the case of ideal lamellae. D
001 is calculated from the Scherrer formula and correspond to the apparent grain size of a “perfect crystal”, perpendicular to the (001) direction [
22]. In fact, in the sample, we have a distribution of crystalline lamellae with various thickness periodically organized with a distribution of periodic distance L
P. L
c and D
001 correspond to different measures of this distribution of thicknesses.
In this paper, we pointed out how to analyze WAXS and SAXS data in order to extract quantitative information on chains organization in wide range of distances from some Å (WAXS) to few hundred of Å (SAXS). WAXS spectra recorded and analyzed in a broad 2θ range are decomposed into crystalline and amorphous contributions. This analysis allows a precise understanding of the evolution of the crystalline state with temperature. The analysis of the SAXS spectra using the correlation function formalism enables a good knowledge of the thickness, the density and the periodic organization of the crystalline lamellae. All these structural quantities can be used to model the macroscopic properties of polymeric materials, for example their mechanical properties.

 ,
, 


