Article

NMR Crystallography at Fast Magic-Angle Spinning Frequencies: Application of Novel Recoupling Methods

by
Mukul G. Jain
,
Kaustubh R. Mote
and
Perunthiruthy K. Madhu
*
TIFR Centre for Interdisciplinary Sciences, Tata Institute of Fundamental Research, Sy. No. 36/P, Gopanpally, Hyderabad 500107, India
*
Author to whom correspondence should be addressed.
Crystals 2019, 9(5), 231; https://doi.org/10.3390/cryst9050231
Submission received: 4 April 2019 / Revised: 24 April 2019 / Accepted: 26 April 2019 / Published: 29 April 2019
(This article belongs to the Special Issue NMR Crystallography)

Abstract

:
Chemical characterisation of active pharmaceutical compounds can be challenging, especially when these molecules exhibit tautomeric or desmotropic behaviour. The complexity can increase manyfold if these molecules are not susceptible to crystallisation. Solid-state NMR has been employed effectively for characterising such molecules. However, characterisation of a molecule is just a first step in identifying the differences in the crystalline structure. 1 H solid-state Nuclear Magnetic Resonance (ssNMR) studies on these molecules at fast magic-angle-spinning frequencies can provide a wealth of information and may be used along with ab initio calculations to predict the crystal structure in the absence of X-ray crystallographic studies. In this work, we attempted to use solid-state NMR to measure 1 H - 1 H distances that can be used as restraints for crystal structure calculations. We performed studies on the desmotropic forms of albendazole.

1. Introduction

Desmotropes are tautomers of a compound that can be isolated in solid state [1]. This phenomenon is observed in organic and pharmaceutical molecules [1,2]. The physical, chemical and biophysical properties of the desmotropic forms differ extensively. The review [3] by Holm and co-workers discusses the problems faced by pharmaceutical industry with polymorphism and desmotropy. Thorough solid-state characterisation of these molecules is crucial for pharmaceutical use. Studying these molecules can be easy if both the isomers can be crystallised. In some instances, these molecules do not form crystals [4]. Solid-state NMR is the method of choice for characterisation under such circumstances. ssNMR has been employed successfully to differentiate between desmotropic isomers, for example the active pharmaceutical compounds Irbesartan [5] and albendazole [6].
Tautomerism in small molecules involves mostly a proton migrating between different sites. Thus, detection of 1 H NMR signals is better in tautomeric structures as it can identify the nuclear site whose position is affected the most. Further, intermolecular protons are in close proximity to each other in these molecules compared to other NMR active nuclear spins, thus making it possible to measure intermolecular distance restraints. The intermolecular distance information is absolutely essential for NMR crystallographic approaches. With the increasing magic-angle-spinning (MAS) frequencies, high-resolution spectroscopy of 1 H has become possible in solid-state NMR without the use of sophisticated homonuclear decoupling sequences. This has led to the development of new experimental methodologies for measuring qualitative or quantitative distance information employing 1 H spins. This structural information can be complementary to X-ray crystallography since Hydrogen atoms are invisible to X-ray crystallography. The quantitative intra- and inter-molecular distance information from 1 H can be used to characterise the molecules and predict the packing form of the molecules in the crystal. The information can also be used as starting point for the ab initio structural calculations for predicting the crystal packing structure. This combination of inter-molecular distances from NMR and molecular modelling can predict the crystal structures of the compounds that exist as powders [7,8,9,10,11,12,13,14,15,16,17,18,19].
The visualisation of 1 H - 1 H interactions is particularly useful in small pharmaceutical molecules and reflects on intramolecular, intermolecular, molecular-packing and hydrogen-bonding interactions. Experimental methods such as BASS-SD [20], SERP [21] and 1 H single quantum-double quantum correlation experiments can provide these information [22]. Here, we showed that quantitative 1 H - 1 H distances can be measured at fast MAS frequencies using SElective Recoupling of Protons (SERP) experiment. SERP can measure selective distances between two protons up to 4 Å if the chemical shifts are resolved. Here, we studied the model system of albendazole and show that ssNMR techniques at fast MAS conditions can be used to characterise the molecule and estimate the inter-molecular 1 H - 1 H distance quantitatively.

2. Materials and Methods

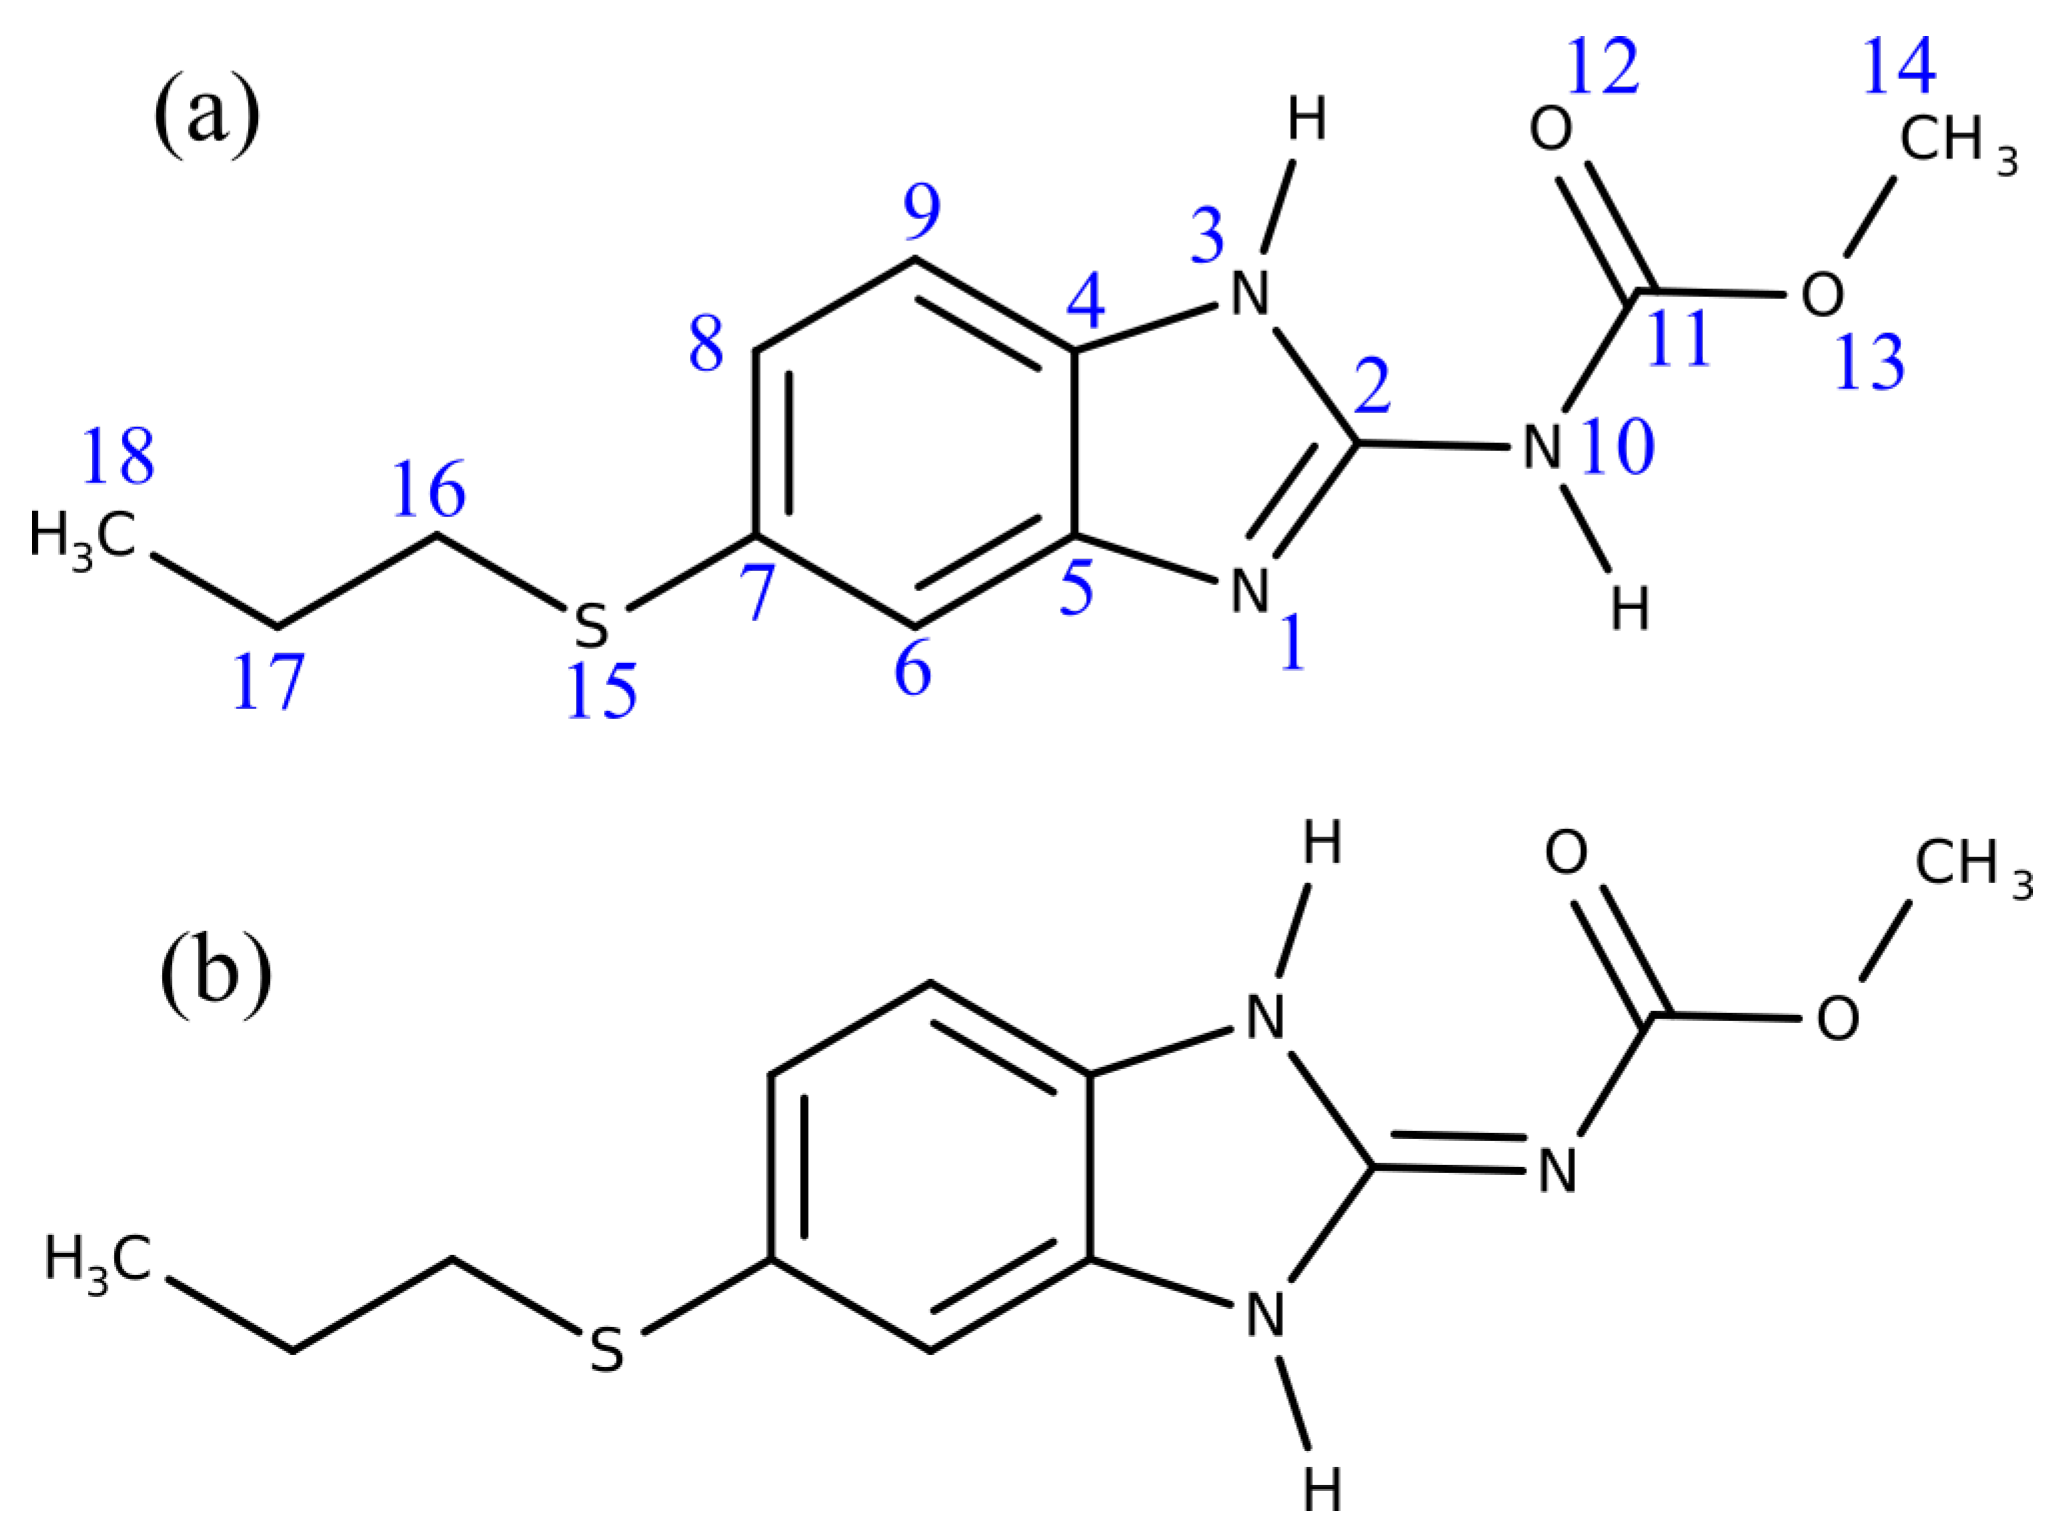
2.1. Materials Preparation and Structures

Albendazole (ABZ) and HPLC-grade methanol were purchased from Sigma-Aldrich and used without any further processing. The solid form II of albendazole was recrystallised from a methanol solution as reported in Pranzo et al. [23]. The purchased ABZ corresponded to the form I (Figure 1a) and 100 mg was dissolved in 100 mL methanol, heated at 40 °C and stirred until clear solution was obtained. The solution was syringe filtered in 0.1 micron filter and evaporated slowly under ambient conditions for a period of 10 days. Light brown crystals of ABZ II (Figure 1b) were obtained. There is no literature available with protocol for crystallising ABZ I, but the crystal structure has been reported [24].

2.2. Fourier Transform Infrared and X-ray Crystallographic Studies

Fourier Transform Infrared (FT-IR) spectra of the ABZ form I and II were recorded with a Bruker Alpha infrared spectrometric analyser using the KBr pellet method. X-ray crystallographic data were recorded on the ABZ form II on a Bruker SMART APEX CCD diffractometer (Bruker, Germany with a Mo K α radiation ( λ = 0.71073 Å) at ambient temperature.

2.3. Solid-State Nuclear Magnetic Resonance

All the NMR experiments were measured at a MAS frequency of 57.143 kHz on a triple-resonance 1.3 mm HXY probe at a field of at 11.7 T in a Bruker Avance III WB NMR spectrometer, TIFR, Hyderabad. One-dimensional 1 H spectra were recorded with 8 scans with a recycle delay of 12 s. 13 C double quantum CPMAS [25] spectra were recorded with 1024 scans with a recycle delay of 12 s using radio frequency (RF) amplitude of 40 kHz and 20 kHz on 13 C and 1 H, respectively. A cross-polarisation, CP, mixing time of 2 ms and rCW A p A decoupling [26] with RF amplitude of 12 kHz were used. 1 H - 13 C HETCOR experiments were recorded by detecting 1 H with 32 transients in the direct dimension and 192 points in the indirect dimension on 13 C with 12 kHz rCW A p A decoupling during indirect evolution. The forward CP mixing was 2 ms and the reverse CP was 500 μ s. The short reverse CP contact time was chosen to restrict the polarisation transfer to short-range contacts. Chemical shifts were externally referenced using histidine resonances. 1 H - 1 H distances were measured using the pseudo-2D SERP pulse scheme (Figure 2) with radio frequency amplitude of 86 kHz used for the SERP block after selective excitation of one of the peaks and transferring magnetisation to coupled peaks. The selective excitation was performed by a pulse of 6 ms using Gaussian cascade (Q5) shape [27] with an RF of 2.0 kHz. The SERP experiment recoupled protons selectively using double-quantum dipole-dipole condition achieved by placing the transmitter at the centre of the resonance frequencies of the protons to be recoupled during the t 2 evolution, as in Figure 2. Recoupling was performed by the P 0 P 180 block and constant-time duration was ensured by applying P 0 P 180 P 90 P 270 block for the rest of the mixing period. P 0 P 180 block spans two rotor-periods and was incremented in steps of 2 (i.e., P 0 P 180 P 0 P 180 corresponding to four rotor-periods = 70 μ s at 57.143 kHz of MAS).

2.4. ssNMR Simulations

Simulations of the SERP experiments were performed using the SIMPSON simulation package [28,29]. The simulations were performed at a MAS frequency of 57.143 kHz using the pulse parameters exactly matching with experiments considering 144 crystallites using the REPULSION scheme [30] and 64- γ angles. The spin system was prepared by considering all the spins contributing to the resonances with in a sphere of 4 Å. Intensity of the recoupling curves was calculated relative to the intensity of the source magnetisation peak at the mixing time of 0 μ s. Intensity of the recoupling curve from the simulations was scaled to match the experimental values, as suggested previously [21]. SIMPSON spin system containing H6, H9 and H10/H1 (intermolecular) were considered for fitting the build-up between H6 to H10 and spins for H3, and three spins for H14 with coupling corresponding to their distances were used for fitting the distance between H3 and H14.

3. Results and Discussion

3.1. Characterisation

Characterisation of the molecules was performed by FT-IR (Figure 3) and X-ray crystallographic studies. The FT-IR absorption bands of the molecules matched the results reported by Chattah et al. [6]. The X-ray crystallographic structure of ABZ II matched that of the reported data (CCDC Deposition: 736654) from Pranzo et al. [23].

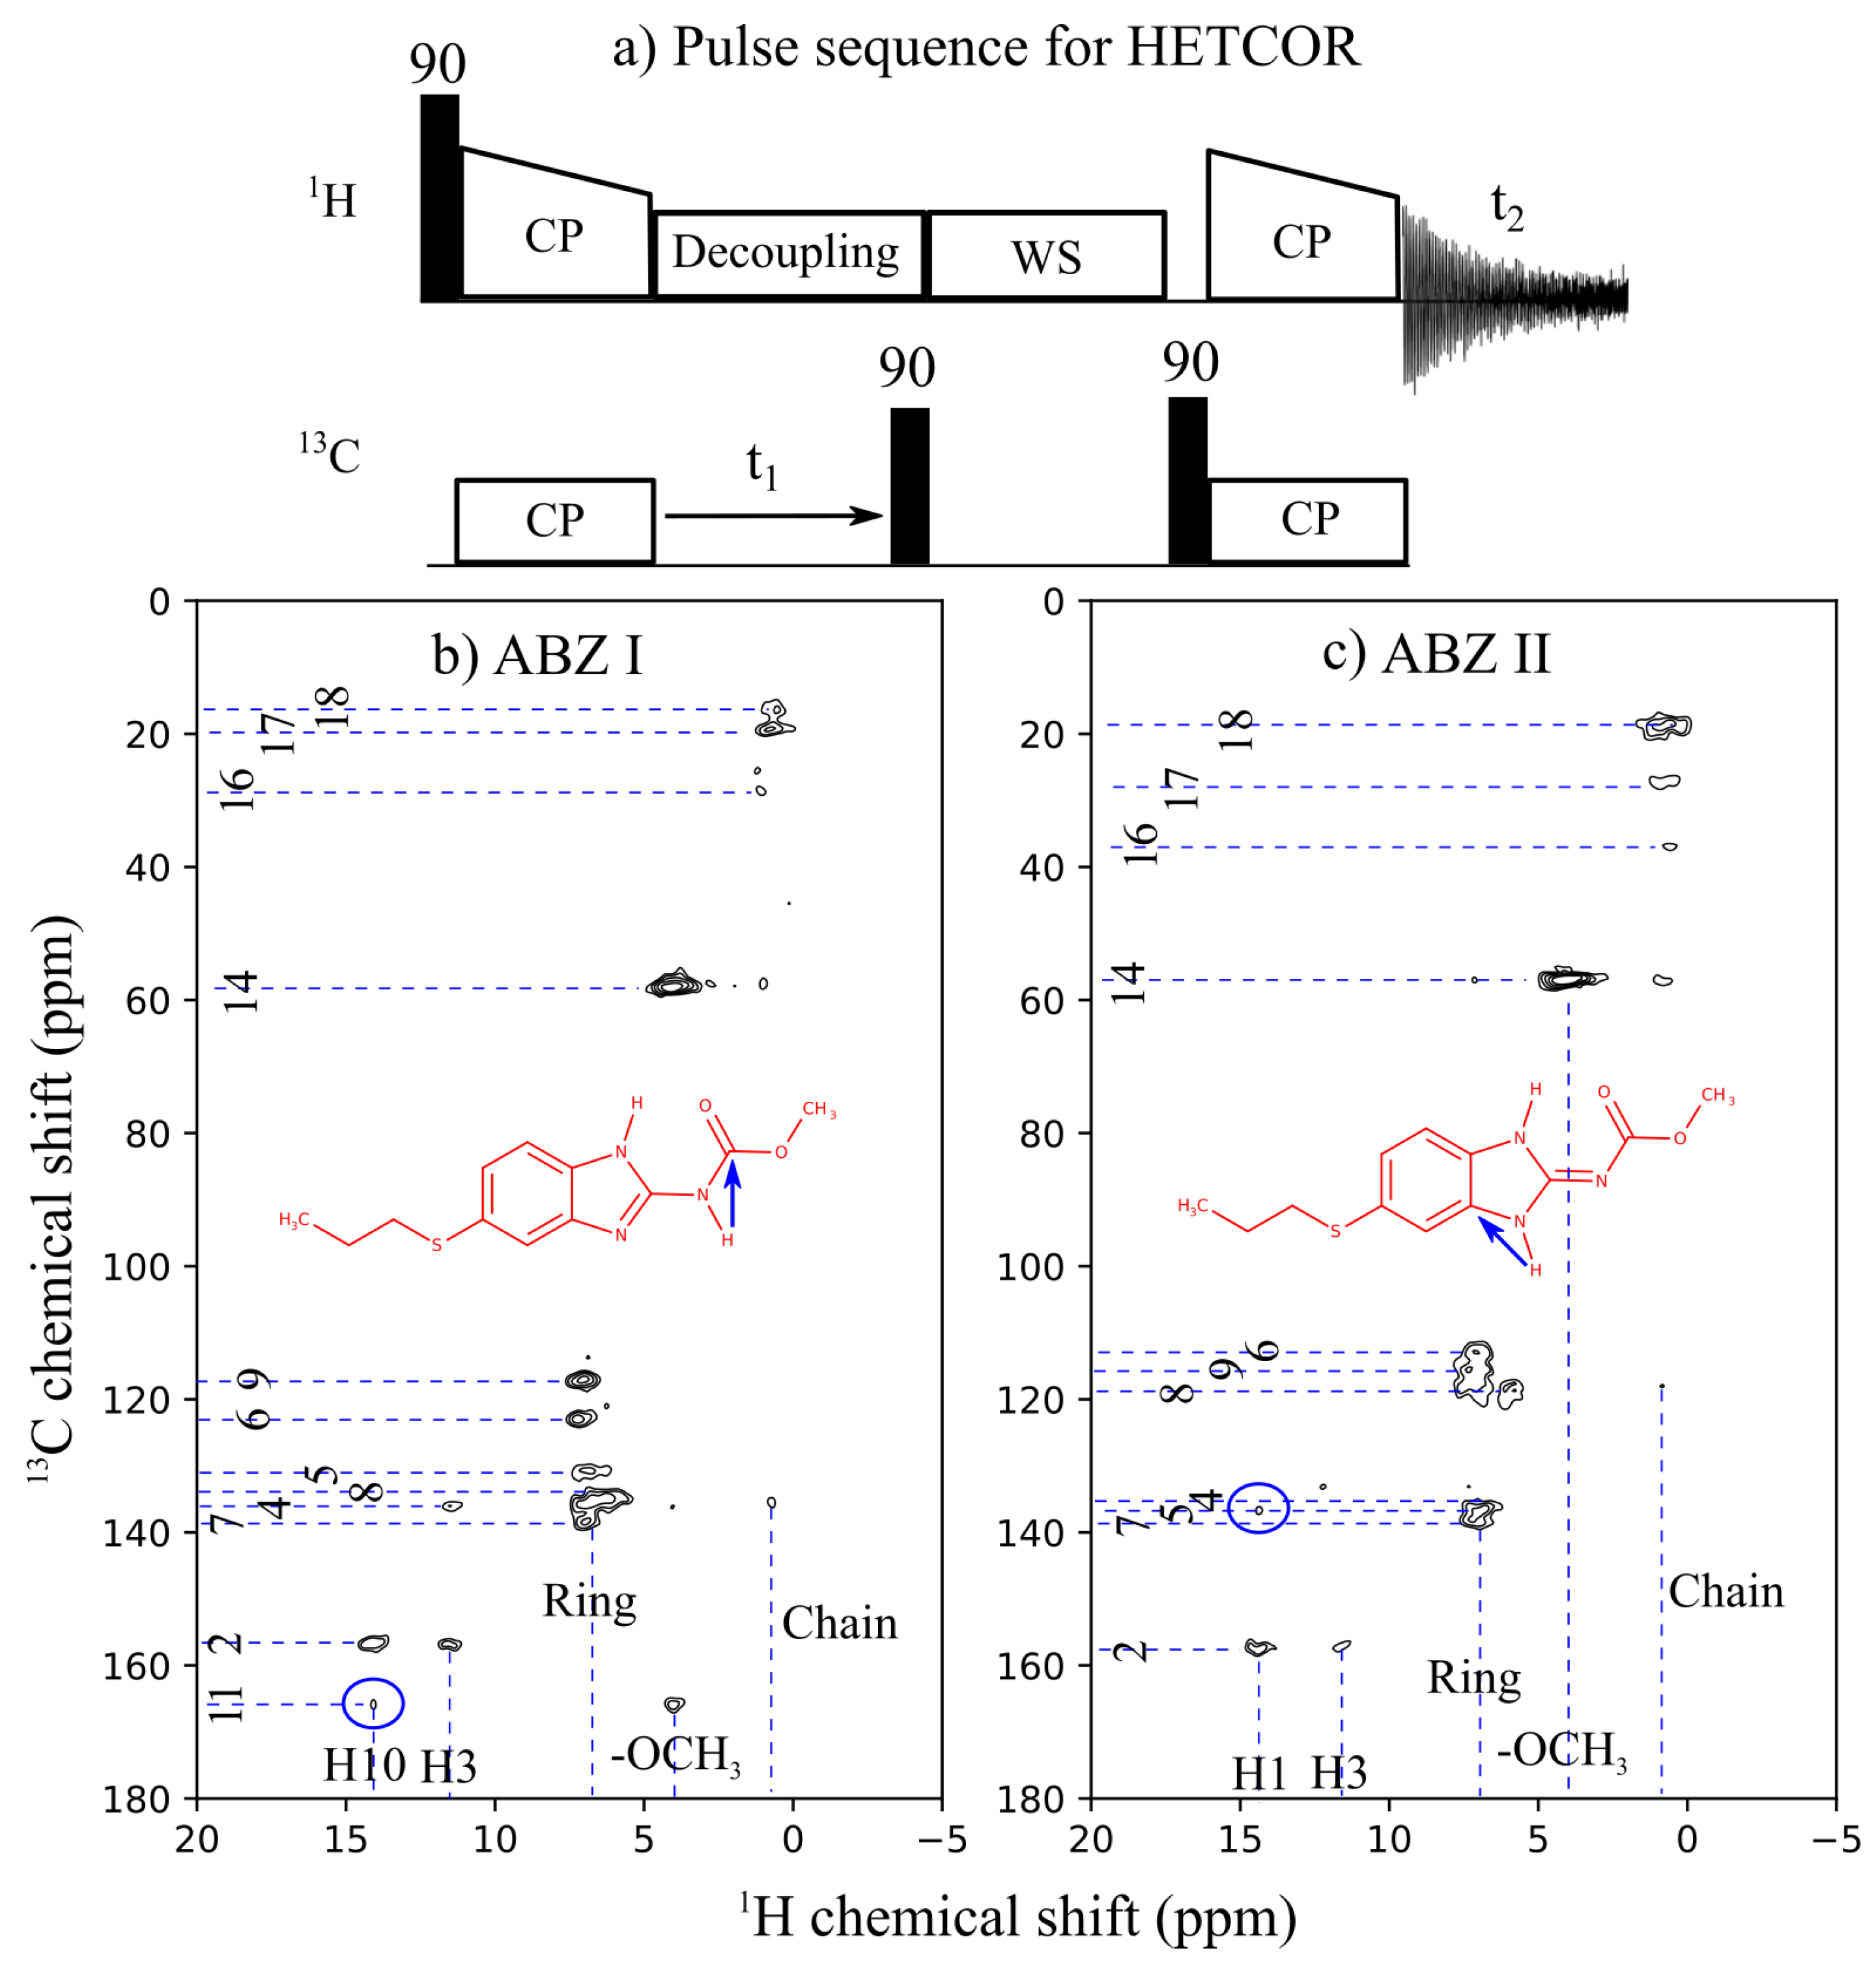
3.2. Chemical-Shift Assignment and Molecular Structure
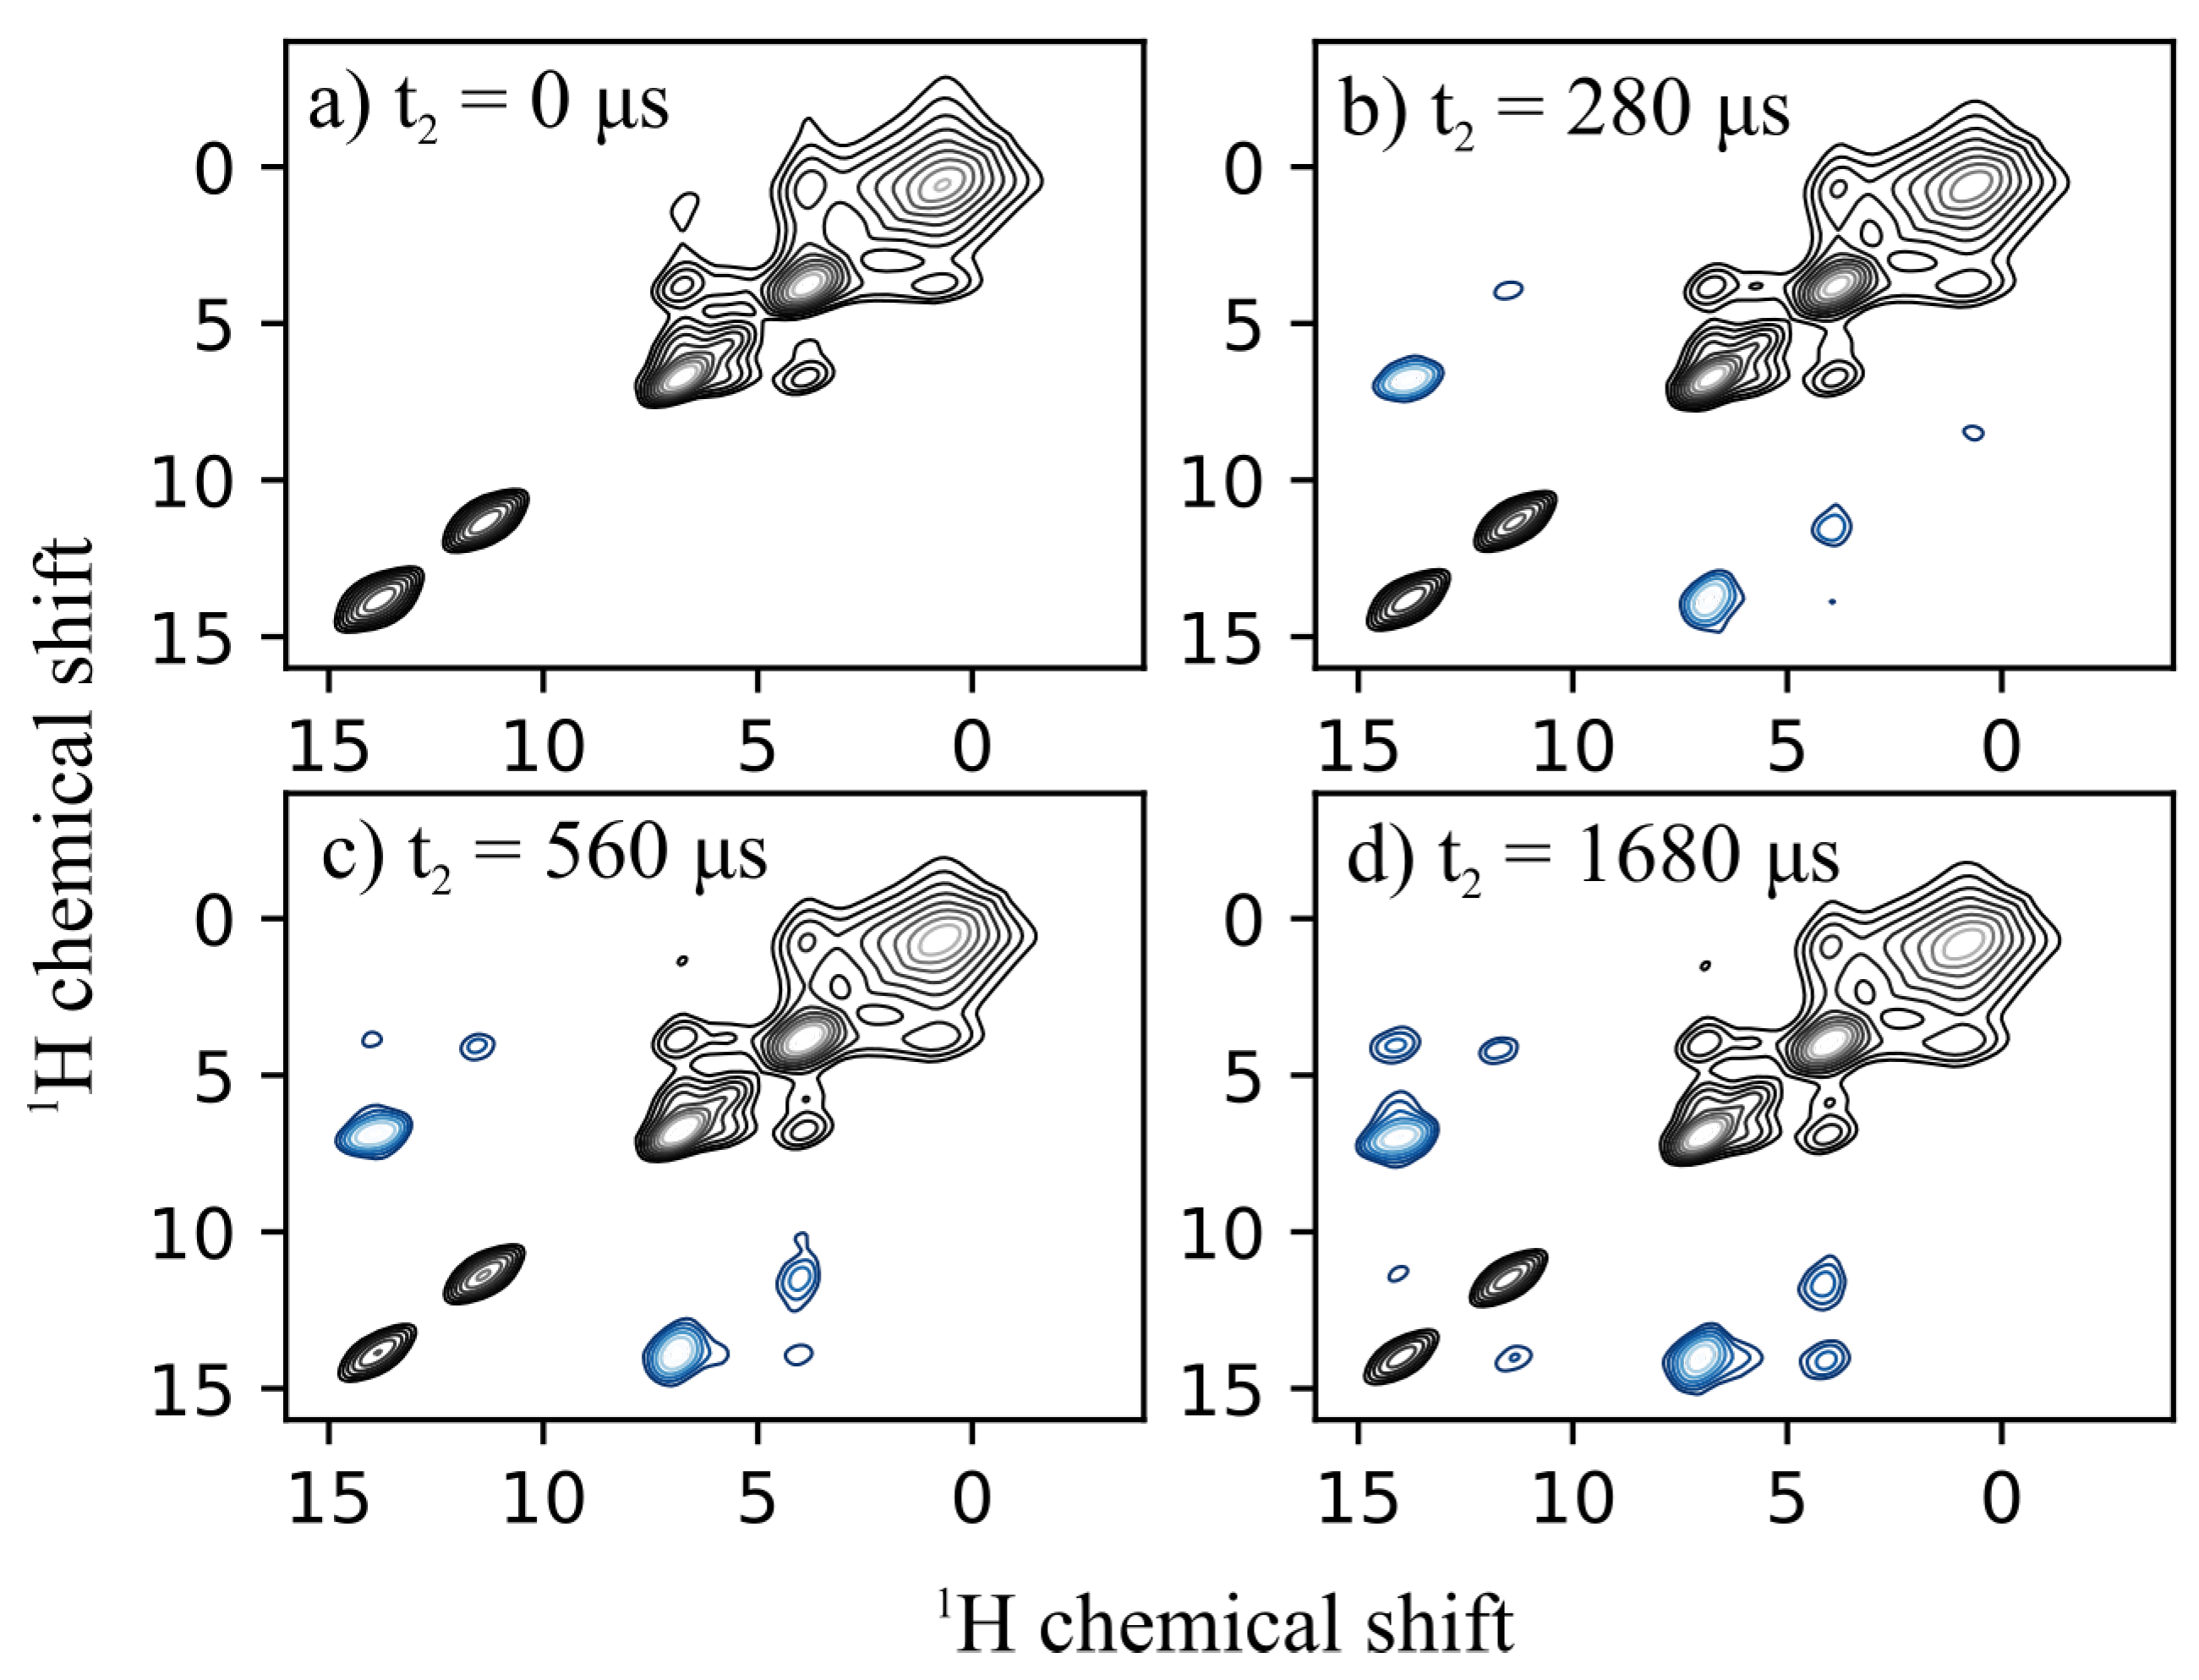
Figure 4 and Figure 5 show the 1 H and 13 C 1D and 2D HETCOR spectra, respectively, at a MAS frequency of 57.143 kHz. The chemical shifts were assigned unambiguously using these experiments and are externally referenced using histidine resonances. 1 H 1D spectra of both the forms of ABZ show five resolved peaks, one corresponding to each of the NH, aromatic protons (H6, H8, and H9), protons of OCH3 (H14) and protons from the aliphatic side chain (H16, H17, and H18). The peak positions and the linewidths of the peaks in both forms have subtle differences. The difference in the 13 C CPMAS spectrum of ABZ I and ABZ II are seen in the aromatic region. The differences are because of the changes in electronegativity arising because of the tautomerism. 13 C - 1 H HETCOR data were used to assign the resonances of the 1 H and 13 C 1D spectra. The reverse CP mixing was short to allow only the short-range transfers. The presence of correlation between the C11 and H10 and between C5 and H1 (encircled in blue) in Figure 5 differentiates between the forms of ABZ. The chemical-shift analysis was sufficient for the complete molecular analysis of the two forms.

3.3. 1 H - 1 H Distance Measurements

Figure 6 is a demonstration of the SERP experiment on the ABZ II sample for different recoupling durations of 0, 280, 560 and 1680 μ s. The negative contours are the recoupled peaks between H1 and aromatic protons. The recoupling can be restricted between selective peaks by placing the transmitter at the centre of the resonances. The intensity of the negative contours as a function of the recoupling duration contains information about the coupling and thereby the distances between the involved protons. Measurement of distances can be performed only if the resonances are isolated. This restricted us to measuring only a few useful distances to differentiate the molecules. These unambiguous distances are for H3–H10, H10–H6, H3–H14 in ABZ I and H1–H3, H3–H14, and H1–H6 protons in ABZ II. Table 1 lists these distances of the ABZ samples measured from the crystal structure of the forms (CCDC Deposition: 736,654 for ABZ I [24] and CCDC Deposition: 668,711 for ABZ II [23]). The positive contours are the consequence of zero-quantum recoupling happening during the P 0 P 180 P 90 P 270 (Figure 2) blocks of the constant-time recoupling duration [21]. They give rise to positive cross peaks between adjacent resonances if they are strongly coupled, as shown in Figure 6. The transmitter does not affect this zero-quantum recoupling as the coupling is stronger than the chemical-shift difference between the protons giving rise to these peaks.
The build-up curves for the recoupling of H6 to H10 and H3 to H14 from ABZ I and H6 to H1 and H3 to H14 from ABZ II are shown in Figure 7. These build-up curves are measured from pseudo-2D experiments (Figure 2) performed by selectively exciting a single resonance from the five isolated resonances of the 1 H spectra (Figure 4). The SERP mixing was applied by placing the transmitter at the centre of resonances after excitation. Distances were measured by fitting the build-up curves (Figure 7) with the SIMPSON simulations and the error in the estimation was determined from the root mean-squared deviation of the fits. The measured distances between the desmotropic proton (H10/H1) and H6 (Figure 7a,c) are 3.02 ± 0.1 Å and 2.75 ± 0.1 Å for ABZ I and ABZ II, respectively. The distance of 3.02 Å measured from ABZ I is much shorter than the intramolecular contact (5.2 Å from crystal structure), suggesting that this contact is intermolecular and is a little shorter than measured for the intermolecular contact from the crystal structure (3.26 Å). The deviation in this distance from 3.26 Å in the crystal structure to 3.02 Å in our measurement of ABZ I could have arisen because the measurements were performed in the sample purchased from the manufacturer without any further modifications. Measurement of the distance from H6 to H10 or H1 was possible because the source of magnetisation in the experiment was the overlapped resonances of H6, H8 and H9 and the distance was measured from the build-up in peak intensity of H10 and H1. Further, with the help of crystal structures, we could confirm that the build-up was because of H6 rather than H8 or H9.
The distance measured between H14 (-OCH3 group) and H3 (Figure 7b,d) corresponds to 2.6 ± 0.1 Å and is exclusively intermolecular contact, as measured from the crystal structure. This contact is shown by the red dotted lines in the scheme (Figure 7e,f). The recoupling efficiency of the H3-H10/H1 pair in the molecules is much smaller. The build-up of this contact can be seen in 2D but measuring the distance from such a build-up is a difficult task with the small recoupling efficiency that was observed. This distance alone could have been enough to differentiate between ABZ I and ABZ II but is irrelevant for predicting the crystal packing since the distance is intramolecular.
An important point to note is that the two intermolecular contacts measured from the ABZ I cannot be satisfied by the same pair of ABZ molecules in a unit cell (Figure 7e). To satisfy these two distance restraints, at least three molecules would be required. This suggests that the unit cell is non-trivial and contains multiple interfaces between the molecules as visualised from the crystal structure (Figure 7e). This is a vital information for solving the crystal structure from the powder samples using NMR crystallography approach. A few such contacts between the multiple interfaces can prove to be pivotal to predict the crystal packing structure along with molecular modelling.

4. Conclusions

Structure determination in solid- and solution-state NMR often relies on semi-quantitative distance restraints that are derived from a variety of experimental techniques. Often, these methods cannot pin down the exact distances between two nuclei and, hence, cannot distinguish between closely related structures such as desmotrophs. Developments in instrumentation and methodology of ssNMR have now enabled quantitative measurement of distances between protons in solid powder samples, and these techniques hold a promise to address some of these challenging questions. We have demonstrated the efficacy of the newly proposed SERP recoupling sequence to quantitatively measuring selective 1 H - 1 H distances in the desmotropic forms of albendazole at fast magic-angle-spinning frequencies. The use of even faster MAS frequencies is expected to improve the applicability of this sequence. ssNMR methodology to measure 1 H distance has a scope for improvement at these spinning frequencies and thereby benefit the field of NMR crystallography.

Author Contributions

Conceptualization, P.K.M.; Data curation, M.G.J.; Formal analysis, M.G.J. and K.R.M.; Methodology, M.G.J. and K.R.M.; Writing—original draft, K.R.M.; Writing—review & editing, P.K.M.

Funding

KRM acknowledges Department of Science and Technology (DST), India, for support under the Inspire Faculty Programme (Grant No. IFA/CH/150) and TCIS, TIFR Hyderabad, for support under the Young Researcher Programme.

Acknowledgments

We thank Krishna Rao for technical assistance, Vipin Agarwal for valuable discussions, Avijit Maiti for recording FT-IR spectra and Pankaj Kalita for X-ray diffraction experiment.

Conflicts of Interest

The authors declare no conflict of interest.

Abbreviations

The following abbreviations are used in this manuscript:
ssNMRSolid-state Nuclear Magnetic Resonance
ABZAlbendazole
SERPSelective Recoupling of Protons
HETCORHeteronuclear Correlation spectroscopy
MASMagic-Angle-Spinning
CPMASCross-Polarisation under Magic-Angle-Spinning
CPCross-Polarisation

References

  1. Holzer, W.; Claramunt, R.M.; López, C.; Alkorta, I.; Elguero, J. A study in desmotropy. Solid State Nucl. Magn. Reson. 2008, 34, 68–149. [Google Scholar] [CrossRef]
  2. Elguero, J. Polymorphism and desmotropy in heterocyclic crystal structures. Cryst. Growth Des. 2011, 11, 4731–4738. [Google Scholar] [CrossRef]
  3. Elder, D.P.; Patterson, J.E.; Holm, R. The solid-state continuum: A perspective on the interrelationships between different solid-state forms in drug substance and drug product: The solid-state continuum. J. Pharm. Pharmacol. 2014, 67, 757–772. [Google Scholar] [CrossRef] [PubMed]
  4. Finta, Z.; Hermecz, I.; Heja, G.; Horvath, A.; Kiss, G.; Morvai, M.; Podanyi, B.; Sipos, J.; Szabo, A.; Vasvari, A.; et al. Sanofi-Aventis, Assignee. U.S. Patent 0249669, 25 October 2007. [Google Scholar]
  5. Bauer, M.; Harris, R.K.; Rao, R.C.; Apperley, D.C.; Rodger, C.A. NMR study of desmotropy in Irbesartan, a tetrazole-containing pharmaceutical compound. J. Chem. Soc. Perkin Trans. 1998, 2, 475–481. [Google Scholar] [CrossRef]
  6. Chattah, A.K.; Zhang, R.; Mroue, K.H.; Pfund, L.Y.; Longhi, M.R.; Ramamoorthy, A.; Garnero, C. Investigating Albendazole Desmotropes by Solid-State NMR Spectroscopy. Mol. Pharm. 2015, 12, 731–741. [Google Scholar] [CrossRef]
  7. Apperley, D.C.; Forster, A.H.; Fournier, R.; Harris, R.K.; Hodgkinson, P.; Lancaster, R.W.; Rades, T. Characterisation of indomethacin and nifedipine using variable-temperature solid-state NMR. Magn. Reson. Chem. 2005, 43, 881–892. [Google Scholar] [CrossRef] [PubMed]
  8. Othman, A.; Evans, J.S.O.; Evans, I.R.; Harris, R.K.; Hodgkinson, P. Structural study of polymorphs and solvates of finasteride. J. Pharm. Sci. 2007, 960, 1380–1397. [Google Scholar] [CrossRef] [PubMed]
  9. Harris, R.K.; Hodgkinson, P.; Zorin, V.; Dumez, J.N.; Elena-Herrmann, B.; Emsley, L.; Salager, E.; Stein, R.S. Computation and NMR crystallography of terbutaline sulfate. Magn. Reson. Chem. 2010, 48, S103–S112. [Google Scholar] [CrossRef] [PubMed]
  10. Mafra, L.; Santos, S.M.; Siegel, R.; Alves, I.; Paz, F.A.A.; Dudenko, D.; Spiess, H.W. Packing interactions in Hydrated and anhydrous forms of the antibiotic ciprofloxacin: A solid-state NMR, X-ray diffraction, and computer simulation study. J. Am. Chem. Soc. 2012, 134, 71–74. [Google Scholar] [CrossRef]
  11. Dudenko, D.V.; Yates, J.R.; Harris, K.D.M.; Brown, S.P. An NMR crystallography DFT-D approach to analyse the role of intermolecular hyderogen bonding and π-π interactions in driving cocrystallisation of indomethacin and nicotinamide. CrystEngComm 2013, 15, 8797–8807. [Google Scholar] [CrossRef]
  12. Santos, S.M.; Rocha, J.; Mafra, L. NMR Crystallography: Toward chemical shift-driven crystal structure determination of the β-lactum antibiotic amoxicillin. Crys. Growth Des. 2013, 13, 2390–2395. [Google Scholar] [CrossRef]
  13. Baias, M.; Dumez, J.N.; Svensson, P.H.; Schantz, S.; Day, G.M.; Emsley, L. De Novo determination of the crystal structure of a large drug molecule by crystal structure prediction-based powder NMR crystallography. J. Am. Chem. Soc. 2013, 135, 17501–17507. [Google Scholar] [CrossRef] [PubMed]
  14. Kalakewich, K.; Luliucci, R.; Harper, J.K. Establishing accurate high-resolution crystal structures in the absence of diffraction data and single crystals—An NMR approach. Cryst. Growth Des. 2013, 13, 5391–5396. [Google Scholar] [CrossRef]
  15. Rossini, A.J.; Widdlfield, C.M.; Zagdoun, A.; Lelli, M.; Schwarzwalder, M.; Coperet, C.; Lesage, A.; Emsley, L. Dynamics nuclear polarisation enhanced NMR spectroscopy for pharmaceutical formulations. J. Am. Chem. Soc. 2014, 136, 2324–2334. [Google Scholar] [CrossRef] [PubMed]
  16. Reddy, G.N.M.; Cook, D.S.; Luga, D.; Walton, R.I.; Marsh, A.; Brown, S.P. An NMR crystallography study of the hemihydrate of 2’,3’-O-isopropylidineguanosine. Solid State Nucl. Magn. Reson. 2015, 65, 41–48. [Google Scholar] [CrossRef]
  17. Mollica, G.; Dekhil, M.; Ziarelli, T.P.; Viel, S. Quantitative structural constraints for organic powders at natural isotopic abundance using dynamic nuclear polarisation solid-state NMR spectroscopy. Angew. Chem. Int. Ed. 2015, 54, 6028–6031. [Google Scholar] [CrossRef]
  18. Kalakewich, K.; Luliucci, R.; Mueller, K.T.; Eloranta, H.; Harper, J.K. Monitoring the refinement of crystal structures with 15N solid-state NMR shift tensor data. J. Chem. Phys. 2015, 143, 194702. [Google Scholar] [CrossRef]
  19. Lill Sten, O.N.; Widdifield, C.M.; Pettersen, A.; Ankarberg, A.S.; Lindkvist, M.; Aldred, P.; Gracin, S.; Shankland, N.; Shankland, K.; Schantz, S.; et al. Elucidating an amorphous form stabilization mechanism for Tenapanor Hydrochloride: Crystal structure analysis using X-ray diffraction, NMR crystallography and molecular modeling. Mol. Pharm. 2018, 15, 1476–1487. [Google Scholar] [CrossRef] [PubMed]
  20. Jain, M.G.; Lalli, D.; Stanek, J.; Gowda, C.; Prakash, S.; Schwarzer, T.S.; Schubeis, T.; Castigilione, K.; Andreas, L.B.; Madhu, P.K.; et al. Selective. 1H -1H distance restraints in fully protonated proteins by fast magic-angle spinning solid-state NMR. J. Phys. Chem. Lett. 2017, 8, 2399–2405. [Google Scholar] [CrossRef]
  21. Duong, N.T.; Raran-Kurussi, S.; Nishiyama, Y.; Agarwal, V. Quantitative 1H -1H distances in protonated solids by frequency-selective recoupling at fast magic angle spinning NMR. J. Phys. Chem. Lett. 2018, 9, 5948–5954. [Google Scholar] [CrossRef] [PubMed]
  22. Malon, M.; Pandey, M.K.; Nishiyama, Y. Revealing the Local Proton Network through Three-Dimensional 13C/1H Double-Quantum/1H Single-Quantum and 1H Double-Quantum/13C/1H Single-Quantum Correlation Fast Magic-Angle Spinning Solid-State NMR Spectroscopy at Natural Abundance. J. Phys. Chem. B 2017, 121, 8123–8131. [Google Scholar] [CrossRef]
  23. Pranzo, M.B.; Cruickshank, D.; Corruzzi, M.; Caira, M.R.; Bettini, R. Enantiotropically related albendazole polymorphs. J. Pharm. Sci. 2010, 99, 3731–3742. [Google Scholar] [CrossRef]
  24. Alhalaweh, A.; Lou, B.; Bostrom, D.; Velaga, S.P. CSD Communication. Available online: https://www.ccdc.cam.ac.uk/Community/csd-communications/ (accessed on 15 December 2018).
  25. Laage, S.; Marchetti, A.; Sein, J.; Pierattelli, R.; Saas, H.J.; Grzesiek, S.; Lesage, A.; Pintacuda, G.; Emsley, L. Band-selective 1H -13C cross-polarisation in fast magic angle spinning solid-state NMR spectroscopy. J. Am. Chem. Soc. 2008, 130, 17216–17217. [Google Scholar] [CrossRef]
  26. Equbal, A.; Madhu, P.K.; Meier, B.H.; Nielsen, N.C.; Ernst, M.; Agarwal, V. Parameter independent low-power heteronuclear decoupling for fast magic-angle spinning solid-state NMR. J. Chem. Phys. 2017, 146, 084202. [Google Scholar] [CrossRef] [Green Version]
  27. Emsley, L.; Bodenhausen, G. Optimization of shaped selective pulses for NMR using a quaternion description of their overall propagators. J. Magn. Reson. 1992, 97, 135–148. [Google Scholar] [CrossRef]
  28. Bak, M.; Rasmussen, J.T.; Nielsen, N.C. SIMPSON: A general simulation program for solid-state NMR spectroscopy. J. Magn. Reson. 2000, 147, 296–330. [Google Scholar] [CrossRef] [PubMed]
  29. Tosner, Z.; Andersen, R.; Stevensson, B.; Eden, M.; Nielsen, N.C.; Vosegaard, T. Computer-intensive simulation of solid-state NMR experiments using SIMPSON. J. Magn. Reson. 2014, 246, 79–93. [Google Scholar] [CrossRef] [PubMed]
  30. Bak, M.; Nielsen, N.C. REPULSION, A novel approach to efficient powder averaging in solid-state NMR. J. Magn. Reson. 1997, 125, 132–139. [Google Scholar] [CrossRef] [PubMed]
  31. Zhou, D.H.; Reinstra, C.M. High-performance solvent suppression for proton-detected solid-state NMR. J. Magn. Reson. 2008, 192, 167–172. [Google Scholar] [CrossRef] [PubMed]
Figure 1. Tautomers of albendazole: (a) Form I; and (b) Form II.
Crystals 09 00231 g001
Figure 2. Pulse sequence for SElective Recoupling of Protons (SERP). For psuedo-2D implementation, a soft frequency selective pulse was applied for excitation. The phases used for the pulses were ϕ 1 = 0 2, ϕ 2 = 0 0 0 0 0 0 0 0 2 2 2 2 2 2 2 2, ϕ 3 = 0 0 2 2 1 1 3 3, and receiver phase ϕ r e c = 0 2 2 0 1 3 3 1 2 0 0 2 3 1 1 3, where 0, 1, 2, and 3 correspond to x, y, x ¯ and y ¯ , respectively. The element P 0 of SERP had 10 pulses of equal length spanning a rotor-period with phases 48, 144, 240, 336, 72, 252, 156, 60, 324, and 224.
Crystals 09 00231 g002
Figure 3. FT-IR spectrum of ABZ I and ABZ II.
Crystals 09 00231 g003
Figure 4. (a) 1 H; and (b) 13 C MAS-ssNMR spectra of ABZ I and ABZ II. The spectra are recorded at a field of 11.7 T with the MAS spinning of 57.143 kHz at a temperature of 320 K.
Crystals 09 00231 g004
Figure 5. (a) Pulse sequence for proton detected HETCOR experiment. HETCOR spectra of: (b) ABZ I; and (c) ABZ II. Forward CP is from 1 H to 13 C and the reverse CP is from 13 C to 1 H, WS stands for water suppression in the pulse sequence and was achieved with MISSISSIPPI [31]. The spectra were recorded at a field of 11.7 T with the MAS spinning of 57.143 kHz at a temperature of 320 K.
Crystals 09 00231 g005
Figure 6. 1 H - 1 H correlation spectra with SERP recoupling using the pulse sequence shown in Figure 2 on ABZ II with t 2 of: (a) 0; (b) 280; (c) 560; and (d) 1680 μ s for a τ m i x of 2.8 ms. The negative contours (blue) are the double-quantum recoupling peaks between H1 and aromatic protons (H6). The base contour levels are plotted at 20 σ and 2 σ from noise levels for the positive and negative peaks, respectively, and are spaced by a factor of 1.414. The spectra were recorded at a field of 11.7 T with the MAS spinning of 57.143 kHz at a temperature of 320 K.
Crystals 09 00231 g006
Figure 7. Polarisation transfer from: (a) H6 to H10 for ABZ I; (b) H3 to H14 for ABZ I; (c) H6 to H1 for ABZ II; and (d) H3 to H14 for ABZ II. Scheme showing the measured distances in: (e) ABZ I; and (f) ABZ II.
Crystals 09 00231 g007
Table 1. Intramolecular and intermolecular 1 H - 1 H distances in ABZ I and ABZ II. The distances corresponding to the blue are measurable unambiguously and those in red can be measured but they are measured out of overlapped resonances. The distances in gray are sufficient to differentiate between the two forms.
ProtonsIntramolecular Distance (Å)Intermolecular Distance (Å)
Albendazole Form I
H3–H103.66.63
H3–H144.75, 4.82, 5.762.59, 2.85, 3.97
H10–H144.12, 4.13, 4.217.16, 7.3, 8.57
H10–H65.193.26
Albendazole Form II
H3–H13.836.8
H3–H144.85, 4.86, 5.842.55, 2.73, 3.88
H1–H146.34, 6.36, 6.615.91, 5.97, 7.06
H1–H62.817.23

