Article

Decomposition Characterizations of Methane Hydrate Confined inside Nanoscale Pores of Silica Gel below 273.15 K

Key Laboratory of Gas Hydrate, Guangzhou Institute of Energy Conversion, Chinese Academy of Sciences, Guangzhou 510640, China
*
Author to whom correspondence should be addressed.
Crystals 2019, 9(4), 200; https://doi.org/10.3390/cryst9040200
Submission received: 7 March 2019 / Revised: 1 April 2019 / Accepted: 8 April 2019 / Published: 10 April 2019
(This article belongs to the Special Issue Ice Crystals)

Abstract

:
The formation and decomposition of gas hydrates in nanoscale sediments can simulate the accumulation and mining process of hydrates. This paper investigates the Raman spectra of water confined inside the nanoscale pores of silica gel, the decomposition characterizations of methane hydrate that formed from the pore water, and the intrinsic relationship between them. The results show that pore water has stronger hydrogen bonds between the pore water molecules at both 293 K and 223 K. The structure of pore water is conducive to the nucleation of gas hydrate. Below 273.15 K, the decomposition of methane hydrate formed from pore water was investigated at atmospheric pressure and at a constant volume vessel. We show that the decomposition of methane hydrate is accompanied by a reformation of the hydrate phase: The lower the decomposition temperature, the more times the reformation behavior occurs. The higher pre-decomposition pressure that the silica gel is under before decomposition is more favorable to reformation. Thus, reformation is the main factor in methane hydrate decomposition in nanoscale pores below 273.15 K and is attributed to the structure of pore water. Our results provide experimental data for exploring the control mechanism of hydrate accumulation and mining.

1. Introduction

Gas hydrates are naturally occurring ice-like crystalline compounds in which the hydrogen-bonded water molecules forming the hydrate lattice interact with the guest molecules with van der Waals forces. The occurrence of gas hydrates is controlled by forming temperature, forming pressure and the availability of appropriate gases and water. Gas hydrates are present in sedimentary deposits in permafrost regions and beneath the sea in outer continental margins. They were first discovered in the permafrost regions of Russia [1] and Canada’s Mackenzie Delta [2] and subsequently in sediments of the Caspian Sea and Black Sea [3]. China has an abundance of gas hydrate resources in the South China Sea, the Pearl River Delta, and the Qinghai permafrost regions [4]. Natural gas hydrate is a kind of clean energy, and energy concentrated in natural gas hydrates may be an energy source for much of the 21st century [5].
Natural sediments bearing gas hydrates including coarse-grained and fine-grained sediments such as sands, silts, and clays have a wide distribution of pore size and particle size. Pore size and particle size affect the formation and dissociation behavior of gas hydrates in such sediments. Much work has been carried out on hydrate formation and dissociation with powerful numerical tools and experimental simulation [6,7,8,9,10,11,12,13,14,15,16]. The formation and decomposition of gas hydrates can also cause the pore structure and flow properties to change [14]. X-ray radiography and 3D computed tomography (CT) have been used to measure xenon hydrate dissociation kinetics in a porous medium (sand) through depressurization at the quasi-isothermal condition. It was found that hydrate surface area controls gas hydrate dissociation kinetics in porous media [15]. The characteristics of methane hydrate formation and dissociation in porous medium with different particle sizes using depressurization have been discussed [16]. Meso-level simulation of gas hydrate dissociation in low-permeability marine sediments was reported [17]. The interactions between gas, water, and hydrates by defining the pores and the fluid flow in the pores using the discrete element model have been described. The microscale effects on methane hydrate dissociation in the micro porous media channels including the microscale effects on the multiphase flow behavior as well as the mass and heat transfer between phases have been discussed [18,19,20,21]. Researchers have long tried to ascertain the equilibrium behavior of gas hydrate formation in porous media with different pore size distributions from the macro scale to the micro scale [22,23,24,25,26,27,28,29,30]. In addition, marine sediments hosting gas hydrates play an important role in controlling the hydrate stability zone (HSZ) thickness on the seafloor [31,32,33,34,35].
The formation and decomposition of gas hydrates in nanoscale argillaceous silt, nanoscale calcium carbonate, and clay can simulate the accumulation and mining process of hydrates. By studying the mass transfer of these processes, we can explore the control mechanism of hydrate accumulation and mining. Experimental results have shown the relationship between nanoscale pores bearing gas hydrates and dissociation behavior [36,37,38]. The dissociation conditions of methane hydrates in confined small pores were measured. Significant downward shifts of the dissociation temperature were observed in porous glass [36]. The melting temperature depression and the shifted phase boundaries were monitored [37]. The methane hydrate heat of dissociation into pore water and gas in 7-nm-radius silica gel pores, obtained calorimetrically, was 45.92 kJ/mol [38]. Studies [36,37,38] have discussed the effect of pore size distributions of fine-grained sediments on the dissociation temperature, phase boundaries of gas hydrates, and the heat of dissociation.
Since the thermodynamics and kinetics of hydrate decomposition in nanoscale pores are very complex, much further investigation is needed. The main purpose of this paper is to investigate the effect of the decomposition temperature and the pre-decomposition pressure on the micro and macro decomposition characterizations of methane hydrate below 273.15 K, which formed from the water confined inside nanoscale pores of the silica gel.
The properties of water inside the nanoscale pores clearly have a significant impact on the formation and dissociation of gas hydrate below 273.15 K. Temperature and the characteristics of the porous media play important roles in the behavior of the water. In fact, in porous media, sometimes some water does not freeze when cooled below 273.15 K [39,40]. The amount of unfrozen water decreases with the lowering of the temperature. The relationship between the reduction in temperature and the amount of unfrozen water was obtained by using the nuclear magnetic resonance (NMR) technique [39]. In addition, liquid water also exists in equilibrium with bulk ice and bulk gas hydrate in hydrophilic porous media [40]. X-ray diffraction measurements were performed to study the freezing and melting behavior of water confined within SBA-15 with a pore radius of 3.9 nm [41]. It was found that the freezing temperature increased continuously with increasing pore filling, and the melting of the frozen pore water took place at 256 K, independent of the level of pore filling. The influence of pore wall hydrophobicity on freezing and melting behavior of the confined water is very small [42].
These results show that nanopores inhibit the formation of ice. However, the influence of the microstructure of nanoporous water on the formation and decomposition of hydrate is still unclear. In addition, the content of unfrozen water has significant impact on physico-chemical and mechanical properties of sediments [43]. Thus, it is necessary to investigate the effect of micro properties of the water confined inside nanoscale pores on the dissociation of methane hydrate. The Raman structure of nanoporous water remains unclear. This paper investigates the Raman spectral structure of water confined inside the nanoscale pores of silica gel, the decomposition characterizations of methane hydrate that formed from the pore water, and their intrinsic relationship.

2. Experimental

2.1. Materials and Experimental Apparatus

Methane hydrate was synthesized from water confined inside silica gel pores. The silica gel used was a synthetic silica gel with a pore diameter range of 15–20 nm, supplied by Qingdao Shuoyuan Co., Ltd., Qingdao, China. The pore size, pore volume, and specific surface area of the silica gel were determined using the ASAP2010 surface and pore size analyzer (Micromeritics, Atlanta, GA, USA). The average pore volume was 1.19 mL/g. The specific surface area was 300–500 m2/g. Methane gas was purchased from Foushan Nanhai Gas Co., Ltd., Foushan, China with a purity of 99.99%. The system diagram of the methane hydrate sample synthesis and decomposition device is shown in Figure 1. The experimental apparatus mainly consisted of a reactor, a thermostatically controlled air bath, a gas injection system, some measurement units, and a data acquisition system. The principal component of the apparatus was a reactor—a pressure vessel immersed in an air bath. The vessel was made of stainless steel (1Cr18Ni9Ti), it had an internal volume of 25 mL and could be operated up to 20 MPa. One resistance thermometer and one pressure transducer were inserted in the vessel (Figure 1) to measure the temperature and pressure profile inside the vessel. A Pt100 thermometer with a range of 223–373 ± 0.1 K was used, and the pressure transducer was model SS2 (Boxborough, MA, USA) with a range of 0–20 MPa ± 0.25%. This hydrate forming system was used to prepare the hydrate samples for microscopic measurements as well as decomposition measurements.
To obtain microstructural features of water confined inside the pores of silica gel, a micro-laser Raman spectrometer (Horiba, LabRam HR, Paris, France) was used to measure the Raman spectra of water confined inside the pores of silica gel. The spectrometer was equipped with a single monochromator of 600 grooves/mm grating and a multichannel air-cooled charge-coupled device (CCD) detector. An Ar+ laser operating at 532 nm with a maximum power of 50 mW was used. Before the sample was measured, the Raman spectrometer was calibrated with single crystal silicon (520 cm−1). A cooling stage (Linkam BCS) was used to provide a temperature control system for samples. The working parameters of the micro-laser Raman spectrometer are shown in Table 1.

2.2. Experimental Procedures

2.2.1. Pore Water Confined Inside the Silica Gel Pores

In the experiment, to obtain pore water confined inside the pores of silica gel, the silica gel was first dried at 377.15 K for 24 h, then cooled to room temperature. In the laboratory room, the relative humidity of the air was about 30%. The amount of distilled water equal to the pore volume of the silica gel was thoroughly mixed with the silica gel sample. Then, the sample was placed in a centrifuge at 3500 rpm for 30 min. The sample was sealed and allowed to stand for 5 days to ensure that the distilled water was absorbed in the pores of the silica gel. Samples of pore water with different moisture contents (33%, 67%, and 100%) were prepared.

2.2.2. Raman Spectra of Pore Water

The micro-laser Raman spectrometer was used to obtain the Raman spectra of pore water confined inside the pores of silica gel. Samples of pore water were placed in the sample stages. They were controlled at 293 K and 223 K by the cooling stage for 8 h, and then the Raman structure scanning began. Samples with different moisture contents (33%, 67%, and 100%) were tested.

2.2.3. Hydrate Formation

A 6 g sample of silica gel with 100% water content was added into the reaction vessel, and a vacuum was applied. The reaction vessel was washed by methane gas several times to ensure that there was no air in the reaction vessel. The air bath was set to a temperature of 273.15 K. After the temperature in the vessel and the temperature of the buffer tank were stabilized, the inside of the reaction vessel was pressurized to 11.9 MPa. The pore water confined inside the pores of silica gel was synthesized methane hydrate with methane gas. After about 3 days, the pressure in the reaction vessel was stabilized at about 9.5 MPa, and the synthesis of methane hydrate was complete.

2.2.4. Micro Decomposition of Hydrate

The decomposition of methane hydrate sample confined inside silica gel pores at different temperatures and under atmospheric pressure was tested by Raman spectrometry. Hydrate samples were removed from the reactor and finely ground in liquid nitrogen; finally, they were stored in liquid nitrogen. During the Raman measurement, hydrate samples were shifted to the sample stages precooled at about 193 K. The Raman structure test of the methane hydrate sample was performed at 193 K before the decomposition of the sample started. During the decomposition, the methane hydrate sample was controlled at 263 K, 253 K, and 245 K by the cooling stage. Scanning Raman spectroscopy for one pass took about 4 min. During the decomposition, the Raman spectrometer scanned the sample Raman spectroscopy, and then the next Raman structure scanning began. When the hydrate characteristic Raman peak disappeared, the Raman spectroscopy scanning experiment was complete.

2.2.5. Macro Decomposition of Hydrate

We conducted experiments of decomposition of methane hydrate at a constant volume vessel after dropping the pre-decomposition pressures (9.11 MPa, 2.41 MPa) to atmospheric pressure before decomposition to investigate the effect of the pre-decomposition pressure of methane hydrate on its decomposition characteristics.
After the methane hydrate sample was synthesized, the pressure of the methane hydrate in the reaction vessel was adjusted by releasing part of the gas, and the pressure was brought to a desired pressure value. Finally, the methane hydrate sample was in a metastable or steady region. After 5 h, the temperature and pre-decomposition pressure in the reaction vessel were stabilized. The gas in the reaction vessel was released so that the instantaneous pressure in the vessel was atmospheric pressure, and the gas valve was immediately closed. Consequently, the methane hydrate sample began to decompose in the reaction vessel.

3. Results and Discussion

3.1. Raman Spectra of Pore Water

In general, the Raman spectra of O–H vibrations in liquid water under ambient condition have been assigned as a bending vibration peak located at ~1640 cm−1 and a stretching vibration peak at 2800–3800 cm−1. The Raman O–H stretching bands can be classified as four or five Gaussian peaks with different donor (D) and acceptor (A) hydrogen bonds. The corresponding structures (local hydrogen bond network structure of water molecules) are DAA (single donor–double acceptor), DDAA (double donor–double acceptor), DA (single donor–single acceptor), DDA (double donor–single acceptor), and free O–H structure [44,45]. Of these, DDAA and DA are sensitive to temperature change [44]; within a certain temperature range, as the temperature decreases, DA is partially converted into DDAA [44].
Raman O–H stretching bands of pore water samples and free water are shown in Figure 2. The Raman shifts corresponding to the stretching vibration peaks of the pore water with a water content of 100% are shown in Table 2. For convenience of comparison, the values from the literature [44,45] are also listed in Table 2. In the Raman spectrum of pore water confined inside silica gel pores with a water content of 100% at 293 K, the DDAA and DA are 3087 cm−1 and 3288 cm−1, shifting towards lower wave numbers compared with the DDAA and DA structures of free water at 293 K. The bending vibration peak of free water at 293 K appears near 1640 cm−1. The O–H bending vibration peak of pore water is located at 1587 cm−1, shifting to a lower wave number compared with free water at 293 K. Accordingly, it can be seen that the attraction between the pore water molecules confined inside the nanoscale pores increases, which weakens the effect of the O–H chemical bond. Strong hydrogen bonds between water molecules change the physico-chemical properties of the water confined inside the pores of silica gel.
At 293 K, DDAA and DA of pore water account for more than 90% of the Raman stretching spectrum. Compared with free water at 293 K, the Gaussian peak of DDAA in the pore water is clearly enhanced, while that of DA in the pore water is weakened; from this relationship, we see that DA is partially converted into DDAA in the pore water. Compared with DA, the formation of DDAA hydrogen bonding results in lower density, lower entropy, and higher enthalpy [44]. Therefore, pore water has a lower density, lower entropy, and higher enthalpy than free water under ambient conditions. With water contents of 33% and 67%, the Raman spectra of pore water exhibit Raman spectral characteristics similar to those with water content of 100%. At 293 K, the Raman spectral characteristics of pore water are independent of the levels of pore filling.
In pore water with water content of 100% at 223 K, DDAA and DA account for more than 90% of the Raman stretching spectrum. The Raman spectra of pore water maintain a structure similar to those of pore water at 293 K, but the Gaussian peaks shift to lower wave numbers. This result indicates that the pore water at 223 K is still liquid water, and the attraction between the pore water molecules is increased. Solid ice is not found. With water contents of 33% and 67%, the Raman spectra of pore water exhibit Raman spectral characteristics similar to those in the pores with water content of 100% at 223 K. It is thus shown that pore water exists in a unique structure independent of the levels of pore filling.
The Raman spectra of pore water are somewhat similar to those of super-cooled water, albeit with Gaussian peaks shifted to lower wave numbers compared with super-cooled water. Consequently, pore water has stronger hydrogen bonds between the pore water molecules and longer O–H chemical bonds than that of the pore water molecules. In the absence of impurities, the homogeneous nucleation of small ice nuclei requires the surmounting of a free-energy barrier. However, stronger hydrogen bonds between the pore water molecules enlarge the energy barrier. In fact, the pore water at 223 K may still be liquid. Therefore, nanopores can be potentially used as an inhibitor of ice formation. Both neutron diffraction and NMR relaxation measurements have shown similar depressed freezing and melting points of water/ice in mesoporous SBA-15 silica with ordered structures of cylindrical mesopores with a pore diameter 8.6 nm [46].
In liquid water, a water molecule interacts with neighbouring water molecules through various local hydrogen bonds. In pore water, DDAA and DA are the predominant hydrogen bonding networks and the hydrogen bonding networks of DDAA of the pore water are enlarged. In the structure I of gas hydrate, each water molecule is tetrahedrally surrounded by four neighbours through hydrogen bonds. This raises the probability that the water molecule will be trapped in a tetrahedral hydrogen bond network structure composed of water molecules. Therefore, the unique structure of pore water is very conducive to the nucleation of gas hydrate. Nanopores can also be potentially used as a promoter of gas hydrate formation.

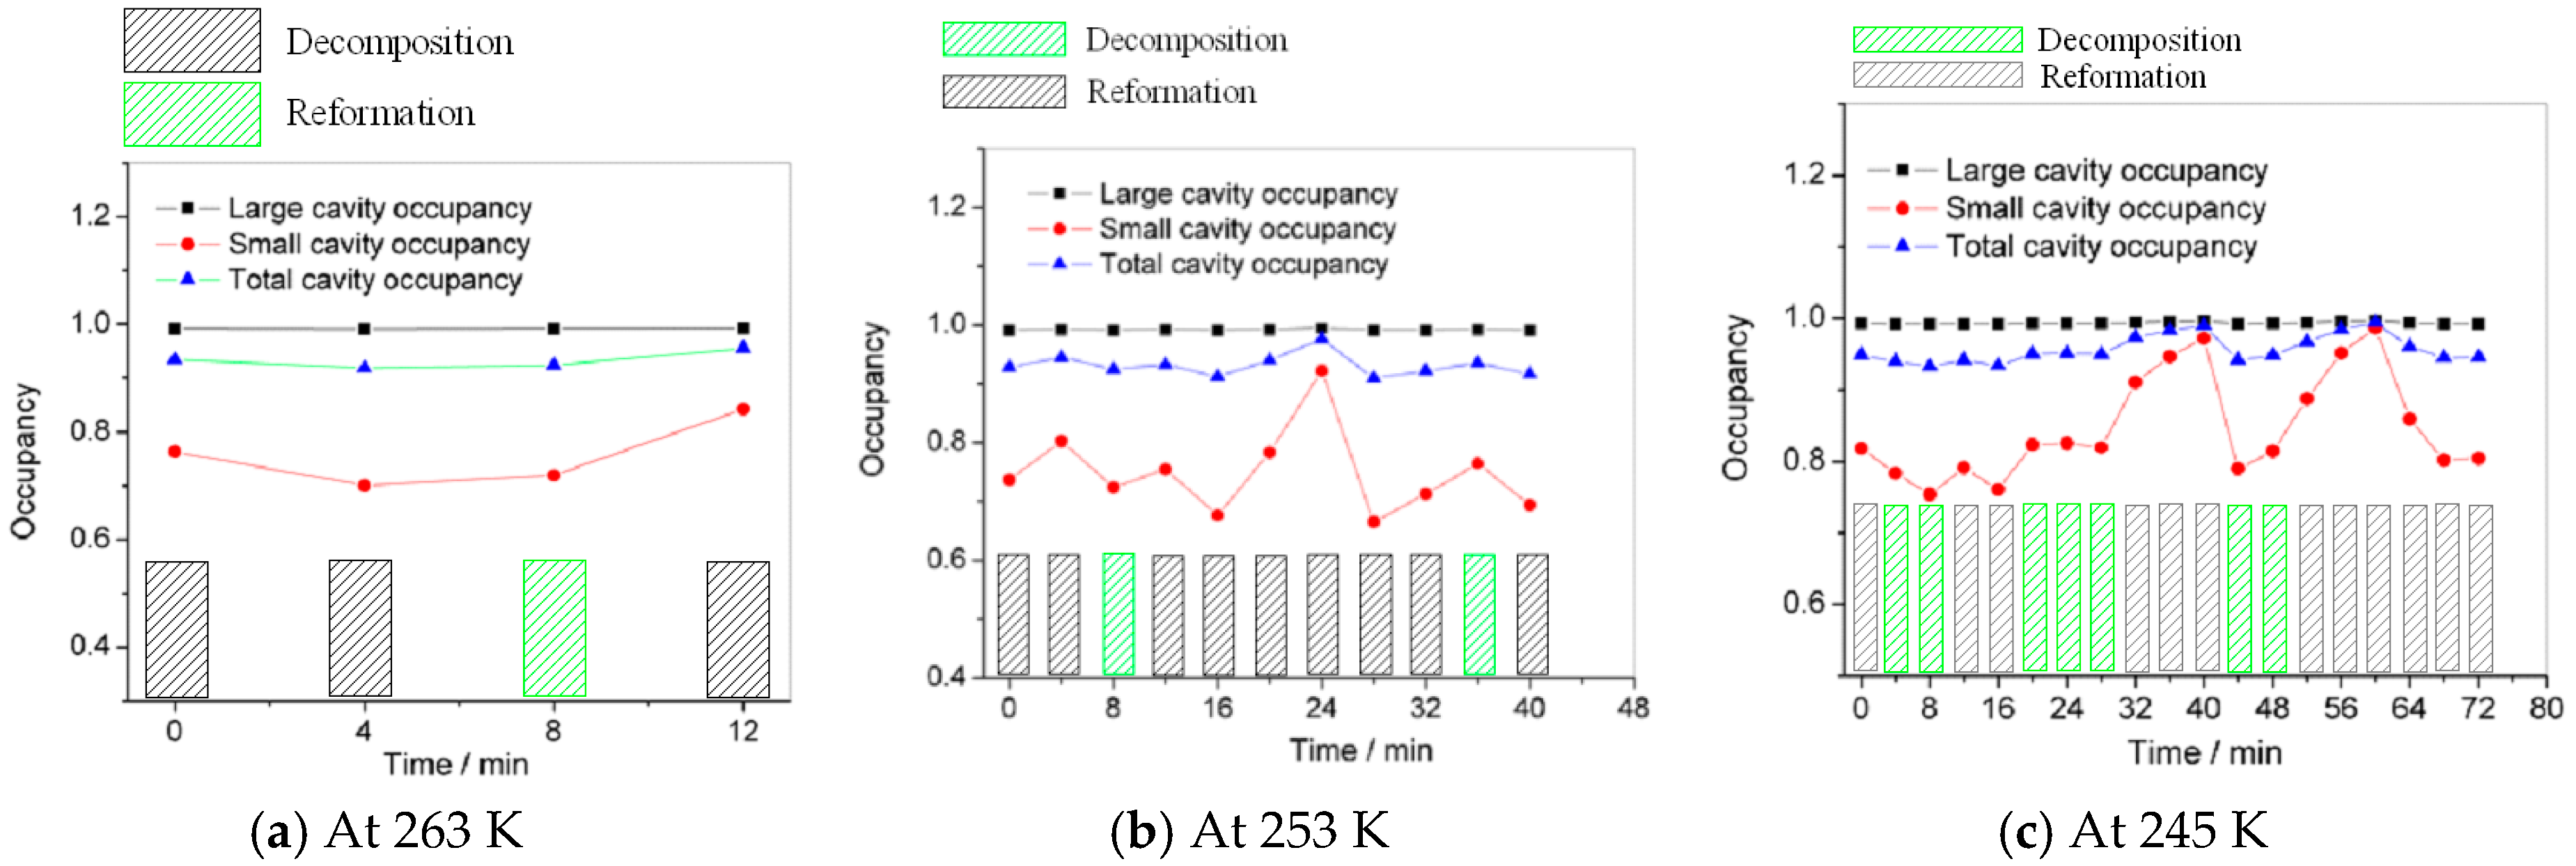
3.2. Micro Decomposition of Hydrate

Figure 3 shows the Raman spectrum of methane hydrate during the decomposition process at 263 K and under atmospheric pressure. We can see the characteristic peak of the C–H Raman vibration spectrum of a methane molecule at 2905 cm−1 and 2915 cm−1, respectively [47,48], which reflects the different vibration of C–H of the methane molecule in cage 51262 and cage 512. It shows that the structure of the CH4 hydrates formed in porous silica gels is the same as that of the bulk CH4 hydrate (structure I) without structure transition. From 13C NMR results in the literature, it can also be concluded that the structure of CH4 hydrates formed in porous silica gels (6.0, 15.0, and 30.0 nm) is the same as that of the bulk CH4 hydrate (structure I) without structure transition [26].
The characteristic Raman peak of the O–H bond of the large-sized methane hydrate appears at about 3076 cm−1 [48]. The characteristic Raman peak of the O–H bond of the methane hydrate formed inside the silica nanoscale pores appears at 3121 cm−1, shifting to a higher wave number in contrast to the large-sized methane hydrate. This reflects the change in the lattice parameters of the methane hydrate formed inside the nanoscale pores. From this, it can be judged that the synthesized sample is a structure I methane hydrate crystal.
After 4 min of decomposition, in contrast to the initial moment (0 min), the Raman intensities of the C–H bond at 2905 cm−1 and 2915 cm−1 decrease and the Raman peak of the O–H bond of the water molecule is synchronously weakened. This indicates that the methane hydrate sample is decomposing. After 8 min, the intensities of the C–H spectrum increase at both 2905 cm−1 and 2915 cm−1, and the Raman peak of the O–H bond of the water molecule increases synchronously, indicating that methane hydrate is reforming. At 8 min, the peak intensity is higher than that at 0 min. At the same time, the peak intensity of the O–H bond is higher than that at 0 min, illustrating that the total amount of methane hydrate is higher than the initial amount. It is inferred that the new methane hydrate phase is derived not only from the reformation reaction of the water originating from the decomposition but also from the reformation of the water residual from the sample synthesis reaction. It is assumed that the residual water is completely converted into hydrate during the reformation, and the conversion rate of pore water in the synthesis of the sample is estimated to be about 53.9%. After 12 min, the peak intensities of the C–H spectrum at 2905 cm−1 and 2915 cm−1 decrease and the Raman peak of the O–H bond of the water molecule decreases synchronously, compared with the results after 8 min. This indicates that the methane hydrate is continuing to decompose. Then, the Raman peaks of the C–H and O–H bonds continue to decrease until they disappear, demonstrating that the methane hydrate decomposes until the methane hydrate crystal disappears. Throughout the process, methane hydrate undergoes decomposition–reformation–continuing decomposition until the crystal disappears without ice peaks without self-preservation [49,50,51].
Figure 4 shows the Raman spectra of methane hydrate during decomposition at 253 K and atmospheric pressure. After 4 min, the Raman peak intensities of the O–H and C–H bonds are simultaneously weakened relative to 0 min, indicating that the methane hydrate sample is decomposing. After 8 min, the Raman peaks of the O–H and C–H bonds increase synchronously, indicating that methane hydrate is reforming, and the peak intensity is higher than the 0 min peak intensity. The newly formed methane hydrate is derived not only from the reformation reaction of the water formed by the decomposition but also from the reformation of the water that is residual from the sample formation. Then, the Raman peaks of the C–H and O–H bonds are weakened synchronously until the Raman peaks disappear after 32 min, indicating the decomposition process of the methane hydrate at this stage. After 36 min, the Raman peaks of the C–H and O–H bonds are enhanced, indicating that the hydrate is reforming. Only a very small amount of methane hydrate forms, possibly due to insufficient pressure in the pores of the silica gel. Thereafter, the methane hydrate decomposes until the methane hydrate crystal disappears. Throughout, methane hydrate undergoes a process of decomposition–reformation–continuing decomposition–reformation–decomposition. Until the Raman peak of the C–H bond disappears, the O–H bond Raman peak remains strong, indicating that even if the methane hydrate crystal disappears, a large amount of hydrate cage structure remains [52,53]. There is no ice peak in the whole process and there is no self-preservation effect.
Figure 5 shows the Raman spectra of the decomposition of methane hydrate at 245 K and under atmospheric pressure. During the whole decomposition process, multiple reformation processes occur. This decomposition takes longer than at 253 K or 263 K under atmospheric pressure. It can be seen that the lower is the temperature, the more favourable it is for reformation. There is no ice peak in the whole process. At the end of the entire decomposition process, a large amount of hydrated cage structure remains.
Temperature has an important influence on the hydrogen bond structure of the local network of water molecules after the decomposition. Figure 6 shows the Raman peak of the O–H bond of water molecules at the end of the decomposition. Methane hydrate decomposes into methane gas and a broken cage structure. The methane gas slowly resolves from the nanoscale pores. The lower is the decomposition temperature, the more intact is the cage structure that remains.
There is insufficient time for methane gas to overflow from the pores of silica gel during the decomposition of methane hydrate (see Section 3.3). Thereby, methane gas generated from decomposition enhances the pressure in the pores of silica gel. The structure of pore water is very conducive to the nucleation of gas hydrate and is not conducive to the nucleation of ice (see Section 3.1). When the pressure exceeds the equilibrium pressure of the phase, the formation reaction begins, resulting in the phenomenon of reformation of the hydrate phase. The lower is the temperature, the lower will be the phase equilibrium pressure, and the more times the reformation phenomenon occurs, the longer the process of decomposition will take. The final product during the decomposition of methane hydrate is a broken hydrated cage structure. The low temperature is favourable for the existence of the hydrated cage structure below 273.15 K. Thus, reformation is the main factor in methane hydrate decomposition in the nanoscale pores of silica gel below 273.15 K at atmospheric pressure, and the controlling factor causing reformation is the temperature.
Figure 7 shows the favourable cavity occupancy curve of methane hydrate during the decomposition process at 263 K, 253 K, and 245 K, and under atmospheric pressure. The calculation method is based on [54,55,56]. Figure 7 indicates that there is a weaker sensitivity on the large cavity occupancy, and a relatively stronger sensitivity on the small cavity occupancy and total cavity occupancy. The results are in reasonable agreement with calculations and experimental data [56,57]. The hydrate total cavity occupancy and small cavity occupancy increase after multiple decompositions and reformation.

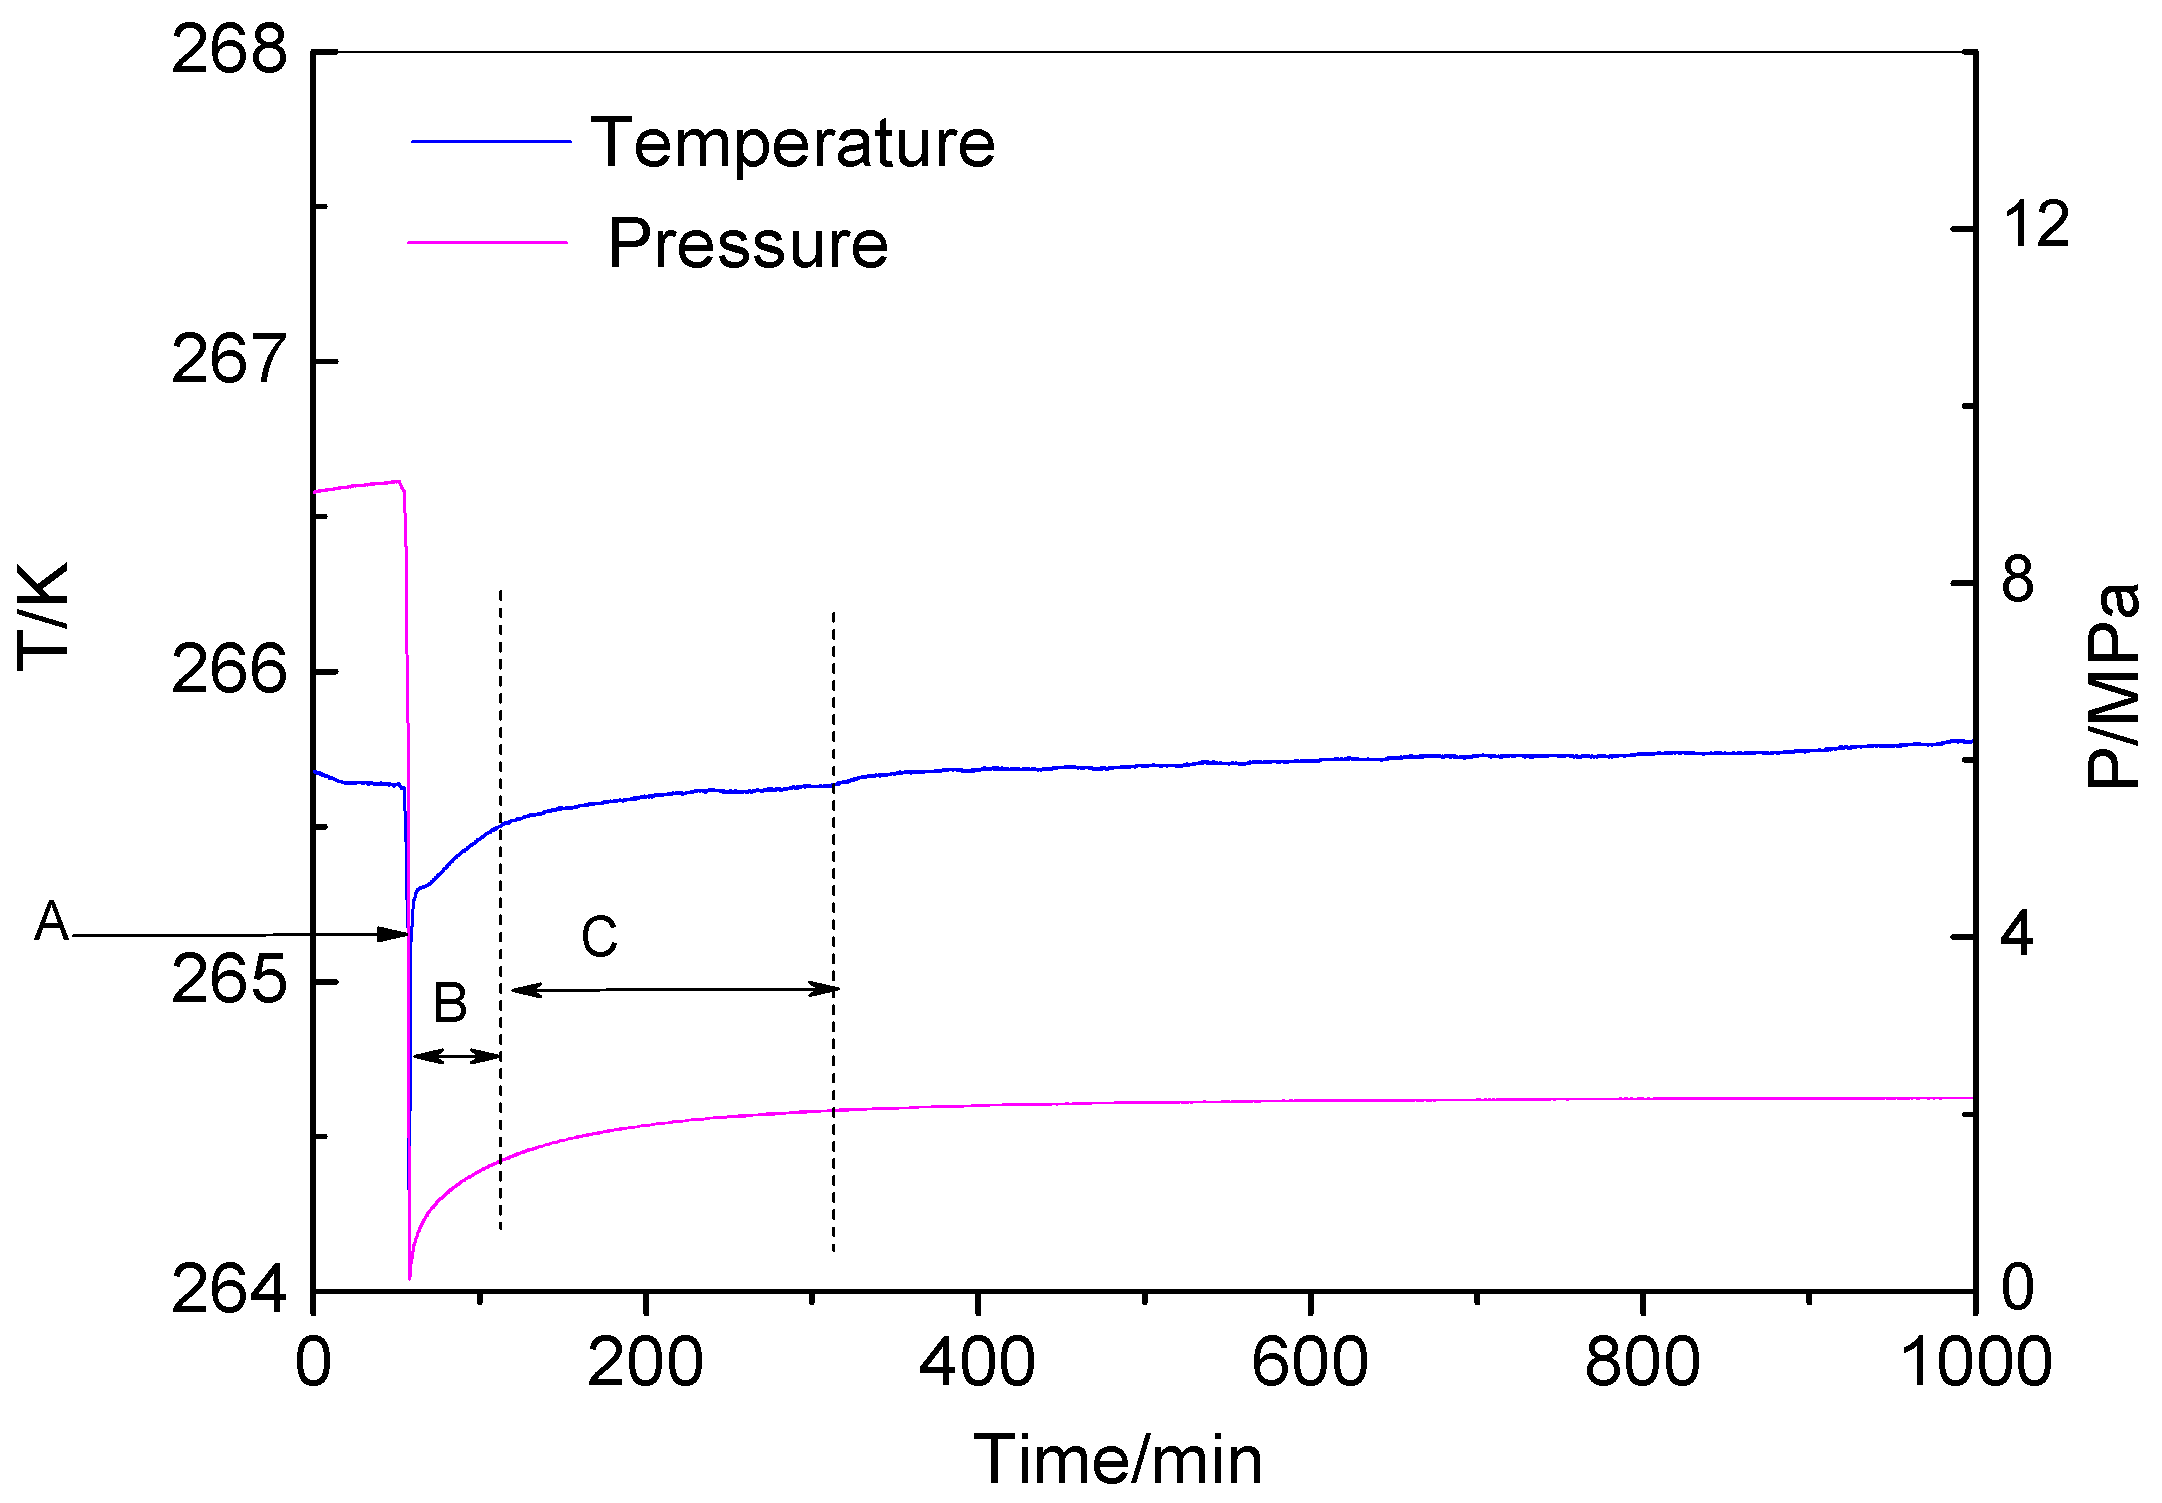
3.3. Macro Decomposition of Hydrate

We investigated the effect of the pre-decomposition pressure on decomposition characteristics of methane hydrate at a constant volume vessel. The decomposition conditions and results are shown in Table 3 and Figure 8 and Figure 9.

3.3.1. Decomposition from High Rre-Decomposition Pressure

After methane hydrate was synthesized, the temperature of the vessel was ~265.64 K and the pre-decomposition pressure in the vessel was ~9.11 MPa. The pre-decomposition pressure in the vessel was instantly reduced to atmospheric pressure. The methane hydrate sample in the pores of silica gel decomposed in the vessel. The decomposition temperature and the pre-decomposition pressure in the vessel during the process are shown in Figure 8. We see that the methane hydrate decomposition process can be roughly divided into the three stages of rapid desorption of gas from the surface of silica gel (stage A), hydrate decomposition (stage B), and internal slow desorption of adsorbed gas from the pores (stage C). When the pressure is released to atmospheric pressure, it is the beginning of stage A. The temperature inside the vessel is greatly reduced due to the throttling effect [58]. The desorption effect of methane gas from the surface of the nanoscale pores causes the pressure inside the vessel to increase rapidly and is accompanied by a rapid rise in temperature caused by the rapid desorption from the surface of the silica gel (stage A). This stage is the process of expansion of free gas. When the temperature curve starts to rise slowly, it is the end of stage A and the beginning of stage B. The decomposition reaction is usually endothermic, as heat is required to break the chemical bonds in the methane hydrate undergoing decomposition. Therefore, at the decomposition stage of methane hydrate, the temperature in the vessel is lower than the initial temperature before decomposition, and the decomposed methane gas is released from the pores of silica gel so that the pressure in the vessel increases. When the temperature curve shows an inflection point, it is the end of stage B and the beginning of stage C. It takes ~56 min from start to finish of hydrate decomposition (stage B). Because the water in the pores of silica gel cannot form ice (see Section 3.1), in stage B, methane hydrate in the decomposition process has no self-preservation phenomenon. After the decomposition of methane hydrate is complete, methane gas in the pores of silica gel is released. When the pressure almost no longer increases and the pressure curve shows an inflection point, it is the end of stage C. This desorption process of methane gas from the pores of silica gel takes ~149 min. Free methane gas is produced more rapidly in stage A. Adsorbed methane gas is produced considerably more slowly but lasts for a longer period in the final stage. Similar results have been reported for desorption of gas from shale [59].
It can be seen that the desorption process of methane gas (stage C) takes a longer time relative to the decomposition stage (stage B). Figure 8 indicates that there is high pressure in the pores of silica gel over a relatively long period of time. After the desorption (stage C) is complete, the pressure in the vessel is ~2.0 MPa and the pressure in the pores of silica gel is ~2.0 MPa. From Figure 8, we can assume that in the initial stage of desorption (early stage C), the gas pressure in the pores of silica gel exceeds 2.6 MPa; at the initial stage of decomposition (early stage B), the pressure in the pores of silica gel exceeds 3.6 MPa. Therefore, in the initial stage B, the pressure and temperature in the vessel are conducive to the formation of methane hydrate; thus, the decomposition of methane hydrate is accompanied by the reformation of methane hydrate in this initial stage. After reformation, the pressure in the pores decreases, and the methane hydrate in the pores begins to decompose again. The methane gas formed by the decomposition is slowly released so that the methane hydrate in the pores decomposes again after a period of time. The methane gas formed by the decomposition is slowly released. After a period of decomposition, the pressure in the pores rises again, satisfying the condition of formation, and the methane hydrate reforms. Stage B takes ~56 min, and it can be seen that the decomposition of methane hydrate is accompanied by multiple reformations in this stage.

3.3.2. Decomposition from Low Pre-Decomposition Pressure

After the temperature and the pressure were stabilized, part of the gas was released and the pressure in the vessel was lowered to ~2.75 MPa. The temperature of the air bath was adjusted so that the temperature in the vessel was ~265.76 K. After 5 h, the pre-decomposition pressure in the vessel was ~2.41 MPa. All the gas in the vessel was instantly released, and the pre-decomposition pressure in the vessel was instantly reduced to atmospheric pressure. The methane hydrate in the pores of silica gel decomposed in the vessel.
The decomposition temperature and pressure in the decomposition process are shown in Figure 9. Similarly, the methane hydrate decomposition process can be roughly divided into the three stages of rapid desorption of gas from the surface of the silica gel (stage A), hydrate decomposition (stage B), and internal slow desorption of gas from the pores of silica gel (stage C).
Since the initial pre-decomposition pressure in the vessel is only 2.41 MPa, the desorption effect from the surface is not strong compared with the desorption effect of stage A in which the methane hydrate drops pressure from 9.11 MPa to atmospheric pressure. Hydrate decomposition takes ~5 min from the beginning to the end of the process (stage B). Thus, in stage B, methane hydrate decomposes very rapidly. After the decomposition of methane hydrate, the desorption process of methane gas from the pores of silica gel (stage C) takes ~210 min, which is quite a long time compared with stage B. After desorption (stage C) is complete, the pressure in the vessel is ~1.0 MPa, and it can be inferred from Figure 8 that the pressure in the pores of silica gel is ~1.0 MPa. It is preliminarily estimated that in the initial stage C, the gas pressure in the pores of silica gel exceeds 1.24 MPa, and the pressure in the pores of silica gel in the initial stage B exceeds 1.32 MPa. Therefore, in the initial stage B, there is no condition for hydrate reformation. Since the water in the pores of silica gel cannot form ice (see Section 3.1), there is no self-preservation effect at stage B. Residual water maintains a unique structure.
Therefore, the main factors of methane hydrate decomposition in the nanoscale pores of silica gel below 273.15 K at a constant volume vessel are reformation, and the controlling factor causing reformation is the pre-decomposition pressure of the silica gel before depressurization.

3.4. Mechanism of Hydrate Decomposition

The nano-silica gel particle constituting the silica gel skeleton has a silicon oxytetrahedral structure, and the Si atoms on the surface form a silanol group with the structural water contained in the colloid. In this study, the adsorption of silica gel pores on water molecules was used to obtain pore water confined inside silica gel pores. After the hydrate is formed in the pores of the silica gel, a residual water film remains on the surface of the hydrate (Figure 10). Jung et al. [60] reported similar observations for the methane hydrate reformation in capillary tubes. Hydrate formation in capillary tubes reveals complex formation/dissociation processes.
We can also use the van der Waals–Platteeuw model [54] to explain the methane hydrate reformation phenomenon during the decomposition. According to this model, the dissociation condition of methane hydrates confined in pores shifts because of changes in the water activity, compared with that of the bulk hydrate at a given pressure [28,36,61]. The decrease in dissociation temperature is inversely proportional to the pore size. The hydrate decomposition process is equivalent to the process of increasing the effective pore size (Figure 10), due to the partial methane hydrate crystal transferring into water. Conversely, the hydrate formation process is equivalent to the process of reducing the effective pore size, due to the partial pore water transferring into methane hydrate crystal. Therefore, during the decomposition, the dissociation condition of methane hydrates confined inside the pores of silica gel shifts down (Figure 11). When the temperature and pressure are in the hydrate phase equilibrium stable region, hydrate reforms. At this time, the effective pore size starts to reduce. Then, the dissociation condition of methane hydrates confined inside the pores shifts up. When the temperature and pressure are under the hydrate phase equilibrium stable region, the hydrate dissociates. Throughout the process, methane hydrate undergoes decomposition–reformation–continuing decomposition until the crystal disappears.

4. Conclusions

This paper investigated the structural characteristics of water confined inside the pores of silica gel with pore diameter range of 15–20 nm and the decomposition characteristics of methane hydrate formed from water confined inside silica pores under atmospheric pressure and at a constant volume vessel.
The micro-laser Raman spectrometer was used to test the Raman spectra of water confined inside the pores of silica gel at 293 K and 223 K. At a temperature of 293 K, the water confined inside the pores of the silica gel is liquid, and its Raman structure is very similar to that of super-cooled water, compared with which the bending vibration peak and the stretching vibration peak in the water molecules in the pores of silica gel shift towards lower wave numbers. The results show that pore water has stronger hydrogen bonds between the pore water molecules. At 223 K, water in the pores of silica gel is still liquid, and no solid ice forms. The structure of pore water is conducive to the nucleation of gas hydrate and is not conducive to the nucleation of ice. Nanopores can be potentially used as a promoter of gas hydrate formation.
The decomposition of methane hydrate confined inside the pores of silica gel and at atmospheric pressure was tested by Raman spectrometry at 263 K, 253 K, and 245 K. The results show that the decomposition of methane hydrate is accompanied by multiple reformations of the hydrate phase. Throughout the process, methane hydrate undergoes decomposition–reformation–continuing decomposition until the crystal disappears without ice peaks. The lower is the decomposition temperature, the lower is the phase equilibrium pressure, and the more times reformation occurs. The final product is in the form of a broken hydrated cage structure. The lower decomposition temperature is favourable to the existence of the hydrated cage structure.
The effect of the pre-decomposition pressure before the decomposition of methane hydrate on its decomposition characteristics was investigated. The results show that the methane hydrate decomposition process can be roughly divided into the three stages of rapid desorption of gas from the surface (stage A), hydrate decomposition (stage B), and internal slow desorption of gas from the pores (stage C). When the silica gel before decomposition is under high pre-decomposition pressure, the decomposed methane gas remains in the pores for a relatively long time, causing the pressure in the pores to be higher than the phase equilibrium pressure, and a reformation process occurs. The decomposition of methane hydrate is accompanied by multiple reformations. When the pre-decomposition pressure in the silica gel before decomposition is lower, almost no reformation phenomenon is observed.
Thus, the main factor of methane hydrate decomposition in the pores of nanoscale silica gel below 273.15 K is reformation, and the controlling factors causing reformation are the decomposition temperature and the pre-decomposition pressure of the silica gel before depressurization. These experimental characteristics of the decomposition dynamics of methane hydrate confined inside nanoscale pores are attributed to the structure of pore water, which is conducive to the nucleation of gas hydrate and slow desorption of methane gas from the pores of the silica gel. The results of this paper provide experimental data for exploring the control mechanism of hydrate accumulation and mining.

Author Contributions

Data curation, P.C.; Investigation, X.Z. (Xuebing Zhou), X.Z. (Xiaoya Zang), J.G.; Project administration, L.W., D.L.; Writing—original draft, L.W.

Funding

The authors are grateful for financial support from the National Natural Science Foundation of China (NSFC) (51576197, 51106163, 51706230, 51676197), the National Key Research and Development Plan of China (No. 2016YFC0304002), and the Joint Funds of the NSFC from the Government of Guangdong Province (U0933004).

Conflicts of Interest

The authors declare no competing financial interest.

References

  1. Makogon, Y.F.; Trebin, F.A.; Trofimuk, A.A.; Tsarev, V.P.; Cherskiy, N.V. Detection of a Pool of Natural Gas in a Solid (Hydrated Gas) State. Doklady Akademii Nauk SSSR 1971, 196, 203–206. [Google Scholar]
  2. Bily, C.; Dick, J.W.L. Naturally Occurring Gas hydrates in the Mackenzie Delta, NWT. Bull. Can. Pet. Geol. 1974, 22, 320–352. [Google Scholar]
  3. Yefremova, A.G.; Zhizchenko, B.P. Occurrence of Crystal Hydrates of Gases in the Sediments of Modern Marine Basins. Doklady Akademii Nauk SSSR 1974, 214, 1179–1181. [Google Scholar]
  4. Wu, N.Y.; Zhang, H.Q.; Yang, S.X.; Liang, J.Q.; Wang, H.B. Preliminary Discussion on Natural Gas Hydrate (NGH) Reservoir System of Shenhu Area, North Slope of South China Sea. Nat. Gas Ind. 2007, 27, 1. [Google Scholar]
  5. Makogon, Y.F.; Holditch, S.A.; Makogon, T.Y. Natural-gas Hydrates—A Potential Energy Source for the 21st Century. J. Pet. Sci. Eng. 2007, 56, 14–31. [Google Scholar] [CrossRef]
  6. Sultan, N.; Cochonat, P.; Foucher, P.J. Effect of Gas Hydrates Melting on Seafloor Slope Instability. Mar. Geol. 2004, 213, 379–401. [Google Scholar] [CrossRef]
  7. Park, T.; Kyung, D.; Lee, W. Effect of Organic Matter on CO2 Hydrate Phase Equilibrium in Phyllosilicate Suspensions. Environ. Sci. Technol. 2014, 48, 6597–6603. [Google Scholar] [CrossRef] [PubMed]
  8. Xu, W.Y.; Germanovich, L.N. Excess Pore Pressure Resulting from Methane Hydrate Dissociation in Marine Sediments: A Theoretical Approach. J. Geophys. Res. Solid Earth 2006, 111, 1978–2012. [Google Scholar] [CrossRef]
  9. Kwon, T.H.; Cho, G.C.; Santamarina, J.C. Gas Hydrate Dissociation in Sediments: Pressure-temperature Evolution. Geochem. Geophys. Geosyst. 2008, 9, Q03019. [Google Scholar] [CrossRef]
  10. Jain, K.; Juanes, R. Preferential Mode of Gas Invasion in Sediments: Grain-scale Mechanistic Model of Coupled Multiphase Fluid Flow and Sediment Mechanics. J. Geophys. Res. 2009, 114, B08101. [Google Scholar] [CrossRef]
  11. Holtzman, R.; Juanes, R. Thermodynamic and Hydrodynamic Constraints on Overpressure Caused by Hydrate Dissociation: A Pore-Scale Model. Geophys. Res. Lett. 2011, 38, L14308. [Google Scholar] [CrossRef]
  12. Jang, J.; Santamarina, J.C. Recoverable Gas from Hydrate-bearing Sediments: Pore Network Model Simulation and Macroscale Analyses. J. Geophys. Res. Solid Earth 2011, 116, 1978–2012. [Google Scholar] [CrossRef]
  13. Tsimpanogiannis, I.N.; Ioannis, N.; Lichtner, P.C. Gas Saturation Resulting from Methane Hydrate Dissociation in a Porous Medium: Comparison between Analytical and Pore-network Results. J. Phys. Chem. C 2013, 117, 11104–11116. [Google Scholar] [CrossRef]
  14. Wang, D.G.; Wang, C.C.; Li, C.F.; Liu, C.L.; Lu, H.L.; Wu, N.Y.; Hu, G.W.; Liu, L.L.; Meng, Q.G. Effect of Gas Hydrate Formation and Decomposition on Flow Properties of Fine-grained Quartz Sand Sediments Using X-ray CT Based Pore Network Model Simulation. Fuel 2018, 226, 516–526. [Google Scholar] [CrossRef]
  15. Chen, X.Y.; Espinoza, N.D. Surface Area Controls Gas Hydrate Dissociation Kinetics in Porous Media. Fuel 2018, 234, 358–363. [Google Scholar] [CrossRef]
  16. Zhan, L.; Wang, Y.; Li, X.S. Experimental Study on Characteristics of Methane Hydrate Formation and Dissociation in Porous Medium with Different Particle Sizes Using Depressurization. Fuel 2018, 230, 37–44. [Google Scholar] [CrossRef]
  17. Zhang, J.H.; Zhao, C.; Xiong, Z.S. Meso-level Simulation of Gas Hydrate Dissociation in Low-permeability Sediments. Theor. Appl. Mech. Lett. 2014, 4, 062002. [Google Scholar] [CrossRef]
  18. Wang, X.; Dong, B.; Li, W.Z.; Yu, M.H.; Song, Y.C. Microscale Effects on Methane Hydrate Dissociation at Low Temperature in the Micro Porous Media Channels by Depressurization. Int. J. Heat. Mass. Trans. 2018, 122, 1182–1197. [Google Scholar] [CrossRef]
  19. Wang, P.F.; Yang, M.J.; Chen, B.B.; Zhao, Y.C.; Zhao, J.F.; Song, Y.C. Methane Hydrate Reformation in Porous Media with Methane Migration. Chem. Eng. Sci. 2017, 168, 344–351. [Google Scholar] [CrossRef]
  20. Uchida, T.; Takeya, S.; Chuvilin, E.M.; Ohmura, R.; Nagao, J.; Yakushev, V.S.; Istomin, V.A.; Minagawa, H.; Ebinuma, T.; Narita, H. Decomposition of Methane Hydrates in Sand, Sandstone, Clays, and Glass beads. J. Geophys. Res. Solid Earth 2004, 109, B05206. [Google Scholar] [CrossRef]
  21. Uchida, T.; Ebinuma, T.; Takeya, S.; Nagao, J.; Narita, H. Effects of Pore Sizes on Dissociation Temperatures and Pressures of Methane, Carbon Dioxide, and Propane Hydrates in Porous Media. J. Phys. Chem. B 2002, 106, 820–826. [Google Scholar] [CrossRef]
  22. Clarke, M.A.; Pooladi-Darvish, M.; Bishnoi, P.R. A Method to Predict Equilibrium Conditions of Gas Hydrate Formation in Porous Media. Ind. Eng. Chem. Res. 1999, 38, 2485–2490. [Google Scholar] [CrossRef]
  23. Seshadri, K.; Wilder, J.W.; Smith, D.H. Measurements of Equilibrium Pressures and Temperatures for Propane Hydrate in Silica Gels with Different Pore-size Distributions. J. Phys. Chem. B 2001, 105, 2627–2631. [Google Scholar] [CrossRef]
  24. Wilder, J.W.; Seshadri, K.; Smith, D.H. Resolving Apparent Contradictions in Equilibrium Measurements for Clathrate Hydrates in Porous Media. J. Phys. Chem. B 2001, 105, 9970–9972. [Google Scholar] [CrossRef]
  25. Klauda, J.B.; Sandler, S.I. Modeling Gas Hydrate Phase Equilibria in Laboratory and Natural Porous Media. Ind. Eng. Chem. Res. 2001, 40, 4197–4208. [Google Scholar] [CrossRef]
  26. Seo, Y.; Lee, H.; Uchida, T. Methane and Carbon Dioxide Hydrate Phase Behavior in Small Porous Silica Gels:  Three-Phase Equilibrium Determination and Thermodynamic Modeling. Langmuir 2002, 18, 9164–9170. [Google Scholar] [CrossRef]
  27. Seo, Y.; Lee, H. Hydrate Phase Equilibria of the Ternary CH4 + NaCl + Water, CO2 + NaCl + Water and CH4 + CO2 + Water Mixtures in Silica Gel Pores. J. Phys. Chem. B 2003, 107, 889–894. [Google Scholar] [CrossRef]
  28. Anderson, R.; Llamedo, M.; Tohidi, B.; Burgass, R.W. Experimental Measurement of Methane and Carbon Dioxide Clathrate Hydrate Equilibria in Mesoporous Silica. J. Phys. Chem. B 2003, 107, 3507–3514. [Google Scholar] [CrossRef]
  29. Seo, Y.; Lee, S.; Cha, I.; Lee, J.D.; Lee, H. Phase Equilibria and Thermodynamic Modeling of Ethane and Propane Hydrates in Porous Silica Gels. J. Phys. Chem. B 2009, 113, 5487–5492. [Google Scholar] [CrossRef]
  30. Lee, S.; Seo, Y. Experimental Measurement and Thermodynamic Modeling of the Mixed CH4 + C3H8 Clathrate Hydrate Equilibria in Silica Gel Pores: Effects of Pore Size and Salinity. Langmuir 2010, 26, 9742–9748. [Google Scholar] [CrossRef]
  31. Liu, X.; Flemings, P.B. Capillary Effects on Hydrate Stability in Marine Sediments. J. Geophys. Res. 2011, 116, B07102. [Google Scholar] [CrossRef]
  32. Anderson, R.; Tohidi, B.; Webber, J.B.W. Gas Hydrate Growth and Dissociation in Narrow Pore Networks: Capillary Inhibition and Hysteresis Phenomena. Geol. Soc. Spec. Publ. 2009, 319, 145–159. [Google Scholar] [CrossRef]
  33. Bangs, N.L.B.; Musgrave, R.J.; Tréhu, A.M. Upward Shifts in the Southern Hydrate Ridge Gas Hydrate Stability Zone Following Postglacial Warming, Offshore Oregon. J. Geophys. Res. 2005, 110, B03102. [Google Scholar] [CrossRef]
  34. Liu, X.; Flemings, P.B. Passing Gas through the Hydrate Stability Zone at Southern Hydrate Ridge, Offshore Oregon. Earth Planet. Sci. Lett. 2006, 241, 211–226. [Google Scholar] [CrossRef]
  35. Daigle, H.; Dugan, B. Pore Size Controls on the Base of the Methane Hydrate Stability Zone in the Kumano Basin, Offshore Japan. Geophys. Res. Lett. 2014, 41, 8021–8028. [Google Scholar] [CrossRef]
  36. Uchida, T.; Ebinuma, T.; Ishizaki, T. Dissociation Condition Measurements of Methane Hydrate in Confined Small Pores of Porous Glass. J. Phys. Chem. B 1999, 103, 3659–3662. [Google Scholar] [CrossRef]
  37. Park, T.; Lee, J.Y.; Kwon, T.-H. Effect of Pore Size Distribution on Dissociation Temperature Depression and Phase Boundary Shift of Gas Hydrate in Various Fine-Grained Sediments. Energy Fuels 2018, 32, 5321–5330. [Google Scholar] [CrossRef]
  38. Handa, Y.P.; Stupin, D. Thermodynamic Properties and Dissociation Characteristics of Methane and Propane Hydrates in 70-Å-Radius Silica Gel Pores. J. Phys. Chem. 1992, 96, 8599–8603. [Google Scholar] [CrossRef]
  39. Watanabe, K.; Mizoguchi, M. Amount of Unfrozen Water in Frozen Porous Media Saturated with Solution. Cold Reg. Sci. Technol. 2002, 34, 103–110. [Google Scholar] [CrossRef]
  40. Istomin, V.; Chuvilin, E.; Bukhanov, B.; Uchida, T. Pore Water Content in Equilibrium with Ice or Gas Hydrate in Sediments. Cold Reg. Sci. Technol. 2017, 137, 60–67. [Google Scholar] [CrossRef]
  41. Morishige, K.; Iwasaki, H. X-ray Study of Freezing and Melting of Water Confined within SBA-15. Langmuir 2003, 19, 2808–2811. [Google Scholar] [CrossRef]
  42. Morishige, K. Influence of Pore Wall Hydrophobicity on Freezing and Melting of Confined Water. J. Phys. Chem. C 2018, 122, 5013–5019. [Google Scholar] [CrossRef]
  43. Handa, Y.P.; Zakrzewski, M.; Fairbridge, C. Effect of Restricted Geometries on the Structure and Thermodynamic Properties of Ice. J. Phys. Chem. 1992, 96, 8594–8599. [Google Scholar] [CrossRef]
  44. Sun, Q. Local Statistical Interpretation for Water Structure. Chem. Phys. Lett. 2013, 568–569, 90–94. [Google Scholar] [CrossRef]
  45. Baschenko, S.M.; Marchenko, L.S. On Raman Spectra of Water, Its Structure and Dependence on Temperature. Semicond. Phys. Quan. Elec. Optoelec. 2011, 14, 77–79. [Google Scholar] [CrossRef]
  46. Webber, J.B.W.; Dore, J.C.; Strange, J.H.; Anderson, R.; Tohidi, B. Plastic Ice in Confined Geometry: The Evidence from Neutron Diffraction and NMR Relaxation. J. Phys. Condens. Matter 2007, 19, 415117. [Google Scholar] [CrossRef]
  47. Sum, A.K.; Burruss, R.C.; Sloan, E.D. Measurement of Clathrate Hydrates via Raman Spectroscopy. J. Phys. Chem. B 1997, 101, 7371–7377. [Google Scholar] [CrossRef]
  48. Liu, C.L.; Meng, Q.G.; He, X.L.; Li, C.F.; Ye, Y.G.; Zhang, G.X.; Liang, J.Q. Characterization of Natural Gas Hydrate Recovered from Pearl River Mouth Basin in South China Sea. Mar. Petrol. Geol. 2015, 61, 14–21. [Google Scholar] [CrossRef]
  49. Kuhs, W.F.; Genov, G.; Staykova, D.K.; Hansen, T. Ice Perfection and Onset of Anomalous Preservation of Gas Hydrates. Phys. Chem. Chem. Phys. 2004, 6, 4917–4920. [Google Scholar] [CrossRef]
  50. Takeya, S.; Shimada, W.; Kamata, Y.; Ebinuma, T.; Uchida, T.; Nagao, J.; Narita, H. In Situ X-ray Diffraction Measurements of the Self-preservation Effect of CH4 Hydrate. J. Phys. Chem. A 2001, 105, 9756–9759. [Google Scholar] [CrossRef]
  51. Stern, L.A.; Circone, S.; Kirby, S.H.; Durham, W.B. Temperature, Pressure, and Compositional Effects on Anomalous or “Self” Preservation of Gas Hydrates. Can. J. Phys. 2003, 81, 271–283. [Google Scholar] [CrossRef]
  52. English, N.J.; Phelan, G.M. Molecular Dynamics Study of Thermal-driven Methane Hydrate Dissociation. J. Chem. Phys. 2009, 131, 074704. [Google Scholar] [CrossRef] [PubMed]
  53. Das, S.; Baghel, V.S.; Roy, S.; Kumar, R. Molecular Dynamics Study of Model SI Clathrate Hydrates: Effect of Guest Size and Guest–Water Interaction on Decomposition Kinetics. Phys. Chem. Chem. Phys. 2015, 17, 9509–9518. [Google Scholar] [CrossRef] [PubMed]
  54. Van der Waals, J.H.; Platteeuw, J.C. Clathrate Solutions. Adv. Chem. Phys. 1959, 2, 1–57. [Google Scholar]
  55. Susilo, R.; Ripmeester, J.A.; Englezos, P. Characterization of Gas Hydrates with PXRD, DSC, NMR, and Raman Spectroscopy. Chem. Eng. Sci. 2007, 62, 3930–3939. [Google Scholar] [CrossRef]
  56. Subramanian, S.; Sloan, E.D. Trends in Vibrational Frequencies of Guests Trapped in Clathrate Hydrate Cages. J. Phys. Chem. B 2002, 106, 4348–4355. [Google Scholar] [CrossRef]
  57. Tsimpanogiannis, I.N.; Diamantonis, N.I.; Economou, I.G.; Papadimitriou, N.I.; Stubos, A.K. Influence of Combining Rules on the Cavity Occupancy of Clathrate Hydrates Using van der Waals–Platteeuw-Theory-Based Modelling. Chem. Eng. Res. Des. 2014, 92, 2992–3007. [Google Scholar] [CrossRef]
  58. Goussard, J.O.; Roulet, B. Free Expansion for Real Gases. Am. J. Phys. 1993, 61, 845–848. [Google Scholar] [CrossRef]
  59. Wang, J.J.; Dong, M.Z.; Yang, Z.H.; Gong, H.J.; Li, Y.J. Investigation of Methane Desorption and its Effect on the Gas Production Process from Shale: Experimental and Mathematical Study. Energy Fuels 2017, 31, 205–216. [Google Scholar] [CrossRef]
  60. Jung, J.W.; Santamarina, J.C. Hydrate Formation and Growth in Pores. J. Cryst. Growth 2012, 345, 61–68. [Google Scholar] [CrossRef]
  61. Aladko, E.Y.; Dyadin, Y.A.; Fenelonov, V.B.; Larionov, E.G.; Mel’gunov, M.S.; Manakov, A.Y.; Nesterov, A.N.; Zhurko, F.V. Dissociation Conditions of Methane Hydrate in Mesoporous Silica Gels in Wide Ranges of Pressure and Water Content. J. Phys. Chem. B 2004, 108, 16540–16547. [Google Scholar] [CrossRef]
Figure 1. Experimental apparatus. 1, vacuum pressure gauge; 2, vacuum pump; 3, air bath; 4, buffer tank; 5, pressure sensor; 6, platinum resistance temperature sensor; 7, stainless steel reactor; 8, pipeline; 9, pressure gauge; 10, data acquisition instrument; 11, computer.
Crystals 09 00200 g001
Figure 2. Raman spectra of pore water.
Crystals 09 00200 g002
Figure 3. Methane hydrate decomposition at 263 K and atmospheric pressure.
Crystals 09 00200 g003
Figure 4. Methane hydrate decomposition at 253 K and atmospheric pressure.
Crystals 09 00200 g004
Figure 5. Methane hydrate decomposition at 245 K and atmospheric pressure.
Crystals 09 00200 g005
Figure 6. Raman peak of the O–H bond of water molecules after the end of decomposition.
Crystals 09 00200 g006
Figure 7. Methane hydrate occupancy curve.
Crystals 09 00200 g007
Figure 8. Decomposition from high pre-decomposition pressure.
Crystals 09 00200 g008
Figure 9. Decomposition from low pre-decomposition pressure.
Crystals 09 00200 g009
Figure 10. Schematic representation of the methane hydrate formation/dissociation process in nano-silica gel pores.
Crystals 09 00200 g010
Figure 11. Schematic diagram of methane hydrate dissociation boundary shift in the decomposition process (SMin, SMax, and SEffective are the min, max, and effective pore size, respectively).
Crystals 09 00200 g011
Table 1. Working parameters of the laser Raman spectrometer.
Working ParametersSetting Conditions
Laser source532 nm
Laser power80 mW
Objective lens magnification×1–100
Grating scale600 Grooves/mm
Raman shift range500–4000 cm−1
Integration time1–10 s
Table 2. Raman shift of DDAA (double donor–double acceptor) and DA (single donor–single acceptor) in pore water with 100% pore filling.
Temperature (K)DDAADAReference
29332203430Water [44]
27632233434Water [45]
29332313441Water [45]
29832273430Water [This work]
29330873288Pore water [This work]
22330633267Pore water [This work]
Table 3. Description of decompositions.
ItemsDecomposition Temperature
K
Pre-Decomposition Pressure
MPa
Stage B Time Consumption
min
Stage C Time Consumption
min
Total Time Consumption
min
Run 1265.649.1156149205
Run 2265.762.415210215

