Synthesis, Characterization, and Crystal Structure of N-(3-nitrophenyl)cinnamamide


Abstract
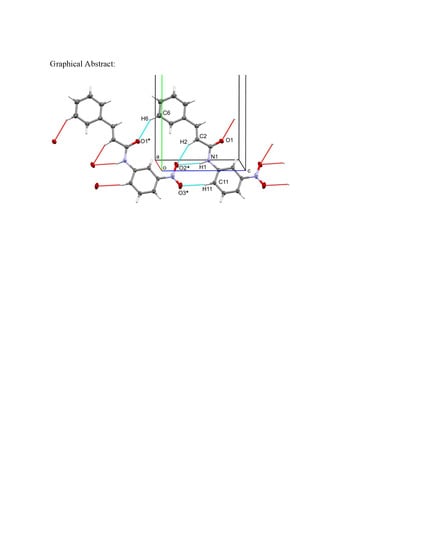
:
1. Introduction
2. Materials and Methods
2.1. Synthesis and Characterization
2.2. X-Ray Diffraction
2.3. Computational Studies
3. Results and Discussion
3.1. Synthesis and Characterization
3.2. X-Ray Diffraction
3.3. Computational Studies
4. Conclusions
Supplementary Materials
Author Contributions
Funding
Conflicts of Interest
References
- Hawkey, P.M.; Warren, R.E.; Livermore, D.M.; McNulty, C.A.M.; Enoch, D.A.; Otter, J.A.; Wilson, A.P.R. Treatment of infections caused by multidrug-resistant Gram-negative bacteria: Report of the British Society for Antimicrobial Chemotherapy/Healthcare Infection Society/British Infection Association Joint Working Party. J. Antimicrob. Chemother. 2018, 73, iii2–iii78. [Google Scholar] [PubMed]
- Cornaglia, G. Fighting infections due to multidrug-resistant Gram-positive pathogens. Clin. Microbiol. Infect. 2009, 15, 209–211. [Google Scholar] [CrossRef] [PubMed]
- Lafay, S.; Gil-Izquierdo, A. Bioavailability of phenolic acids. Phytochem. Rev. 2008, 7, 301–311. [Google Scholar] [CrossRef]
- De, P.; Baltas, M.; Bedos-Belval, F. Cinnamic acid derivatives as anticancer agents-a review. Curr. Med. Chem. 2011, 18, 1672–1703. [Google Scholar] [CrossRef] [PubMed]
- Sova, M. Antioxidant and antimicrobial activities of cinnamic acid derivatives. Mini. Rev. Med. Chem. 2012, 2, 749–767. [Google Scholar] [CrossRef]
- Vishnoi, S.; Agrawal, V.; Kasana, V.K. Synthesis and structure-activity relationships of substituted cinnamic acids and amide analogues: A new class of herbicides. J. Agric. Food. Chem. 2009, 57, 3261–3265. [Google Scholar] [CrossRef]
- Olender, D.; Żwawiak, J.; Zaprutko, L. Multidirectional Efficacy of Biologically Active Nitro Compounds Included in Medicines. Pharmaceuticals 2018, 11, 54. [Google Scholar] [CrossRef]
- Ju, K.S.; Parales, R.E. Nitroaromatic compounds; from synthesis to biodegradation. Microbiol. Mol. Biol. Rev. 2010, 74, 250–272. [Google Scholar] [CrossRef]
- El-Hossary, E.M.; Förstner, K.U.; François, P.; Baud, D.; Streker, K.; Schrenzel, J.; Ohlsen, K.; Holzgrabe, U. A Novel Mechanism of Inactivating Antibacterial Nitro Compounds in the Human Pathogen Staphylococcus aureus by Overexpression of a NADH-Dependent Flavin Nitroreductase. Antimicrob. Agents Chemother. 2018, 62, e01510–e01517. [Google Scholar] [CrossRef]
- Nimse, S.B.; Pal, D.; Mazumder, A.; Mazumder, R. Synthesis of Cinnamanilide Derivatives and Their Antioxidant and Antimicrobial Activity. J. Chem. 2015, 2015, 1–5. [Google Scholar] [CrossRef]
- Krause, L.; Herbst-Irmer, R.; Sheldrick, G.M.; Stalke, D. Comparison of silver and molybdenum microfocus X-ray sources for single-crystal structure determination. J. Appl. Cryst. 2015, 48, 3–10. [Google Scholar] [CrossRef] [PubMed]
- SHELXTL Suite of Programs, version 6.14; Bruker Advanced X-ray Solutions, Bruker AXS Inc.: Madison, WI, USA, 2003.
- Sheldrick, G.M. A short history of SHELX. Acta Cryst. A 2008, 64, 112–122. [Google Scholar] [CrossRef] [PubMed]
- Sheldrick, G.M. Crystal structure refinement with SHELXL. Acta Cryst. 2015, C71, 3–8. [Google Scholar]
- Hübschle, C.B.; Sheldrick, G.M.; Dittrich, B. ShelXle: A Qt graphical user interface for SHELXL. J. Appl. Crystallogr. 2011, 44, 1281–1284. [Google Scholar] [CrossRef] [PubMed]
- Dolomanov, O.V.; Bourhis, L.J.; Gildea, R.J.; Howard, J.A.K.; Puschmann, H. OLEX2: A complete structure solution; refinement and analysis program. J. Appl. Crystallogr. 2009, 42, 339–341. [Google Scholar] [CrossRef]
- Macrae, C.F.; Edgington, P.R.; McCabe, P.; Pidcock, E.; Shields, G.P.; Taylor, R.; Towler, M.; van de Streek, J. Mercury: Visualization and analysis of crystal structures. J. Appl. Crystallogr. 2006, 39, 453–457. [Google Scholar] [CrossRef]
- Macrae, C.F.; Bruno, I.J.; Chisholm, J.A.; Edgington, P.R.; McCabe, P.; Pidcock, E.; Rodriguez-Monge, L.; Taylor, R.; van de Streek, J.; Wood, P.A. Mercury CSD 2.0—New features for the visualization and investigation of crystal structures. J. Appl. Crystallogr. 2008, 41, 466–470. [Google Scholar] [CrossRef]
- Spek, A.L. Single-crystal structure validation with the program PLATON. J. Appl. Cryst. 2003, 36, 7–13. [Google Scholar] [CrossRef]
- The PyMOL Molecular Graphics System, version 1.3r; Schrödinger LLC: New York, NY, USA, 2010.
- Cason, C.; Frolich, T.; Lipka, C. POV-Ray—The Persistence of Vision Raytracer. 3.7.0 edn, 2013.
- Weigend, F.; Ahlrichs, R. Balanced basis sets of split valence; triple zeta valence and quadruple zeta valence quality for H to Rn: Design and assessment of accuracy. Phys. Chem. Chem. Phys. 2005, 7, 3297–3305. [Google Scholar] [CrossRef]
- Schuchardt, K.L.; Didier, B.T.; Elsethagen, T.; Sun, L.; Gurumoorthi, V.; Chase, J.; Li, J.; Windus, T.L. Basis set exchange: A community database for computational sciences. J. Chem. Inf. Model. 2007, 47, 1045–1052. [Google Scholar] [CrossRef]
- Frisch, M.J.; Trucks, G.W.; Schlegel, H.B.; Scuseria, G.E.; Robb, M.A.; Cheeseman, J.R.; Montgomery, J.A.; Vreven, T.; Kadin, K.N.; Burant, J.C.; et al. Gaussian 03; revision B03; Gaussian Inc.: Pittsburgh, PA, USA, 2003. [Google Scholar]
- Hariharan, P.C.; Pople, J.A. Accuracy of AHn equilibrium geometries by single determinant molecular orbital theory. Mol. Phys. 2006, 27, 209–214. [Google Scholar] [CrossRef]
- Kohn, W.; Becke, A.D.; Parr, R.G. Density Functional Theory of Electronic Structure. J. Phys. Chem. 1996, 100, 12974–12980. [Google Scholar] [CrossRef]
- Hanwell, M.D.; Curtis, D.E.; Lonie, D.C.; Vandermeersch, T.; Zurek, E.; Hutchison, G.R. Avogadro: An advanced semantic chemical editor, visualization, and analysis platform. J. Cheminfo. 2012, 4, 17. [Google Scholar] [CrossRef] [PubMed]
- Lee, W.W.; Tong, G.L.; Martinez, A.P.; Weinstein, B.; Schelstraete, M.G.; Baker, B.R.; Goodman, L. Synthesis of N,N-bis(2-chloroethyl)-DL-phenylalanine hydrochloride. J. Med. Chem. 1963, 6, 439–442. [Google Scholar] [CrossRef]
- Alberghina, G.; Arcoria, A.; Fisichella, S. Reaction kinetics of cinnamoyl, β-2-furylacryloyl, and β-2-thienylacryloyl chlorides with anilines in benzene. J. Org. Chem. 1978, 43, 1122–1125. [Google Scholar] [CrossRef]
- Kim, T.H.; Huh, C.; Lee, B.S.; Lee, I. Nucleophilic substitution reactions of cinnamoyl chlorides with anilines in acetonitrile and acetonitrile-methanol mixtures. J. Chem. Soc. Perkin Trans 2 1995, 12, 2257–2261. [Google Scholar] [CrossRef]
- Yamada, A.; Tomishima, M.; Hayashida, H.; Imanishi, M.; Spears, G.W.; Ito, K.; Takahashi, F.; Miyake, H. Novel Amide Compounds. European Patent EP 1 264 820 A1, 11 December 2002. [Google Scholar]
- Chute, J.P.; Jung, M.E.; Diers, E. Compounds and Methods for Hematopoietic Regeneration. World Intellectual Property. Organization Patent WO 2019/108800 A1, 6 June 2019. [Google Scholar]
- Wang, T.C.; Chen, Y.L.; Lee, K.H.; Tzeng, C.C. Lewis Acid Catalyzed Reaction of Cinnamanilides: Competition of Intramolecular and Intermolecular Friedel–Crafts Reaction. Synthesis 1997, 1997, 87–90. [Google Scholar] [CrossRef]
- Saeed, A.; Khera, R.A.; Shahidb, M.; Parvez, M. N-(4-Nitrophenyl)cinnamamide. Acta. Cryst. Sect. E Struct. 2009, E65, o2068. [Google Scholar] [CrossRef]
- Gavezzotti, A. Are Crystal Structures Predictable? Acc. Chem. Res. 1994, 27, 309–314. [Google Scholar] [CrossRef]
- Gavezzotti, A.; Filippini, G. Geometry of the Intermolecular X-H⋯Y (X, Y = N, O) Hydrogen Bond and the Calibration of Empirical Hydrogen-Bond Potentials. J. Phys. Chem. 1994, 98, 4831–4837. [Google Scholar] [CrossRef]


| Formula | C15H12N2O3 |
|---|---|
| Formula mass (g/mol) | 268.27 |
| Crystal system | Monoclinic |
| Space group | P21/n |
| a, b, c (Å) | 6.7810 (5), 23.0913 (15), 8.2079 (5) |
| α, β, γ (°) | 90, 93.538(3), 90 |
| V (Å3); Z | 1282.76 (15); 4 |
| Temperature (K) | 150 |
| Radiation type | MoKα (λ = 0.71073) |
| μ(Mo Kα), mm | 0.10 |
| Collected reflections | 20955 |
| 2Θ range (°) | 2.638, 33.172 |
| Unique reflections | 4759 |
| Rint | 0.031 |
| Rsigma | 0.0224 |
| R1 [I≥2σ (I)] | 0.0442 |
| wR2 | 0.122 |
| F(000) | 560.0 |
| Crystal size (mm) | 0.55 × 0.45 × 0.19 |
| Crystal description | Clear, yellow |
| D—H⋯A | D—H (Å) | H⋯A (Å) | D⋯A (Å) | D—H⋯A (°) |
|---|---|---|---|---|
| C2—H2⋯O2i | 0.95 | 2.38 | 3.2534 (10) | 152.1 |
| C11—H11⋯O3i | 0.95 | 2.42 | 3.3490 (11) | 165.6 |
| C15—H15⋯O1 | 0.95 | 2.27 | 2.8623 (10) | 119.6 |
| N1—H1⋯O2i | 0.88 | 2.33 | 3.1895 (9) | 164.7 |
| C2—H2⋯O2i | 0.95 | 2.38 | 3.2534 (10) | 152.1 |
| Bond Lengths (Å) | Bond Angles (°) | ||||||
|---|---|---|---|---|---|---|---|
| A-B | ShelXl | HAR | B3LYP | A-B-A | ShelXl | HAR | B3LYP |
| C1–C2 | 1.479 (11) | 1.480 (6) | 1.483 | O1–C1–N1 | 123.5 (7) | 123.8 (4) | 123.1 |
| C1–N1 | 1.375 (10) | 1.373 (5) | 1.389 | O1–C1–C2 | 124.0 (7) | 123.8 (4) | 123.5 |
| C1–O1 | 1.228 (10) | 1.225 (5) | 1.226 | N1–C1–C2 | 112.5 (7) | 112.5 (3) | 113.4 |
| C2–C3 | 1.337 (11) | 1.339 (6) | 1.346 | C3–C2–C1 | 121.8 (8) | 121.8 (4) | 119.7 |
| C3–C4 | 1.466 (12) | 1.464 (6) | 1.462 | C2–C3–C4 | 125.6 (8) | 125.6 (4) | 128.2 |
| C10–N1 | 1.404 (10) | 1.401 (5) | 1.403 | C1–N1–C10 | 128.3 (7) | 128.0 (3) | 128.8 |
| C14–N2 | 1.465 (10) | 1.463 (5) | 1.477 | C15–C10–N1 | 123.4 (7) | 123.6 (3) | 123.1 |
| N2–O2 | 1.231(10) | 1.225 (5) | 1.229 | C11–C10–N1 | 117.1 (6) | 116.9 (4) | 117.6 |
| N2–O3 | 1.226 (11) | 1.218 (5) | 1.232 | O3–N2–O2 | 123.0 (7) | 122.9 (4) | 124.6 |
| C11–C12 | 1.384 (11) | 1.388 (6) | 1.391 | O3–N2–C14 | 118.4 (7) | 118.4 (4) | 117.5 |
© 2019 by the authors. Licensee MDPI, Basel, Switzerland. This article is an open access article distributed under the terms and conditions of the Creative Commons Attribution (CC BY) license (http://creativecommons.org/licenses/by/4.0/).
Share and Cite
Lee, J.-S.; Zeller, M.; Warkad, S.D.; Nimse, S.B. Synthesis, Characterization, and Crystal Structure of N-(3-nitrophenyl)cinnamamide. Crystals 2019, 9, 599. https://doi.org/10.3390/cryst9110599
Lee J-S, Zeller M, Warkad SD, Nimse SB. Synthesis, Characterization, and Crystal Structure of N-(3-nitrophenyl)cinnamamide. Crystals. 2019; 9(11):599. https://doi.org/10.3390/cryst9110599
Chicago/Turabian StyleLee, Jung-Seop, Matthias Zeller, Shrikant Dashrath Warkad, and Satish Balasaheb Nimse. 2019. "Synthesis, Characterization, and Crystal Structure of N-(3-nitrophenyl)cinnamamide" Crystals 9, no. 11: 599. https://doi.org/10.3390/cryst9110599