Article

From Rate Measurements to Mechanistic Data for Condensed Matter Reactions: A Case Study Using the Crystallization of [Zn(OH2)6][ZnCl4]

Department of Chemistry, North Carolina State University, Raleigh, NC 27695-8204, USA
*
Author to whom correspondence should be addressed.
Crystals 2017, 7(1), 11; https://doi.org/10.3390/cryst7010011
Submission received: 31 August 2016 / Revised: 29 October 2016 / Accepted: 23 December 2016 / Published: 31 December 2016
(This article belongs to the Special Issue Development of Time-Resolved X-Ray Crystallography)

Abstract

:
The kinetics of crystallization of the R = 3 hydrate of zinc chloride, [Zn(OH2)6][ZnCl4], is measured by time-resolved synchrotron x-ray diffraction, time-resolved neutron diffraction, and by differential scanning calorimetry. It is shown that analysis of the rate data using the classic Kolmogorov, Johnson, Mehl, Avrami (KJMA) kinetic model affords radically different rate constants for equivalent reaction conditions. Reintroducing the amount of sample measured by each method into the kinetic model, using our recently developed modified-KJMA model (M-KJMA), it is shown that each of these diverse rate measurement techniques can give the intrinsic, material specific rate constant, the velocity of the phase boundary, vpb. These data are then compared to the velocity of the crystallization front directly measured optically. The time-resolved diffraction methods uniquely monitor the loss of the liquid reactant and formation of the crystalline product demonstrating that the crystallization of this hydrate phase proceeds through no intermediate phases. The temperature dependent vpb data are then well fit to transition zone theory to extract activation parameters. These demonstrate that the rate-limiting component to this crystallization reaction is the ordering of the waters (or protons) of hydration into restricted positions of the crystalline lattice resulting in large negative entropy of activation.

1. Introduction

Time-resolved diffraction provides a powerful tool with which to study the rate of condensed matter reactions such as phase transitions. Unlike microscopy or calorimetry, diffraction techniques uniquely afford phase identification concurrent with the temporal evolution of the transformation (e.g., the commensurate formation of calcite and vaterite from amorphous calcium carbonate [1]). Time-resolved diffraction using an area detector further affords the ability to discriminate between nucleation and growth components of a phase transition [2].
While time-resolved diffraction is an effective means to measure the rate of a transformation, it is necessary to apply some model to the rate data to extract kinetic, and subsequently mechanistic information about the transition of interest. The Kolmogorov [3]—Johnson and Mehl [4]—Avrami [5,6,7] (KJMA) model, Equation (1), is the most commonly utilized rate expression for kinetic analysis of condensed phase reactions.
α ( t ) = 1 e x p { [ k A ( t t 0 ) ] n }
This expression assumes a phase boundary controlled process, with α(t) corresponding to the fraction of the sample transformed, kA the rate constant, t0 the time of the onset of nucleation, and the exponent n describing the dimensionality of the process. The KJMA expression provides excellent fits for diverse phase transition kinetic data, from which mechanistic detail is frequently inferred. Nevertheless, as we recently summarized [2], and here provide another case study, the KJMA parameters are significantly affected by experimental factors that do not necessarily reflect the true reaction mechanism.
The specific case study described here examines the crystallization rate of the congruently melting zinc chloride hydrate, ZnCl2·R H2O, R = 3. This composition crystallizes as the CsCl-type salt [Zn(OH2)6][ZnCl4], and melts to an ionic liquid for which there is high correlation between the structure in the liquid and crystalline phases [8]. This study is the initial component to an investigation of the mechanism of crystallization from saturated solutions. After benchmarking the crystallization of the congruently melting hydrate phase, the rates of crystallization will be measured for water-rich samples between the congruent and the eutectic compositions.
For this manuscript, crystallization rate data is obtained by temperature- and time-resolved synchrotron and neutron scattering (TtXRD and TtND), differential scanning calorimetry (DSC), and video recording. These comparative data are evaluated using the modified KJMA expression (M-KJMA), Equation (2) [2,9], demonstrating the corrections necessary to ensure rate constants are intrinsic to the sample and reaction conditions, not the specific technique of measurement.
α ( t ) = 1 e x p { [ v p b a c g V 3 ( t t 0 ) ] n }
Here, vpb is the velocity of the phase boundary, g is a geometric factor (equal to 1 for a cubic system), ac is an anisotropy correction for the sample geometry, and n is the sample anisotropy corrected dimensionality exponent.
Thus, in addition to providing insight into the crystallization of the specific R = 3 zinc chloride hydrate, this manuscript provides an exemplar for obtaining meaningful kinetic data from time-resolved diffraction rate measurements, here the velocity of the phase boundary, vpb. Only after obtaining such temperature dependent kinetic data intrinsic to the sample can one begin to probe mechanistic questions. As further shown in the discussion section, this vpb(T) data can be fit by our recently described transition zone theory [10], which accounts for the non-Arrhenius crystallization kinetics and gives insight as to the rate determining component(s) of the crystallization reaction.

2. Results

Crystallization experiments were conducted by quenching a room temperature melt to supercooled isotherms, Tiso, then monitoring the isothermal crystallization as a function of time using diverse techniques. The R = 3 zinc chloride hydrate melts at Tm = 279 K and exhibits a glass transition Tg = 228 K, below which temperature crystal growth is arrested. As was established as early as 1900, crystallization rates accelerate as the temperature is increased above Tg, to a maximum, Tmax, after which the rate of growth retards to zero as Tm is approached [11]. Thus for any mechanistic study of crystal growth, it is necessary to obtain rate data across the entire temperature range from Tg to Tm.
The R = 3 hydrate of zinc chloride crystallizes with a triclinic unit cell, however, the CsCl-type pseudo-cubic packing of the [Zn(OH2)6]2+ and [ZnCl4]2− molecular ions, in addition to visual observation, demonstrates reasonably isotropic crystal growth in three dimensions. This defines the dimensionality of crystal growth to be n = 3, and allows the geometric factor to be modeled as g = 1. However, as demonstrated by our previous simulations, the anisotropy of the sample container can impose a lower apparent dimensionality on a phase transition [9]. For example, a 3-D growth process constrained by a capillary sample geometry will exhibit approximately 1-D growth, whereas growth in a disk geometry will approximate 2-D growth. Notably, the number of crystallites growing in a sample container also impacts the anisotropy of the system, i.e., multiple crystallites divide an anisotropic bulk sample container into more isotropic domains. It is preferred to conduct kinetic crystallization experiments in as isotropic a sample container as possible so as to eliminate the need for an anisotropy parameter, ac, and exponent n distinct from the crystal growth dimensionality n. In the experiments reported here, the TtXRD and TtND experiments are conducted in reasonably isotropic sample environments, with aspect ratios 0.5 < d/h < 2. However, anisotropy corrections must be applied to the DSC rate data.
Nucleation was also found to complicate the measurement of reaction rates in this system, with initial nucleation times ranging from under one minute to more than an hour, depending on the Tiso, sample size and sample container. Temperature- and time-resolved synchrotron diffraction (TtXRD) using an area detector arguably provides the best kinetic data, for which the growth of individual crystallites can be evaluated. However, the small sample size and low defect surface of the fused silica capillaries for these experiments presented nucleation challenges, such that in the time frame appropriate for user-time at the synchrotron (i.e., nucleation in less than 1 h), only four samples were observed to nucleate, over a very narrow temperature range near Tmax. The larger sample size afforded by temperature- and time-resolved neutron diffraction (TtND) experiments in fused silica NMR tubes, resulted in shorter observed nucleation times for samples quenched to isotherms below Tmax, however, above Tmax nucleation was not observed within the time frame we could justify with general user time on the spallation neutron source. Differential scanning calorimetry, a technique that could be conducted in our own laboratories and thus was not time limited, was successfully employed to examine crystallization reactions above Tmax. DSC experiments exhibited significantly different nucleation times that were slower for samples in a Pyrex capillary and faster when in a stainless steel DSC pan. However, the much slower quenching rate of the DSC instrument prevented measurement of crystal growth rates below Tmax, because crystallization completed during the instrumental quench.
Clearly, a multiplicity of techniques is necessary to obtain a complete set of crystallization rate data across the required temperature range for this system. In the following, we present the results of the crystallization rate measurements by bulk and individual crystallite TtXRD, bulk TtND, and DSC methods. These are compared with videos that directly visualize the crystallization process. It is apparent that standard KJMA analysis fits the rate data from any of these techniques very well. However, dramatic variation is observed between the KJMA rate constants obtained from different measurement techniques, albeit at the same Tiso. In the discussion, we demonstrate the necessary corrections afforded by M-KJMA analysis to yield a comprehensive set of rate constants that are intrinsic to the sample and the conditions (here Tiso) of the specific crystallization reaction.

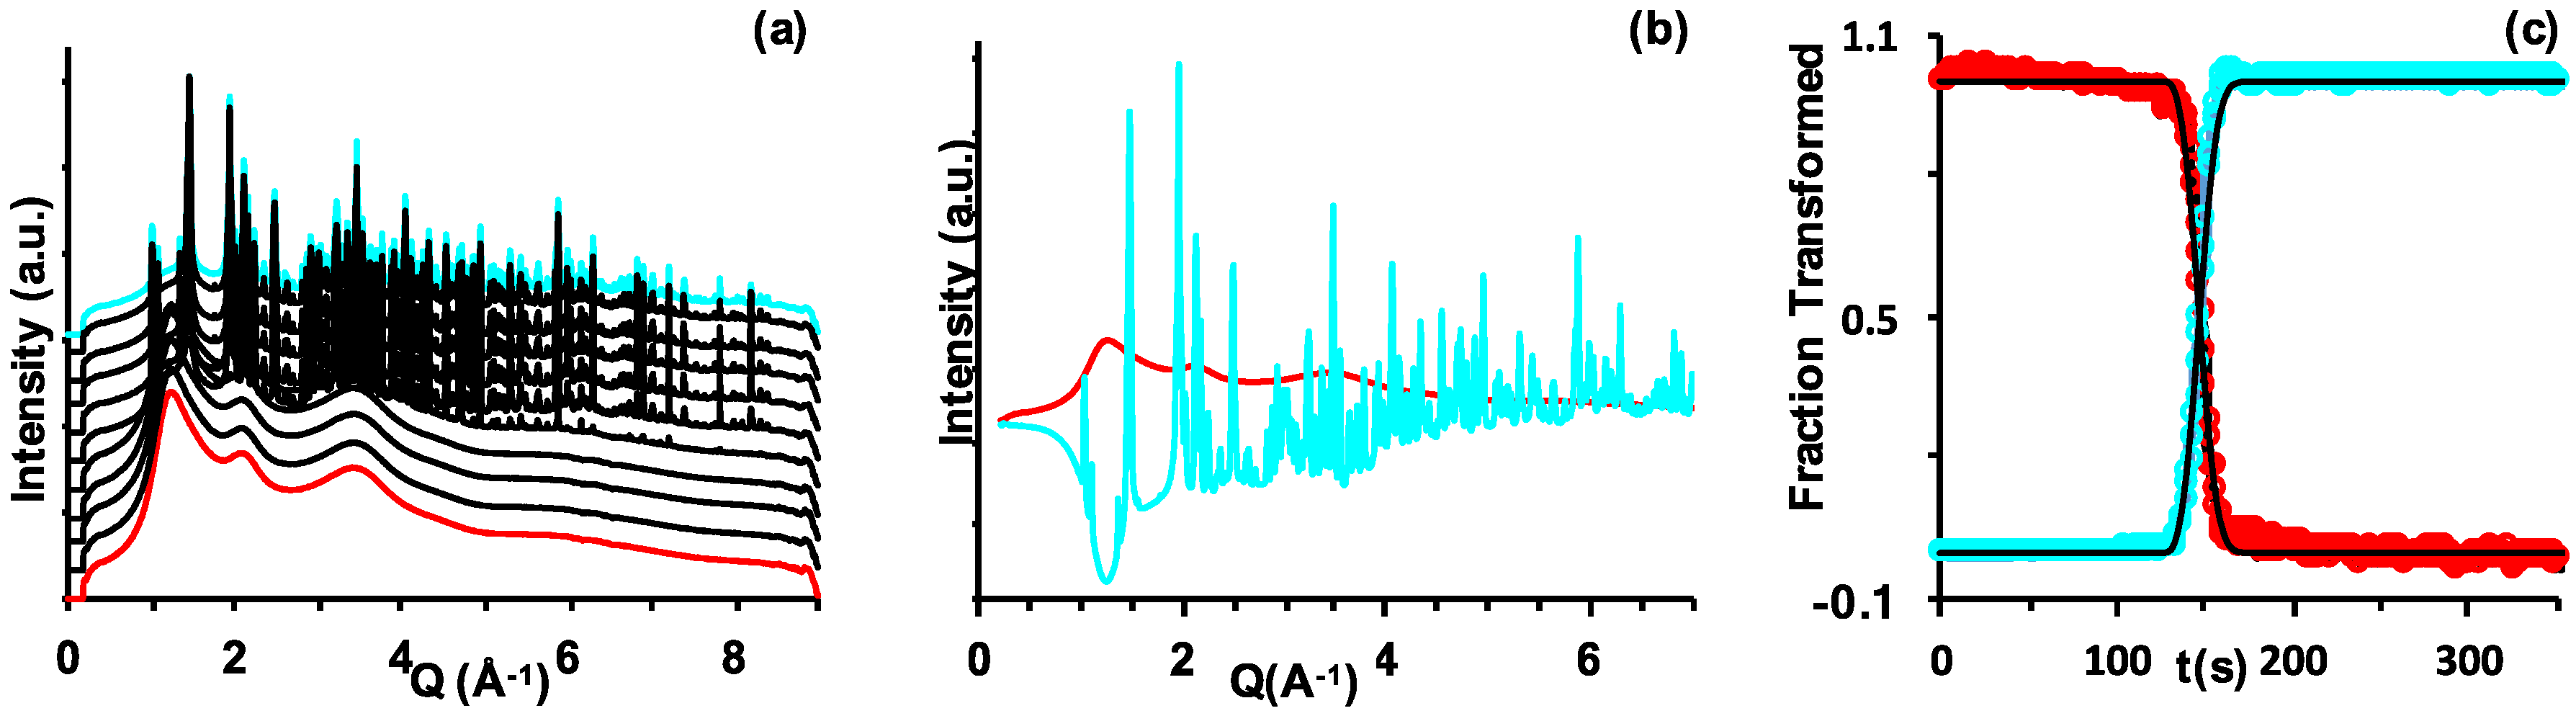
2.1. Temperature- and Time-Resolved X-ray Diffraction (TtXRD)

TtXRD measurements, conducted at the APS synchrotron, probed the crystallization of approximately 1 mm ingot samples sealed within 0.7 mm fused silica capillaries. The area of the synchrotron beam is 0.5 mm × 0.5 mm. Thus the sample geometry is sufficiently isotropic that no sample anisotropy correction terms (ac and n ) are required. 2-D diffraction images were collected at 1 Hz to evaluate the crystallization rate.
The sample was instantaneously quenched from room temperature to Tiso using a pre-cooled nitrogen stream; details are given in the methods section. Although 19 quenching crystal growth experiments were attempted for 193 K < Tiso < 248 K, only four experiments exhibited nucleation within a reasonable time frame. All the other attempts failed to nucleate within 1 h at Tiso and thus were aborted.

2.1.1. Bulk Sample Analysis

The 2-D diffraction patterns were azimuthally averaged to create 1-D diffraction patterns, shown as a temporal stack-plot in Figure 1a for a Tiso = 238 K experiment. The 1-D patterns are evaluated by singular value decomposition (SVD) using the process previously described [1,12]. Here the 1-D patterns are aggregated into an m × n data matrix A, where m is the number of reciprocal space vectors in each pattern and n is the number of diffraction patterns collected. The time-dependent crystallization data are decomposed into two sets of orthonormal basis functions, A = UΣVT, where the left singular matrix U corresponds to the time-independent basis vectors (i.e., components of the total data), and the right singular matrix VT corresponds to their time dependence. Σ is composed of singular values (i.e., weighting factors) to the contribution of the corresponding singular vectors. The first two basis vectors, u1 and u2 of the resultant U matrix rotated by θ = 171.2°, shown in Figure 1b, contain elements of the broad amorphous scattering from the liquid phase and the sharp diffraction of the crystalline phase. These basis vectors describe 87.7% of the variance of the original A matrix.
The corresponding basis vectors v1 and v2 of the VT matrix, also rotated by θ = 171.2°, describe the time-dependent loss of liquid scattering and appearance of crystalline diffraction, respectively. In Figure 1c, these data are normalized to 0% and 100%. The loss of liquid and emergence of the crystalline phase is observed to cross at 50% of the transformation giving strong evidence of an A→B reaction mechanism, i.e., with no intermediates. The time-resolved data of the fraction of the sample crystallized 0% < α(t) < 60% was fit to the KJMA model (Equation (1)), fixing n = 3, with t0 and kA as fitting parameters. The corresponding KJMA parameters for the four crystallized experiments are tabulated in supplemental information Table S1.

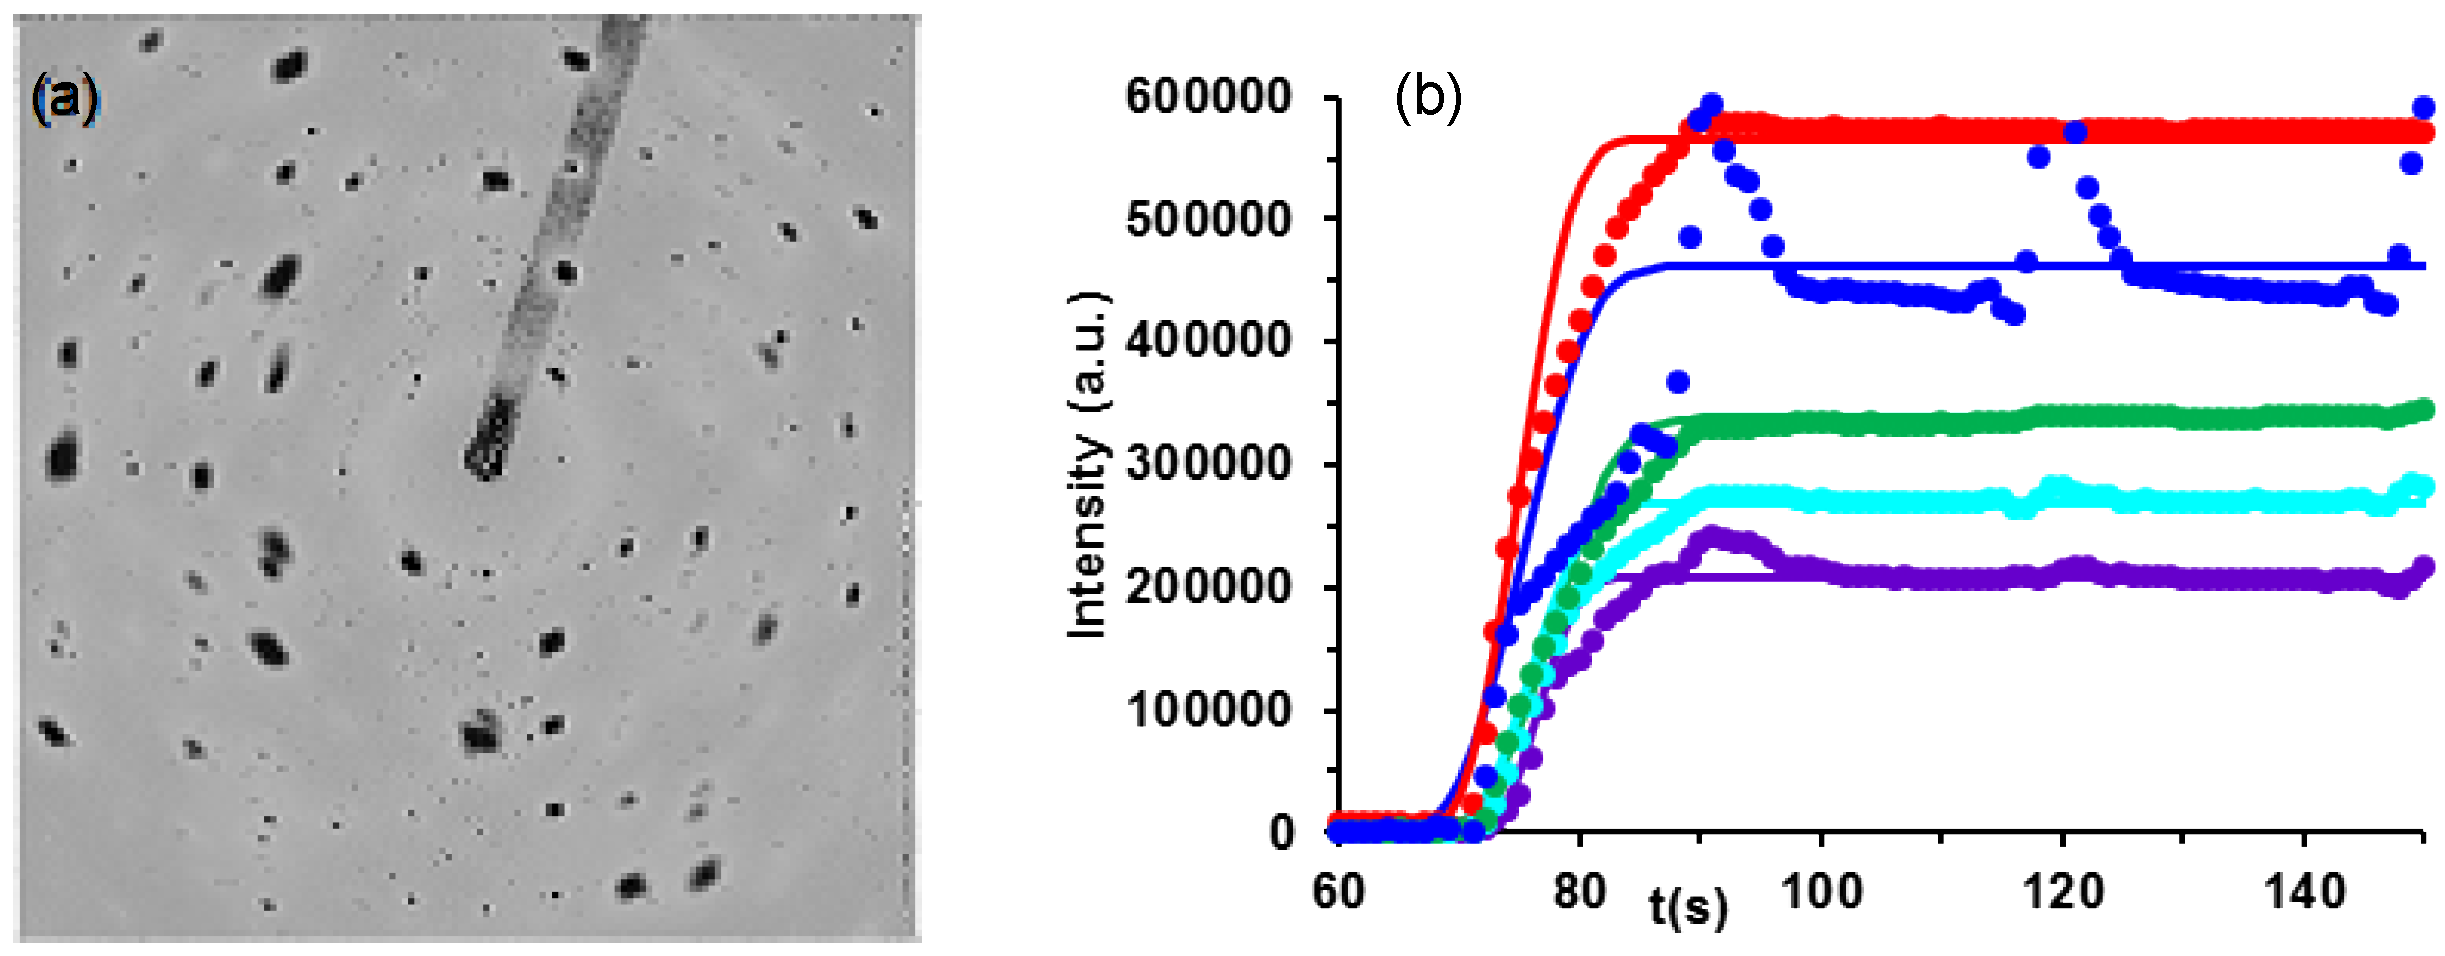
2.1.2. Individual Crystallite Analysis

The 2-D diffraction images uniquely allow evaluation of the time dependent growth of individual crystallites. As seen in Figure 2a for a Tiso = 243 K reaction, multiple crystallites are observed. The relative size of each crystallite should nominally be proportional to the intensity of its diffraction spots compared to the average of diffraction spots exhibiting the same q vector, although peak multiplicity and the extent to which lattice planes align with the Ewald sphere will also impact the peak intensity. Software is being developed to systematically analyze the time evolution of each diffraction spot [13]. Here, the first level of such analysis is applied to this Tiso = 243 K reaction, for which KJMA rate constants were obtained for diffraction spots of intensity greater than an arbitrary cut-off of 200,000 counts (limited for manageable analysis). The growth curves for selected individual crystallite diffraction spots is given in Figure 2b. Because of the low symmetry of this crystal system, P 1 ¯ , diffraction peaks are not well resolved in Q making it extremely difficult to assign (hkl) indices as will be necessary to evaluate crystallite size. Qualitatively the smallest peaks in the image (Figure 2a), below this threshold, nucleate later in time and tend to exhibit faster KJMA rate constants, consistent with the fact that earlier nucleating crystallites have more time for unobstructed crystal growth, whereas later nucleating crystallites are more likely to early impinge on other crystallites and/or the container walls.
As apparent from Figure 2b, certain of the crystallite peaks exhibit a dramatic aliasing problem (approximately every 30 s) resulting from the goniometer oscillation and the detector shutter speed being slightly out of synchronization. This artifact is most dominant for crystallites oriented most near the edge of the Ewald sphere. Nevertheless, these single crystallite data are reasonably fit to the KJMA model for 0% < α(t) < 30% where single crystallite growth is relatively un-impeded. At higher fractions of α(t) growth impingement results in an expected deviation away from the model. The KJMA rate parameters extracted for each crystallite are tabulated in supplemental information Table S2.

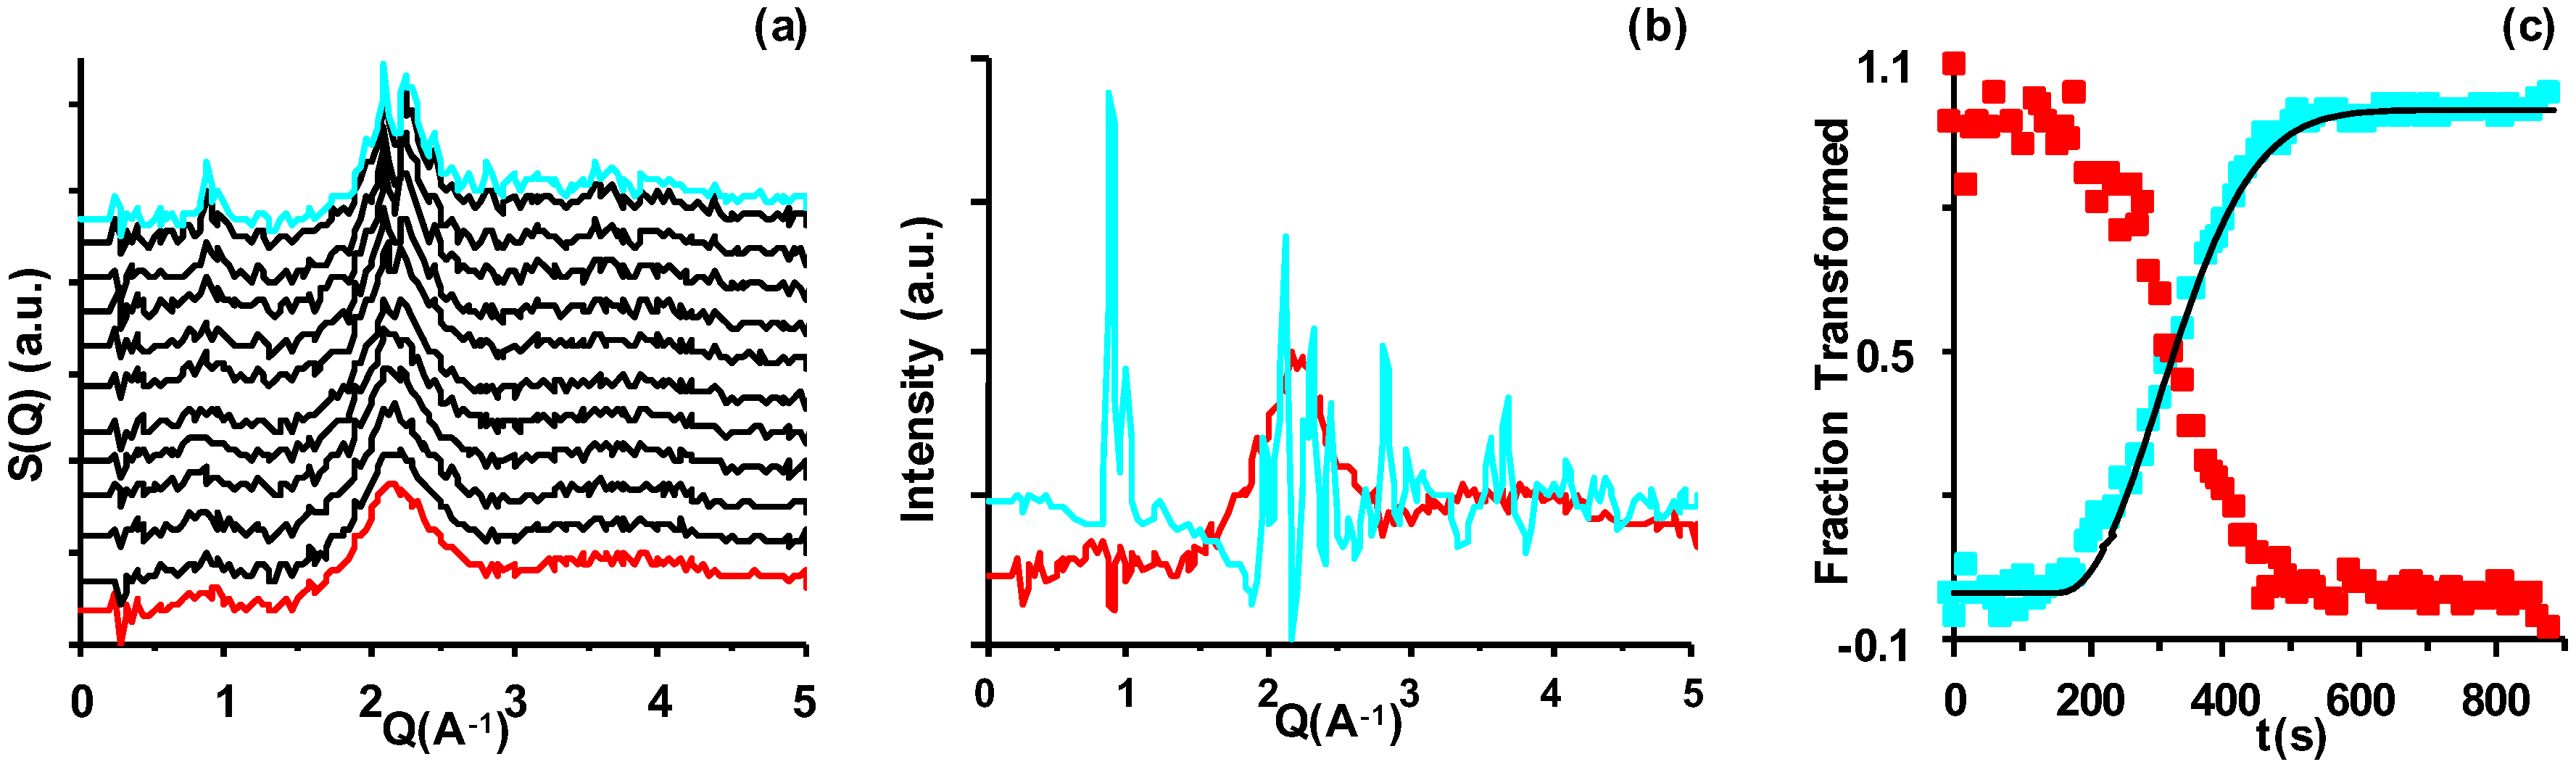
2.2. Temperature- and Time-Resolved Neutron Diffraction (TtND)

The intense neutron beam accessible using the NOMAD instrument at the spallation neutron source (SNS) [14] uniquely makes it possible to consider conducting time-resolved neutron diffraction experiments [15]. Having observed that nucleation probability approximately scales with sample volume, the larger sample size required for the neutron diffraction experiments provided access to nucleation at Tiso values for which there was an extremely small nucleation probability for the smaller sample size of the TtXRD experiments. The 9 mm diameter neutron beam along with the sample sealed into a 5 mm fused silica NMR tube resulted in the analyzed portion of the sample (i.e., the amount of the sample in the neutron beam) being sufficiently isotropic (d/h ≈ 0.55) so that no anisotropy corrections (ac and n ) are required. Diffraction data were collected with 5 s acquisition every 11 s. While neither the signal-to-noise nor time-resolution can compete with that of the synchrotron experiments, we believe this 11 s time-resolution is the fastest reaction kinetics by neutron diffraction yet reported.
Room temperature molten samples were quenched to Tiso by translating the sample into a pre-cooled argon stream. The sample was fully immersed into the cold stream in approximately 5 s. Based on an external model experimental set up, we expect about a 3 K temperature gradient across the portion of the sample that is in the neutron beam. Successful crystallization experiments were conducted at Tiso = 233 and 238 K. One experiment at 238 K, and several attempts at higher temperatures failed to nucleate within 1 h and thus the experiments were aborted. Experiments conducted at ≤ 228 K exhibited only partial crystallization on cooling prior to the bulk of the sample freezing to a glass.
The time-resolved structure factor data, S(Q)(t), Figure 3a, were aggregated into an m × n data matrix and analyzed by SVD, as described above for the bulk TtXRD analysis. The time-dependent crystallization data are decomposed into the orthonormal basis functions (rotated by θ = 330° for the example in Figure 3) of the time-independent diffraction patterns of the liquid and crystalline phases (u1 and u2) and their time dependence (v1 and v2 normalized to the fraction transformed), respectively. These basis vectors describe 32.9% of the variance of the original A matrix, the remainder being noise components given the significantly worse signal-to-noise ratio of the TtND experiments.
The loss of the liquid and emergence of the crystalline phase is again observed to cross at α(t) = 50% indicative of the A→B reaction mechanism. The time-resolved data of the fraction of the sample crystallized 0% < α(t) < 60% was fit to the KJMA model, fixing n =3, with t0 and kA as fitting parameters. The corresponding KJMA parameters for the five experiments that fully crystallized are tabulated in supplemental information Table S1. It is important to recognize that these neutron experiments were conducted using D2O instead of H2O, and thus any kinetic isotope effects (KIE) may limit the extent to which rate constants can be compared. Note that D2O lowers the melting point of the R = 3 zinc chloride hydrate to 272 K [8]. That some crystallization was observed for samples cooled below Tg suggests that both removal of heat from the sample and/or the heat generated upon crystallization may contribute to the observed temperature dependent rate constants. However, the removal of heat from quenching and/or crystallization should be fastest when the sample is exposed to the largest ΔT, i.e., fastest heat removal for lower temperature samples. Importantly, this means the observed diminished rate for the lower temperature reactions is indicative of the crystallization rate being retarded as Tg is approached, and is not an artifact of heat transfer.

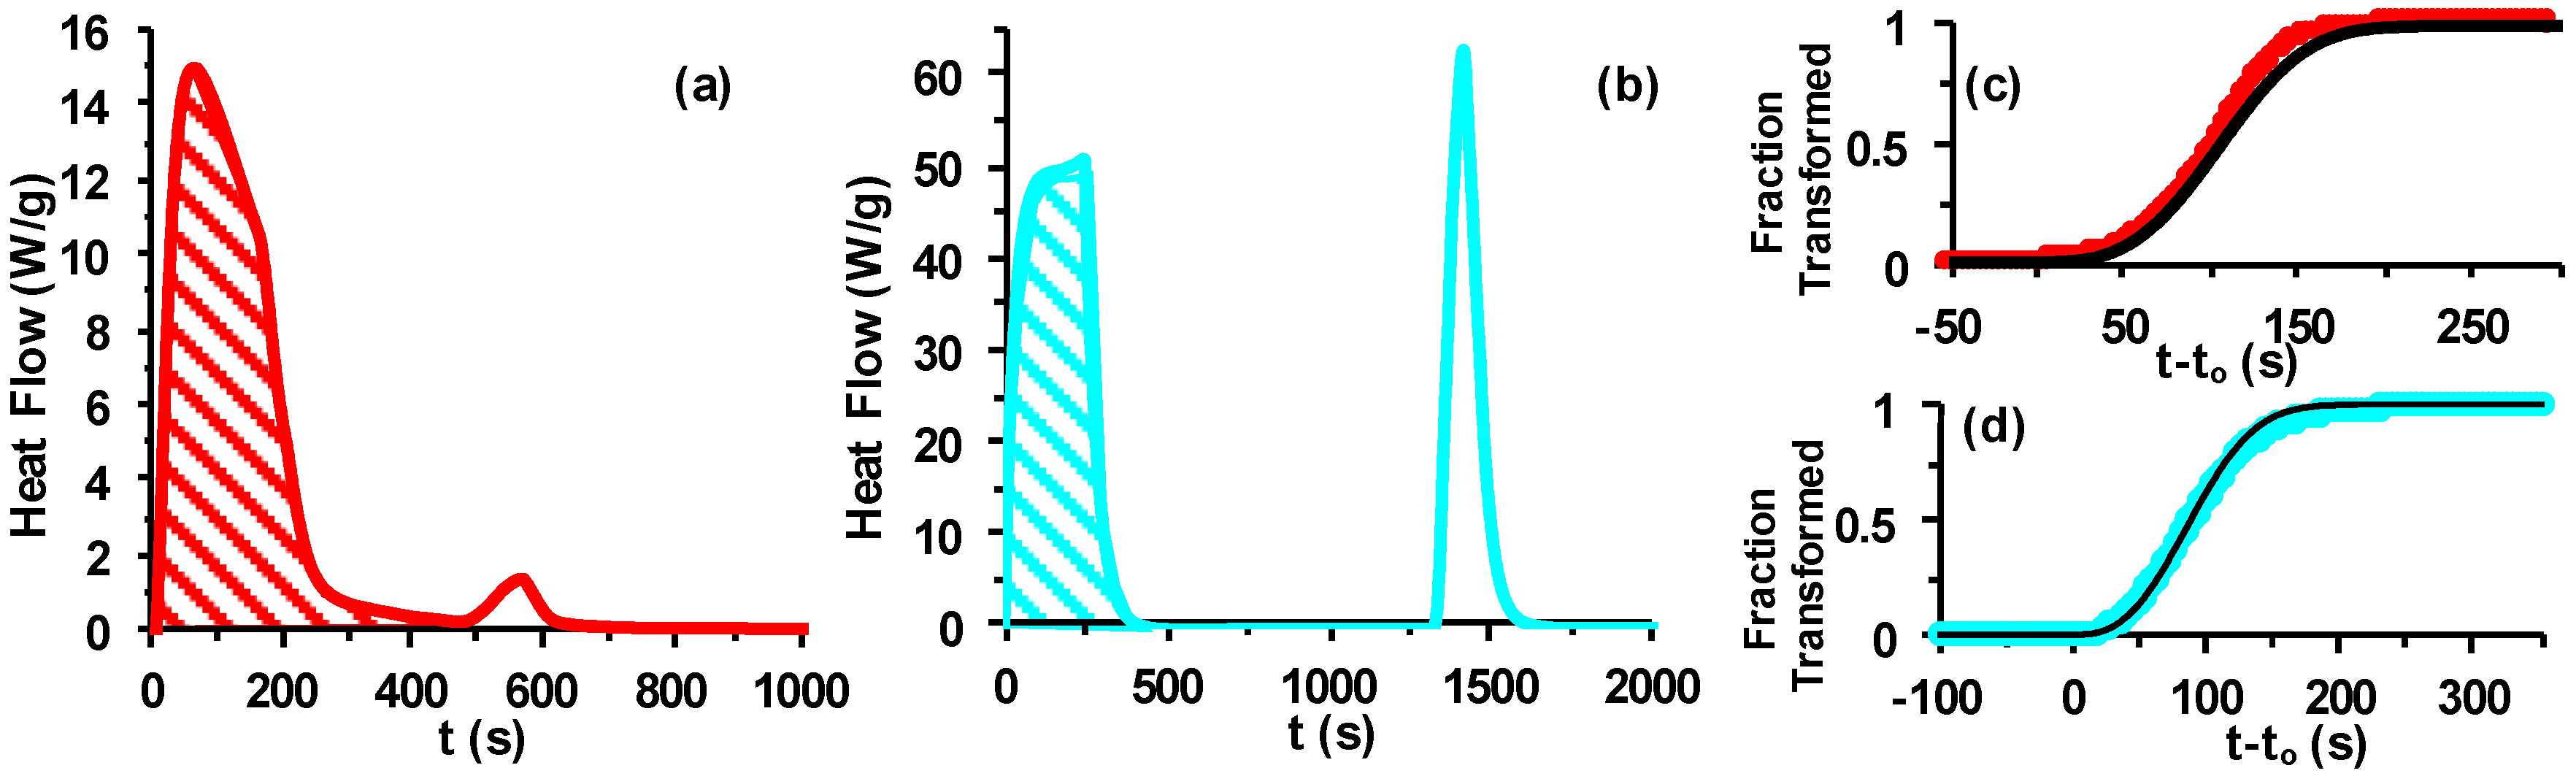
2.3. Differential Scanning Calorimetry (DSC)

Measurement of liquid-to-crystal transformations by DSC exhibit two signals corresponding to the instrumental quench response (IQR) and the heat evolved from crystallization, respectively. Ideally these are well separated in time. Samples ranging from 35 to 46 mg in 5 mm diameter high-pressure stainless steel DSC pans were observed to nucleate with effective separation between the IQR and crystallization response for 248 K ≤ Tiso ≤ 270 K. Below 248 K these overlap such that it is not possible to uniquely resolve the crystallization response. However, a 6.3 mg sample sealed into a 0.8 mm Pyrex capillary exhibited slower nucleation such that a reasonable resolution between the IQR and crystallization response at Tiso = 243 K was obtained. However, the capillary sample exhibited no nucleation at higher temperature, and the crystallization response overlapped the IQR at lower temperatures. Representative DSC traces are given in Figure 4a,b.
The sample geometries for the DSC experiments are significantly anisotropic, with disk-like d/h aspect ratios between 4.1 and 5.4 for the DSC pans and d/h = 0.12 for the capillary sample. This is likely why unconstrained fitting to the KJMA model yields values of the exponent n that are less than 3, which was expected for three-dimensional growth. It must be recognized, however, that the KJMA parameters n, kA and t0 are highly correlated [2]. It is not practical to conduct a set of aspect ratio and nucleation rate simulations for each type of material to obtain anisotropy corrections. Instead, to correlate these DSC experiments to the previous analytical simulation [9], we fixed t0 to be the time at which crystallization heat flow was observed to first increase above the baseline, then fit 0% < α(t) < 60% to Equation (1) to obtain n values for each crystallization reaction conducted with the same sample. Those n values for each respective sample were superimposed on the fixed volume simulation from reference [9] (Figure 5) to evaluate the actual anisotropy of the sample.
The experimental distribution of n values for DSC pan experiments is remarkably consistent with the constant volume simulation. However, the n values for the DSC capillary experiments suggest a greater extent of nucleation occurred than was simulated resulting in a reduced apparent anisotropy. Based on the above, each DSC pan experiment was subsequently evaluated with n fixed to the value implied by its actual d/h aspect ratio from the constant volume simulation according to the empirical relationships of Equation (3). By contrast, because of the apparently greater amount of nucleation in the DSC capillary experiments, n was fixed at the average observed value for that sample geometry, and the empirical Equation (3) was used to identify the apparent aspect ratio, d/h ≈ 0.30.
n = { 3 1.36   ×   e x p [ ( 2.5   × ( d h ) ) 1.66 ]   ,   d h < 1 2.38 + 0.63   ×   e x p [ ( 0.28   × ( d h 1 ) ) 1.66 ]   ,   d h > 1
Using the fixed values of n , representative of the anisotropic sample geometries, all DSC experiments were fit to obtain the KJMA parameters, kA and t0. Representative examples of the integrated heat flow and corresponding KJMA fit for a capillary and pan experiment are given in Figure 4c,d. The resulting KJMA parameters are tabulated in supplementary information Table S1.

2.4. Crystallization Video

Videos at 60 frames per second were taken of the crystallization reaction using a sample configuration similar to that of the TtND experiments to understand the extent of nucleation under those reaction conditions. Samples were sealed in 5 mm Pyrex NMR tubes. Room temperature samples were quenched into a pre-cooled nitrogen stream. A temperature gradient of between 241 and 253 K was observed across the 5.5 cm between the base and top of the sample. The first nuclei were observed after 1–2 min at the bottom of the tube closest to the cold stream, but subsequently nucleation occurred throughout the sample. The direct progress of the crystallizing phase was measured by analyzing the growth of individual crystallites in each of the video frames, excerpts being shown in Figure 6. Interestingly, as seen in the figure, the fastest crystallization occurs about 2/3 of the distance up the sample tube, suggesting Tmax is likely in the vicinity of 248 K.
While evaluation of the extent of crystallization, α(t), or disappearance of the liquid (1 − α(t)) is not possible to readily extract from the images, they do provide a direct measure of the progress of the crystallization phase boundary, vpb. The crystallites tend to be more isotropic at the bottom and top of the tube and more anisotropic in the region around Tmax where crystal growth rates will be most sensitive to small differences in temperature; a factor aggravated by the temperature gradient of this experimental set-up. While this adds error to the measured vpb, we approximate an isotropic growth rate as the average progress of the phase boundary for each crystallite. The measured vpb(T) values are given in Table S1.

3. Discussion

3.1. Velocity of the Phase Boundary

The velocity of the phase boundary, vpb, is presumably the most chemically relevant rate constant, with units of distance·time−1. With knowledge of the vpb, along with the dimensionality of the crystallization process and the density of the material, it is possible to determine the number of molar, or atomic/molecular interactions formed per unit time. By contrast, the rate constants obtained from basic KJMA analysis only have units of reciprocal time. Normalization of the rate data to the fraction transformed, α(t), removes information pertaining to the amount of sample. Thus, before any mechanistic interpretation can be extracted from KJMA rate parameters, they must be corrected to the corresponding vpb.
The need for correction is dramatically apparent by considering the comparative KJMA rate constants extracted from the above time-resolved diffraction, and differential scanning calorimetric rate data given in Figure 7. Unfortunately, nucleation issues limited the extent to which it was possible to measure redundant crystallization reactions at equivalent Tiso values with different techniques. However, comparative data from multiple techniques was obtained across the narrow ≈10 K window in the vicinity of Tmax. Notably, the KJMA rate constants vary by more than an order of magnitude depending on technique. Of particular concern is that the bulk vs. single crystallite diffraction analysis of the same synchrotron data exhibit dramatically different rate constants. And while, as noted above, there may be some kinetic isotopic effect difference between the rates of crystallization of the H2O hydrates by x-ray and DSC measurements and the D2O hydrates measured by neutron diffraction, KIE cannot explain the dramatically different rate constants observed.
Analytical simulations of crystal growth experiments demonstrated a similar distribution of rate constants when analyzed using the KJMA model [9]. In that work, it was observed that the largest samples exhibit significantly smaller KJMA rate constants than was observed for smaller samples, and single crystallite rate constants appear to be faster than bulk rate constants. This is precisely the trend observed experimentally in Figure 7 with the large TtND and DSC pan experiments exhibiting the slowest rate constants and TtXRD single crystallite rate constants being the fastest. Clearly, the sample size must be reintroduced into the rate expression to obtain intrinsic, material specific rate constants [2,9].
Under conditions of modest nucleation, and without the pre-formation of multiple nuclei (the latter often being observed for cold-crystallization, i.e., up-quenched from the glass), the sample size correction can be as simple as multiplying the KJMA rate constant by the cube root of sample volume, Equation (4), which gives the constant vpb.
v p b   k A V 3
Full correction of the rate constant, according to the M-KJMA model, Equation (2), also requires the g and ac parameters, which describe the geometry of the crystal growth and the anisotropy of the sample container, respectively. The approximately cubic structure of this system is consistent with g ≈ 1. The ac values can be determined from the actual (or apparent in the case of greater nucleation) d/h ratio of the sample container using empirical Equations (5) [9].
a c = { e x p ( 0.44 × l n ( d h ) + 0.31 )   ,   d h < 0.46 e x p ( 0.29 × l n ( d h ) + 0.24 )   ,   d h > 2.67
In this work, the latter anisotropic sample container correction is only necessary for the DSC sample container geometries. However, even with full correction, the analytical simulations with fully controlled parameterization demonstrate rate constants that vary by approximately a factor of two. This is in part due to the fact that a crystallite originating from the center of a sample can grow in all directions and thus will increase in volume at least twice as fast as a crystallite originating in the corner or edge of a sample that is constrained in its growth. Even greater variation can be expected given the ±0.5 to 3 K temperature uncertainties of the experimental methods.
As demonstrated in Figure 8, correcting the KJMA rate constants to the vpb reduces the scatter in the rate constant data to within the expected scatter by a factor of about two. We suspect the largest outlier points in this study result from error in the temperature measurement. As an external check to this analysis, the vpb calculated using the M-KJMA rate expression is compared with the physical velocity of the phase boundary as measured by image analysis of videos shot at 60 frames per second, of crystallization reactions in a configuration analogous to that used for the TtND experiments. Our current homemade nitrogen cold stream does not have as stable of temperature control as the Oxford cryostream used at the Spallation Neutron Source. Furthermore, the accuracy of the measured vpb is limited by the resolution of the video as well as extracting a linear rate constant from the 2-D video images without precise knowledge of the 3-D orientation of the crystallites with respect to the camera and depth of field. Nevertheless, the optically measured vpb is in good agreement with the vpb values extracted from the M-KJMA analysis of data from the diverse set of techniques. The optical images suggest that nucleation most commonly originates from the sample edges. Thus the M-KJMA fit values of vpb would be expected to smaller than those obtained from the direct measure of the phase boundary, as is also observed in Figure 8.
We do not yet have an accurate means to determine the absolute size of individual crystallites from the single diffraction spot analysis, though we suspect this will be correlated with the relative intensity for common (hkl) families of diffraction spots. Thus, the single crystallite rate constants cannot yet be corrected to vpb. Nevertheless, volume corrections of approximately 4 to 50% of the total sample, a very reasonable assumption based on the intensities of Figure 2a, would correct the kA values from analyzed single crystallites to consistent vpb values.

3.2. Activation Energy of Crystallization

With knowledge of the temperature dependence of the intrinsic, material specific vpb(T), it is possible to consider mechanistic details of the crystallization reaction. The temperature dependent rate of crystallization in this R = 3 zinc chloride hydrate system exhibits a similar profile to other crystal growth reactions, with the rate increasing from Tg to Tmax, and then being retarded as Tm is approached. We recently demonstrated that these apparently Arrhenius and non-Arrhenius type kinetic regions, respectively on either side of Tmax, are best modeled by transition zone theory of crystal growth, TZTc [10]. TZT is a condensed matter analog to Eyring’s transition state theory, where instead of a specific transition state, there is a cooperative “zone” that propagates as the material transitions from liquid to crystal. Whereas in molecular reactions described by transition state theory, the enthalpic and entropic activation parameters are considered temperature independent constants, in the condensed phase described by transition zone theory, the temperature dependence of the cooperativity of the system [16] results in temperature dependent activation parameters. At the Kauzmann temperature, TK, the temperature at which a liquid and its crystalline form have equivalent configurational entropy [17], the entire sample must transform cooperatively. With increasing temperature the extent of cooperativity diminishes until at and above the melting point cooperative organization into a crystalline lattice is no longer possible. This is modeled by the TZTc expression of Equation (6).
v p b = λ k B T h e x p ( Δ H c * R ( T T K ) ) e x p ( Δ S c * R ( T T K T m T ) z c )
Here, the attempt frequency λ k B T h , is the product of the number of lattice vibrational modes that lead to formation of the transition zone for crystal growth and the velocity of the transition zone; λ is a characteristic wavelength of vibrations that lead to growth, equal to twice the average lattice dimension (here λ = 1.68 × 10⁻³ μm), kB is Boltzman’s constant and h is Plank’s constant. ΔHc* and ΔSc* are intrinsic activation parameters, such that the temperature dependent enthalpy and entropy of activation is defined as Δ H =   Δ H c * ( T T T K ) and Δ S =   Δ S c * ( T T K T m T ) z c , respectively. The parameter zc modulates the temperature dependence of the entropy of activation.
We have not yet been able to measure the TK of this material (thus it remains a fitting parameter in this manuscript), and we must collect more low temperature crystallization rate data, i.e., between Tmax and Tg, as well as obtain data for both H2O and D2O hydrates before we can make confident determination of the system’s activation parameters. But shown in Figure 8 is the TZTc curve resulting from non-linear least squares fitting of all the H2O data (dashed line); the D2O TtND has been excluded from the fit because of the likely KIE. Here with TK fit to be 199 K, the enthalpic and entropic activation parameters are ΔHc* = 1.9(3) kJ/mol, ΔSc* = −114(7) J/mol·K, and zc = 0.12(2) respectively. Alternatively, if the data are fit to the fastest vpb values, recognizing that the total sample volume correction of kA to vpb would under estimate the actual value, then TK is fit to be 222 K and the activation parameters are ΔHc* = 0.51(5) kJ/mol, ΔSc* = −142(2) J/mol·K, and zc = 0.078(6) respectively. Both are similar with respect to experimental error, but the latter appears to more accurately represent the retardation of crystallization as Tg is approached.
Though not yet precisely determined, placing these activation parameters in context of other crystallizing systems [10] the enthalpy of activation is lower and the entropy of activation more negative than any other system we have evaluated; this includes both molecular and network crystals. We suggest that the very small ΔHc* term is consistent with the essentially equivalent CsCl-type packing of the molecular ions in the liquid and crystalline states [8]. By contrast, the very large and negative ΔSc* is likely due to the required ordering of the water molecules, or more likely restraining the activated protons of the metal-bound waters, into a fixed crystalline lattice. Ongoing 1H NMR studies of both the liquid hydrates and ethanol solutions of ZnCl2 give strong evidence of highly mobile protons in the ionic liquid state. Thus, while the packing of the molecular ions is analogous between the liquid and crystalline states resulting in a low enthalpy of activation, this kinetic study reveals that ordering of the waters (or water protons) of hydration apparently causes this crystal growth to be entropicly rate-limited. We will be able to test this hypothesis in future work by examining the H/D kinetic isotope effect, which based on this initial study is expected to be significant.

4. Materials and Methods

4.1. Materials

Zinc chloride was purchased from Aldrich. The material was sublimed under dynamic vacuum at 350 °C. Identity and purity of the starting material was confirmed to be the anhydrous δ-ZnCl2 by powder X-ray diffraction (Inel, Artenay, France), and DSC (TA Instruments, New Castle, DE, USA), m.p. 317 °C. Purified ZnCl2 was stored and utilized in a nitrogen-filled glove box. 18 MΩ water (H2O), was obtained from a Millipore Synergy (EMD Millipore, Billerica, MA, USA) ultra pure water filtration system. 99.99% D2O was used as purchased from Aldrich.

4.2. Time-Temperature Resolved Synchrotron X-ray Diffraction (TtXRD)

Synchrotron diffraction data were obtained on beam lines 11-ID-B (58.66 KeV, λ = 0.2114 Å, collimated beam 0.5 mm × 0.5 mm) at the Advanced Photon Source (APS), Argonne National Laboratory. Data were collected in a Debye-Scherer geometry at sampling rates of 1 Hz, using a 2048 × 2048 Perkin Elmer amorphous silicon detector (Perkin Elmer, Waltham, MA, USA) [18]. Samples were sealed into 0.7 mm I.D. fused silica capillaries (Charles Supper Co. Natick, MA, USA) and affixed to a single-axis goniometer head with epoxy. During crystallization experiments the samples were oscillated 1.2° in synchronization with the duration of X-ray exposure to illuminate a larger region of reciprocal space and minimize thermal gradients in the sample. The wavelength and detector alignment were calibrated to a CeO2 standard using fit2d [19] to correct all experimental data.
Data collection was initiated for at least 1–3 frames prior to quenching to a Tiso of between 193 and 248 K. Diffraction data was recorded at the isotherm until crystallization was complete. When a sample did not nucleate within 1 to 2 h, the reaction was aborted because of limited synchrotron time; which was the case for all but four samples, Tiso = 238, 243 and 244 K. The melt-quench-crystallization cycle was then repeated.
Temperature control of the crystallization reaction was afforded using an Oxford Cryostream cooling system with nitrogen as the flow gas, preset to Tiso, mounted just above the sample as seen in Figure 9. A blade air-stream control device was constructed (Figure 9), that directs a blade of air orthogonal to the cryostream gas flow so as to completely block the cold stream until the Tiso quench is required. When the blade air-stream control is on, the sample remains at ambient temperature. Shutting off the blade air-stream results in an instantaneous quench to the pre-set Tiso.

4.3. Individual Crystallite Image Analysis

Individual crystallite diffraction spots were identified in a summed image of the final two frames of the series of 2-D diffraction images from one Tiso = 243 K experiment (Figure 2a) through the use of a difference of Gaussians based algorithm for spot detection that provides the position and radius of located peaks. The specific implementation of the algorithm used may be found in the scikit-image Python image-processing package [20].
Each region in which a peak was located was integrated over the time series of the diffraction experiment to determine the increase in intensity for each peak as a function of time. A background correction was applied to each peak’s time series by integrating and subtracting a region of identical size at a distance of two peak radii away from each peak in order to account for both local and global detector variations. Oscillation of the sample on the goniometer at 1 Hz, which was not perfectly synchronized with the 1 Hz detector sampling frequency, yielded an oscillating signal. A Butterworth filter of order four with a cutoff frequency of half the sampling rate was applied to each time series in order to remove the oscillations. The Butterworth filter was selected as it had a smaller impact on the curve onset in simulated and experimental data when compared to a simple moving average, as well as its minimal introduction of rippling artifacts when compared to other digital filters. As observed in Figure 2b, the filtering successfully removed all except a low frequency aliasing, observed with approximately a 30 s frequency. A total of 18 peaks with final intensity counts of at least 200,000 were identified and were used for further analysis in this work. Data sets were normalized from 0 to 1, then fit with the KJMA expression (1) from 0% < α(t) < 30%.
All code used was written in Python with the scikit-image [20], NumPy [21], and SciPy [22] packages used for data analysis.

4.4. Time-Temperature Resolved Neutron Diffraction (TtND)

Neutron diffraction data were obtained using the NOMAD diffractometer at the Spallation Neutron Source, Oak Ridge National Laboratory [14], with a 9 mm diameter neutron beam. Samples (0.5 mL) of [Zn(OH2)6][ZnCl4] were sealed into 5 mm fused silica NMR tubes (4.2 mm I.D.) (NORELL). The samples were mounted on the linear sample changer, which was operated under an argon atmosphere to reduce background. The neutron event data were binned as a function of Q using a calibration derived from measurement of diamond powder, as described in reference [14] and normalized to the integrated proton charge accumulated on the neutron target. Measurements obtained from a 5.8 mm diameter vanadium rod were used for normalization of the data to a differential cross section. Data were collected for 5 s scans, which, with 6 seconds processing time, afforded 11 s time resolution to the neutron diffraction experiment. The incoherent contribution to the scattering cross section was approximated by a pseudo-Voigt function. Data were collected to Qmax = 50 Å−1. Transformation of the data to obtain S(Q) was performed using the NOMAD-SNS analysis suite of programs.
Quenching and isothermal temperature control was achieved using a Cobra Cryostream (Oxford) with 10 L·s−1 argon as the flow gas. The cryostream was cooled to the desired Tiso. The reaction commenced when the sample, maintained at room temperature at least 5 cm from the coldstream, was simultaneously translated at a rate of 1 mm·s−1 into the neutron beam and coldstream. Diffraction data was recorded at the isotherm until crystallization was complete. When a sample did not nucleate within 1 h, the reaction was aborted because of limited beam time. The melt quench crystallization cycle was then repeated.

4.5. Isothermal Crystallization by DSC

DSC experiments were conducted using a TA Instruments Q2000 DSC instrument (TA Instruments, New Castle, DE, USA). Samples of [Zn(OH2)6][ZnCl4] were sealed in high pressure stainless steel DSC pans with gold foil seals (35–46 mg) (PerkinElmer product no. B0182901), or in 0.8 mm I.D. Pyrex capillaries (6.3 mg) (Charles Supper Co. Natick, MA). Capillaries (sample and reference blank) were placed into aluminum stirrups machined to cradle a 1 mm × 10 mm capillary on the DSC stage. Each sample was melt-crystal-melt cycled by quenching to 243 K for 10 min then reheating at 1 K/min to 298 K where it was equilibrated for 10 min prior to initiating the quench to the experimental isotherm. Following this pre-treatment each sample was quench-equilibrated to the reaction Tiso; the DSC quench profile cools about 70% of the ΔT at approximately 40 K/min, then more slowly approaches Tiso so as not to overshoot the isotherm temperature. Heat flow data were measured at the isotherm until crystallization was complete, typically less than 60 min. The timescale of the raw heat-flow data was adjusted such that the quench initiation for each experiment occurred at t = 0 s. The instrumental quench response (IQR), which must be subtracted from the raw signal to obtain the crystallization heat flow, was obtained from isotherms for which crystallization is well separated from the IQR, and then if necessary fit to other experiments with the same sample for which the IQR and crystallization response showed some overlap.

4.6. Video Imaging of Crystallization

A homemade cold stream was constructed by creating a 3” diameter coil with 20’ of ¼” copper tubing that is immersed into a Dewar of liquid nitrogen. A stream of dry nitrogen, approximately 10 L/min flow rate, was passed through this coil then through a 12” × ¾” copper pipe with baffles. A stable temperature of 238 ± 0.5 K at the top of the coldstream orifice was achieved. A 1 mL sample of the R = 3 zinc chloride hydrate was sealed in a 0.5 mm Pyrex NMR tube that was placed directly above the cold stream. A thermocouple recorded the temperature at both the bottom and top of the sample, for which a 12 K temperature gradient was observed.
Video of the crystallization reaction was captured using a Panasonic HC-V700 Full HD Camcorder (Panasonic, Kadoma, Osaka, JPN), shooting 1920 × 1080 pixel resolution at 60 frames per second. Every third frame, i.e., 1/20th of a second was extracted and the linear growth rates of individual crystallites were measured using Fiji image processing software [23].

5. Conclusions

This study of the rate of crystallization of the congruently melting R = 3 hydrate of zinc chloride demonstrates the power, as well as challenges of condensed matter kinetic studies to reveal important features of reaction mechanisms. Time resolved x-ray and neutron diffraction are shown to uniquely identify the concurrent loss of the liquid reactant and formation of the crystalline product, providing strong evidence that no intermediates are formed along the crystallization reaction path. However, comparison of the rate constants obtained from basic KJMA analysis of data obtained using multiple techniques, reveals that it is critical to reintroduce the size of the sample being measured into the rate expression in order to determine intrinsic, material specific rate constants. This can be accomplished using the M-KJMA model, which in this work is shown to yield a set of temperature dependent rate constants, the velocity of the phase boundary, vpb(T), that are consistent across the diverse set of measurement techniques, including TtXRD, TtND, DSC and direct optical measurements.
The temperature dependence of the vpb is then well fit using transition zone theory to extract enthalpic and entropic activation parameters. These reveal that the common structural organization of the molecular ions into a CsCl-type lattice in both the liquid and crystalline states results in a very low enthalpy of activation. By contrast, the loss of configurational microstates required to localize the waters (or more likely protons) of hydration upon crystal lattice formation results in a large and negative entropy of activation.

Supplementary Materials

The following are available online at https://www.mdpi.com/2073-4352/7/1/11/s1: Table S1: M-KJMA parameters for all methods; Table S2: Raw data for single peak analysis and solved KJMA parameters.

Acknowledgments

Synchrotron experiments were conducted at the Advanced Photon Source, Argonne National Laboratory, supported by the Office of Science User Facilities operated for the DOE, Office of Science, under Contract DE-AC02-06CH11357 with support from beamline scientists Peter Chupas and Karina Chapman. Neutron diffraction experiments were conducted at the Spallation Neutron Source, sponsored by the Scientific User Facilities Division, Office of Basic Energy Sciences, U.S. Department of Energy (DOE), with assistance from Jöerg Neuefeind, and Joan Siewenie.

Author Contributions

Berkley G. Hillis and Bradley P. Losey collected and analyzed the synchrotron and neutron diffraction data. Berkley G. Hillis conducted the DSC study. James Weng developed analysis algorithms and with Berkley G. Hillis analyzed the single crystallite kinetics from 2-D synchrotron diffraction images. Berkley G. Hillis, Bradley P. Losey and Nezar Ghaleb collected and analyzed the crystallization videos. James Weng designed and constructed the blade air-stream to control quenching with a cryostream. Feier Hou assisted with fitting the data to TZT. James D. Martin conceived of and directed the project, and wrote the manuscript.

Conflicts of Interest

The authors declare no conflict of interest.

References

  1. Maruyama, K.; Kagi, H.; Inoue, T.; Ohfuji, H.; Yoshino, T. In Situ Observation of Pressure-induced Crystallization from Amorphous Calcium Carbonate by Time-resolved X-ray Diffraction. Chem. Lett. 2015, 44, 434–436. [Google Scholar] [CrossRef]
  2. Dill, E.D.; Josey, A.A.; Folmer, J.C.W.; Hou, F.; Martin, J.D. Experimental Determination of the Crystallization Phase-Boundary Velocity in the Halozeotype CZX-1. Chem. Mater. 2013, 25, 3932–3940. [Google Scholar] [CrossRef]
  3. Kolmogorov, A.N. Statistical theory of crystallization of metals. Acad. Sci. Urss. Sci. 1937, 3, 355–359. [Google Scholar]
  4. Johnson, W.A.; Mehl, R.F. Reaction kinetics in processes of nucleation and growth. Trans. Am. Inst. Min. Metall. Eng. 1939, 135, 416–442. [Google Scholar]
  5. Avrami, M. Kinetics of Phase Change. I General Theory . J. Chem. Phys. 1939, 7, 1103–1112. [Google Scholar] [CrossRef]
  6. Avrami, M. Kinetics of Phase Change. II: Transformation-Time Relations for Random Distribution of Nuclei. J. Chem. Phys. 1940, 8, 212–224. [Google Scholar] [CrossRef]
  7. Avrami, M. Granulation, Phase Change, and Microscructure Kinetics of Phase Change III. J. Chem. Phys. 1941, 9, 177–184. [Google Scholar] [CrossRef]
  8. Wilcox, R.J.; Losey, B.P.; Folmer, J.C.W.; Martin, J.D.; Zeller, M.; Sommer, R. Crystalline and Liquid Structure of Zinc Chloride Tri-hydrate: A unique ionic liquid. Inorg. Chem. 2015, 54, 1109–1119. [Google Scholar] [CrossRef] [PubMed]
  9. Dill, E.D.; Folmer, J.C.W.; Martin, J.D. Simulating crystallization to elucidate the parameter space in the KJMA condensed phase transformation model. Chem. Mater. 2013, 25, 3941–3951. [Google Scholar] [CrossRef]
  10. Hou, F.; Martin, J.D.; Dill, E.D.; Folmer, J.C.; Josey, A.A. Transition Zone Theory of Crystal Growth and Viscosity. Chem. Mater. 2015, 27, 3526–3532. [Google Scholar] [CrossRef]
  11. Wilson, H.A. On the Velocity of Solidification and Viscosity of Super-cooled Liquids. Philos. Mag. 1900, 50, 238–250. [Google Scholar] [CrossRef]
  12. Henry, E.R.; Hofrichter, J. Singular Value Decomposition: Application to Analysis of Experimental Data. In Methods in Enzymology; Ludwig Brand, M.L.J., Ed.; Academic Press: San Diego, CA, USA, 1992; Volume 210, pp. 129–192. [Google Scholar]
  13. Dill, E.D.; Folmer, J.C.W.; Martin, J.D. RamDog: A Graphical User Interface Program to Interactively Analyze 2D Diffraction Images. ZENDO, 2014. Available online: https://zenodo.org/record/12268#.WGcPf3u3ySI (accessed on 30 December 2016). [CrossRef]
  14. Neuefeind, J.; Feygenson, M.; Carruth, J.; Hoffmann, R.; Chipley, K. The Nanoscale Ordered Materials Diffractometer NOMAD at the Spallation Neutron Source SNS. Nucl. Instrum. Methods Phys. Res. Sect. B 2012, 287, 68–78. [Google Scholar] [CrossRef]
  15. Lan, S.; Wei, X.; Zhou, J.; Lu, Z.P.; Wu, X.; Feygenson, M.; Neuefeind, J.; Wang, X.L. In-situ study of crystallization kinetics in ternary bulk metallic glass alloys with different glass forming abilities. Appl. Phys. Lett. 2014, 105, 201906. [Google Scholar] [CrossRef]
  16. Adam, G.; Gibbs, J.H. On Temperature Dependence of Cooperative Relaxation Properties in Glass-Forming Liquids. J. Chem. Phys. 1965, 43, 139–146. [Google Scholar] [CrossRef]
  17. Kauzmann, W. The Nature of the Glassy State and the Behavior of Liquids at Low Temperatures. Chem. Rev. 1948, 43, 219–256. [Google Scholar] [CrossRef]
  18. Chupas, P.J.; Chapman, K.W.; Lee, P.L. Applications of an amorphous silicon-based area detector for high-resolution, high-sensitivity and fast time-resolved pair distribution function measurements. J. Appl. Crystallogr. 2007, 40, 463–470. [Google Scholar] [CrossRef]
  19. Hammersley, A.P.; Svensson, S.O.; Hanfland, M.; Fitch, A.N.; Hausermann, D. Two-Dimensional Detector Software: From Real Detector to Idealized Image or Two-Theta Scan. High Press. Res. 1996, 14, 235–248. [Google Scholar] [CrossRef]
  20. Van der Walt, S.; Schönberger, J.L.; Nunez-Iglesias, J.; Boulogne, F.; Warner, J.D.; Yager, N.; Gouillart, E.; Yu, T. The Scikit-Image Contributors. Scikit-Image: Image processing in Python. PeerJ 2014, 2, e453. [Google Scholar] [CrossRef] [PubMed]
  21. Van der Walt, A.; Colbert, S.C.; Varoquaux, G. The NumPy Array: A Structure for Efficient Numerical Computation. Comput. Sci. Eng. 2011, 13, 22–30. [Google Scholar] [CrossRef]
  22. Jones, E.; Oliphant, E.; Peterson, P. SciPy: Open Source Scientific Tools for Python. 2001. Available online: http://www.scipy.org/ (accessed on 29 August 2016).
  23. Schindelin, J.; Arganda-Carreras, I.; Frise, E.; Kaynig, V.; Longair, M.; Pietzsch, T.; Preibisch, S.; Rueden, C.; Saalfeld, S.; Schmid, B.; et al. Fiji: An open-source platform for biological-image analysis. Nat. Methods 2012, 9, 676–682. [Google Scholar] [CrossRef] [PubMed]
Figure 1. Bulk sample analysis of TtXRD measurement of the crystallization of [Zn(OH2)6][ZnCl4] for a Tiso = 238 K experiment. (a) Stack plot of 1-D diffraction patterns (3 s intervals plotted); (b) Time-independent basis vectors corresponding to the liquid (red) and crystalline (cyan) diffraction patterns; (c) Time-dependent basis vectors demonstrating the disappearance of liquid diffraction (red) and appearance of crystalline (cyan) diffraction, fit to the Kolmogorov, Johnson, Mehl, Avrami (KJMA) model (black line).
Crystals 07 00011 g001
Figure 2. Analysis of individual crystallite TtXRD data for a Tiso = 243 K experiment. (a) 2-D diffraction image; (b) Time dependent evolution of the intensity of representative spots with intensity above a threshold of 200,000 counts fit to their corresponding KJMA functions. The periodic spikes in intensity, even after the sample is fully crystallized, is an aliasing artifact resulting from the shutter and sample oscillation frequency being slightly out of synchronization.
Crystals 07 00011 g002
Figure 3. TtND of the crystallization of [Zn(OH2)6][ZnCl4] for a Tiso = 238 K experiment. (a) Stack plot of the time dependent diffraction patterns (22 s intervals); (b) Time-independent basis vectors corresponding to the liquid (red) and crystalline (cyan) diffraction patterns; (c) Time-dependent basis vectors demonstrating the disappearance of liquid diffraction (red) and appearance of crystalline (cyan) diffraction, fit to the KJMA model (black line).
Crystals 07 00011 g003
Figure 4. Crystallization by differential scanning calorimetry. Heat flow curves for (a) a capillary sample at Tiso = 243 K (red) and (b) a stainless steel pan sample at Tiso = 248 K (cyan). The instrumental quench portion of the signal is shaded. (c,d) Normalized, integrated heat-flow of the crystallization reactions, each fit to the KJMA model (black line).
Crystals 07 00011 g004
Figure 5. Fit KJMA exponents n from all differential scanning calorimetry (DSC) reactions (orange capillary and green pan) superimposed on top of the fixed volume simulation Figure 6a from reference [9] to estimate the actual sample d/h anisotropy. Orange dashed line represents the apparent aspect ratio for the capillary samples.
Crystals 07 00011 g005
Figure 6. Time-lapse video images (15 s intervals) of a crystallization reaction in 5 mm Pyrex NMR tubes. The temperature gradient across the sample results in Tiso = 241 K at the base and 253 K at the top of the sample.
Crystals 07 00011 g006
Figure 7. Temperature dependence of the KJMA rate constants, kA, for the crystallization of the R = 3 hydrate of zinc chloride. DSC experiments are represented as the red squares (pans) and diamonds (capillaries), TtXRD experiments as blue triangles (bulk analysis) and blue diamonds (single diffraction spot analysis), and TtND as green circles.
Crystals 07 00011 g007
Figure 8. Temperature dependence of the velocity of the phase boundary, vpb(T), for the crystallization of the R = 3 hydrate of zinc chloride. DSC experiments are represented as the red squares (pans) and diamonds (capillaries), TtXRD experiments as blue triangles (bulk analysis), and TtND as green circles, compared with physically measured vpb from video images (cyan diamonds). The solid line represents the best fit to the maximum vpb’s observed for each Tiso, and dashed line is fit to all data, based on transition zone theory; the neutron D2O data are excluded from the fits because of the likely KIE.
Crystals 07 00011 g008
Figure 9. Two images of the TtXRD experimental set-up demonstrating the blade air-stream control for cryostream quenching.
Crystals 07 00011 g009

