
In situ Synchrotron X-ray Thermodiffraction of Boranes


Abstract
:1. Introduction
2. Results
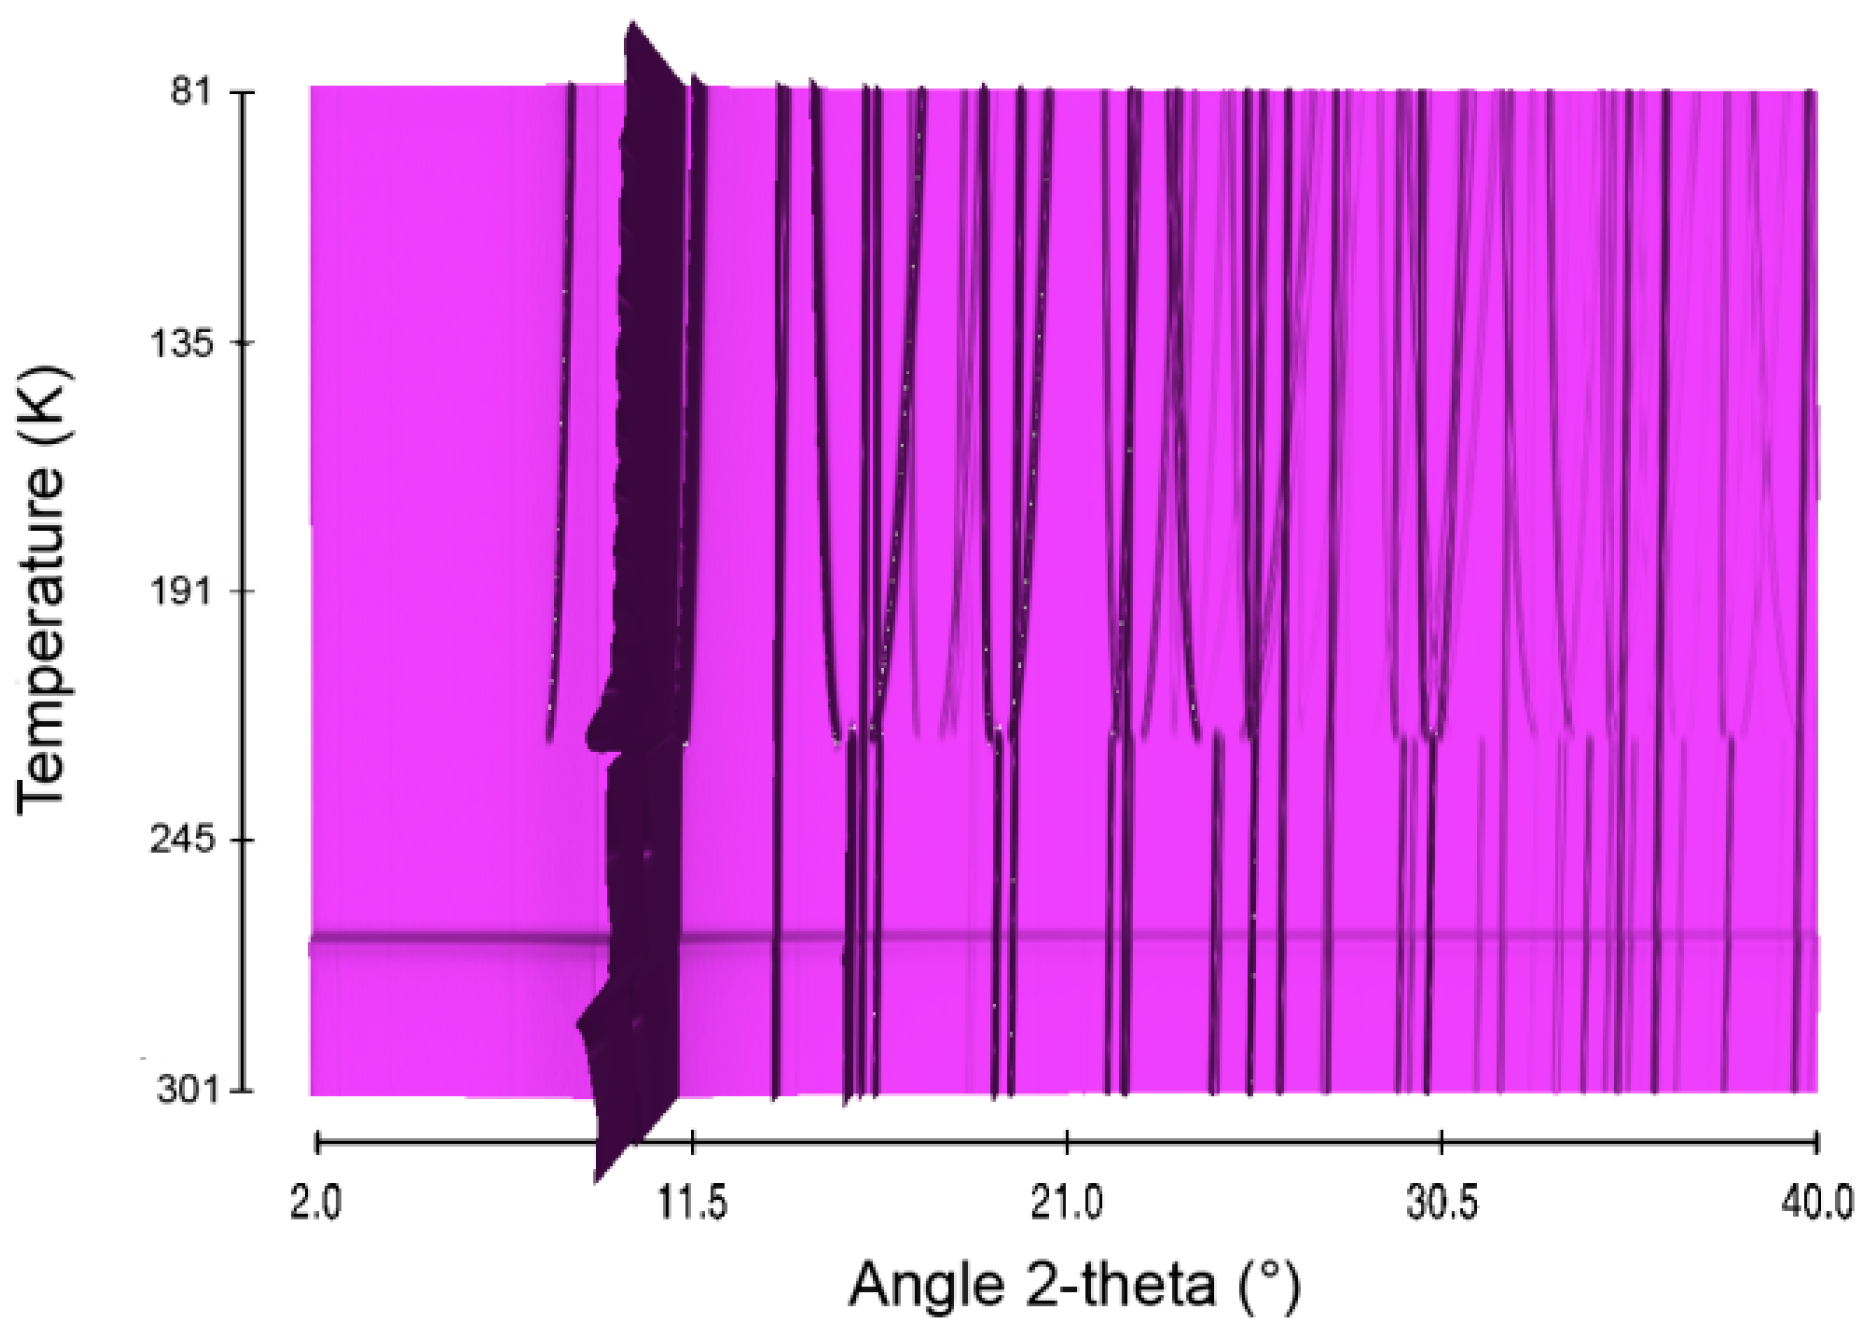
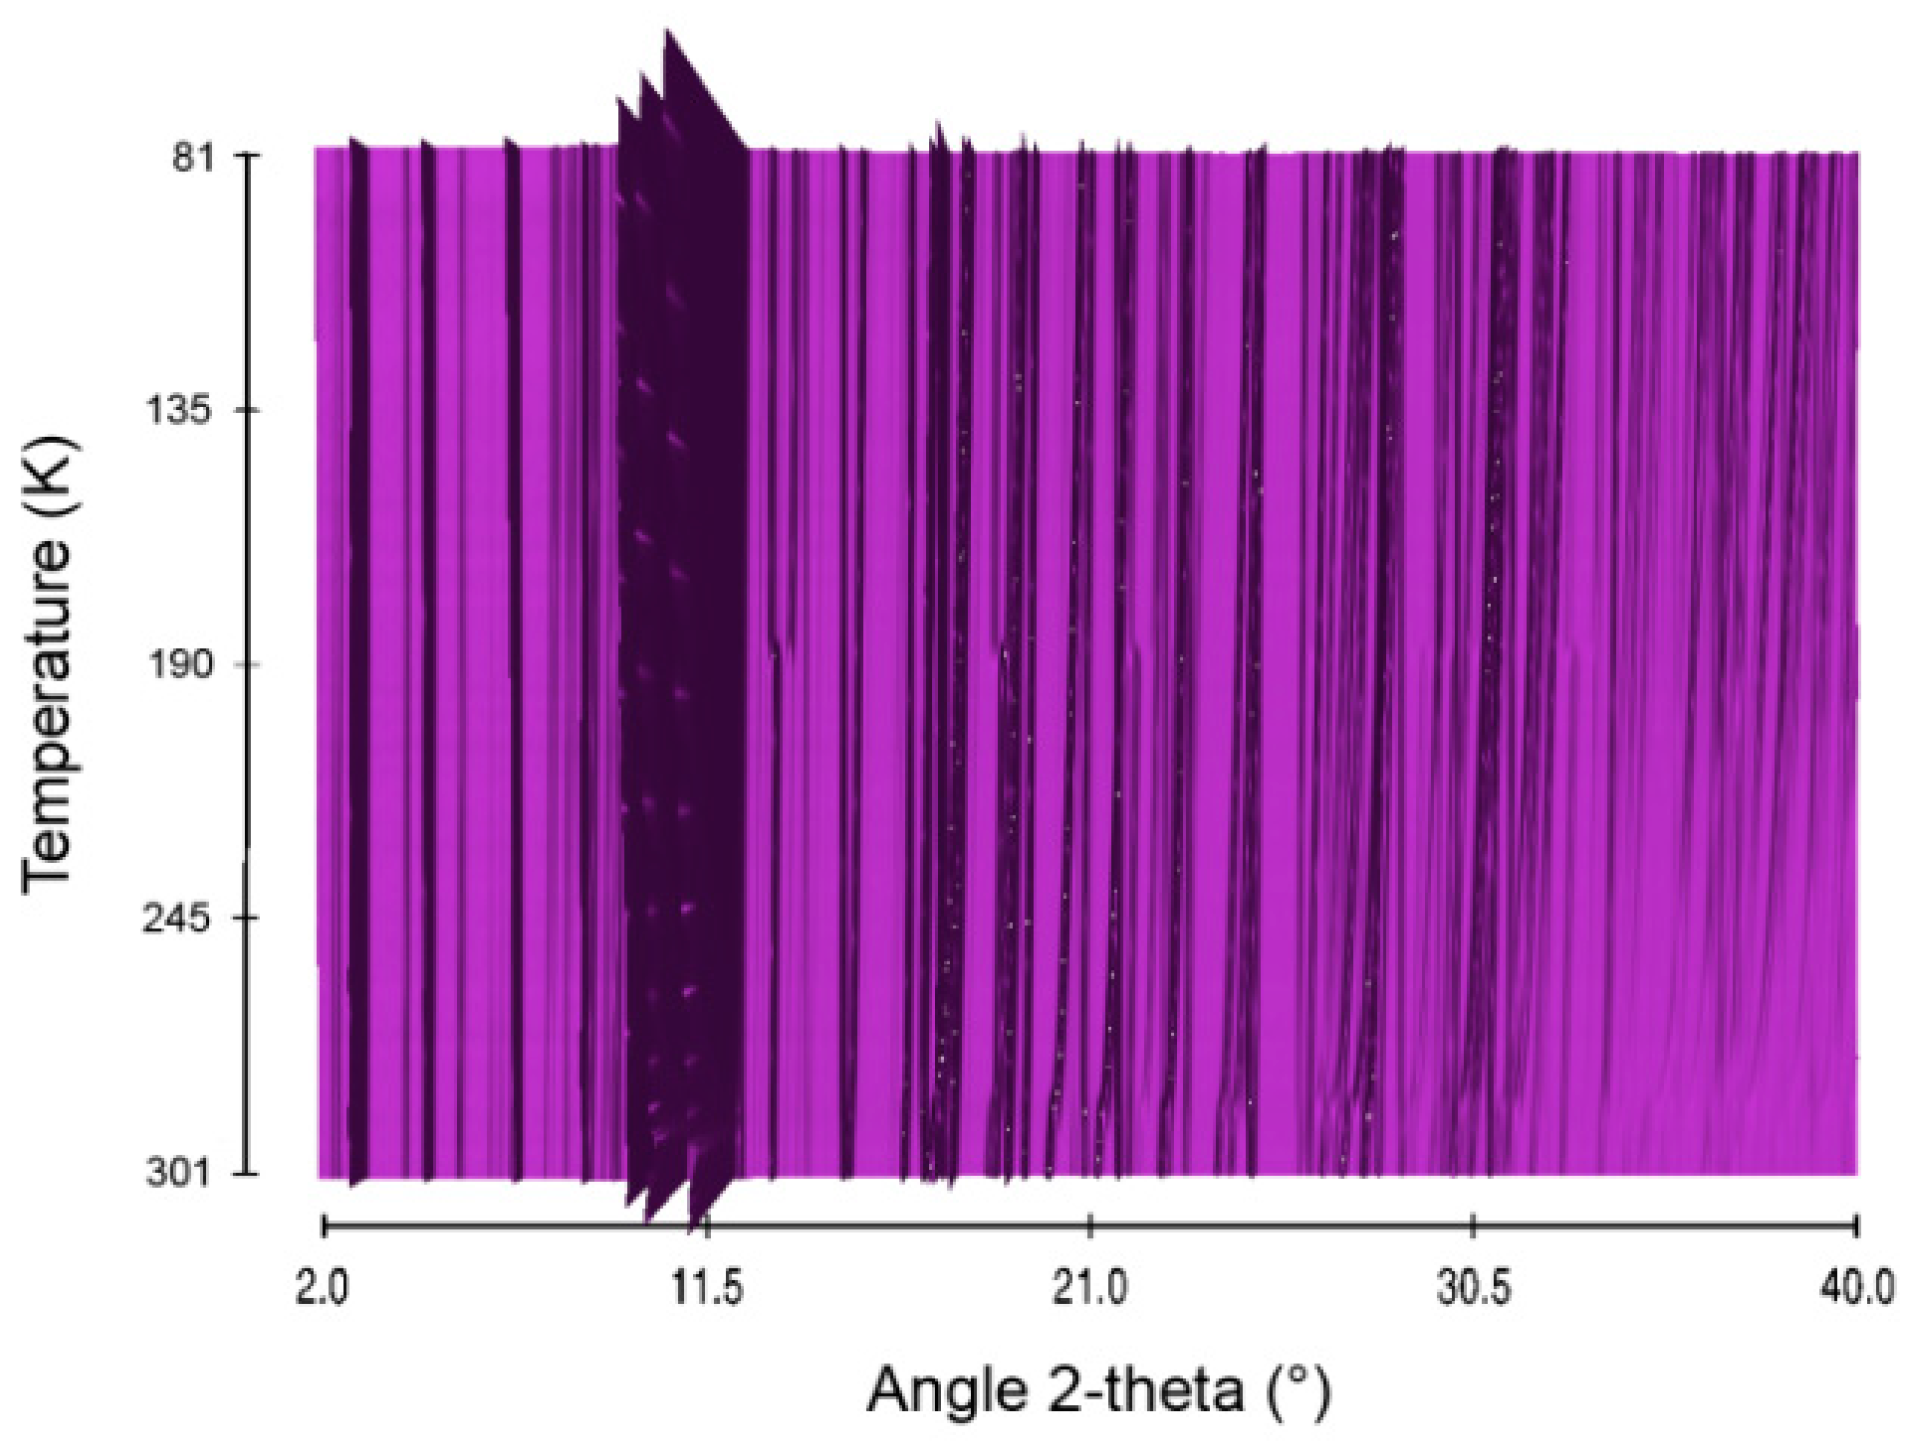
2.1. Ammonia Borane AB


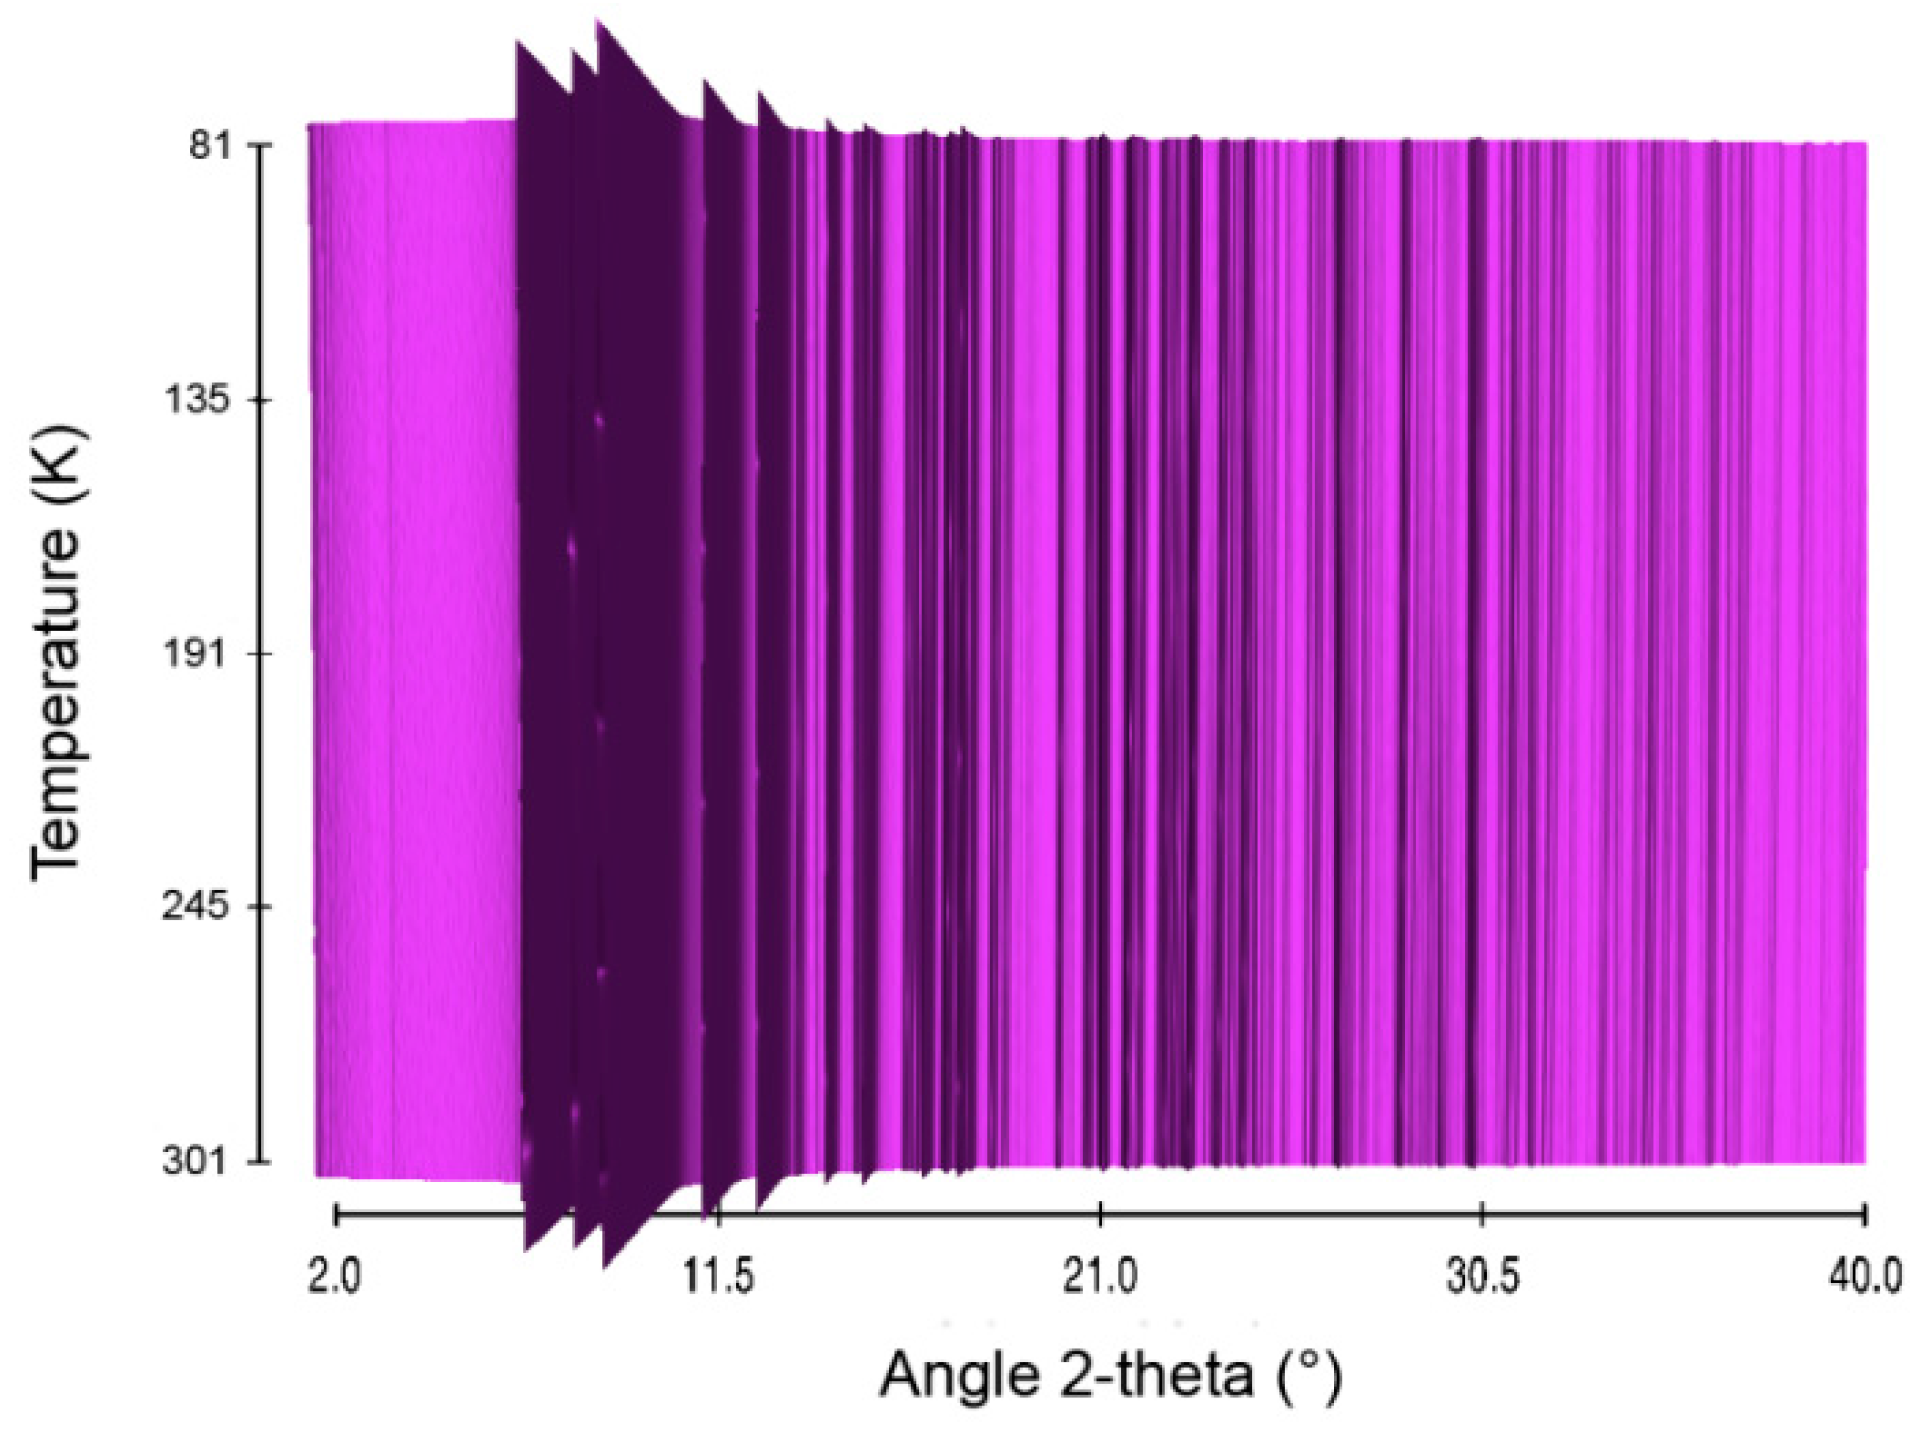
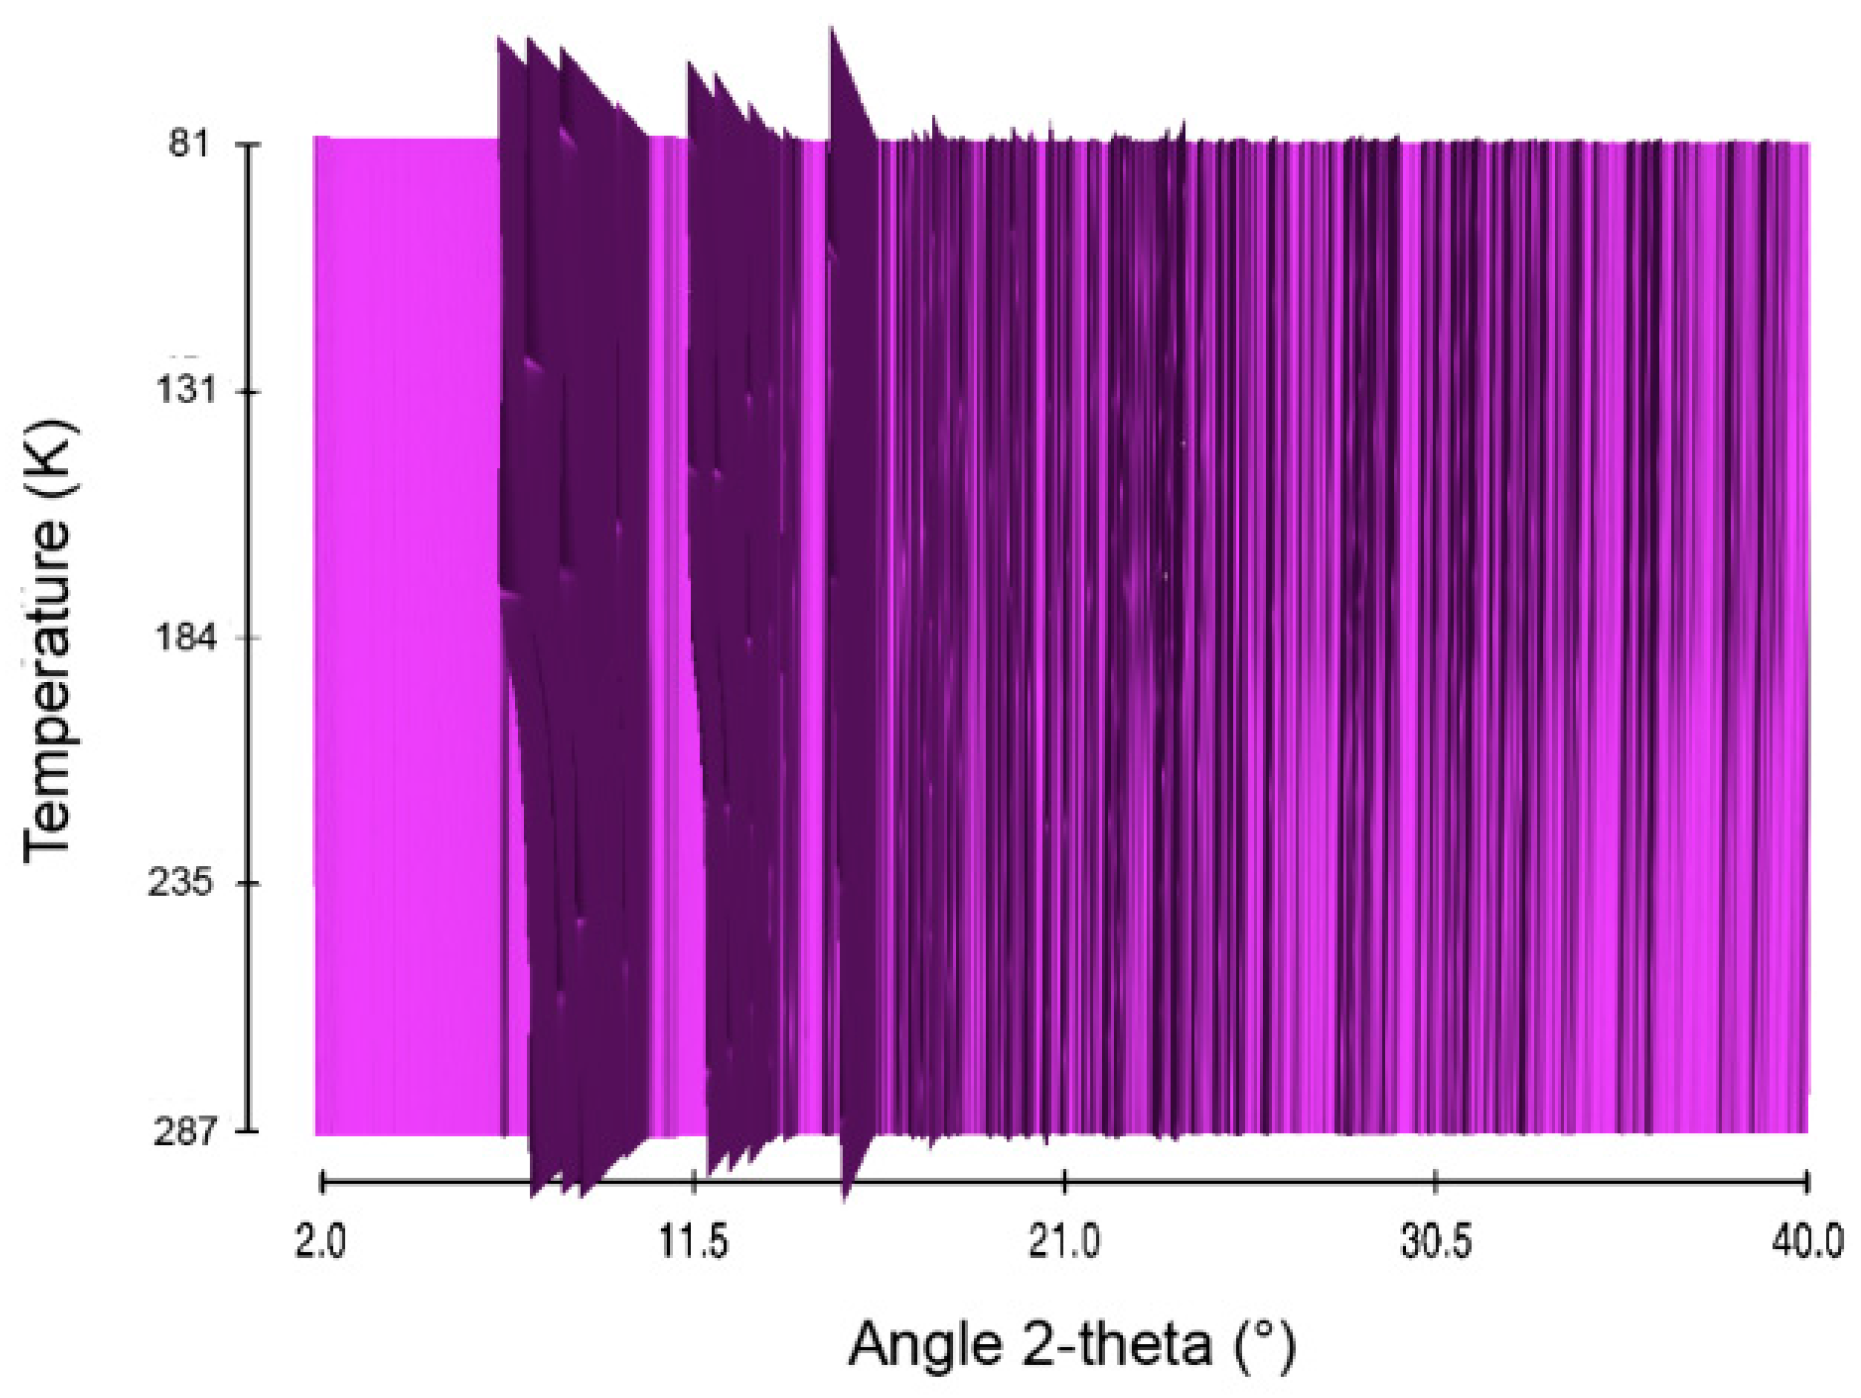
| Borane | Phase | s.g. | T (K) | Z | a (Å) | b (Å) | c (Å) | β (°) | V (Å) |
|---|---|---|---|---|---|---|---|---|---|
| AB | Orthorhombic | Pmn21 | 81 | 2 | 5.5437(2) | 4.6958(2) | 5.0190(2) | 130.5(1) | |
| Tetragonal | I4mm | 296 | 2 | 5.2545(2) | 5.0444(1) | 139.3(1) | |||
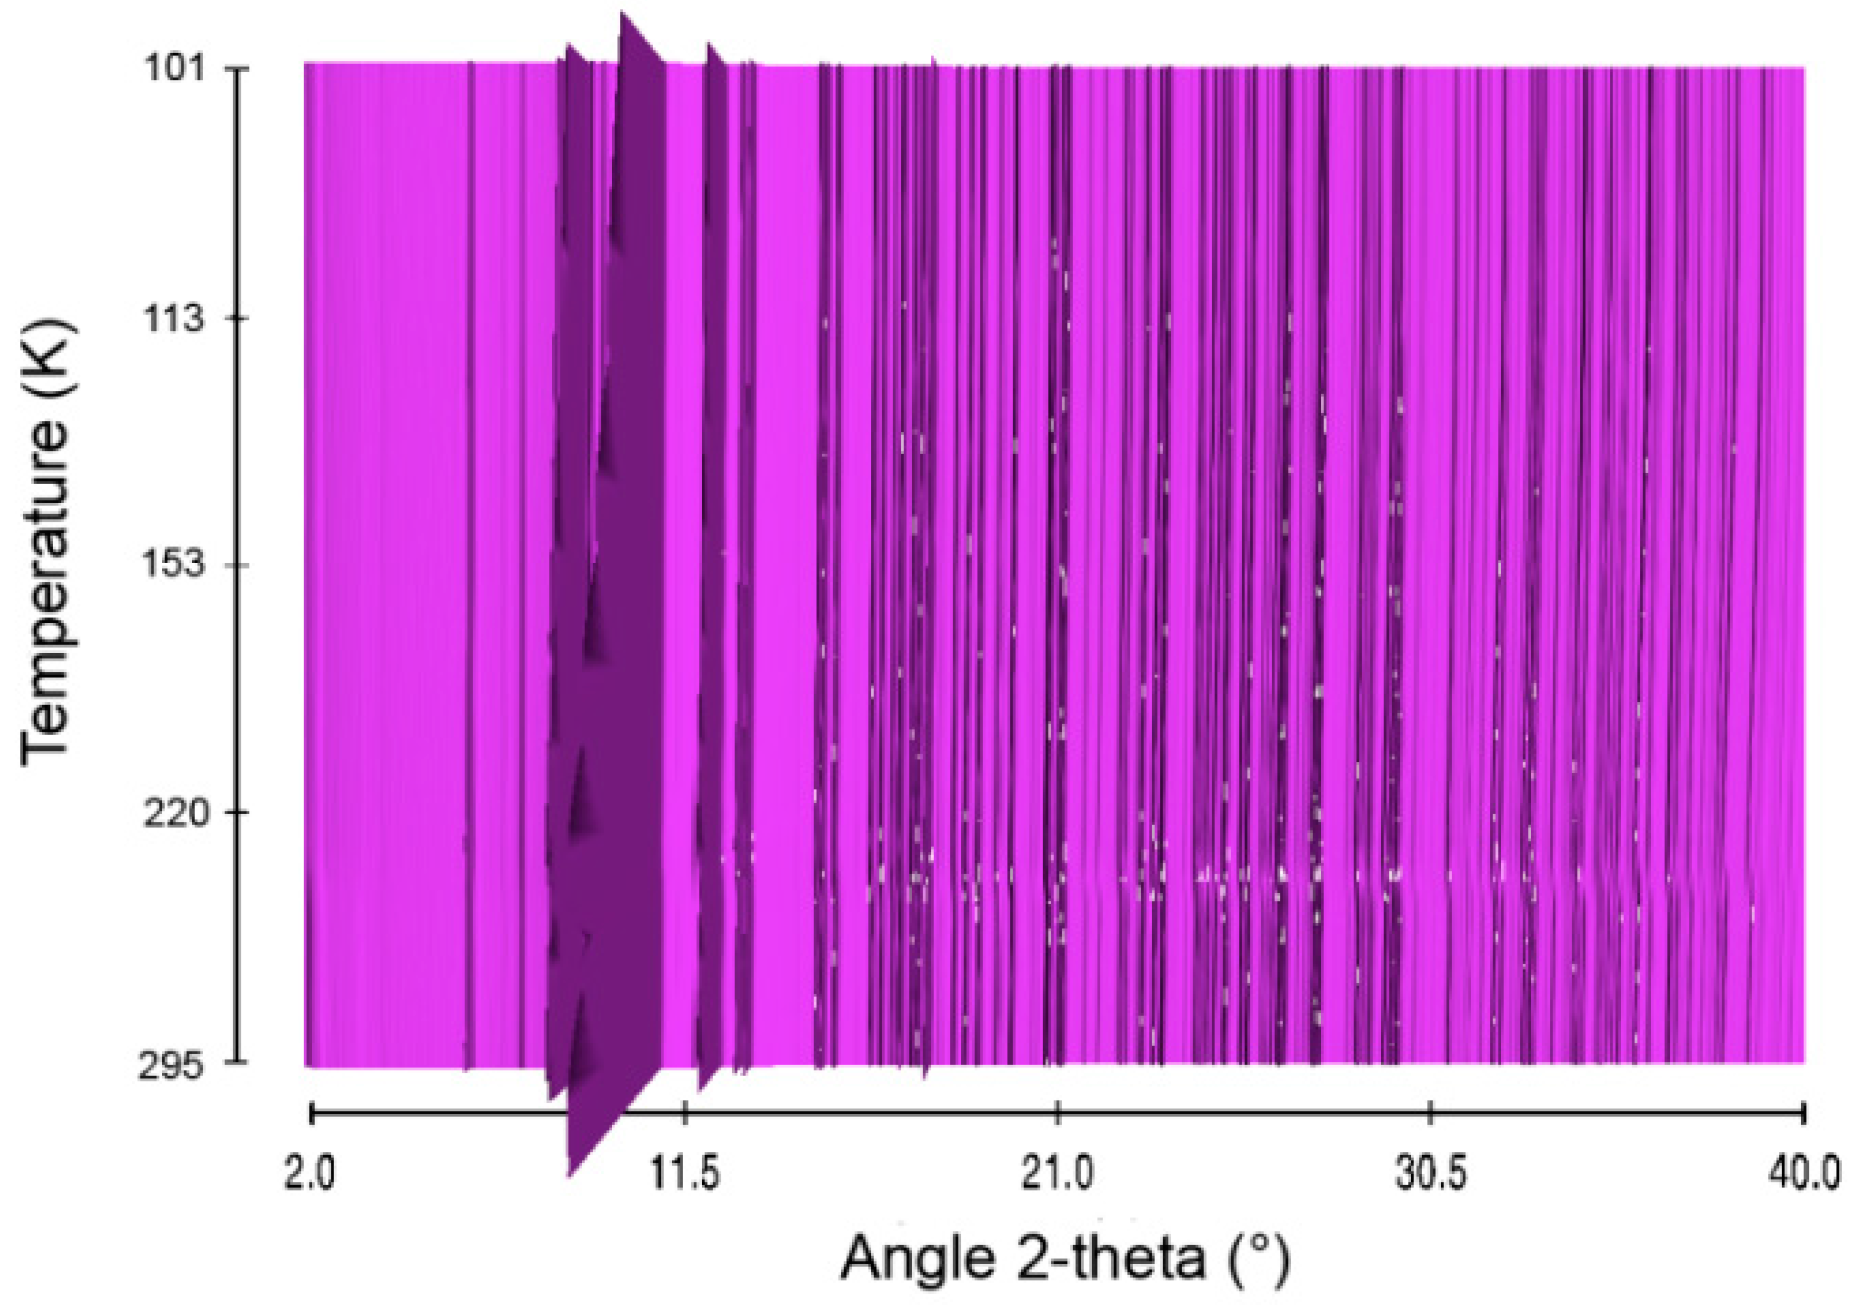
| HB | Orthorhombic | Pbcn | 101 | 8 | 12.9604(2) | 5.0632(2) | 9.4917(2) | 622.8(1) | |
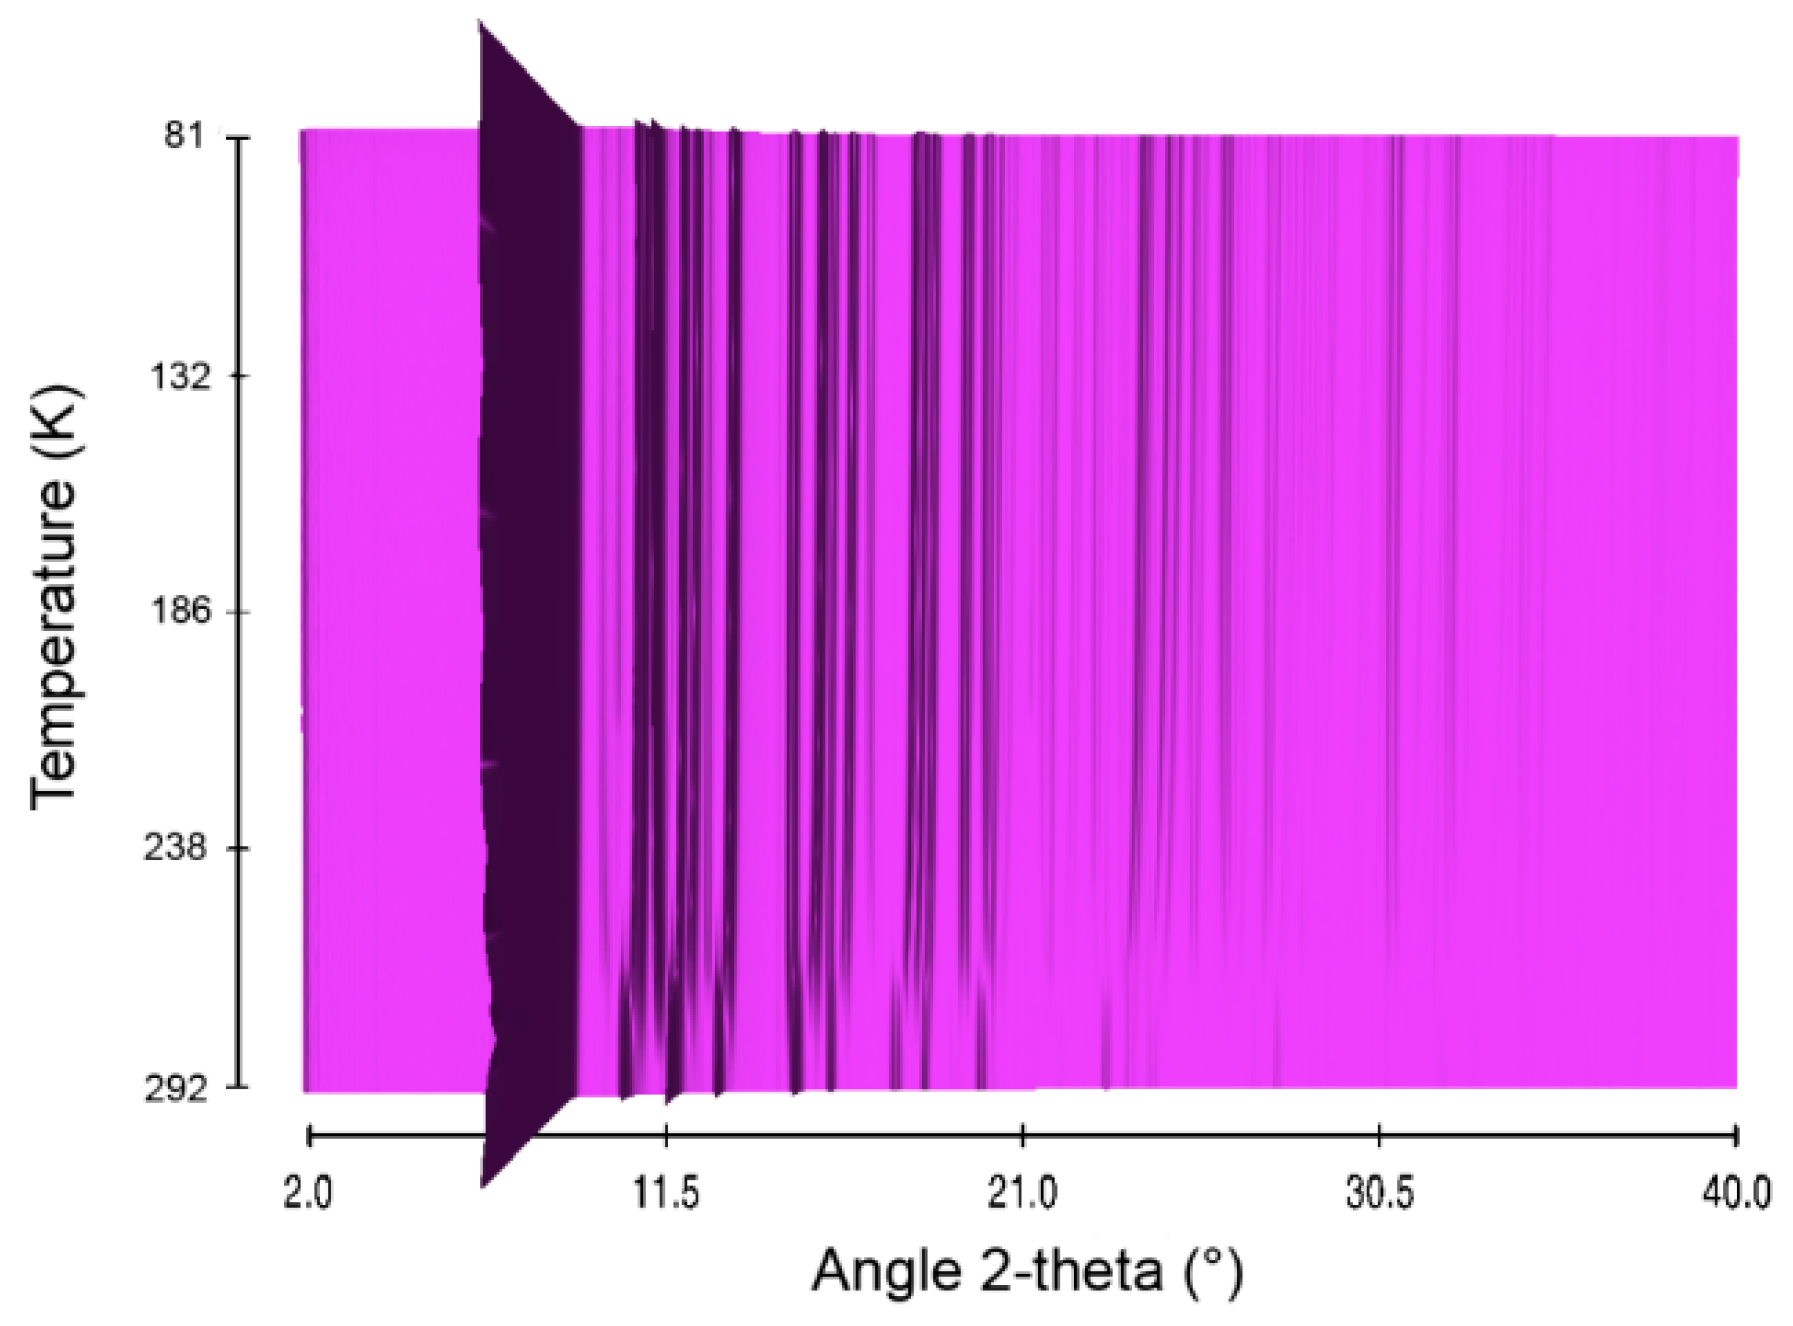
| HBB | Orthorhombic | Pbca | 81 | 4 | 7.2654(4) | 7.3505(4) | 8.1109(5) | 433.2(1) | |
| Orthorhombic | Pbca | 296 | 4 | 7.6491(8) | 7.6909(9) | 7.6728(1) | 451.4(1) | ||
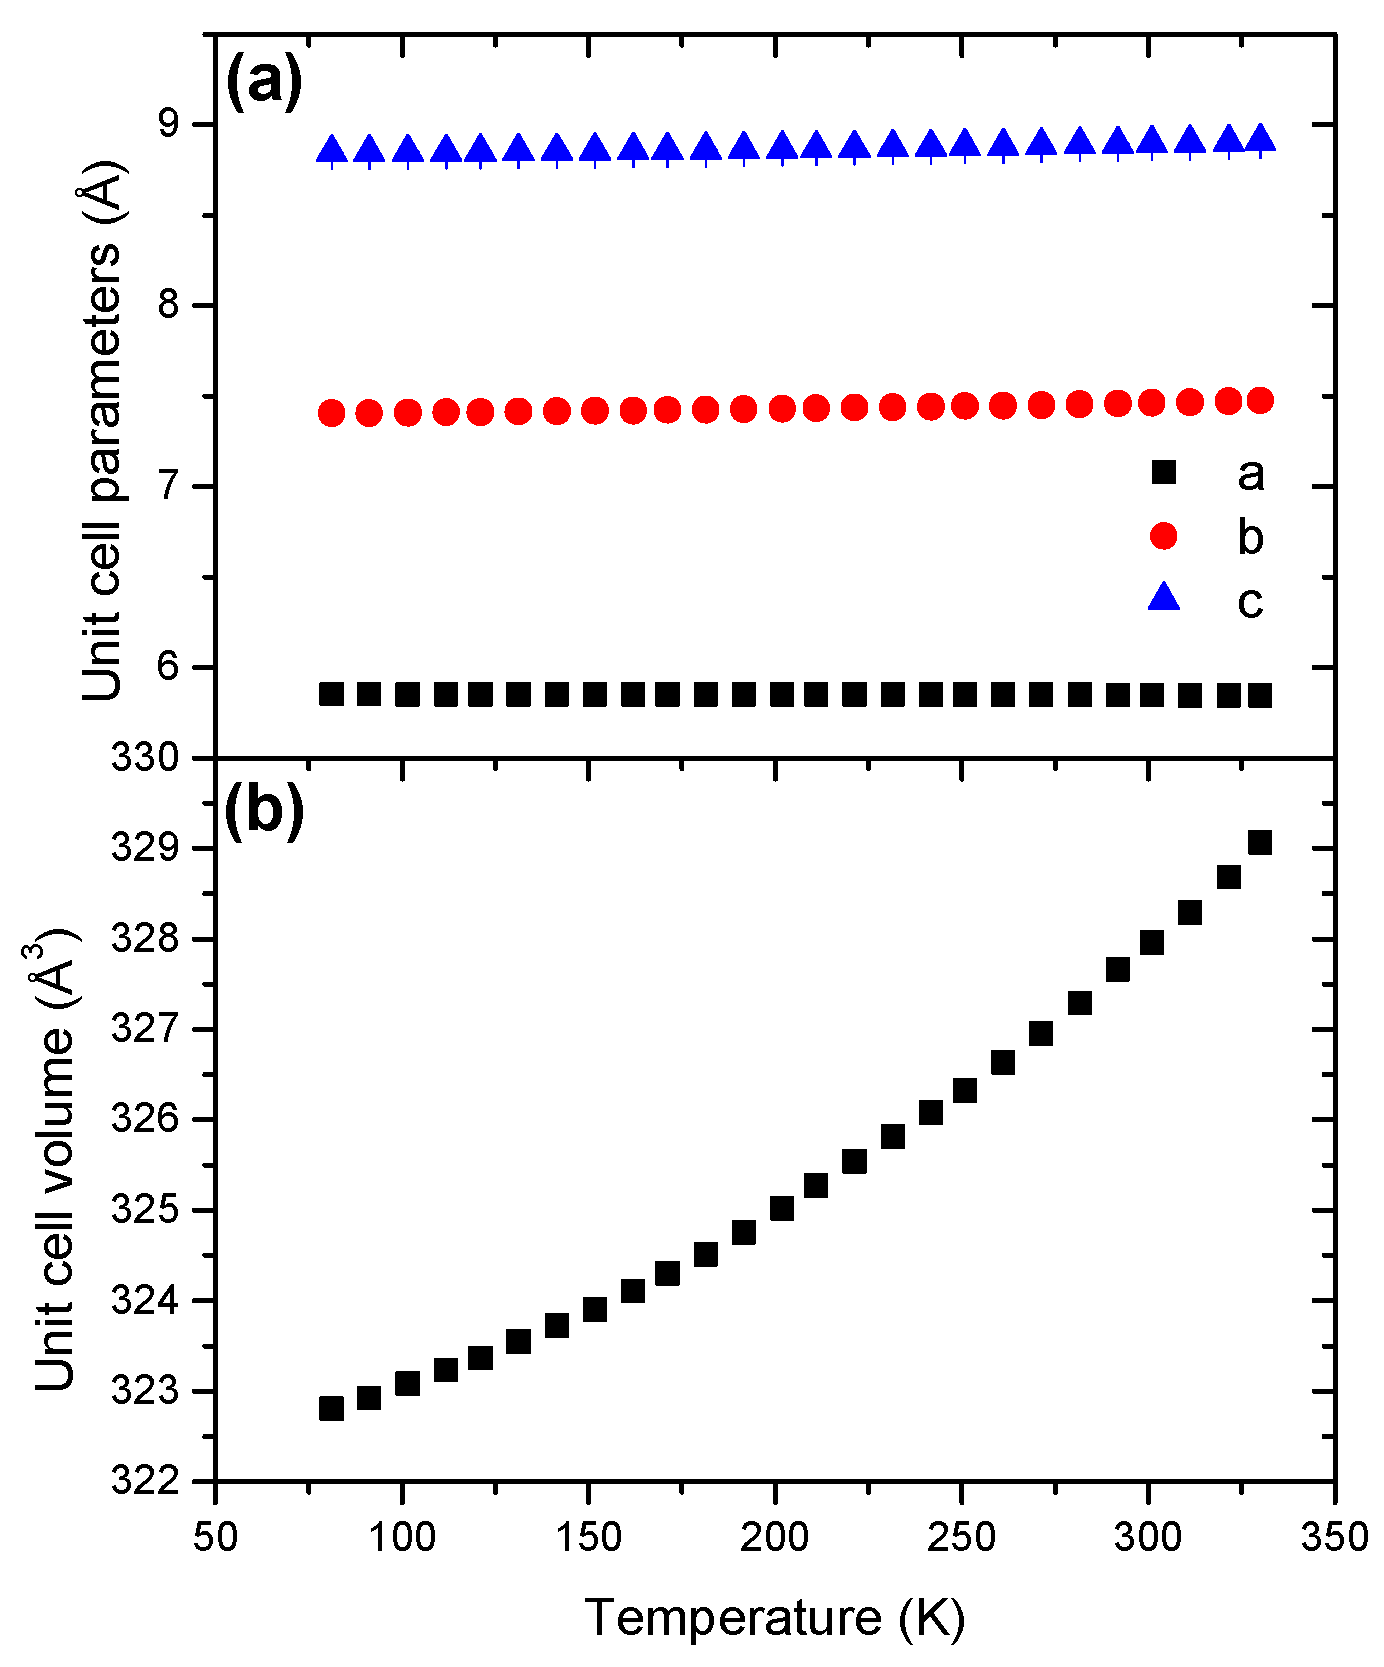
| LiHB | Monoclinic | P21/c | 81 | 4 | 5.8528(3) | 7.4060(4) | 8.8450(5) | 122.65(1) | 322.8(2) |
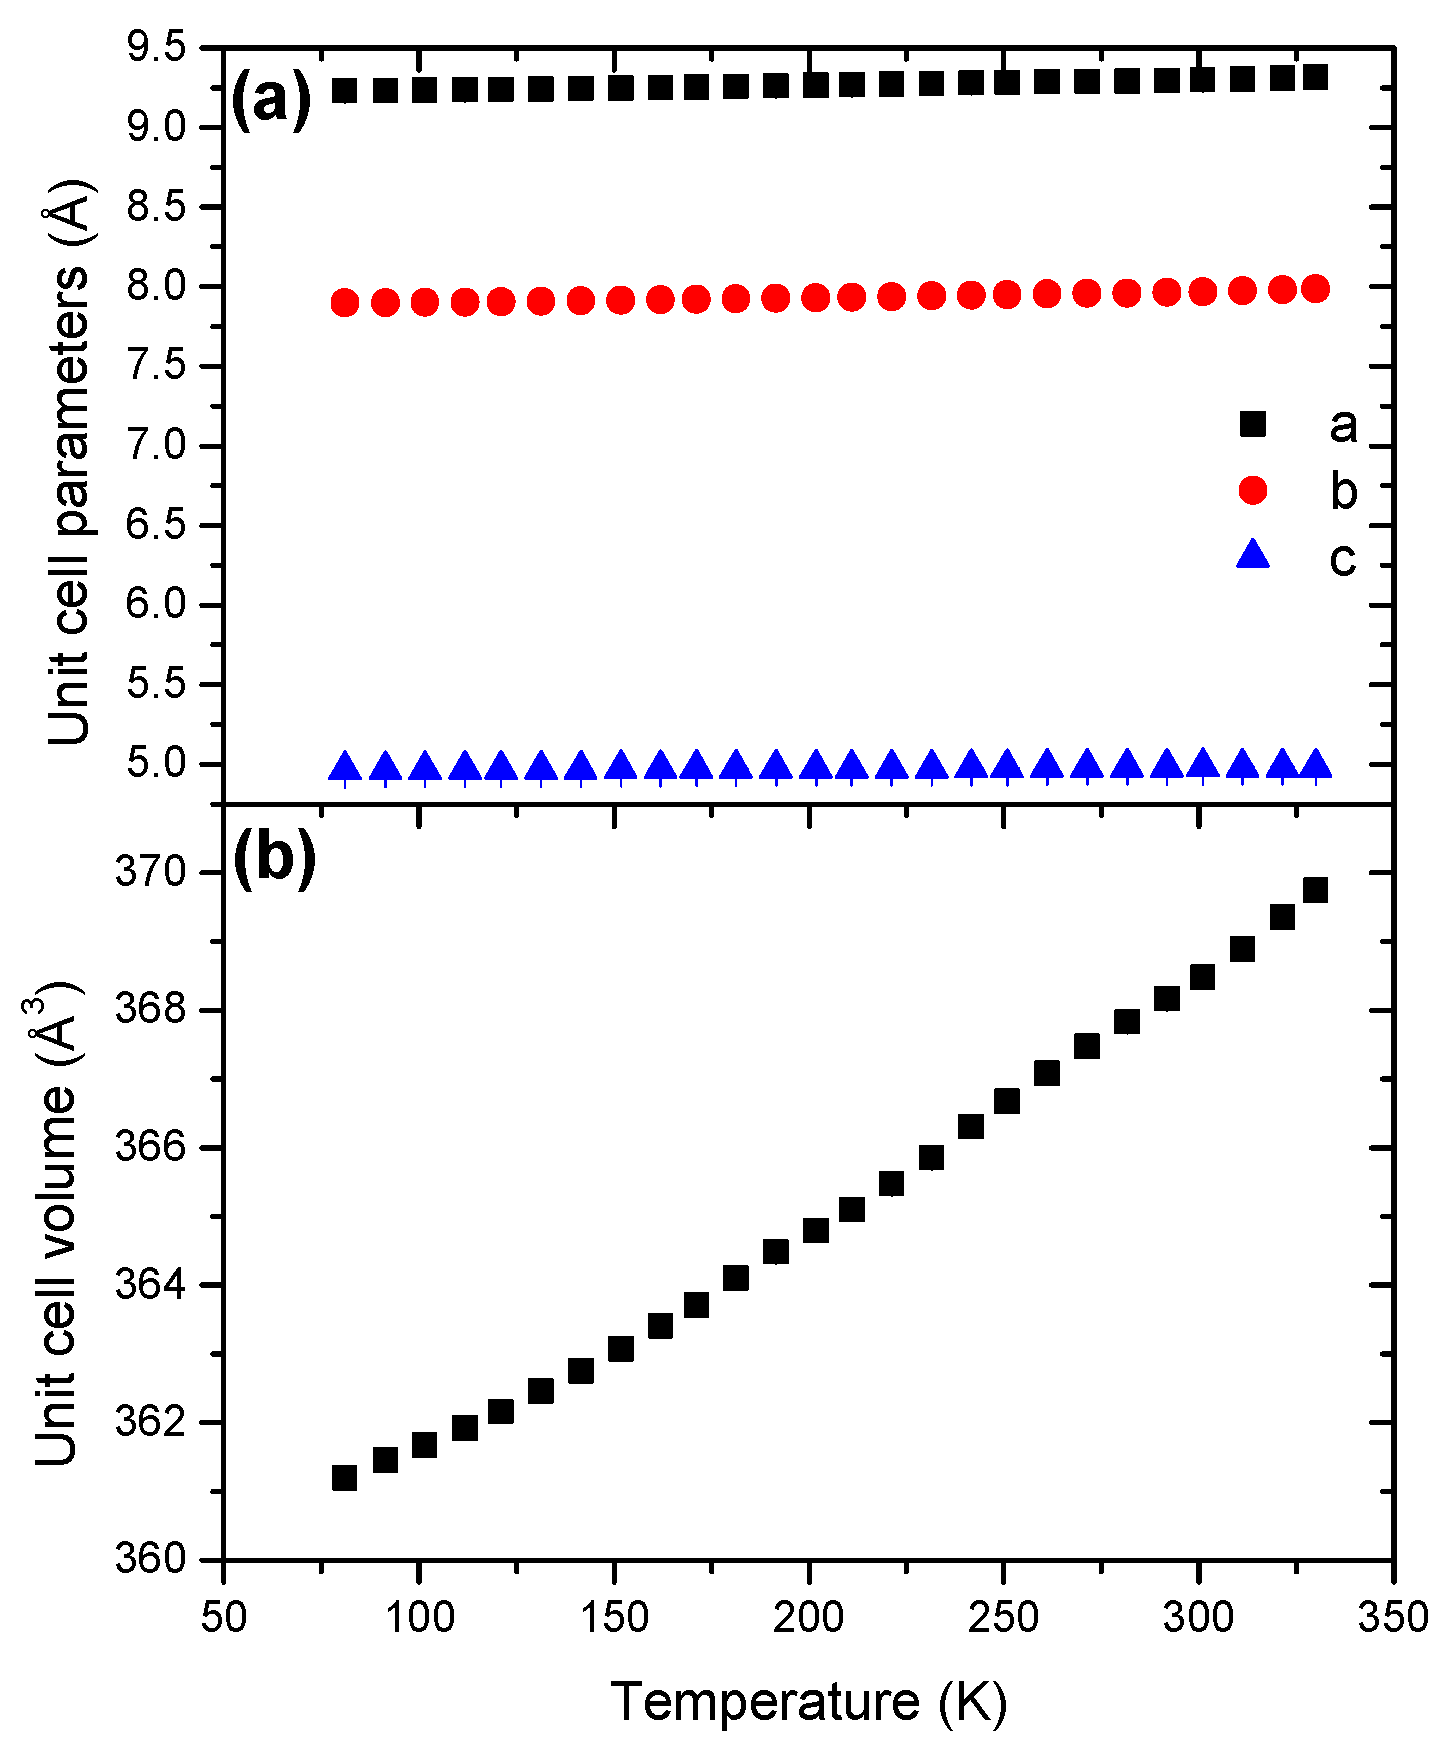
| NaHB | Monoclinic | P21/n | 81 | 4 | 9.2306(3) | 7.8976(2) | 4.9648(2) | 93.64(2) | 361.2(1) |
| STB | Orthorhombic | Pmn21 | 82 | 2 | 7.7934(2) | 5.8174(2) | 4.5389(1) | 208.8(1) |
| Borane | Phase | T (K) | V0 (Å) at 298 K | α0 (×10−5 K−1) | α1 (×10−8 K−2) |
|---|---|---|---|---|---|
| AB | Orthorhombic | <205 | 142.60(1) | 63.93(1) | 231.89(1) |
| Tetragonal | >205 | 139.35(1) | 29.65(1) | 92.28(1) | |
| HB | Orthorhombic | <240 | 641.84(1) | 3.96(1) | −111.52(1) |
| Orthorhombic | >240 | 640.25(1) | 20.71(1) | 178.58(1) | |
| HBB | Orthorhombic | <288 | 447.45(1) | 18.71(1) | 33.96(1) |
| Orthorhombic | >288 | 451.12(1) | 8.53(1) | 270.95(1) | |
| LiHB | Monoclinic | 327.86(1) | 10.57(1) | 32.08(1) | |
| NaHB | Monoclinic | 368.43(1) | 10.31(1) | 20.03(1) | |
| STB | Orthorhombic | 218.55(1) | 43.95(1) | 160.61(1) |
2.2. Hydrazine Borane HB


2.3. Hydrazine Bisborane HBB


2.4. Lithium Hydrazinidoborane LiHB


2.5. Sodium Hydrazinidoborane NaHB


2.6. Sodium Triborane STB


3. Discussion
4. Experimental Section
5. Conclusions
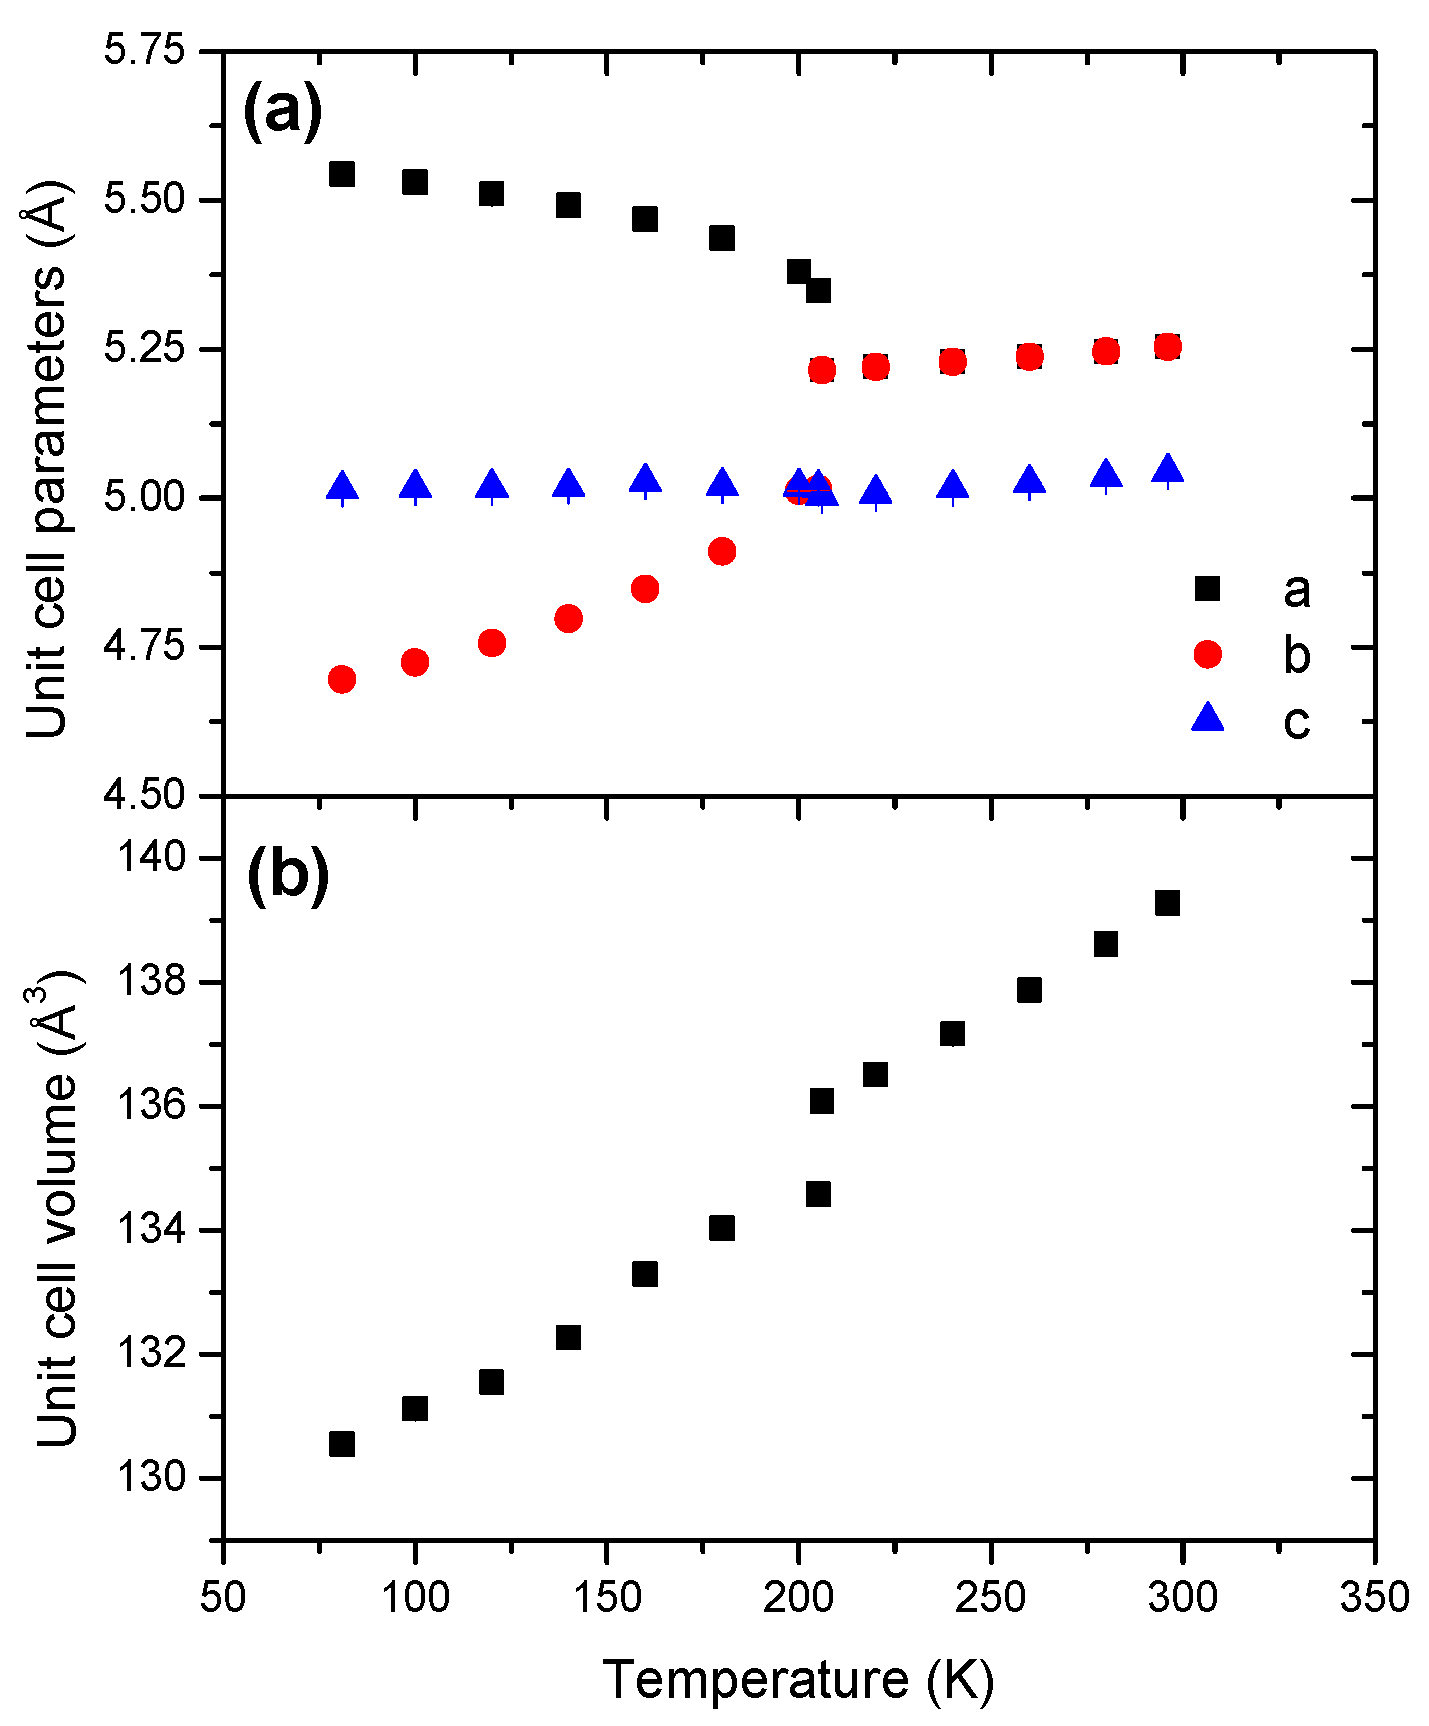
- AB is highly temperature-sensitive in comparison to HB and HBB, and a Pmn21-to-I4mm phase transition takes place at 205 K.
- HB has an orthorhombic structure (s.g. Pbcn) over the whole temperature range but the unit cell volume decreases by 0.85%. This is explained by an increase of the tilt angle between the c axis and the B-N bond and a subsequent cell contraction.
- HBB has an orthorhombic structure (s.g. Pbca) but the unit cell significantly changes at 288 K. For example, the tilt angle is 114.1° at 81 K whereas it is 136° at 294 K. Temperature-induced disorder leads to a new reorganization of the four HBB molecules in the unit cell, without impacting the crystal structure.
- For all of them, the cell expansion is anisotropic and there is no transition over the whole temperature range.
- LiHB and NaHB behave differently from the parent borane HB. Furthermore, the coefficients of thermal expansions are similar for LiHB and NaHB, suggesting similar disorder-related behavior under heating. This is explained by the presence of the alkali cations that would have stabilizing effect on the unit cell via M···H interactions with four to five borane anions.
Supplementary Materials
Acknowledgments
Author Contributions
Conflicts of Interest
References
- Jepsen, L.H.; Ley, M.B.; Lee, Y.S.; Cho, Y.W.; Dornheim, M.; Jensen, J.O.; Filinchuk, Y.; Jørgensen, J.E.; Besenbacher, F.; Jensen, T.R. Boron-Nitrogen Based Hydrides and Reactive Composites for Hydrogen Storage. Mater. Today 2014, 17, 129–135. [Google Scholar] [CrossRef]
- Li, H.W.; Yan, Y.; Orimo, S.I.; Züttel, A.; Jensen, C.M. Recent Progress in Metal Borohydrides for Hydrogen Storage. Energies 2011, 4, 185–214. [Google Scholar] [CrossRef]
- Huang, Z.; Autrey, T. Boron-Nitrogen-Hydrogen (BNH) Compounds: Recent Developments in Hydrogen Storage, Applications in Hydrogenation and Catalysis, and New Syntheses. Energy Environ. Sci. 2012, 5, 9257–9268. [Google Scholar] [CrossRef]
- Moury, R.; Demirci, U.B. Hydrazine Borane and Hydrazinidoboranes as Chemical Hydrogen Storage Materials. Energies 2015, 8, 3118–3141. [Google Scholar] [CrossRef]
- Parry, R.W.; Schultz, D.R.; Girardot, P.R. The preparation and properties of hexaaminecobalt(III) borohydride, hexaamminechromium(III) borohydride and ammonium borohydride. J. Am. Chem. Soc. 1958, 80, 1–3. [Google Scholar] [CrossRef]
- Shore, S.G.; Parry, R.W. The crystalline compound ammonia-borane, H3NBH3. J. Am. Chem. Soc. 1955, 77, 6084–6085. [Google Scholar] [CrossRef]
- Goubeau, J.; Ricker, E. Borinhydrazin und seine Pyrolyseprodukte. Z. Anorg. Allg. Chem. 1961, 310, 123–142. [Google Scholar] [CrossRef]
- Emeléus, H.J.; Stone, F.G.A. The Reaction between Diborane and Anhydrous Hydrazine. J. Chem. Soc. 1951, 840–841. [Google Scholar]
- Moury, R.; Moussa, G.; Demirci, U.B.; Hannauer, J.; Bernard, S.; Petit, E.; van der Lee, A.; Miele, P. Hydrazine Borane: Synthesis, Characterization, and Application Prospects in Chemical Hydrogen Storage. Phys. Chem. Chem. Phys. 2012, 14, 1768–1777. [Google Scholar] [CrossRef] [PubMed]
- Pylypko, S.; Petit, E.; Yot, P.G.; Salles, F.; Cretin, M.; Miele, P.; Demirci, U.B. Key Study of the Potential of Hydrazine Bisborane for Solid- and Liquid-State Chemical Hydrogen Storage. Inorg. Chem. 2015, 54, 4574–4583. [Google Scholar] [CrossRef] [PubMed]
- Richarson, T.B.; de Gala, S.; Crabtree, R.H. Unconventional Hydrogen Bonds: Intermolecular B-H···H-N Interactions. J. Am. Chem. Soc. 1995, 117, 12875–12876. [Google Scholar] [CrossRef]
- Hoon, C.F.; Reynhardt, E.C. Molecular Dynamics and Structures of Amine Boranes of the Type R3N.BH3.I. X-ray Investigation H3N.BH3 at 295 K and 110 K. J. Phys. C Solid State Phys. 1983, 16, 6129–6136. [Google Scholar] [CrossRef]
- Moury, R.; Demirci, U.B.; Ban, V.; Filinchuk, Y.; Ichikawa, T.; Zeng, L.; Goshome, K.; Miele, P. Lithium Hydrazinidoborane: A Polymorphic Material with Potential for Chemical Hydrogen Storage. Chem. Mater. 2014, 26, 3249–3255. [Google Scholar] [CrossRef]
- Moury, R.; Robeyns, K.; Filinchuk, Y.; Miele, P.; Demirci, U.B. In situ thermodiffraction to monitor synthesis and thermolysis of hydrazine borane-based materials. J. Alloy. Compd. 2016, 659, 210–216. [Google Scholar] [CrossRef]
- Wu, H.; Zhou, W.; Pinkerton, F.E.; Udovic, T.J.; Yildirim, T.; Rush, J.J. Metal Hydrazinoborane LiN2H3BH3 and LiN2H3BH3·2N2H4BH3: Crystal Structures and High-Extent Dehydrogenation. Energy Environ. Sci. 2012, 5, 7531–7535. [Google Scholar] [CrossRef]
- Chua, Y.S.; Chen, P.; Wu, G.; Xiong, Z. Development of Amidoboranes for Hydrogen Storage. Chem. Commun. 2011, 47, 5116–5129. [Google Scholar] [CrossRef] [PubMed]
- Huang, Z.; Chen, X.; Yisgedu, T.; Zhao, J.C.; Shore, S.G. High-Capacity Hydrogen Release through Hydrolysis of NaB3H8. Int. J. Hydrog. Energy 2011, 36, 7038–7042. [Google Scholar] [CrossRef]
- Yang, J.B.; Lamsal, J.; Cai, Q.; James, W.J.; Yelon, W.B. Structural Evolution of Ammonia Borane for Hydrogen Storage. Appl. Phys. Lett. 2008, 92, 091916. [Google Scholar] [CrossRef]
- Filinchuk, Y.; Nevidomskyy, A.H.; Chernyshov, D.; Dmitriev, V. High-Pressure and Transition Phenomena in Ammonia Borane NH3BH3 from X-Ray Diffraction, Landau Theory, and Ab Initio Calculations. Phys. Rev. B 2009, 79, 1–11. [Google Scholar] [CrossRef]
- Reynhardt, E.C.; Hoon, C.F. Molecular Dynamics and Structures of Amine Branes of the Type R3N.BH3.II. NMR Investigation of H3N·BH3. J. Phys. C Solid State Phys. 1983, 16, 6137–6152. [Google Scholar] [CrossRef]
- Moury, R.; Demirci, U.B.; Ichikawa, T.; Chiriac, R.; van der Lee, A.; Miele, P. Sodium Hydrazinidoborane: A Chemical Hydrogen-Storage Material. Chem. Sustain. Chem. 2013, 6, 667–673. [Google Scholar] [CrossRef] [PubMed]
- Dunbar, A.C.; Macor, J.A.; Girolami, G.S. Synthesis and Single Crystal Structure of Sodium Octahydrotriborate, NaB3H8. Inorg. Chem. 2014, 53, 822–826. [Google Scholar] [CrossRef] [PubMed]
- Penner, G.H.; Chang, Y.C.P.; Hutzal, J. A Deuterium NMR Spectroscopic Study of Solid BH3NH3. Inorg. Chem. 1999, 38, 2868–2873. [Google Scholar] [CrossRef] [PubMed]
- Figen, A.K.; Pişkin, M.B.; Coşkuner, B.; Imamoğlu, V. Synthesis, Structural Characterization, and Hydrolysis of Ammonia Borane (NH3BH3) as a Hydrogen Carrier. Int. J. Hydrog. Energy 2013, 38, 16215–16228. [Google Scholar] [CrossRef]
- Pylypko, S.; Zadick, A.; Chatenet, M.; Miele, P.; Cretin, M.; Demirci, U.B. A Preliminary Study of Sodium Octahydrotriborate NaB3H8 as Potential Anodic Fuel of Direct Liquid Fuel Cell. J. Power Sources 2015, 286, 10–17. [Google Scholar] [CrossRef]
- Hammersley, A.P.; Svensson, S.O.; Hanfland, M.; Fitch, A.N.; Häusermann, D. Two-Dimensional Detector Software: From Real Detector to Idealised Image of Two-Theta Scan. High Press. Res. 1996, 14, 235–248. [Google Scholar] [CrossRef]
- Petricek, V.; Dusek, M.; Palatinus, L. Crystallographic Computing System JANA2006: General Features. Z. Krist. 2014, 229, 345–352. [Google Scholar]
- Boultif, A.; Louer, D. Indexing of Powder Diffraction Patterns for Low-Symmetry Lattices by the Successive Dichotomy Method. J. Appl. Crystallogr. 1991, 24, 987–993. [Google Scholar] [CrossRef]
- Angel, R.J.; Gonzalez-Platas, J.; Alvaro, M. EosFit7c and a Fortran Module (Library) for Equation of State Calculations. Z. Krist. 2014, 229, 405–419. [Google Scholar] [CrossRef]
- Berman, R.G. Internally-Consistent Thermodynamic Data for Minerals in the System Na2O-K2O-CaO-MgO-FeO-Fe2O3-Al2O3-SiO2-TiO2-H2O-CO2. J. Petrol. 1988, 29, 445–522. [Google Scholar] [CrossRef]
© 2016 by the authors; licensee MDPI, Basel, Switzerland. This article is an open access article distributed under the terms and conditions of the Creative Commons by Attribution (CC-BY) license (http://creativecommons.org/licenses/by/4.0/).
Share and Cite
Yot, P.G.; Miele, P.; Demirci, U.B. In situ Synchrotron X-ray Thermodiffraction of Boranes. Crystals 2016, 6, 16. https://doi.org/10.3390/cryst6020016
Yot PG, Miele P, Demirci UB. In situ Synchrotron X-ray Thermodiffraction of Boranes. Crystals. 2016; 6(2):16. https://doi.org/10.3390/cryst6020016
Chicago/Turabian StyleYot, Pascal G., Philippe Miele, and Umit B. Demirci. 2016. "In situ Synchrotron X-ray Thermodiffraction of Boranes" Crystals 6, no. 2: 16. https://doi.org/10.3390/cryst6020016