Article

Ti6Al4V-0.72H on the Establishment of Flow Behavior and the Analysis of Hot Processing Maps

1
School of Mechanical Engineering, Nantong Institute of Technology, Nantong 226002, China
2
Jiangsu Key Laboratory of 3D Printing Equipment and Application Technology, Nantong Institute of Technology, Nantong 226002, China
3
Department of IT Engineering, Mokwon University, Daejeon 35349, Republic of Korea
*
Author to whom correspondence should be addressed.
Crystals 2024, 14(4), 345; https://doi.org/10.3390/cryst14040345
Submission received: 10 February 2024 / Revised: 21 March 2024 / Accepted: 25 March 2024 / Published: 3 April 2024

Abstract

:
Significant columnar grains usually occur in the metallurgical microstructure of laser additive manufacturing, and plastic deformation introduced into additive manufacturing can significantly refine grain size. Due to the high deformation resistance and difficult deformation of titanium alloys, reducing the high-temperature deformation resistance of additive manufacturing titanium alloys is essential to facilitating the implementation of online rolling processes. High-temperature compression of titanium alloys was performed on a Gleeble-3800. It was found that the flow stress of the alloy decreased when the strain of the alloy decreased or the deformation temperature increased. The flow behavior of titanium alloys at high temperatures was investigated with the help of a Z-parameter flow model and multiple linear regression model. A positive correlation was found between the experimental and predicted values of the alloy under the multiple linear regression model, with a correlation coefficient of 0.98 and its error of 13.5%, which could better predict the flow stress values. In addition, hot processing maps were established, and the optimal deformation conditions were determined to provide some theoretical guidance for subsequent experiments.

1. Introduction

Titanium alloy Ti6Al4V is widely used in aerospace, marine, automotive and other fields owing to its low density, high specific fracture toughness, excellent heat resistance, superior fatigue strength and crack expansion resistance, as well as remarkable toughness and corrosion resistance [1,2,3,4,5,6]. Laser melting deposition is preferred for the fabrication of intricate load-bearing components in major equipment, such as aerospace applications, due to its advantages of shortened manufacturing cycle and reduced machining allowances [7,8,9,10]. However, its unique molding process tends to result in the formation of significant columnar crystals, leading to an inhomogeneous distribution of microstructures and phases. Consequently, this limitation severely hampers its application in critical load-bearing structures [11,12]. Therefore, achieving the transformation from columnar crystals to equiaxed crystals and addressing the uneven distribution of microstructures will be pivotal in advancing the engineering application of additive manufacturing technology in the future [13,14,15,16].
Researchers have addressed the issue of coarse columnar crystals through various approaches, including the manipulation of process parameters, addition of reinforcing phases, application of external field assistance and plastic deformation. P.A. Kobryn et al. [17] studied the growth pattern of columnar crystals via laser melting and showed that increasing the laser power can effectively reduce their size. B.J Kooi et al. [18] prepared Ti6Al4V + TiB2/TiB composites by adding reinforcing phases, and it was observed that the particle reinforcement exhibited bonding with the matrix, devoid of any defects, such as porosity or cracks. Furthermore, the reinforcement exhibited remarkable wear resistance. S. Pouze et al. [19] produced thin-walled components using a mixture of Ti6Al4V alloy powder with B4C powder, leading to the formation of enhanced phases, which effectively strengthened grain boundaries, facilitated grain nucleation and refined grains. Gu [20] successfully fabricated TiC + (TiAl3 + Ti3AlC2) composites via select laser melting (SLM), resulting in a refined microstructure compared to the original alloy. However, the addition of reinforcing phases altered the composition of the alloy, which is not permissible for alloys with strict compositional requirements. Wang Wei et al. [21] incorporated ultrasonic vibration during the melting process to minimize the temperature difference between adjacent layers and enhance the convection within the melt pool, thereby achieving a more stable melt pool temperature. This method results in a more homogeneous microstructure, significant grain refinement, as well as reduced residual stresses in the material. In the preparation of nickel-based high-temperature alloys using laser cladding, Qi et al. [22] introduced ultrasonic impact to refine the grain, effectively eliminating residual stresses in the material. Martina et al. [23] employed rolling techniques on the deposited layer to resolve the formation of coarse incipient β grain boundaries during the arc-feeding, resulting in destruction of these coarse grains while preserving the internal morphology of the Widmanstätten structure.
However, during the process of large plastic deformation, titanium alloys exhibit high specific strength, high resistance to deformation and difficultly in achieving complete deformation using the existing methods. To address this issue, hydrogen-induced phase transformation is utilized to lower the alloy’s deformation temperature [24,25,26,27,28]. Simultaneously, the plastic deformation constitutive equation serves as a bridge between material deformation process parameters and hot deformation behavior. It accurately predicts the relationship between these parameters and describes their changing trends according to the constitutive equation. This plays a vital role in determining more suitable process parameters for improved serviceability [29,30].
Researchers integrated established material constitutive equations to provide theoretical support for the subsequent processing [31]. Currently, three main types of equations are used to describe the high-temperature deformation of titanium alloys, including mechanistic models, phenomenology models and artificial neural network models [32]. Table 1 shows the different applications of the three models.
The Arrhenius model, a classical phenomenology constitutive equation, accurately describes the relationship between strain, deformation temperature and flow stress. Due to its simplified calculation process, it has become widely adopted as the principal constitutive equation. Michael et al. [37] investigated the hot deformation behavior of titanium alloys based on the Arrhenius equation. The results demonstrate a strong prediction of flow stress with reasonable correlation coefficients. However, significant relative and root-mean-square errors were observed when the general roughness gradient correction was not included. The Arrhenius equation and Norton-Hoff constitutive model were proposed by Zhang Chao et al. [38] to describe the tensile behavior of titanium. The findings demonstrate that both equations are effective in validating the flow stress of titanium.
In this study, the variation in flow behavior of Ti6Al4V with a mass fraction of 0.72 wt% H under different deformation conditions was investigated mainly by different flow stress models. The flow stresses at different deformation temperatures were obtained via compression experiments on hydrogenated titanium alloys at 725–885 °C, determining reasonable processing zones for different hydrogen contents and providing theoretical support and practical basis for improving the hot working process and reducing the hot working cost of Ti-Al-V system alloys fabricated by additive manufacturing.

2. Materials and Methods

2.1. Experimental Equipment and Materials

The raw material used in this experiment is Ti6Al4V powder, with particle size of 53–200 μm, which is obtained via vacuum induction melting inert gas atomization (VIGA) provided by Zhejiang TIANTI additive manufacturing technology Co. in Ningbo, China. The substrate used is Ti6Al4V in a hot-rolled state, with dimensions of 160 mm × 160 mm × 20 mm. Before printing, the Ti6Al4V substrate is sand-blasted until the surface turns silvery gray to remove the surface oxide, and the substrate surface is wiped with acetone or ethanol to improve the deposited alloy bond for the substrate. The gun’s distance is set at 50 mm, with a sand blasting angle of 60°. The air pressure for sand blasting is adjusted to 3 bar, and the sand blasting duration is set for 20 min. In this experiment, the Ti6Al4V titanium alloy is prepared using LMD 8060 equipment. The Ti6Al4V specimen is prepared using the laser melting deposition method, with power of 1200 W and travelling speed of 600 mm/min, scanning pitch of 1.6 mm and powder feeding rate of 1.0 rpm/min. This is performed in an argon atmosphere, with the oxygen content kept below 50 ppm to prevent oxidation of the titanium alloy samples during preparation. Using the serpentine reciprocal scanning method for printing, each layer is deposited and rotated 90° for the next layer deposition. The Ti6Al4V block is printed out and machined into a cylindrical specimen of ø 8 × 12 mm via wire cutting, as shown in Figure 1.
The un-hydrogenated rod titanium alloy specimens were placed in glass tubes and vacuum-sealed to prevent oxidation. The rod specimen sealed in the glass tube was placed in a muffle furnace for annealing at 800 °C for 2 h, followed by water cooling.
The parameters, including hydrogenation temperature and hydrogen pressure, were determined in accordance with Sievert’s rule. Hydrogenation experiments were carried out using a tubular hydrogenation furnace. Prior to the addition of hydrogen, the tube was heated and maintained at a pressure of approximately 103 Pa. When the hydrogenation temperature was reached, high-purity hydrogen was introduced at a constant flow rate of 1 L/min. The samples were held at 750 °C for 2 h to facilitate enhanced hydrogen penetration, followed by furnace cooling to ambient temperature. The Ti6Al4V alloy with a mass fraction of 0.72 wt% was measured with a high-precision physical balance (accuracy of 10–5 g). The specific compositions of the measured Ti6Al4V alloy and Ti6Al4V-0.72H alloy are shown in Table 2.
The alloy deformation temperature was determined by referencing the phase transformation point, with temperatures set at 40 °C and 80 °C above and below the phase transformation point. High-temperature compression tests were conducted using the Gleeble-3800 equipment, applying four compression rates (0.01 s−1, 0.1 s−1, 1 s−1 and 10 s−1) at each deformation temperature, as presented in Table 3.

2.2. Microstructural Characterization

The high-temperature compressed sample was sectioned perpendicular to the compression direction to obtain a transverse cross-section resembling a waist drum shape. Optical microscopy (OM) was employed for microstructural examination of the specimens. Prior to observation using an optical microscope (OM, Zeiss Observer A1m, Zeiss, Jena, Germany), the samples were etched with Keller’s reagent (3 mL HF + 2 mL HCl + 5 mL HNO3 + 195 mL H2O) for 5–10 s. The deformation behavior of the alloy was predicted using various flow models, and hot processing maps were constructed to determine the optimal processing range based on these predictions. A constitutive equation is derived by fitting the peak stress in the stress–strain curve [40]. During high-temperature deformation, it is critical to select a suitable flow model for predicting the deformation behavior of the alloy. In this study, two flow models were constructed for titanium alloys under high-temperature deformation. The first was the Z-parameter constitutive model equation in the Arrhenius equation, which was used to determine the flow stresses at different deformation temperatures and strain rates. Secondly, a new multiple linear regression model was proposed to predict the behavior of flow stresses with strains in titanium alloys under the conditions of high-temperature deformation.

3. Results

3.1. Microstructure Evolution

The microstructures of Ti6Al4V and Ti6Al4V-0.72H at a compression rate of 0.01 s−1, above the phase transformation point temperature of 80 °C, are depicted in Figure 2. It can be found that the Ti6Al4V alloy exhibits prior β grains comprising lamellar α phases. However, due to rapid cooling during additive manufacturing, the growth and retention of prior β phase are impeded, resulting in its absence upon visual observation. Conversely, in the Ti6Al4V-0.72H alloy, the matrix consists predominantly of the β phase along with α phase constituents. Notably, there is a discernible increase in the content of β phase attributed to hydrogen addition, as it acts as a stabilizing element for β phase retention even at room temperature.

3.2. Analysis of Deformation Behavior

Figure 3 illustrates the stress–strain relationship curve of the Ti6Al4V alloy in the absence of hydrogen addition. As the strain increases, there is a sharp rise in flow stress due to work hardening during initial deformation. Subsequently, there is a gradual decrease in flow stress caused by softening behavior. In the later stages of deformation, material processing and dynamic softening counteract each other, resulting in a steady-state flow trend. It is also observed that the peak flow stress of the alloy is sensitive to the deformation temperature, exhibiting a decrease with increasing temperature. Figure 3a–d illustrate that at the same deformation temperature, the peak flow stress increases with the strain rate. For instance, at a deformation temperature of 820 °C, the peak stress of the alloy rises from 151.5 MPa to 414.7 MPa as the strain rate increases from 0.01 s−1 to 10 s−1. Similarly, at a deformation temperature of 980 °C, the peak stress increases from 10.5 MPa to 76.5 MPa. These results indicate that higher deformation temperatures lead to greater enhancements in peak stress with increasing strain rate, while lower temperatures result in less pronounced decreases in peak stress.
The stress–strain curve of the Ti6Al4V-0.72H alloy is presented in Figure 4. The observed trend closely resembles that of the stress–strain curve without hydrogen addition. As depicted in the figure, at lower temperatures, the alloy undergoes work hardening followed by dynamic softening, ultimately resulting in a cancellation effect. When the deformation temperature falls below 805 °C, the flow behavior of the alloy shows a sharp increase followed by a gradual decrease and eventual stabilization. This indicates that below the phase change point (α + β phase region), primarily recrystallization behavior is exhibited by the alloy, whereas above 805 °C (β phase region), dynamic reversion behavior is observed [41].

4. Discussion

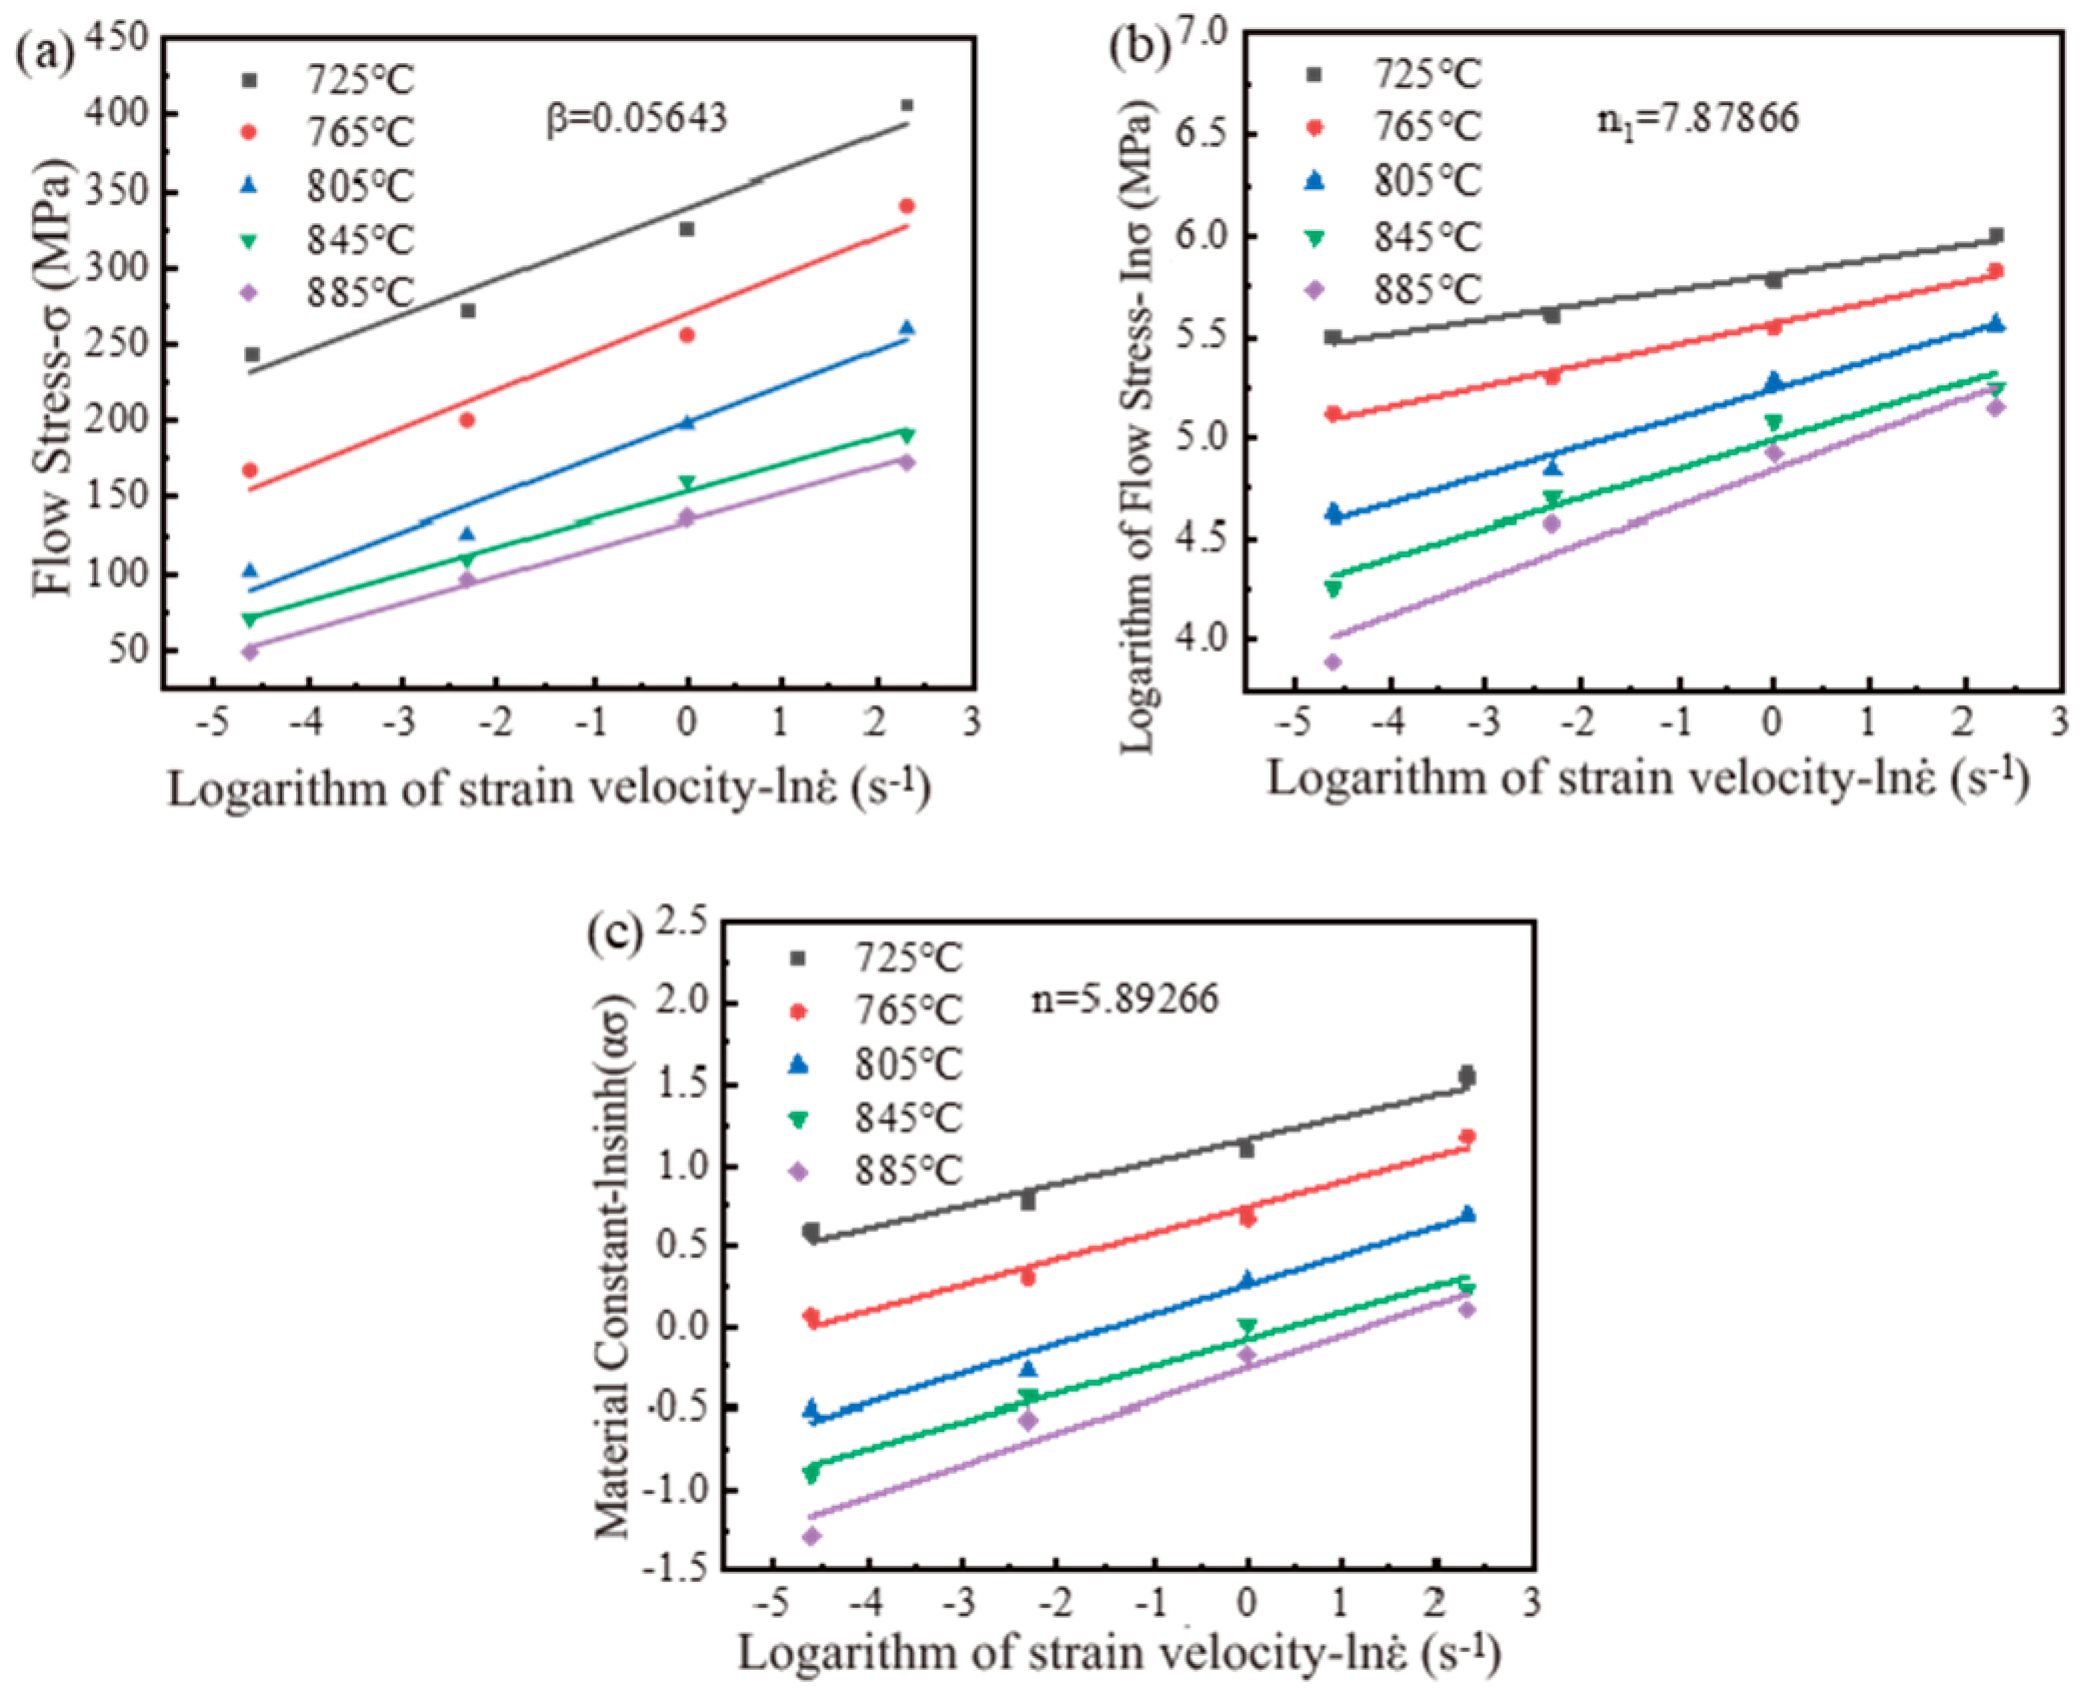
4.1. Z-Parameter Flow Model

There are many reasons why the flow stress of the alloy can change during high-temperature compression, which ultimately affects the properties of the material used. The main reasons for changing the stress in the alloy can be divided into two factors: the first is the factor of the alloy material itself (such as chemical composition); the second is the factor influenced by external influence (including strain rate, deformation temperature, strain variation, etc.). Based on this, the following expressions are proposed in Equation (1):
σ = f ( T , ε , C , ε ˙ , S )
where T is the deformation temperature; ε is the strain rate; ε ˙ is the strain rate; C is the chemical composition; and S is the structural parameter. In the experiment, the chemical composition of the alloy was determined, so that C can be considered as a constant. When the heat deformation parameters are determined, the alloy microstructure characteristics S can also be considered as a constant. Thus, the expression in the above equation can be simplified as [42].
σ = f T , ε , ε ˙
The Z-parameter flow model satisfies this requirement. It can be used to predict the change in stress values of Ti6Al4V-0.72H at different deformation temperatures and strain rates. The expressions are shown in Equation (3) [43]:
Z = ε ˙ e x p ( Q R T )
In the Z-parameter equation, T stands for the absolute temperature (K); ε ˙ denotes the strain rate (s−1); R represents the gas constant (8.314 J/mol∙K); and Q refers to the heat deformation activation energy (KJ/mol). In the Arrhenius equation, there are three different expressions, all three of which establish the relationship between the Z-parameter equation and stress. The specific expressions are shown in Equation (4) below [44].
Z = ε ˙ exp Q R T = A 1 e x p ( β σ ) A 2 σ n 1 A 3 [ sinh α σ ] n
In the above equation, A1, A2, A3, n, n1 and α(≈β/n1) are all related to the material itself and can be considered as invariant variables. Therefore, after calculating the values of β, n1, α and n using the three expressions in Equation (4), respectively, and determining a certain deformation temperature and strain rate, three Q values can be obtained. The final Q value is obtained by taking the average of the three values. After determining all the unknowns in the above equation, the Z-parameter equation can be obtained, which can be used to calculate the stress values under specific conditions.
In order to calculate the unknowns β, n1, α and n in the above equations, the natural logarithm of the three equations in Equation (4) is found to obtain the expressions in Equation (5) below. Observing the expressions, it is clear that there is a linear relationship between σ ln ε ˙ , ln σ ln ε ˙ and ln[sinh(α σ )] − ln ε ˙ .
σ = 1 β l n ε ˙ + 1 β Q R T l n A 1 l n σ = 1 n 1 l n ε ˙ + 1 n 1 Q R T l n A 2 l n s i n h α σ = l n ε ˙ n + Q n R T l n A 3 n
In order to calculate the Z-parameter equation, it is necessary to select some data in the stress–strain curve to perform the calculation. Table 4 shows the peak stresses corresponding to Ti6Al4V-0.72H specimens at deformation temperatures of 725–885 °C and strain rates of 0.01–10 s−1.
According to Equation (5) above, the linear relationships between σ ln ε ˙ , ln σ ln ε ˙ and ln[sinh(α σ )] − ln ε ˙ are plotted, respectively, as shown in Figure 5. The difference between the slope values of (a) and (b) in Figure 5 is found to be minor. Therefore, the average values of β and n1 can be calculated separately from the slope. The value of α is then calculated using the formula α = β/n1, so that we can obtain the relationship graph of ln[sinh(α σ )] − ln ε ˙ . The average value of n is then found based on the slope of the line in Figure 5c.
In order to calculate the value of Q, a transformation of expressions in Equation (4) is required. The prerequisite is that the heat deformation activation energy of the alloy remains constant, and the strain of the alloy remains constant when it is in a certain temperature range. Taking the logarithm of its two sides, the following Equation (6) is obtained:
Q = R β σ 1000 T ε ˙ R n 1 ln σ 1000 T ε ˙ R n ln s i n h α σ 1000 T ε ˙
The linear relationships between σ 1000 / T , l n σ 1000 / T and l n s i n h α σ 1000 / T are drawn in a similar way, as shown in Figure 6. Based on the values of β, n1 and n calculated in Figure 5, substitute each of the three values into the above Equation (6) to calculate the value of Q. Finally, Q = 684.74 KJ/mol is obtained, and the calculated value of the deformation activation energy Q is in accordance with the deformation activation energy calculated by Peng et al. [45]. According to the relationship plot of l n s i n h α σ l n ε ˙ in Figure 5 above, the corresponding intercept after fitting is 1 n Q R T ln A 3 . In this expression, Q and n are solved, so the value of ln A 3 can be obtained as 72.717. Substituting Q = 684.74 KJ/mol into the above Equation (4), we can obtain the Z-values under different deformation conditions. After fitting, the final Z-parameter instanton equation is obtained, as shown in Equation (7) below. Figure 7 shows the relationship between l n Z and l n s i n h α σ .
Z = e x p 684740 R T = 3.80707 × 10 31 s i n h ( 0.007162 σ ) 5.9

4.2. Multiple Linear Regression Model for Phenomenology

The model obtained above is only related to the deformation temperature and strain. However, the flow stress of an alloy during compression at high temperatures is strongly influenced by its strain, in addition to the deformation temperature and strain. Based on this, a multiple linear regression model considering strain is proposed. According to what is shown in Figure 5, there is a linear relationship between ln ε ˙ and ln σ , and the slope between the two is relatively close at different deformation temperatures. According to Figure 6, it is evident that there is also a strong linear correlation between ln σ and 1000/T. Therefore, the above relations are expressed in terms of the corresponding linear relations, as follows (Equations (8) and (9)):
l n σ = M l n ε ˙ + σ T
l n σ = N 1000 T + σ ε ˙
In Equation (8), σ(T) is a constant, and a change in temperature does not cause a change in the value of M. M is only strain-dependent and varies with strain. Similarly, in Equation (9), a change in the strain rate does not cause a change in the value of N, where σ ε ˙ is also a constant. The parameters M, N are used to represent stress as a function of strain and strain rate. Thus, combining the two expressions (Equations (8) and (9)) yields the correct representation of the equation, as shown in Equation (10):
l n σ = M l n ε ˙ + N 1000 T + P
where parameter P is used to represent stress as a function of temperature. In this paper, the strains at 0.05–0.85 with a data point interval of 0.05 are used to calculate the parameters of multiple linear regression at different strains and to then develop a multiple linear regression model including strains.
As shown in Figure 8a–c, the scatter plots of M, N and P are shown, respectively, as the strain changes, and then, a suitable polynomial fit is used to obtain the graphs between the strain and each parameter. After a comparison, it was found that the fit between the strain and parameters was better at the highest times of 8 times. The expressions for M, N and P are shown in Equations (11)–(13) below [46]:
M = 0.105 + 0.63 ε 6.48 ε 2 + 37.77 ε 3 129.81 ε 4 + 268.03 ε 5 323.58 ε 6 + 208.95 ε 7 55.5 ε 8
N = 5.85 1.25 ε + 17.14 ε 2 137.75 ε 3 + 567.55 ε 4 1301.69 ε 5 + 1675.57 ε 6 1130.43 ε 7 + 310 ε 8
P = 0.01 + 0.95 ε 11.41 ε 2 + 65.04 ε 3 187.59 ε 4 + 282.62 ε 5 202.12 ε 6 + 40.18 ε 7 + 12.78 ε 8
After M, N and P are determined, the Ti6Al4V-0.72H alloy can be used by this model to obtain the stress values at different strains. The prerequisite conditions are a suitable temperature range and a certain strain. The temperature range is 725–885 °C, and the strain range is 0.01–10 s−1, both within the conditions. The accuracy of the equations was tested by the correlation coefficient (R) as well as the average relative error (AARE), as shown in Equations (14) and (15):
R = i = 1 N E i E ¯ P i P ¯ i = 1 N E i E ¯ 2 i = 1 N P i P ¯ 2
A A R E % = 1 N i = 1 N E i P i E i × 100
where Ei is the experimental data point of stress; Pi is the predicted data point of stress; E ¯ is the arithmetic mean of all experimental values; P ¯ is the arithmetic mean of all predicted values; and N is the total number. When the value of R is larger, this means that the experimental value and the predicted value are close to each other, and the correlation between them is better. The value of R ranges between 0 and 1. When the value of AARE is smaller, this means that the phase error between the experimental value and the predicted value is small, and the experimental error is also smaller. The value of AARE ranges between 0 and 1.
Figure 9 shows the comparison between simulated and experimental values at different deformation temperatures of Ti6Al4V-0.72H. The black curves are the experimental results, and the red dots are the predicted values. It can be seen in the figure that the difference between the predicted and experimental values of the alloy is small when the alloy is at a low strain. When the strain of the alloy is 10 s−1, the deviation between the experimental value and the predicted value is large. This may be due to the adiabatic heating of the alloy when the alloy is under large strain deformation and the formation of an adiabatic shear zone, causing the predicted data to be higher than the experimental data.
Figure 10 shows the diagram between the experimental and predicted stress values of the alloy obtained for Ti6Al4V-0.72H, where the red line is the correlation line, and the green points are the experimental data points measured by the multiple linear regression model. When the green data points on the graph are closer to the red straight line, this means that the experimental stress value and the stress value calculated by the multiple linear regression model are also closer, and the correlation between the experimental value and the predicted value is better. In the figure, R = 0.98, AARE = 13.5%. The high value of the correlation coefficient R and the small average relative error indicate the high accuracy of the multiple linear regression equation for this alloy. The alloys have small errors and can be used to predict the flow behavior of the alloy at high temperatures.

4.3. The Hot Processing Map

As a β-stabilizing element, the addition of a suitable amount of hydrogen to the titanium alloy will significantly reduce the deformation resistance of the alloy and improve the machinability of the alloy. Figure 11 shows the hot processing maps of Ti6Al4V and Ti6Al4V-0.72H at a strain of 0.7. It can be found that the destabilization region of the alloy is mainly concentrated in the region of lower deformation temperature and higher strain. When the hydrogen content is 0 wt%, the deformation temperature in the destabilization zone is 870–930 °C. The deformation temperature of a reasonable processing interval is 940–980 °C, and the strain rate is 0.01–0.1 s−1. Additionally, when the hydrogen content in the alloy is 0.72 wt%, the destabilization region becomes large and dispersed, as shown in the heat treatment diagram. A reasonable processing interval has a deformation temperature of 725–760 °C and a strain rate of 0.01–1.5 s−1.
As can be seen in the safety zones in the two hot processing maps in Figure 11, the regions where extreme values of power dissipation efficiency η are located vary due to the hydrogen content, and the safe processing regions for the alloy are mainly concentrated at small strains and higher deformation temperatures. The findings suggest that the introduction of a moderate amount of hydrogen can effectively mitigate flow instability in the alloy, thereby enhancing the production rate and quality of the output.

5. Conclusions

In this paper, the stress–strain curve of titanium alloys during high-temperature deformation was used to develop an intrinsic model for predicting the flow behavior of the alloy. A multiple linear regression equation including strain was obtained on the basis of the Z-parameter equation, and the reliability of the model was verified, with the following results:
(1)
A Q value of 684.74 KJ/mol at a hydrogen content of 0.72 wt% was obtained.
(2)
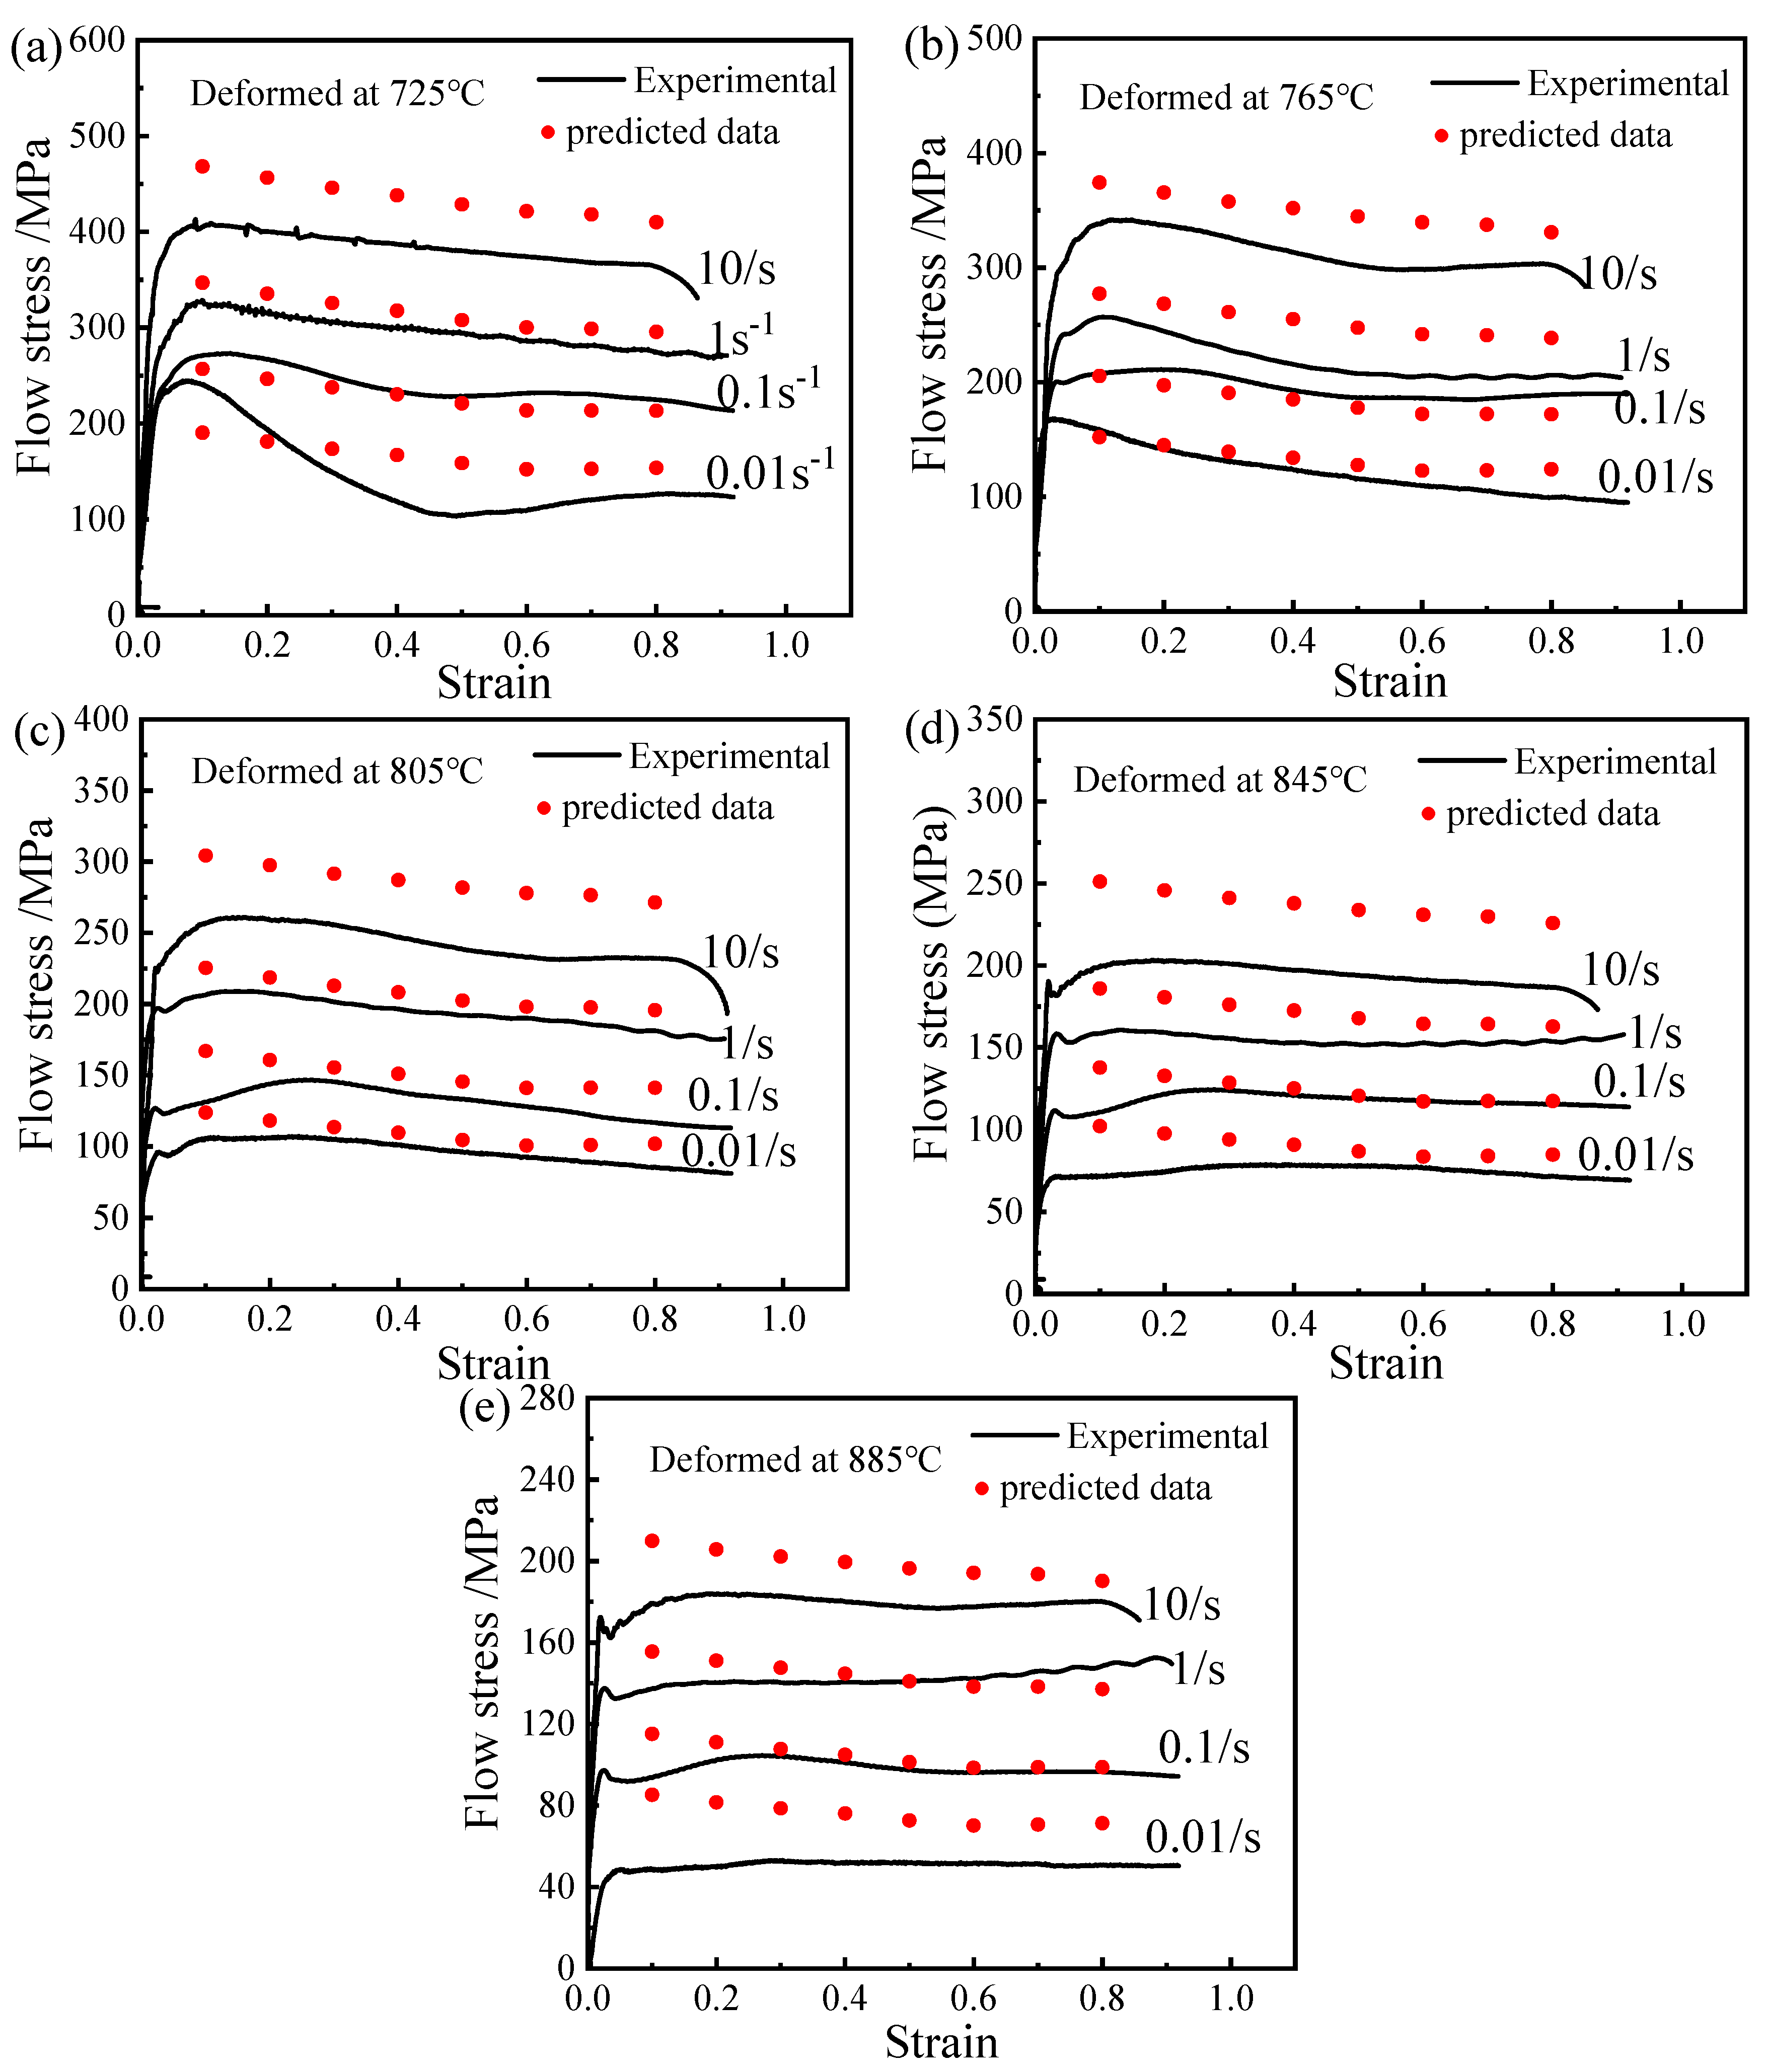
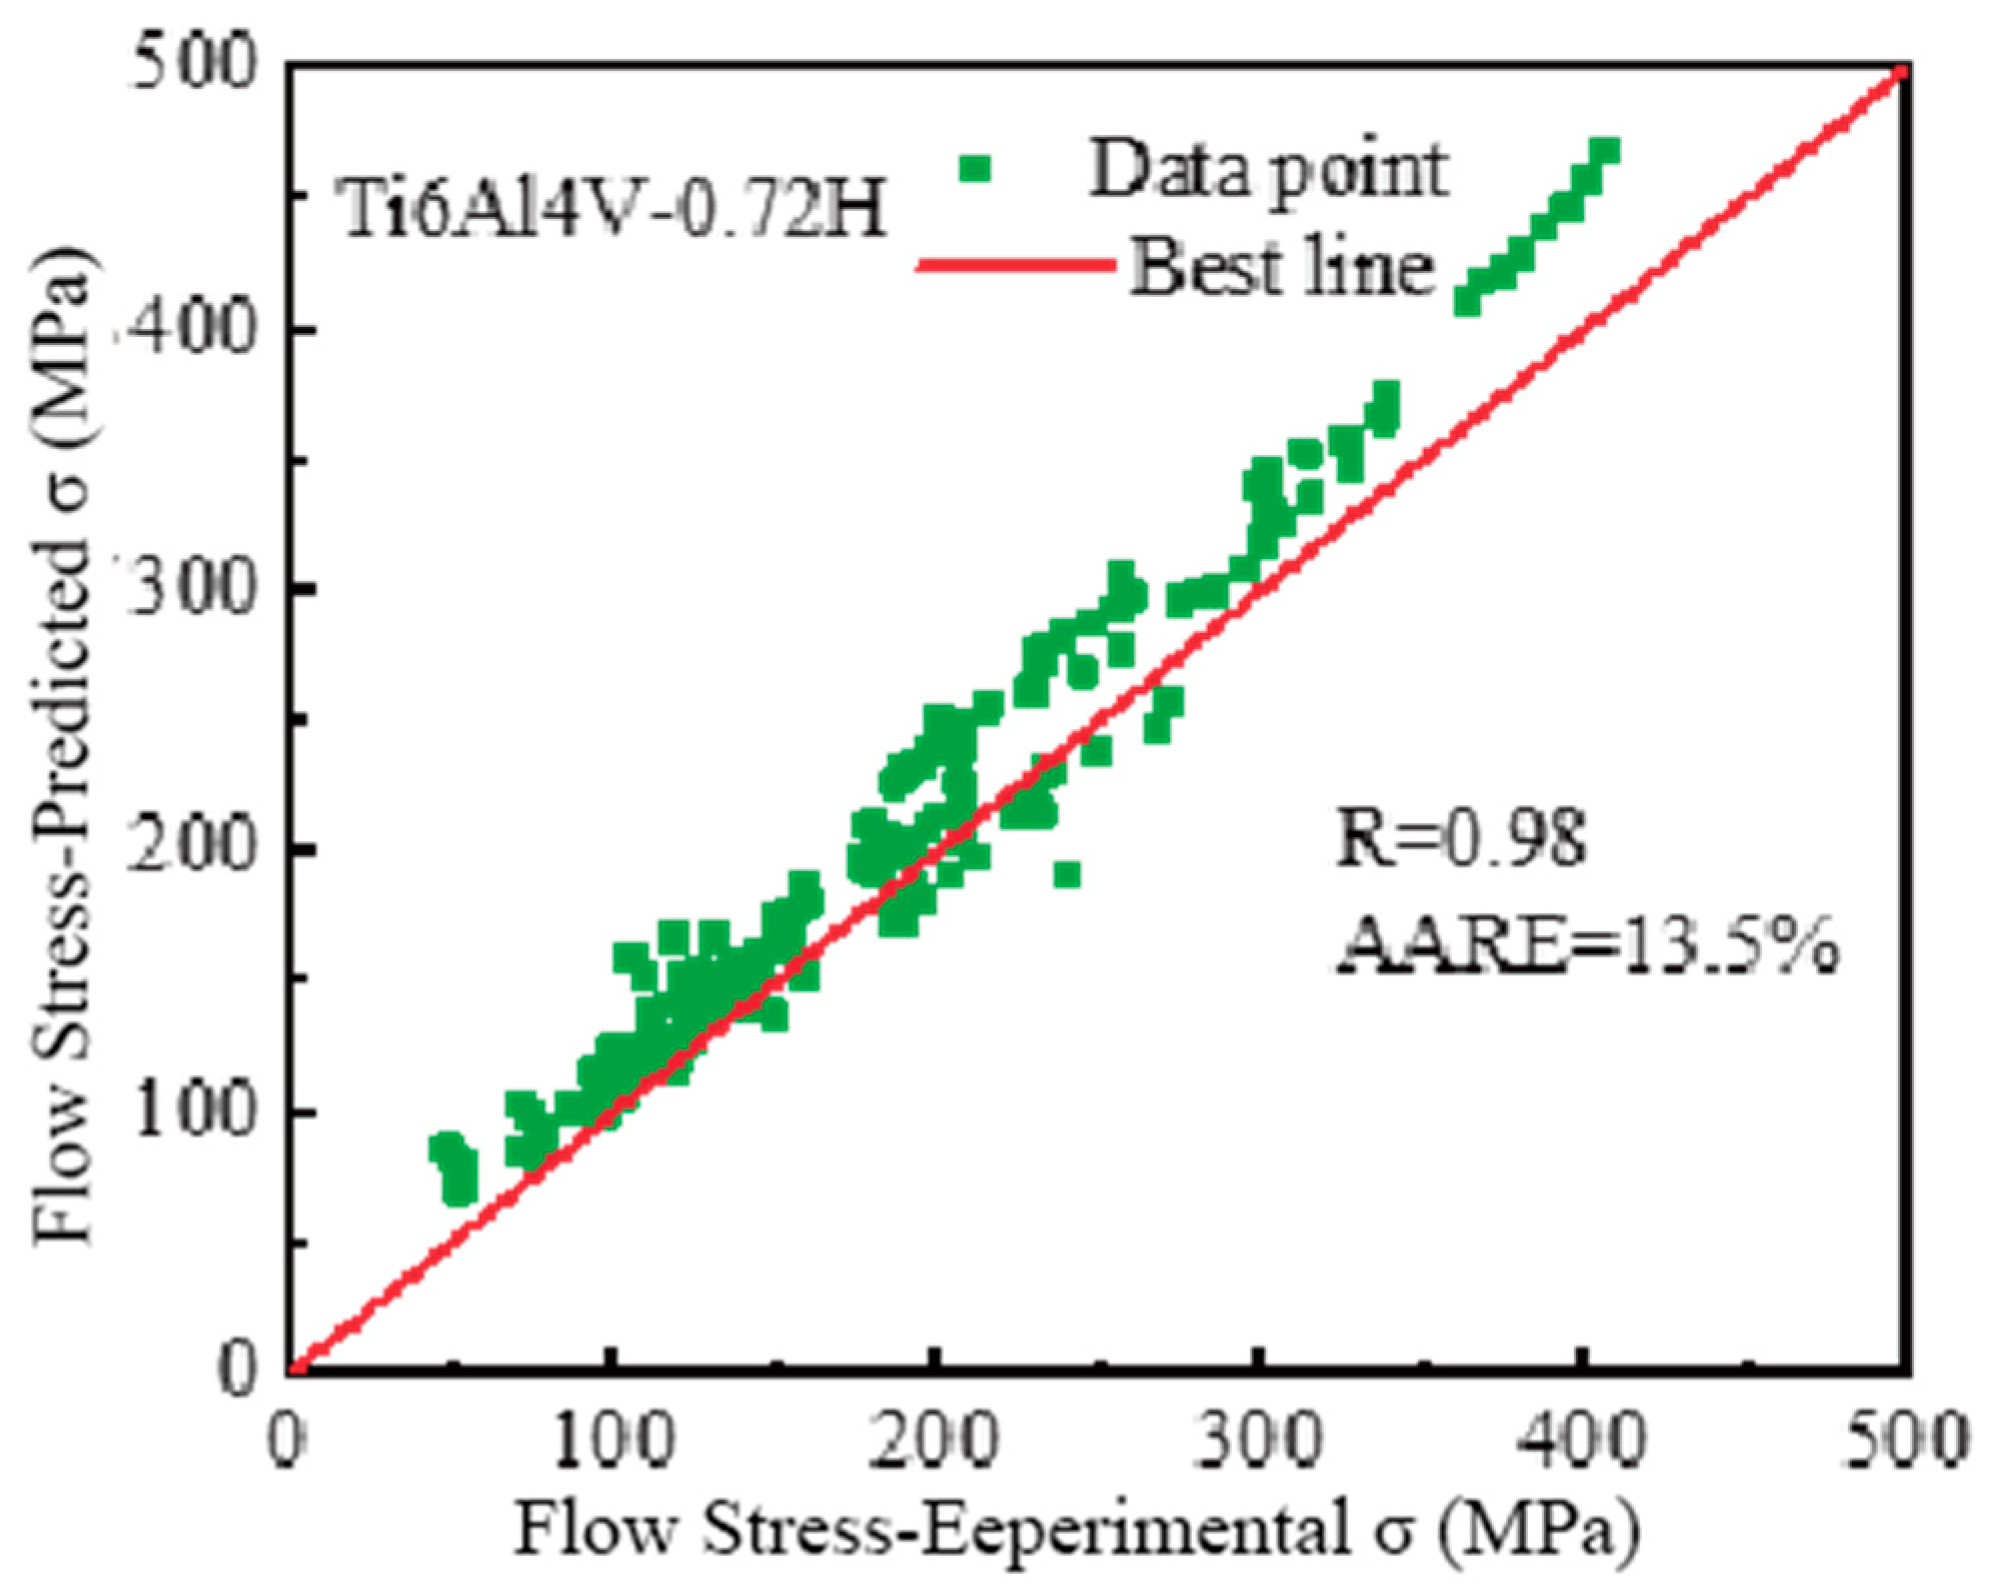
A regression model incorporating strain was developed to capture the curvilinear relationship among deformation parameters (including flow stress, deformation temperature and strain). The multiple linear regression model proposed was carefully analyzed, revealing a strong and accurate correlation between the experimental and predicted values. The correlation coefficient was determined to be 0.98, with an error margin of only 13.5%, indicating a high level of precision and reliability in the model.
(3)
The hot processing maps were calculated and plotted based on the stress–strain curves obtained from high-temperature deformation. A comparison of the two hot processing maps revealed an increased size in the flow instability zone of the alloy when the hydrogen content was 0.72 wt%. Finally, the optimal processing temperature range for Ti6Al4V was determined to be 940–980 °C, with a strain rate of 0.01–0.1 s−1, while for Ti6Al4V-0.72H, the recommended processing temperature range was 725–760 °C, with a strain rate of 0.01–1.5 s−1. This study will establish the theoretical foundation and optimize the processing parameters for thermal treatment of additively manufactured titanium and generation of titanium alloys.

Author Contributions

J.-H.S.: Investigation, Data curation, Software; H.G.: Conceptualization, Funding acquisition, Methodology, Writing-original draft; J.Z.: Resources, Data curation, Formal analysis, Validation; J.J.: Conceptualization, Methodology, Resources, Data curation, Resources; G.-Q.W.: Resources, Writing—review & editing, Supervision; Z.-G.S.: Validation, Writing-review & editing Methodology; Project administration. All authors have read and agreed to the published version of the manuscript.

Funding

This work was financially supported by 2023 Jiangsu Province Higher Education Excellent Science and Technology Innovation Team Supported Project: Laser Processing and Metal Additive Manufacturing Technology and Application, Qinglan Program of Jiangsu Province (Grant No. 2022-29), Natural Science Foundation of the Jiangsu Higher Education Institutions of China (Grant Nos. 21KJD460005, 21KJB460018), Priority Discipline Construction Program of Jiangsu Province (Grant No. 2022-2), Key cultivation projects for scientific research of Nantong Institute of Technology (Grant Nos. XKYPY202309, XKYPY202312).

Data Availability Statement

Data will be made available on request.

Conflicts of Interest

The authors declare that they have no known competing financial interests or personal relationships that could have appeared to influence the work reported in this paper.

References

  1. Schauerte, O. Titanium in automotive production. Adv. Eng. Mater. 2003, 5, 411–418. [Google Scholar] [CrossRef]
  2. Boyer, R.R. An overview on the use of titanium in the aerospace industry. Mater. Sci. Eng. A 1996, 213, 103–114. [Google Scholar] [CrossRef]
  3. Schutz, R.W.; Baxter, C.F.; Boster, P.L.; Fores, F.H. Applying titanium alloys in drilling and offshore production systems. JOM 2001, 53, 33–35. [Google Scholar] [CrossRef]
  4. Sehgal, A.K.; Juneja, C.; Singh, J.; Kalsi, S. Comparative analysis and review of materials properties used in aerospace Industries: An overview. Mater Today Proc. 2022, 48, 1609–1613. [Google Scholar] [CrossRef]
  5. Cui, C.; Hu, B.; Zhao, L.; Liu, S. Titanium alloy production technology, market prospects and industry development. Mater. Des. 2011, 32, 1684–1691. [Google Scholar] [CrossRef]
  6. Uhlmann, E.; Kersting, R.; Klein, T.B.; Cruz, M.F.; Borille, A.V. Additive manufacturing of titanium alloy for aircraft components. Procedia CIRP 2015, 35, 55. [Google Scholar] [CrossRef]
  7. Liu, S.; Shin, Y.C. Additive manufacturing of Ti6Al4V alloy: A review. Mater. Des. 2019, 164, 107552. [Google Scholar] [CrossRef]
  8. Fayazfar, H.; Salarian, M.; Rogalsky, A.; Sarker, D.; Russo, P.; Paserin, V.; Toyserkani, E. A critical review of powder-based additive manufacturing of ferrous alloys: Process parameters, microstructure and mechanical properties. Mater. Des. 2018, 144, 98–128. [Google Scholar] [CrossRef]
  9. Ngo, T.D.; Kashani, A.; Imbalzano, G.; Nguyen, K.T.; Hui, D. Additive manufacturing (3D printing): A review of materials, methods, applications and challenges. Compos. Part B Eng. 2018, 143, 172–196. [Google Scholar] [CrossRef]
  10. DebRoy, T.; Wei, H.L.; Zuback, J.S.; Mukherjee, T.; Elmer, J.W.; Milewski, J.O.; Beese, A.M.; Wilson-Heid, A.D.; De, A.; Zhang, W. Additive manufacturing of metallic components–process, structure and properties. Prog. Mater. Sci. 2018, 92, 112–224. [Google Scholar] [CrossRef]
  11. Kok, Y.; Tan, X.P.; Wang, P.; Nai, M.L.S.; Loh, N.H.; Liu, E.; Tor, S.B. Anisotropy and heterogeneity of microstructure and mechanical properties in metal additive manufacturing: A critical review. Mater. Des. 2018, 139, 565–586. [Google Scholar] [CrossRef]
  12. Carroll, B.E.; Palmer, T.A.; Beese, A.M. Anisotropic tensile behavior of Ti–6Al–4V components fabricated with directed energy deposition additive manufacturing. Acta Mater. 2015, 87, 309–320. [Google Scholar] [CrossRef]
  13. Gorunov, A.I. Additive manufacturing of Ti6Al4V parts using ultrasonic assisted direct energy deposition. J. Manuf. Process. 2020, 59, 545–556. [Google Scholar] [CrossRef]
  14. Meng, L.X.; Yang, H.J.; Ben, D.D.; Ji, H.B.; Lian, D.L.; Ren, D.C.; Li, Y.; Bai, T.S.; Cai, Y.S.; Chen, J.; et al. Effects of defects and microstructures on tensile properties of selective laser melted Ti6Al4V alloys fabricated in the optimal process zone. Mater. Sci. Eng. A 2022, 830, 142294. [Google Scholar] [CrossRef]
  15. Wu, B.; Pan, Z.; Ding, D.; Cuiuri, D.; Li, H. Effects of heat accumulation on microstructure and mechanical properties of Ti6Al4V alloy deposited by wire arc additive manufacturing. Addit. Manuf. 2018, 23, 151–160. [Google Scholar] [CrossRef]
  16. Colegrove, P.A.; Coules, H.E.; Fairman, J.; Martina, F.; Kashoob, T.; Mamash, H.; Cozzolino, L.D. Microstructure and residual stress improvement in wire and arc additively manufactured parts through high-pressure rolling. J. Mater. Process. Technol. 2013, 213, 1782–1791. [Google Scholar] [CrossRef]
  17. Kobryn, P.A.; Moore, E.H.; Semiatin, S.L. The effect of laser power and traverse speed on microstructure, porosity, and build height in laser-deposited Ti-6Al-4V. Scr. Mater. 2000, 43, 299–305. [Google Scholar] [CrossRef]
  18. Kooi, B.J.; Pei, Y.T.; De Hosson JT, M. The evolution of microstructure in a laser clad TiB–Ti composite coating. Acta Mater. 2003, 51, 831–845. [Google Scholar] [CrossRef]
  19. Pouzet, S.; Peyre, P.; Gorny, C.; Castelnau, O.; Baudin, T.; Brisset, F.; Colin, C.; Gadaud, P. Additive layer manufacturing of titanium matrix composites using the direct metal deposition laser process. Mater. Sci. Eng. A 2016, 677, 171–181. [Google Scholar] [CrossRef]
  20. Gu, D.; Wang, Z.; Shen, Y.; Li, Q.; Li, Y. In-situ TiC particle reinforced Ti–Al matrix composites: Powder preparation by mechanical alloying and selective laser melting behavior. Appl. Surf. Sci. 2009, 255, 9230–9240. [Google Scholar] [CrossRef]
  21. Qin, L.; Wang, W.; Yang, G.; Bian, H. Development of an ultrasonic vibration system for laser deposition molding. Manuf. Technol. Mach. Tool 2013, 50–54. [Google Scholar]
  22. Qi, Y. Study on Strengthening Technology of Nickel-Based High-Temperature Alloy by Laser Rapid Prototyping Based on Ultrasonic Shock. Master’s Thesis, Nanjing University of Aeronautics and Astronautics, Nanjing, China, 2014. [Google Scholar]
  23. Martina, F.; Colegrove, P.A.; Williams, S.W.; Meyer, J. Microstructure of interpass rolled wire+ arc additive manufacturing Ti-6Al-4V components. Metall. Mater. Trans. A 2015, 46, 6103–6118. [Google Scholar] [CrossRef]
  24. Han, X. First-Principles Calculations and Molecular Dynamics Simulations of the Role of Hydrogen in Titanium Crystals. Ph.D. Thesis, Harbin Institute of Technology, Harbin, China, 2010. [Google Scholar]
  25. Bao, C. Study on the Room Temperature Modification Mechanism of Ti6Al4V Alloy with Hydrogen Placement. Master’s Thesis, Harbin Institute of Technology, Harbin, China, 2008. [Google Scholar]
  26. Doğu, M.N.; Esen, Z.; Davut, K.; Tan, E.; Gümüş, B.; Dericioglu, A.F. Microstructural and texture evolution during thermo-hydrogen processing of Ti6Al4V alloys produced by electron beam melting. Mater. Charact. 2020, 168, 110549. [Google Scholar] [CrossRef]
  27. Liu, S.; Zhang, Z.; Xiao, S.; Chen, Y. Effect of hydrogenation on microstructure evolution, mechanical and electrochemical properties of pure titanium. J. Alloys Compd. 2019, 781, 1139–1149. [Google Scholar] [CrossRef]
  28. Zhang, Y.; Zhang, S.Q. Hydrogenation characteristics of Ti-6Al-4V cast alloy and its microstructural modification by hydrogen treatment. Int. J. Hydrogen Energy 1997, 22, 161–168. [Google Scholar] [CrossRef]
  29. Kai, X.; Chen, C.; Sun, X.; Wang, C.; Zhao, Y. Hot deformation behavior and optimization of processing parameters of a typical high-strength Al–Mg–Si alloy. Mater. Des. 2016, 90, 1151–1158. [Google Scholar] [CrossRef]
  30. Seshacharyulu, T.; Medeiros, S.C.; Frazier, W.G.; Prasad, Y.V.R.K. Hot working of commercial Ti–6Al–4V with an equiaxed α–β microstructure: Materials modeling considerations. Mater. Sci. Eng. A 2000, 284, 184–194. [Google Scholar] [CrossRef]
  31. Li, M.; Bo, C.; Zhang, Z.; Zhao, J.; Xu, D.; Wang, Y. High-temperature thermal deformation behavior of TC2 titanium alloy. Chin. J. Mater. Res. 2021, 34, 892–904. [Google Scholar]
  32. Lin, Y.C.; Chen, X.M. A critical review of experimental results and constitutive descriptions for metals and alloys in hot working. Mater. Des. 2011, 32, 1733–1759. [Google Scholar] [CrossRef]
  33. Souza, P.M.; Beladi, H.; Singh, R.; Rolfe, B.; Hodgson, P.D. Constitutive analysis of hot deformation behavior of a Ti6Al4V alloy using physical based model. Mater. Sci. Eng. A 2015, 648, 265–273. [Google Scholar] [CrossRef]
  34. Zeng, Z.; Jonsson, S.; Zhang, Y. Constitutive equations for pure titanium at elevated temperatures. Mater. Sci. Eng. A 2008, 505, 116–119. [Google Scholar] [CrossRef]
  35. Peng, W.; Zeng, W.; Wang, Q.; Yu, H. Comparative study on constitutive relationship of as-cast Ti60 titanium alloy during hot deformation based on Arrhenius-type and artificial neural network models. Mater. Des. 2013, 51, 95–104. [Google Scholar] [CrossRef]
  36. Mosleh, A.; Mikhaylovskaya, A.; Kotov, A.; Pourcelot, T.; Aksenov, S.; Kwame, J.; Portnoy, V. Modelling of the Superplastic Deformation of the Near-α Titanium Alloy (Ti-2.5Al-1.8Mn) Using Arrhenius-Type Constitutive Model and Artificial Neural Network. Metals 2017, 7, 568. [Google Scholar] [CrossRef]
  37. Bodunrin, M.O. Flow stress prediction using hyperbolic-sine Arrhenius constants optimised by simple generalised reduced gradient refinement. J. Mater. Res. Technol. 2020, 9, 2376–2386. [Google Scholar] [CrossRef]
  38. Zhang, C.; Li, X.Q.; Li, D.S.; Jin, C.H.; Xiao, J.J. Modelization and comparison of Norton-Hoff and Arrhenius constitutive laws to predict hot tensile behavior of Ti–6Al–4V alloy. Trans. Nonferrous Met. Soc. China 2012, 22, s457–s464. [Google Scholar] [CrossRef]
  39. Qi, F.; Yao, J.; Dai, G.; Chen, X.; Guo, Y.; Sun, Z.; Wang, Y.; Liu, H. Effect of hydrogen on the microstructure and mechanical properties of high temperature deformation of Ti6Al4V additive manufactured. Int. J. Hydrogen Energy 2023, 48, 15292–15302. [Google Scholar] [CrossRef]
  40. Satheesh Kumar, S.S.; Raghu, T.; Bhattacharjee, P.P.; Appa Rao, G.; Borah, U. Constitutive modeling for predicting peak stress characteristics during hot deformation of hot isostatically processed nickel-base superalloy. J. Mater. Sci. 2015, 50, 6444–6456. [Google Scholar] [CrossRef]
  41. Zong, Y.; Liang, Y.; Yin, Z.W. Effects of hydrogen addition on the high temperature deformation behavior of TC21 titanium alloy. Int. J. Hydrogen Energy 2012, 37, 13631–13637. [Google Scholar] [CrossRef]
  42. Wang, Z.; Zhang, S.; Qi, G.; Wang, F.; Li, Y. The intrinsic equation of thermal deformation of AZ31 magnesium alloy. Chin. J. Nonferrous Met. 2008, 18, 1977–1982. [Google Scholar]
  43. Mirzadeh, H.; Najafizadeh, A.; Moazeny, M. Flow curve analysis of 17-4 PH stainless steel under hot compression test. Metall. Mater. Trans. A 2009, 40, 2950–2958. [Google Scholar] [CrossRef]
  44. Roostaei, M.; Parsa, M.H.; Mahmudi, R.; Mirzadeh, H. Hot compression behavior of GZ31 magnesium alloy. J. Alloys Compd. 2015, 631, 1–6. [Google Scholar] [CrossRef]
  45. Peng, X.; Guo, H.; Shi, Z.; Qin, C.; Zhao, Z. Constitutive equations for high temperature flow stress of TC4-DT alloy incorporating strain, strain rate and temperature. Mater. Des. 2013, 50, 198–206. [Google Scholar] [CrossRef]
  46. Sajadi, S.A.; Toroghinejad, M.R.; Rezaeian, A.; Ebrahimi, G.R. A study of hot compression behavior of an as-cast FeCrCuNi2Mn2 high-entropy alloy. J. Alloys Compd. 2022, 896, 162732. [Google Scholar]
Figure 1. Schematic diagram of specimen preparation via laser melting deposition.
Crystals 14 00345 g001
Figure 2. Microstructures of different hydrogen contents at 80 °C and 0.01 s−1 above the phase transformation point: (a) Ti6Al4V, (b) Ti6Al4V-0.72H.
Crystals 14 00345 g002
Figure 3. Stress–strain curves of Ti6Al4V: (a) 0.01 s−1, (b) 0.1 s−1, (c) 1 s−1, (d) 10 s−1.
Crystals 14 00345 g003
Figure 4. Stress–strain curves of Ti6Al4V-0.72H: (a) 0.01 s−1, (b) 0.1 s−1, (c) 1 s−1, (d) 10 s−1.
Crystals 14 00345 g004
Figure 5. Relationship between strain and peak stresses during hot deformation of Ti6Al4V-0.72H specimens: (a) σ l n ε ˙ , (b) l n σ l n ε ˙ , (c) l n s i n h α σ l n ε ˙ .
Crystals 14 00345 g005
Figure 6. Relationships between deformation temperature and peak stress during hot deformation of Ti6Al4V-0.72H specimens: (a) σ 1000 / T , (b) l n σ 1000 / T , (c) l n s i n h α σ 1000 / T .
Crystals 14 00345 g006
Figure 7. Plot of the relationship between lnZ and ln[sinh(α σ )] for Ti6Al4V-0.72H specimens.
Crystals 14 00345 g007
Figure 8. Curves of the relationship between strain and different parameters in the equation of the multiple linear regression model: (a) M ε , (b) N ε , (c) P ε .
Crystals 14 00345 g008
Figure 9. Comparison of simulated and experimental values at different deformation temperatures (a) 725 °C; (b) 765 °C; (c) 805 °C; (d) 845 °C; (e) 885 °C.
Crystals 14 00345 g009
Figure 10. Correlation between experimental and predicted values of the Ti6Al4V-0.72H alloy.
Crystals 14 00345 g010
Figure 11. Hot processing maps of alloys with different hydrogen contents: (a) Ti6Al4V, (b) Ti6Al4V-0.72H.
Crystals 14 00345 g011
Table 1. Different applications of the three models.
ModelsReferencesSpecificities
Mechanistic models[33]This model does not call for detailed understanding of the physical phenomena, and the constitutive relationship between the flow stress and process variables can be determined by the regression analysis.
Phenomenology models[34,35]This model takes into account the thermal deformation mechanism of metal in the deformation process, which includes work hardening due to dislocation and dislocation interactions, and dynamic softening ascribed to thermal activation.
Artificial neural network models[36]This model is best suited to solving problems, which are most difficult to solve using traditional computational methods.
Table 2. Chemical composition of Ti6Al4V and Ti6Al4V-0.72H [39].
TiCFeAlOHNSiV
Ti6Al4VBal.0.060.156.020.160.0090.030.044
Ti6Al4V-0.72HBal.0.050.216.130.30.7220.040.044
Table 3. Experimental parameters of high-temperature compression.
Hydrogen Contents (wt%)Deformation Temperature (°C)Strain (s−1)Deformation Quantity (%)
0H820, 860, 900, 940, 9800.01, 0.1, 1, 1060
0.72H725, 765, 805, 845, 8850.01, 0.1, 1, 1060
Table 4. Peak stresses of Ti6Al4V-0.72H under different deformation conditions (MPa).
Temperature (°C)Strain Rates (s−1)Peak Stresses (MPa)
7250.01244
0.1273
1326
10406
7650.01167
0.1200
1256
10341
8050.01102
0.1126
1197
10260
8450.0171
0.1110
1160
10190
8850.0149
0.197
1137
10172
Disclaimer/Publisher’s Note: The statements, opinions and data contained in all publications are solely those of the individual author(s) and contributor(s) and not of MDPI and/or the editor(s). MDPI and/or the editor(s) disclaim responsibility for any injury to people or property resulting from any ideas, methods, instructions or products referred to in the content.

