

Aging Effects in Zr(Fe0.5V0.5)2 Tritides

1
Institute for Plasma Science and Technology, National Research Council, Via R. Cozzi 53, 20125 Milan, Italy
2
Independent Researcher, 138 Locust Hill Drive, Rochester, NY 14618, USA
*
Author to whom correspondence should be addressed.
Crystals 2024, 14(2), 159; https://doi.org/10.3390/cryst14020159
Submission received: 18 December 2023
/
Revised: 22 January 2024
/
Accepted: 23 January 2024
/
Published: 1 February 2024
(This article belongs to the Special Issue Hydrogen Embrittlement of Metals)
Abstract
:We report an experimental study on the tritiding capabilities over a long period of the intermetallic compound Zr(Fe0.5V0.5)2. The study was carried out with the prospect of using the alloy as a chemical converter to reduce HTO. Two identical getter beds, containing 1 gram of alloy in powder form each, were used in the experiments. While one of them was exploited to determine the tritium isotherms of the virgin alloy, the other bed was loaded at 75% of stoichiometry with 354 Ci of tritium and left to age for 1500 days. The bed was then unloaded and the isotherms of the aged alloy were determined twice to check the repeatability. The main results of the work are that, while enthalpy and entropy changes for tritium dissolution at infinite dilution are practically the same for the fresh alloy and the aged alloy, they vary significantly when the isotherms are determined on the aged alloy at a large enough distance of time (one week). This behavior is ascribed to the He3 present in the interstitial sites. However, the fact that the solubility of the alloy decreases with aging suggests that the He3 present either in the interstitial sites or in bubbles subtracts sites for dissolution. Also to be stressed is that in the tritide-forming region, these thermodynamic values decrease with aging in a monotonic way. This different behavior is tentatively explained by invoking the nature of the tritium bond.
1. Introduction
The intermetallic compound Zr(Fe0.5V0.5)2 (Getter Alloy St 737 by SAES Getters SpA) has long been investigated as a reversible metal hydride for tritium storage in fusion facilities, as well as a chemical converter to reduce HTO and successively recover tritium [1,2,3]. The importance of both aspects, i.e., tritiated water reduction and the tritiding capabilities of the alloy over a long period of time, has been stressed. In this work, we address in particular the question of the tritiding aspect of the alloy in fresh and aged conditions. In this frame, an experimental study has been carried out to investigate the effects of aging on the thermodynamic behavior of Zr(Fe0.5V0.5)2 tritide. Aging effects have been widely studied in metal tritides suitable for tritium storage [4,5,6], but no ascertainable aging studies vis-à-vis hydride formers as chemical converters are available thus far. Two of the major concerns in this respect are the increase in the equilibrium pressure with aging, which directly affects the purpose of storage, and the progressive acceleration in the release of He3, which can lead to overpressures higher than the design pressure in the bed. As far as the chemical converter application is concerned, tritium release is no problem because it is liberated during the reduction of the tritiated species, and helium is not expected to generate an overpressure, the converter being designed to operate at a low tritium residual inventory [7]. In contrast, the decrease in the equilibrium pressure with respect to plateau pressures with aging and the appearance of deep-trapped tritium, removable only by exchange with protium or deuterium, as in the case of LaNi4.25Al0.75 [6], can deteriorate the functionality of the converter, as less tritium is extracted during the process. The purpose of this study is to guide the design of a chemical converter or a getter bed for storage, based on this promising alloy, providing in advance the effects of aging on the performance of tritium recovery [8].
The work is organized as follows. In Section 2, we describe the experimental apparatus, and the procedure follows. In Section 3, we present the experimental results. In Section 4.1, we report on the dissolution of protium and tritium and on the hydride-forming region on the virgin alloy. In Section 4.2, we discuss the effects of aging in terms of He3 production release and changes in the dissolution and hydride-forming of tritium. A discussion on the enthalpy and entropy changes from the values obtained for the virgin alloy due to the presence of He3 is also provided. Finally, in Section 5, the main implications of our results on the application of the alloy are discussed and some conclusions are drawn. Details of the calculation of the thermodynamic quantities are reported in the separate Appendix A. The list of symbols is included at the end of the manuscript.
2. Materials and Methods
The experiment was carried out in the Tritium Laboratory of Ontario Hydro Technologies, Toronto, Canada, using two identical getter beds containing 1 g of alloy in powder form. The Zr(Fe0.5V0.5)2 intermetallic compound has been previously characterized by inductively plasma atomic emission spectroscopy, as reported in Table 1. The stoichiometric hydrogen to alloy ratio reported by the manufacturer is 3.2.
Figure 1 shows a cutaway view of the bed. To improve the adsorption kinetic, the alloy of both beds was previously conditioned via hydrogen loading sequences using a UHV hydrogen facility. The UHV hydrogen facility consists of a calibrated volume connected to several vacuum gauges in order to cover the whole pressure range of interest. The getter bed can be valved in and out from the rest of the loop. A loading sequence involves filling the calibrated volume with hydrogen at a fixed pressure (fixed amount of hydrogen), with the bed valved out, in order to reach the stoichiometric capacity of 3.2. Then, the system is isolated from the pumping and the bed is valved in. The evolution of the pressure and temperature are recoreded via dedicated software. When the pressure does not change (less than 0.5% of the reading), the loading is completed and the system is evacuated and the bed unloaded and ready for a new loading. A preliminary bake out at 500 °C for several hours while maintaining the alloy under vacuum is followed by several loading sequences. During the bake out, the oxygen present at the surface of the alloy can diffuse into the bulk leaving more sites available to adsorb hydrogen. During the loading sequence, the hydrogen adsorbed produces a stress in the alloy such that it decrepitates in finer grains increasing the effective surface area. The loading sequence is repeated (7 times for this alloy) until further improvement in the loading performance cannot be detected. After unloading the beds and placing them in a tritium test loop, PCT measurements are carried out admitting fixed quantities of tritium in the bed and cycling in temperature (isochores). The tritium test loop replicates the hydrogen UHV system but is further equipped with a quadrupole mass spectrometer and a ionization chamber and a certified tritium stack monitor for tritium accountancy. The tritium is admitted in the bed by heating a Uranium storage bed and filling a calibrated volume. The test bed is unloaded by heating and connecting it to the Uraniun bed at room temperature. The residual tritium in the loop is pumped away by a scavenger bed before the system is evacuated [9]. While the first bed is used to determine the tritium isotherms of the fresh alloy, referred in the text as the unaged reference (UR), the second bed is taken as time 0 for aging and loaded with 354 Ci of tritium, which corresponds to a tritium over alloy ratio T/A = 2.4. Then, the second bed is backfilled with 1 atmosphere of helium, isolated and left to age. A total of 1500 days after loading, the bed is opened and unloaded to obtain a first set of aged isotherms. In the following, this first set is referred to as Aged1 bed data. Finally, the bed is unloaded and the isotherms determined again 7 days later to check for any further changes. This second set is referred to as Aged2 bed data. The isochores are measured both during the heating and cooling of the bed at the same temperature. The pressure change in the two cases is only a few percent. We present in the figures the isotherms determined during the cooling because they are more representative of the adsorption.
3. Results
Figure 2 shows the tritium adsorption isotherms for the UR alloy. The hydrogen data taken from ref. [1] are also plotted for comparison. For both isotopes, no appreciable differences were observed in the equilibrium pressures during the adsorption and desorption cycles. The pressures were systematically corrected for gas temperature, isotope concentration and He3 background in tritium. The tritium pressures were always higher than the hydrogen pressures at equal temperatures and concentrations.
In Figure 3 and Figure 4, the isotherms of the UR bed and the Aged1 bed, and between the Aged1 and Aged2 beds, are compared. The higher pressures for the aged beds, at the same concentration and temperature, clearly indicate a progressive release of tritium with the aging time. As for the UR case, no hysteresis was noticed between the adsorption and desorption cycles.
4. Discussion
4.1. Hydrogen and Tritum: The Virgin Alloy
4.1.1. Solubility in the Alloy
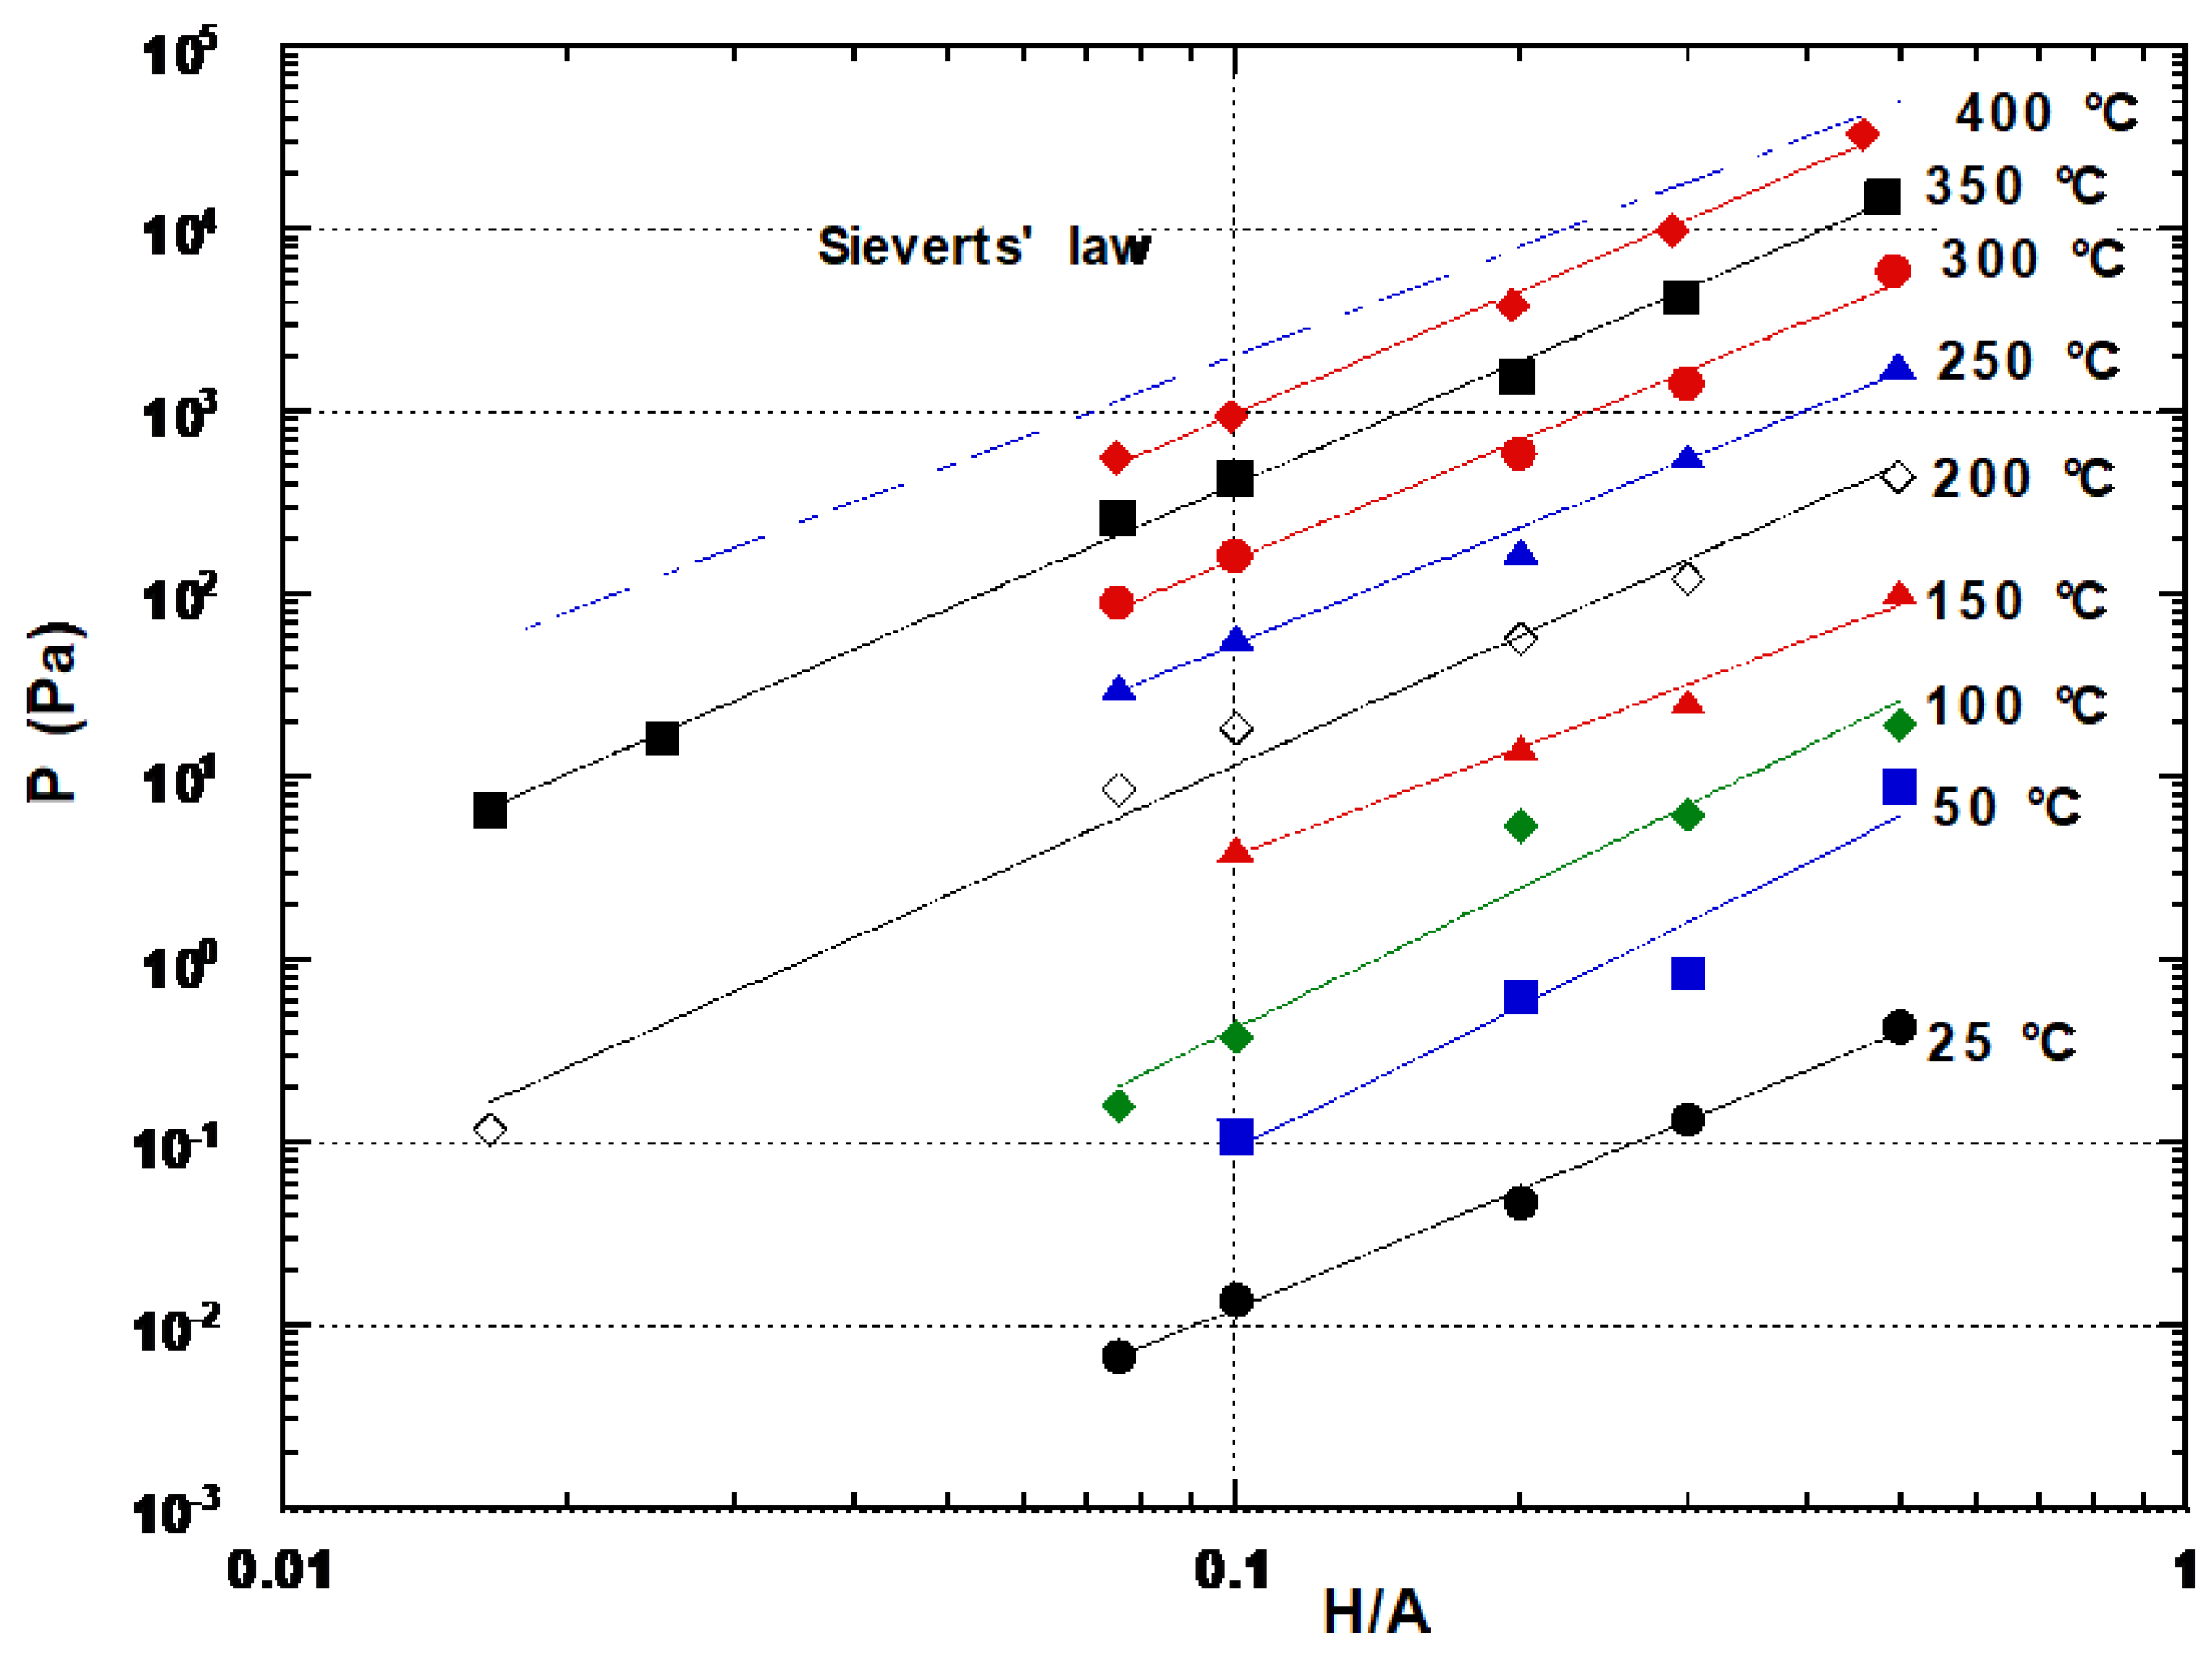
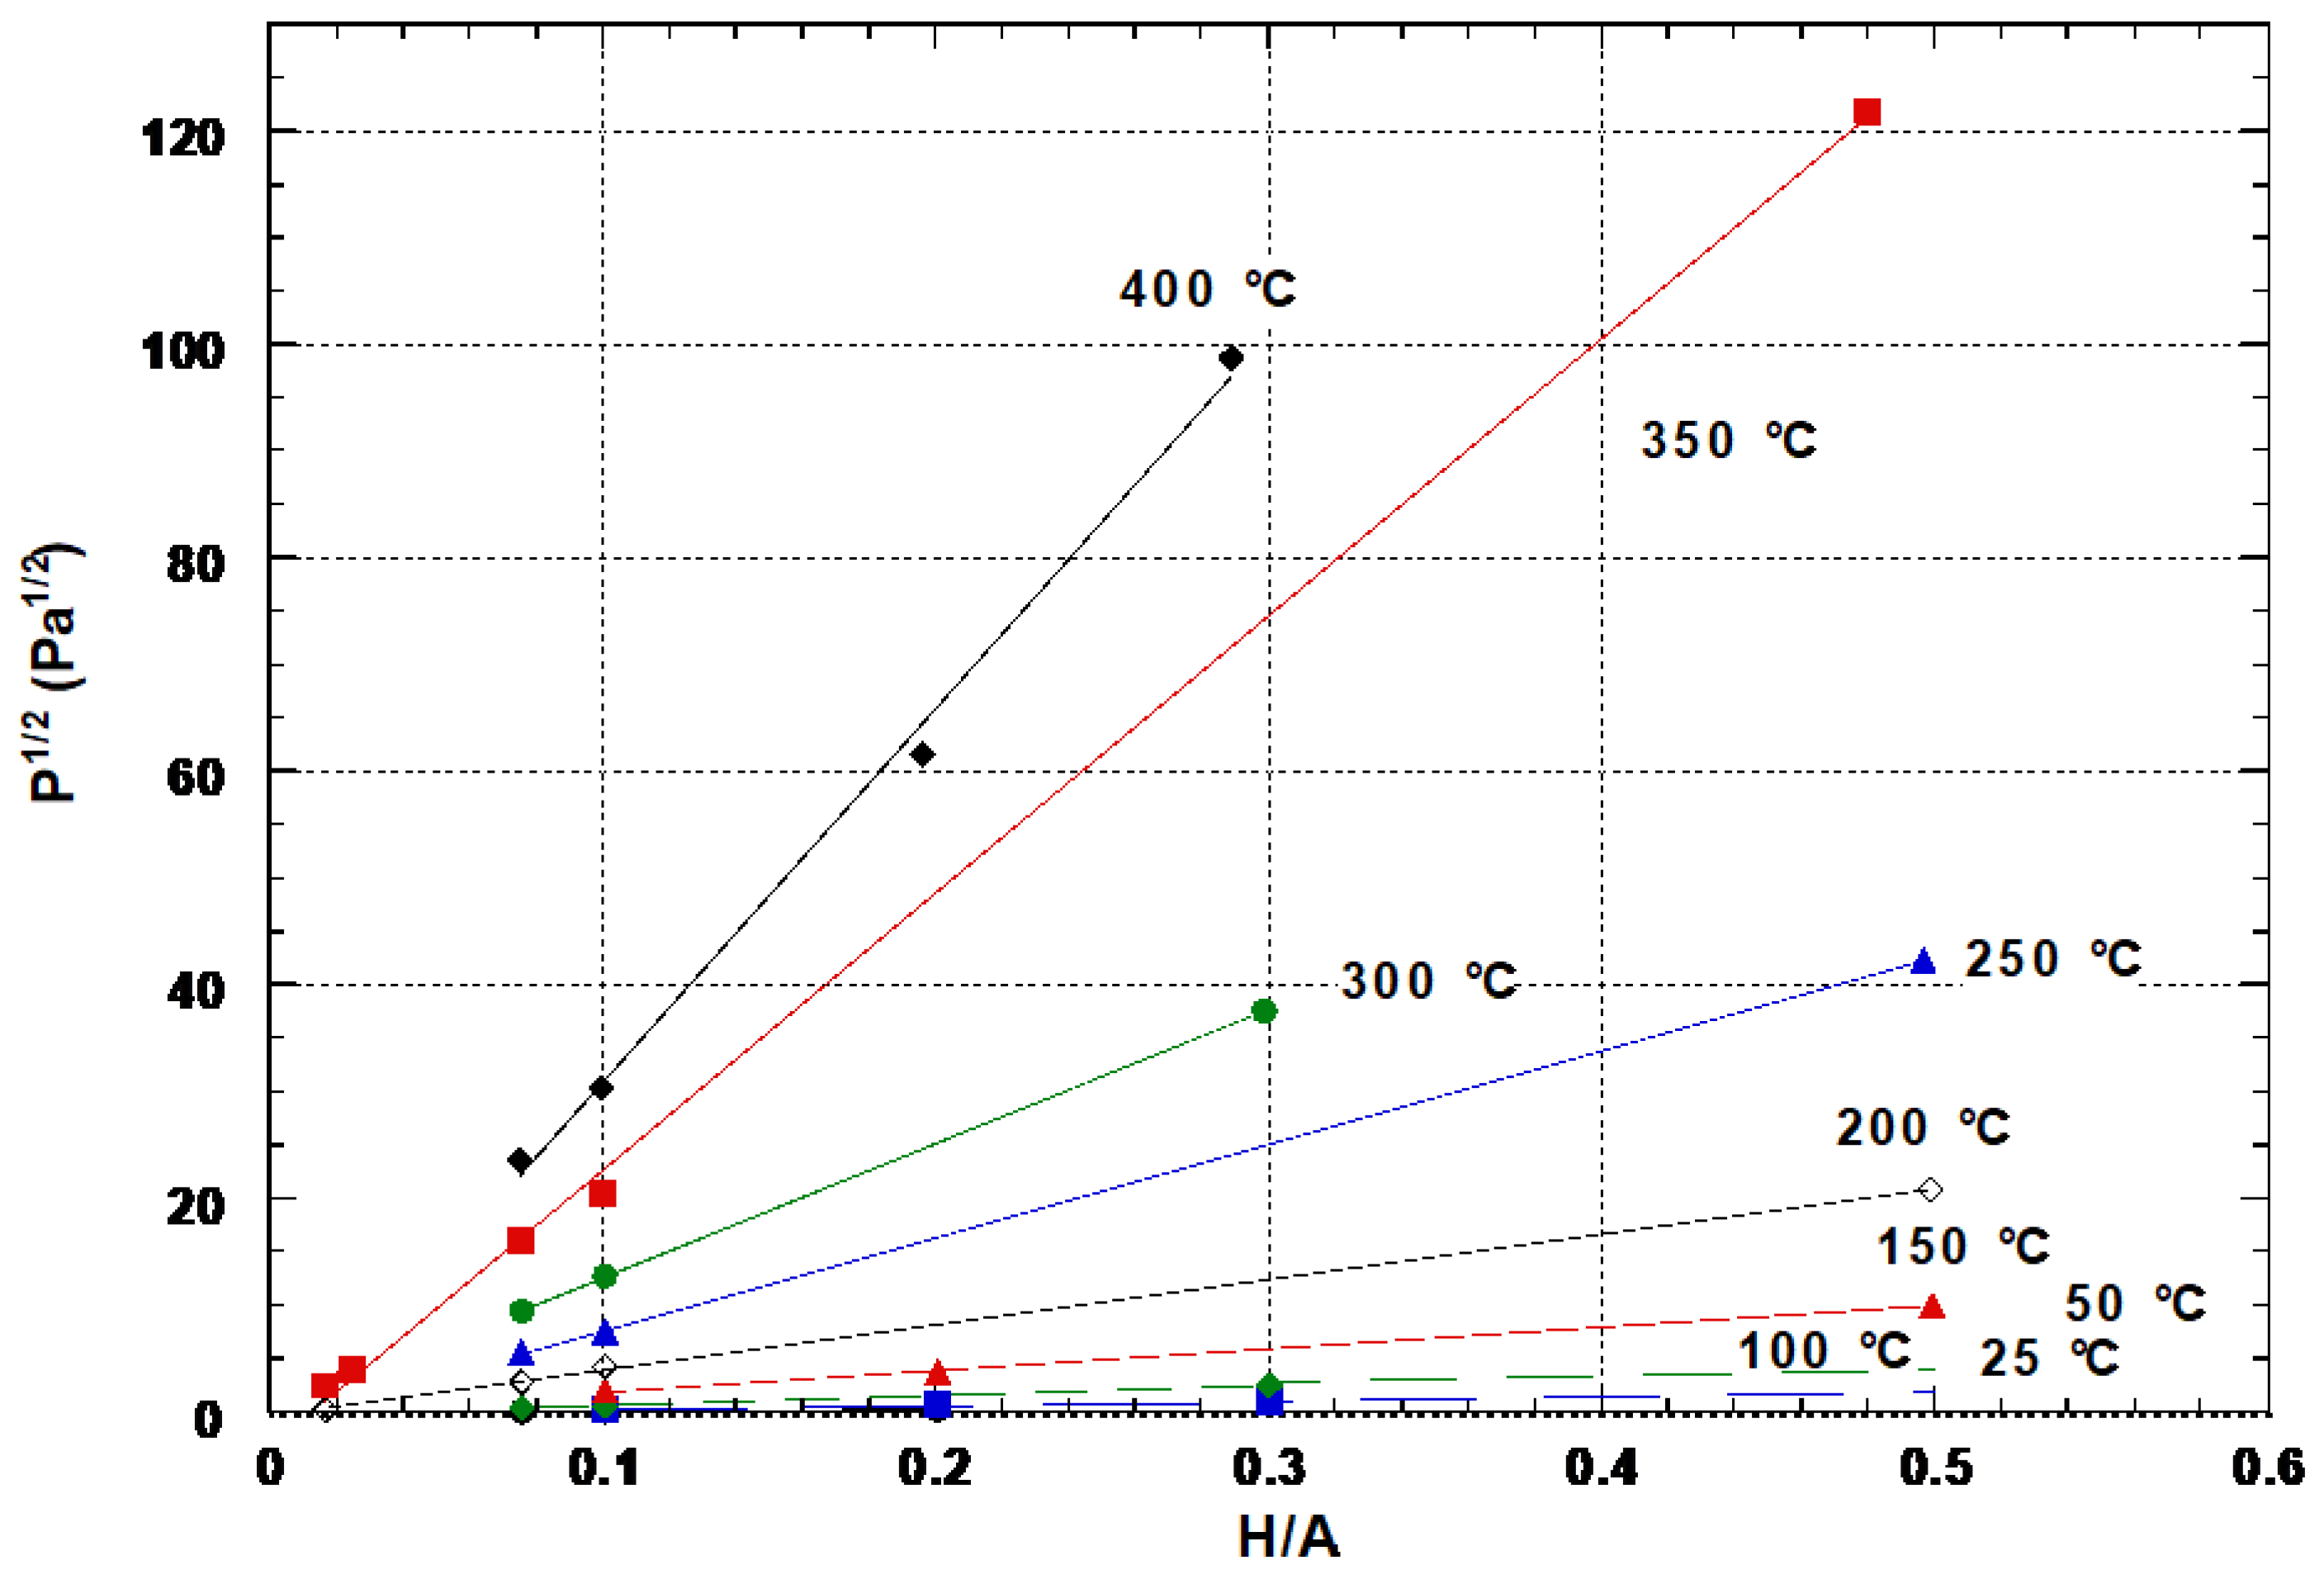
Examining the solubility of the alloy at low concentrations gives an insight of how hydrogen and tritium can dissolve in the lattice and occupy the interstices available. In Figure 5 and Figure 6, the solubilities for hydrogen and tritium for temperatures between 25 and 400 °C are shown on a log-log plot. In the figures, the dashed lines have a slope of 2 which reflects the ideal Sieverts’ behavior.
The well-known dependence:
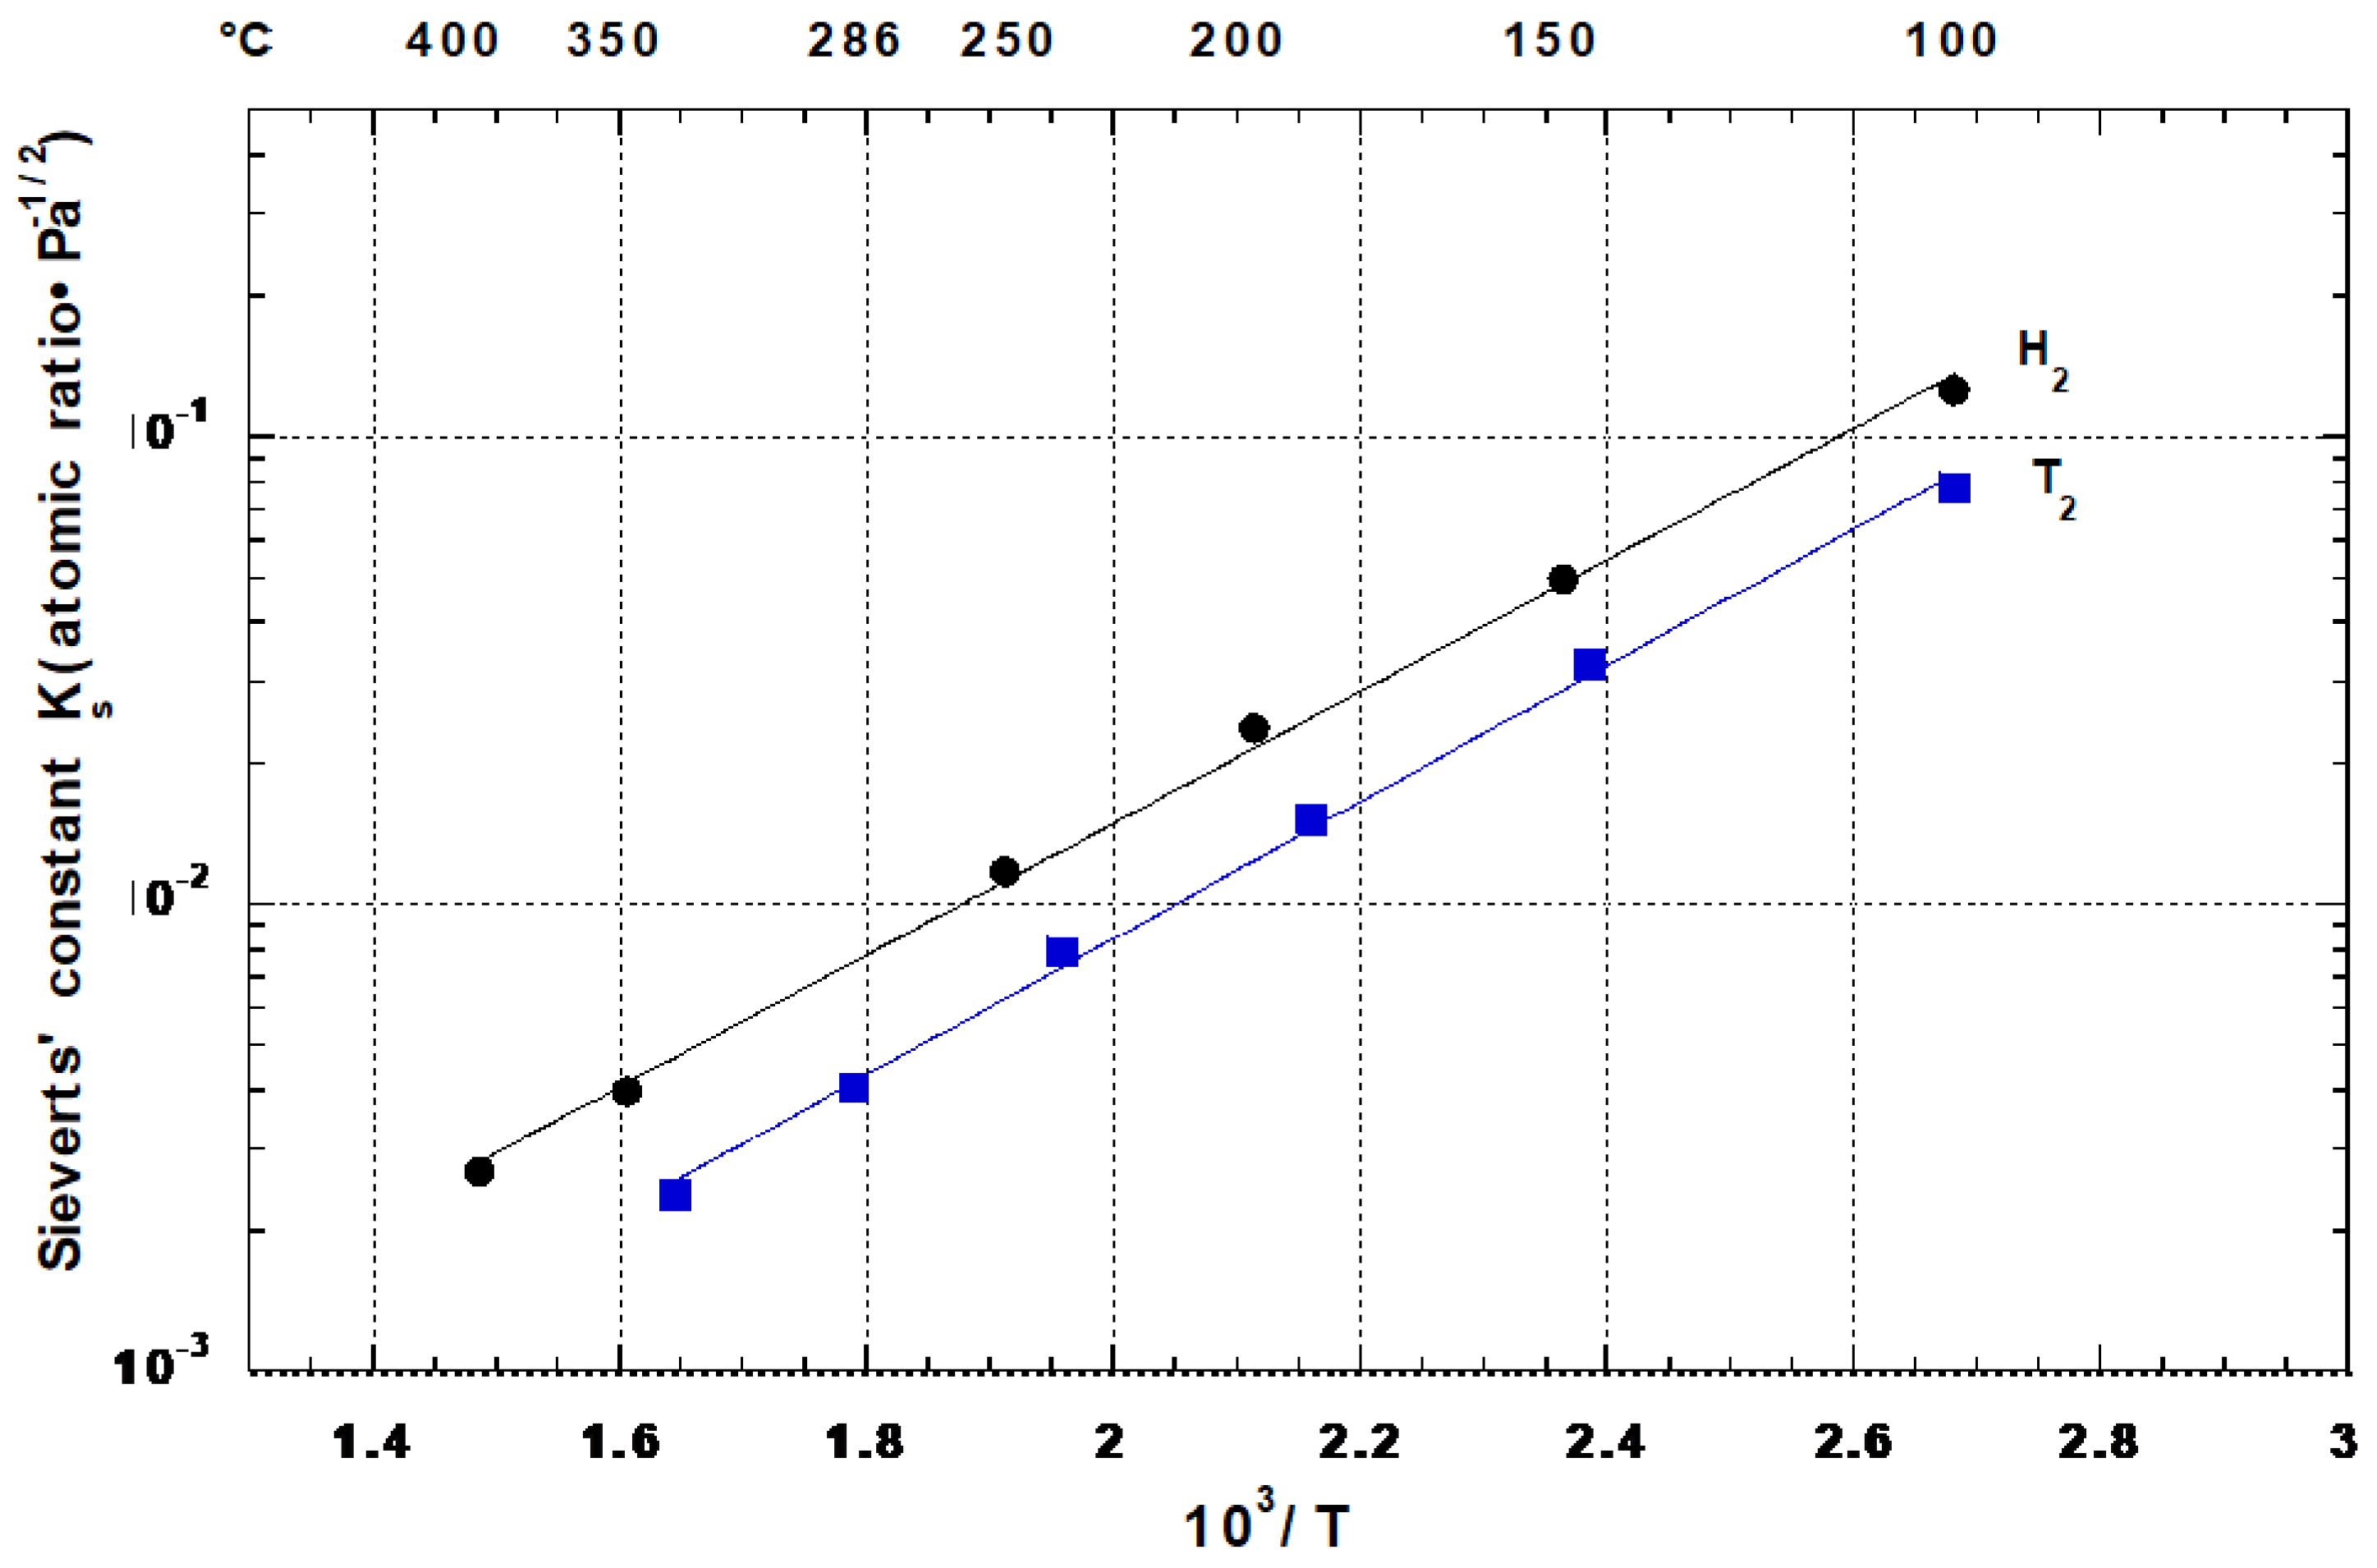
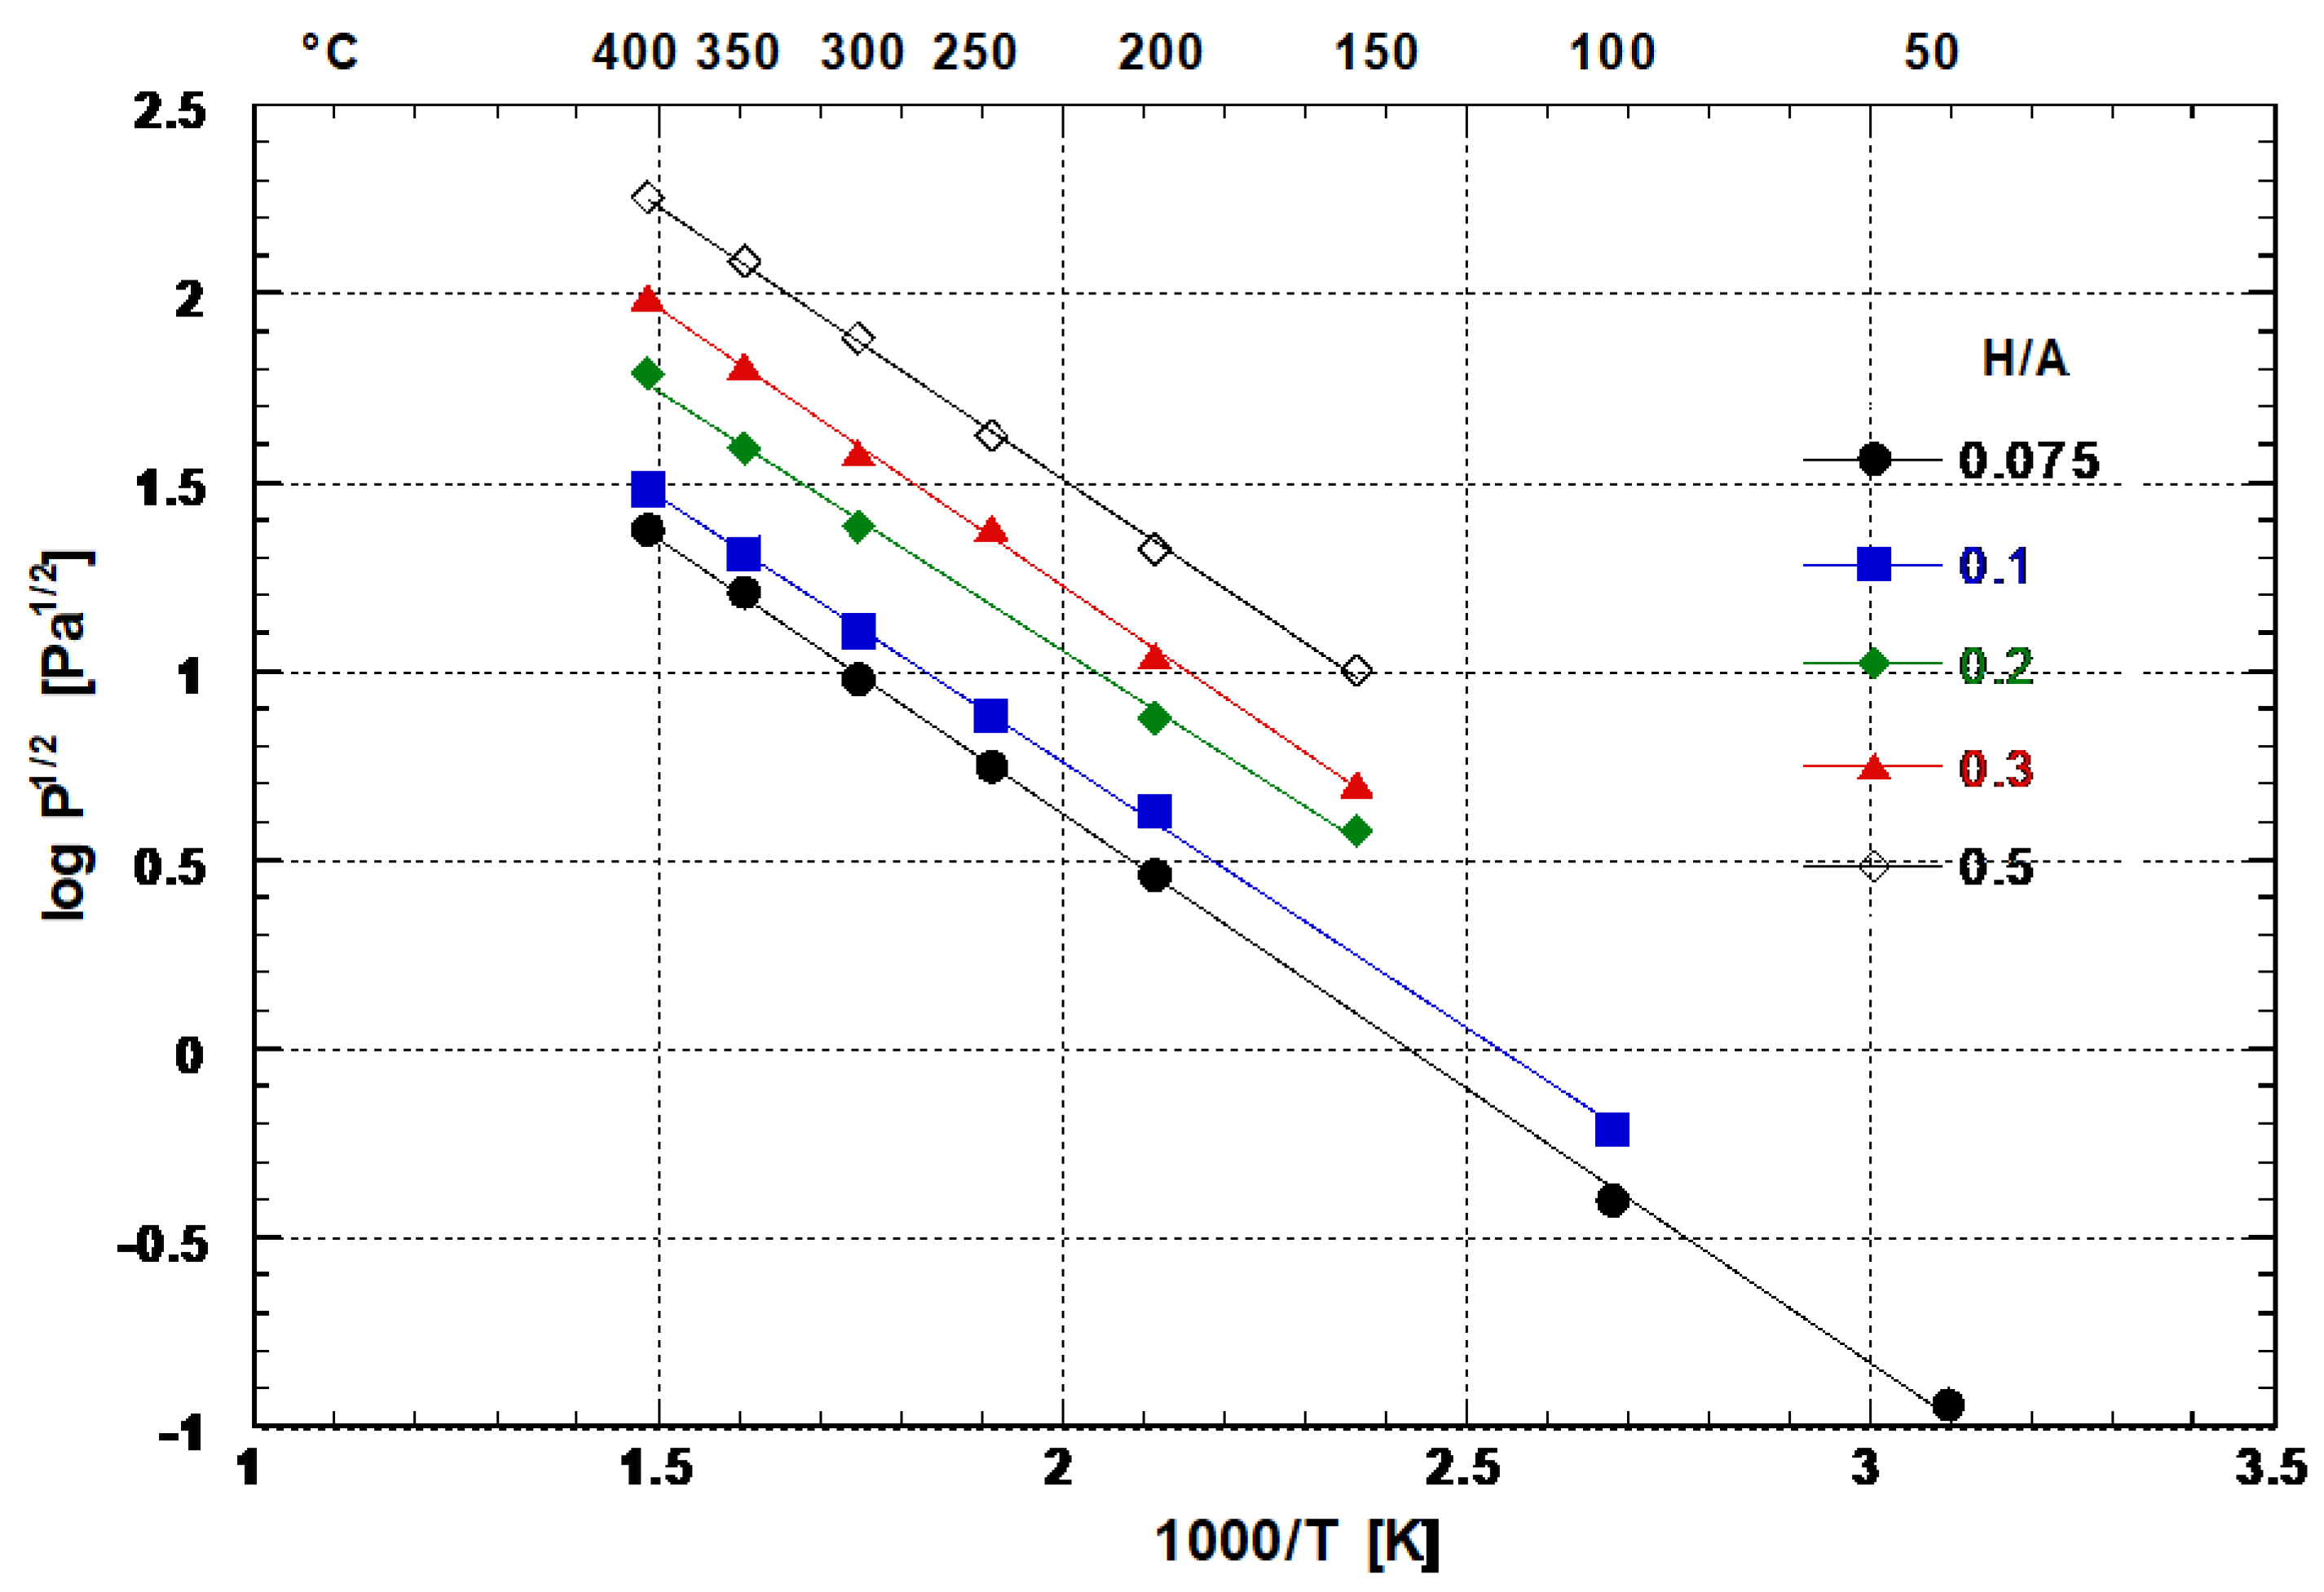
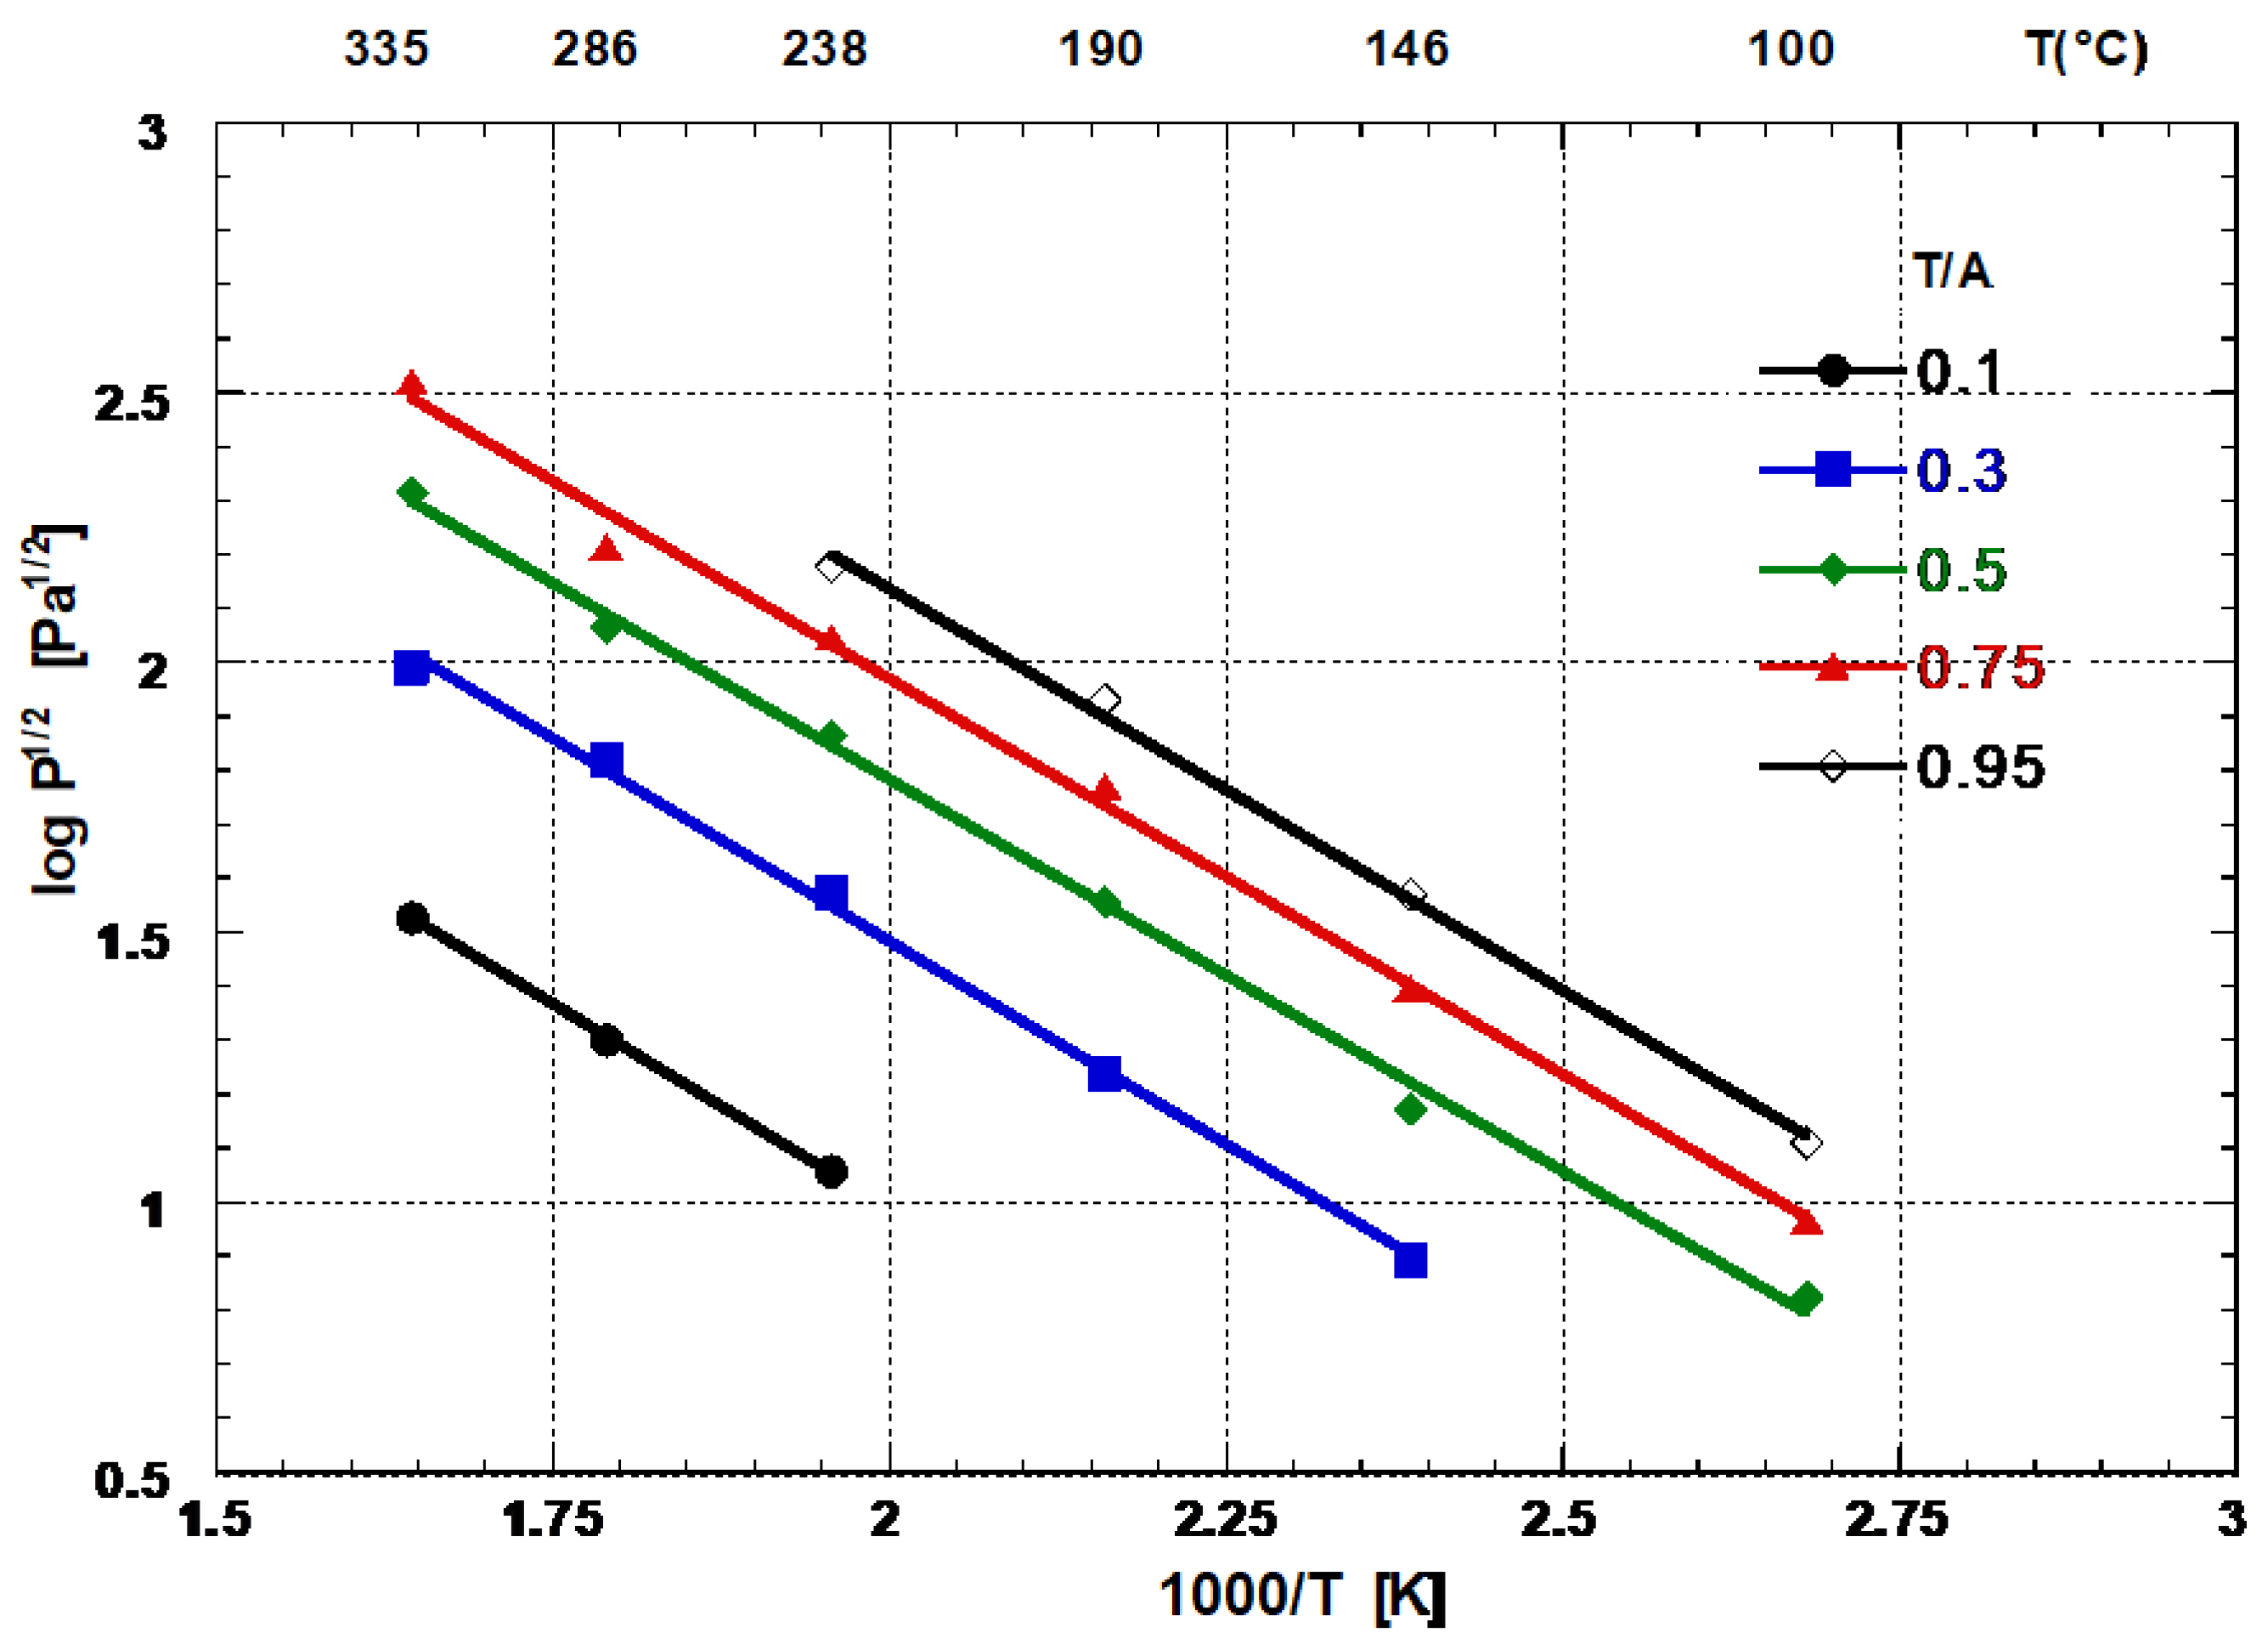
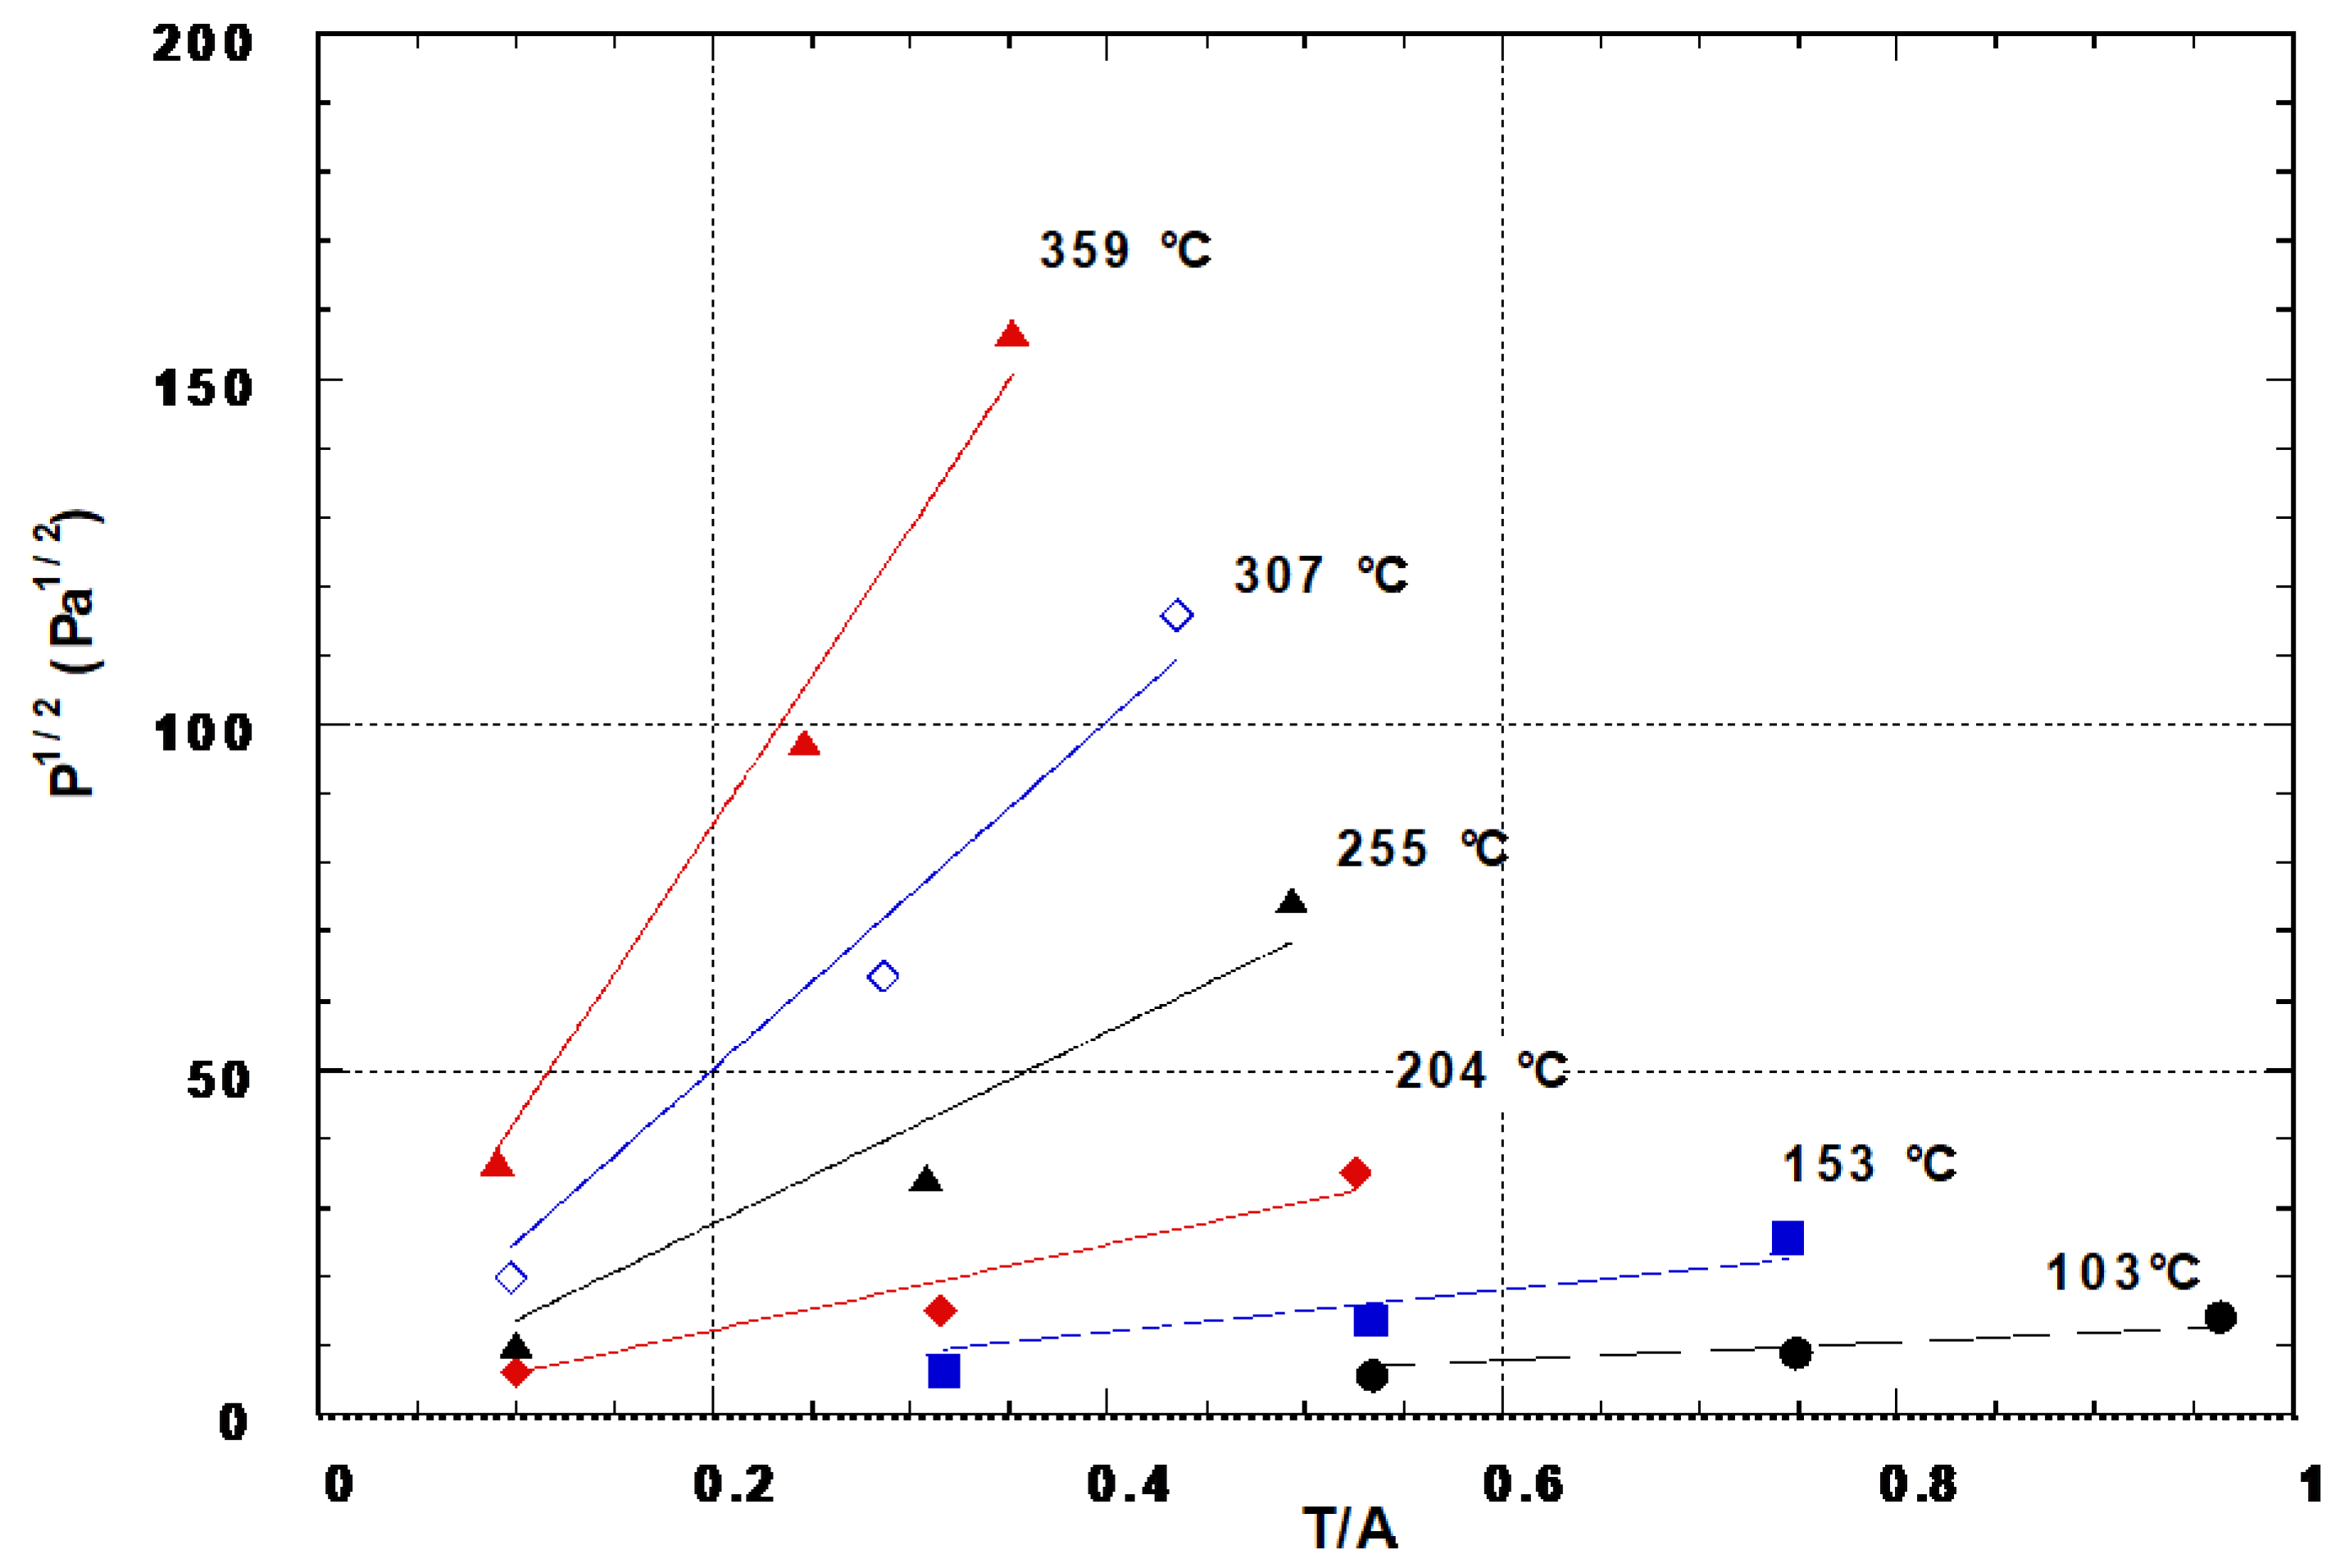
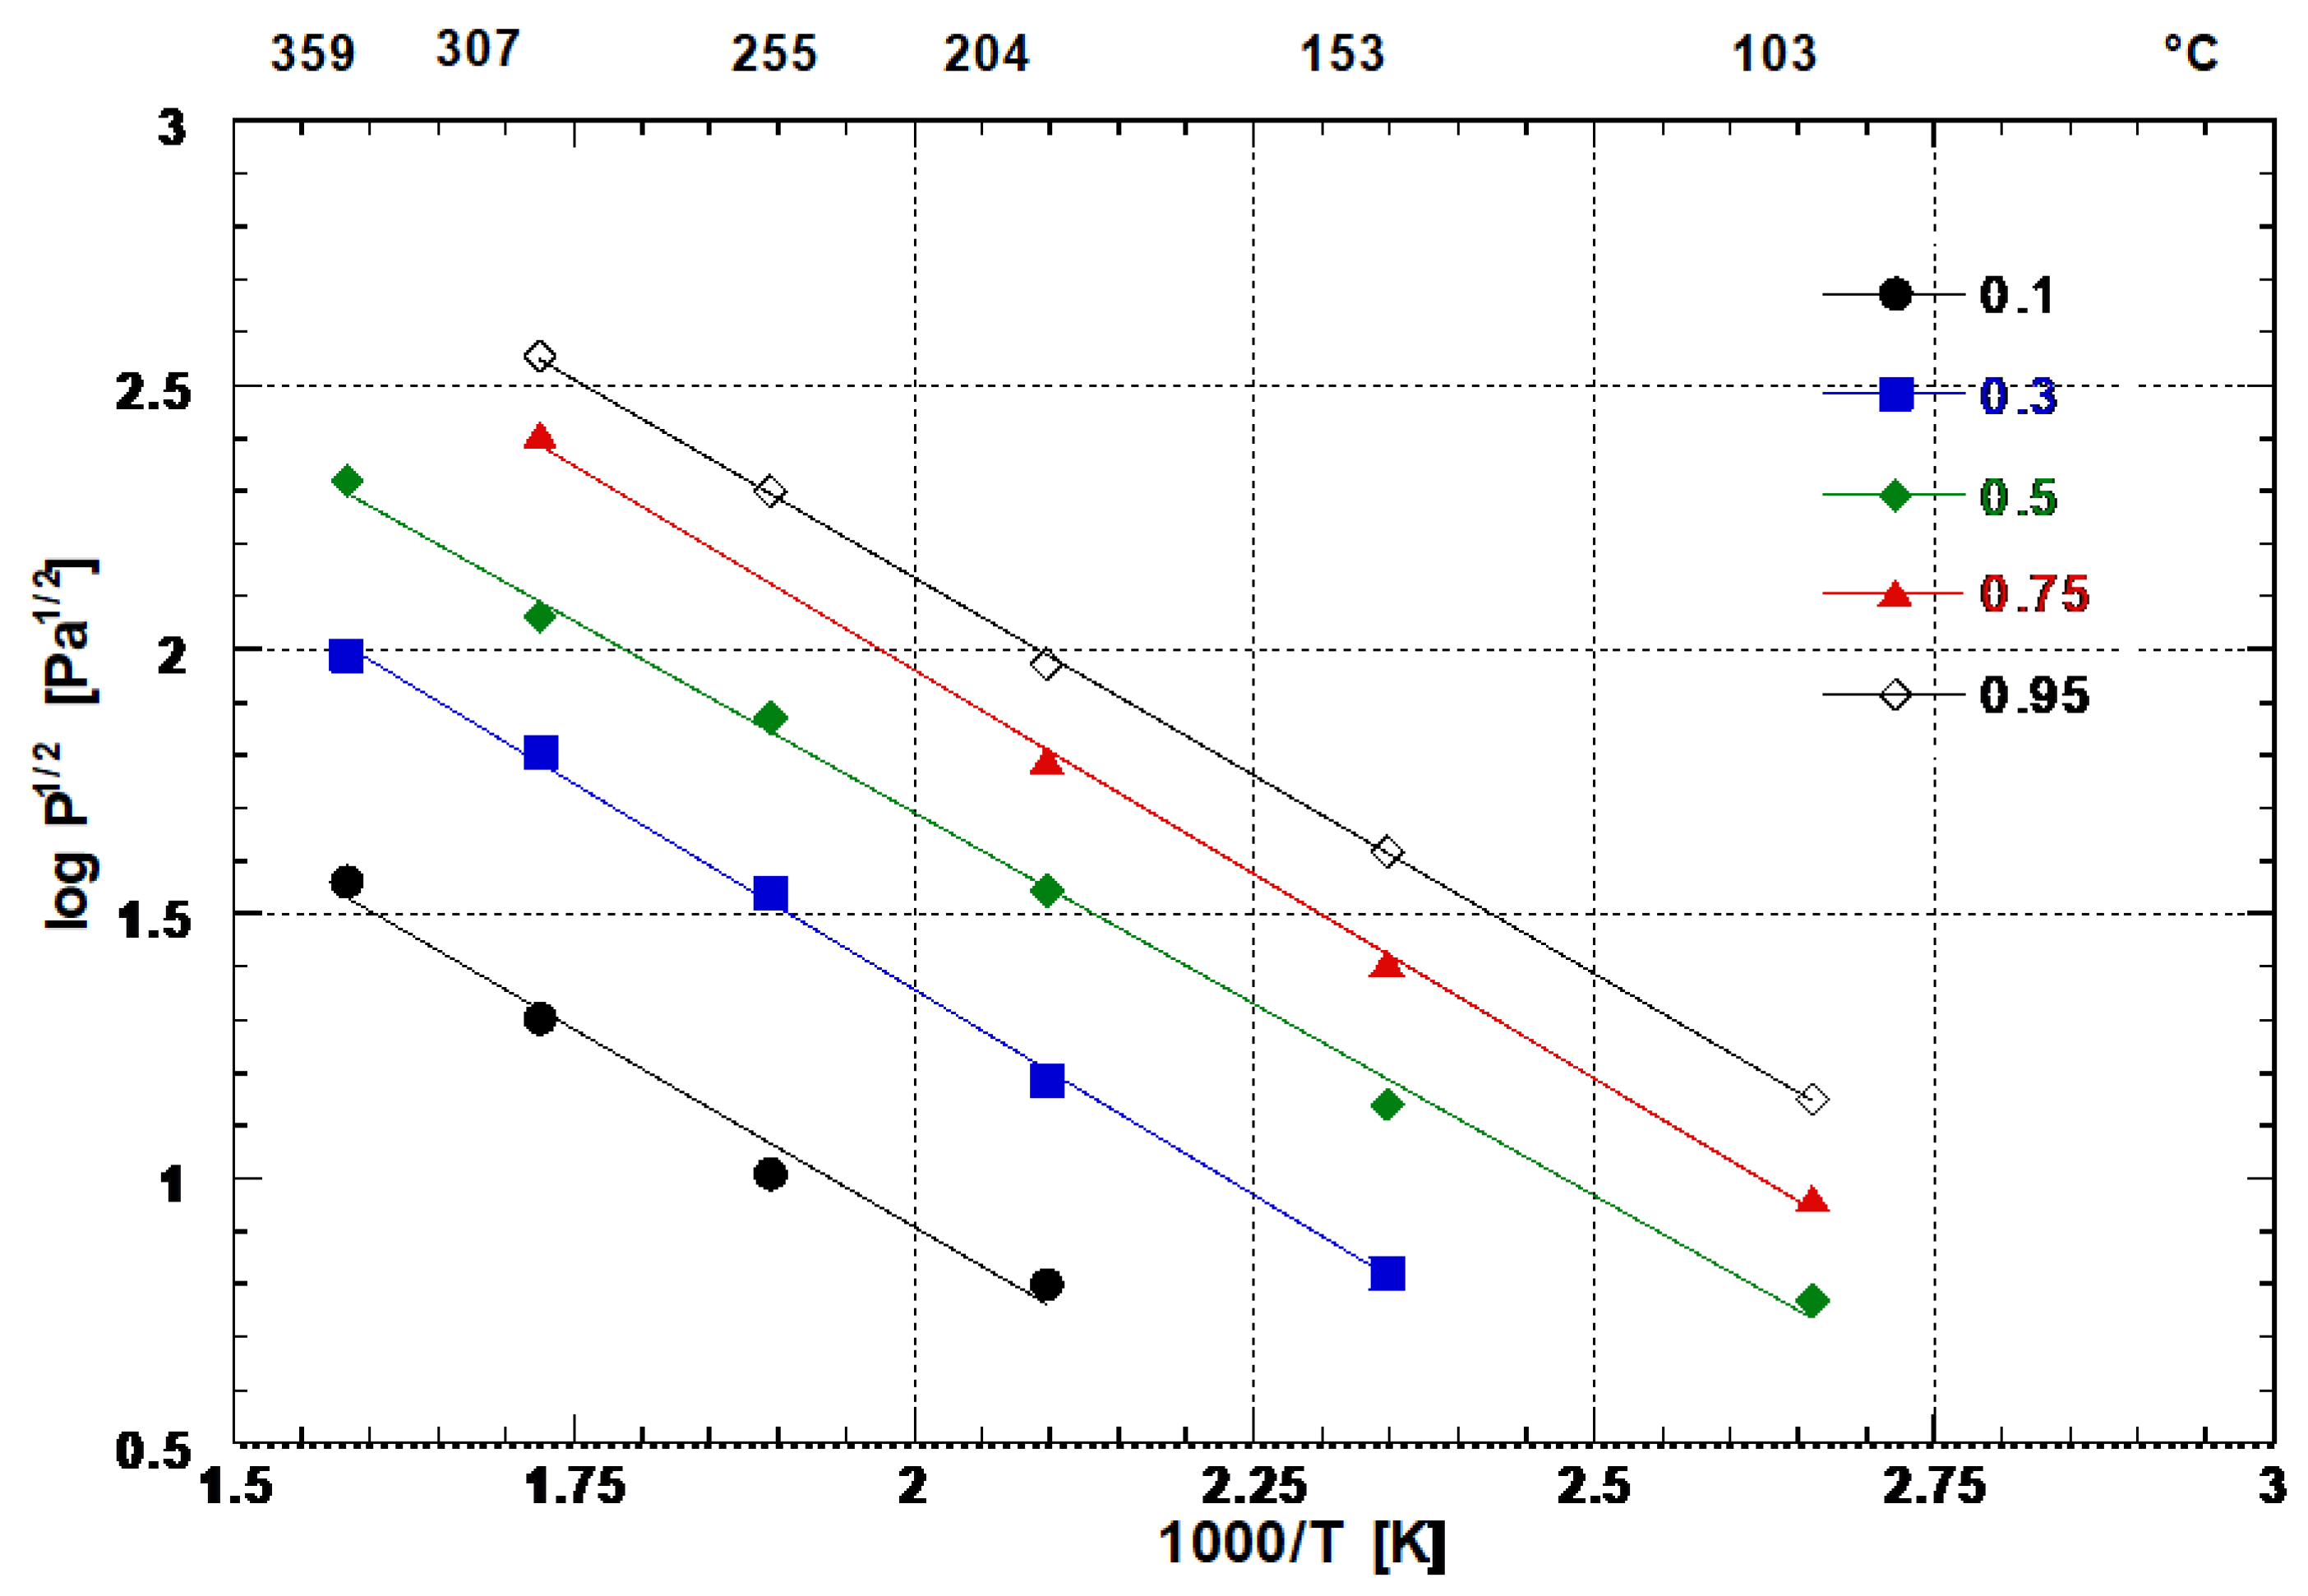
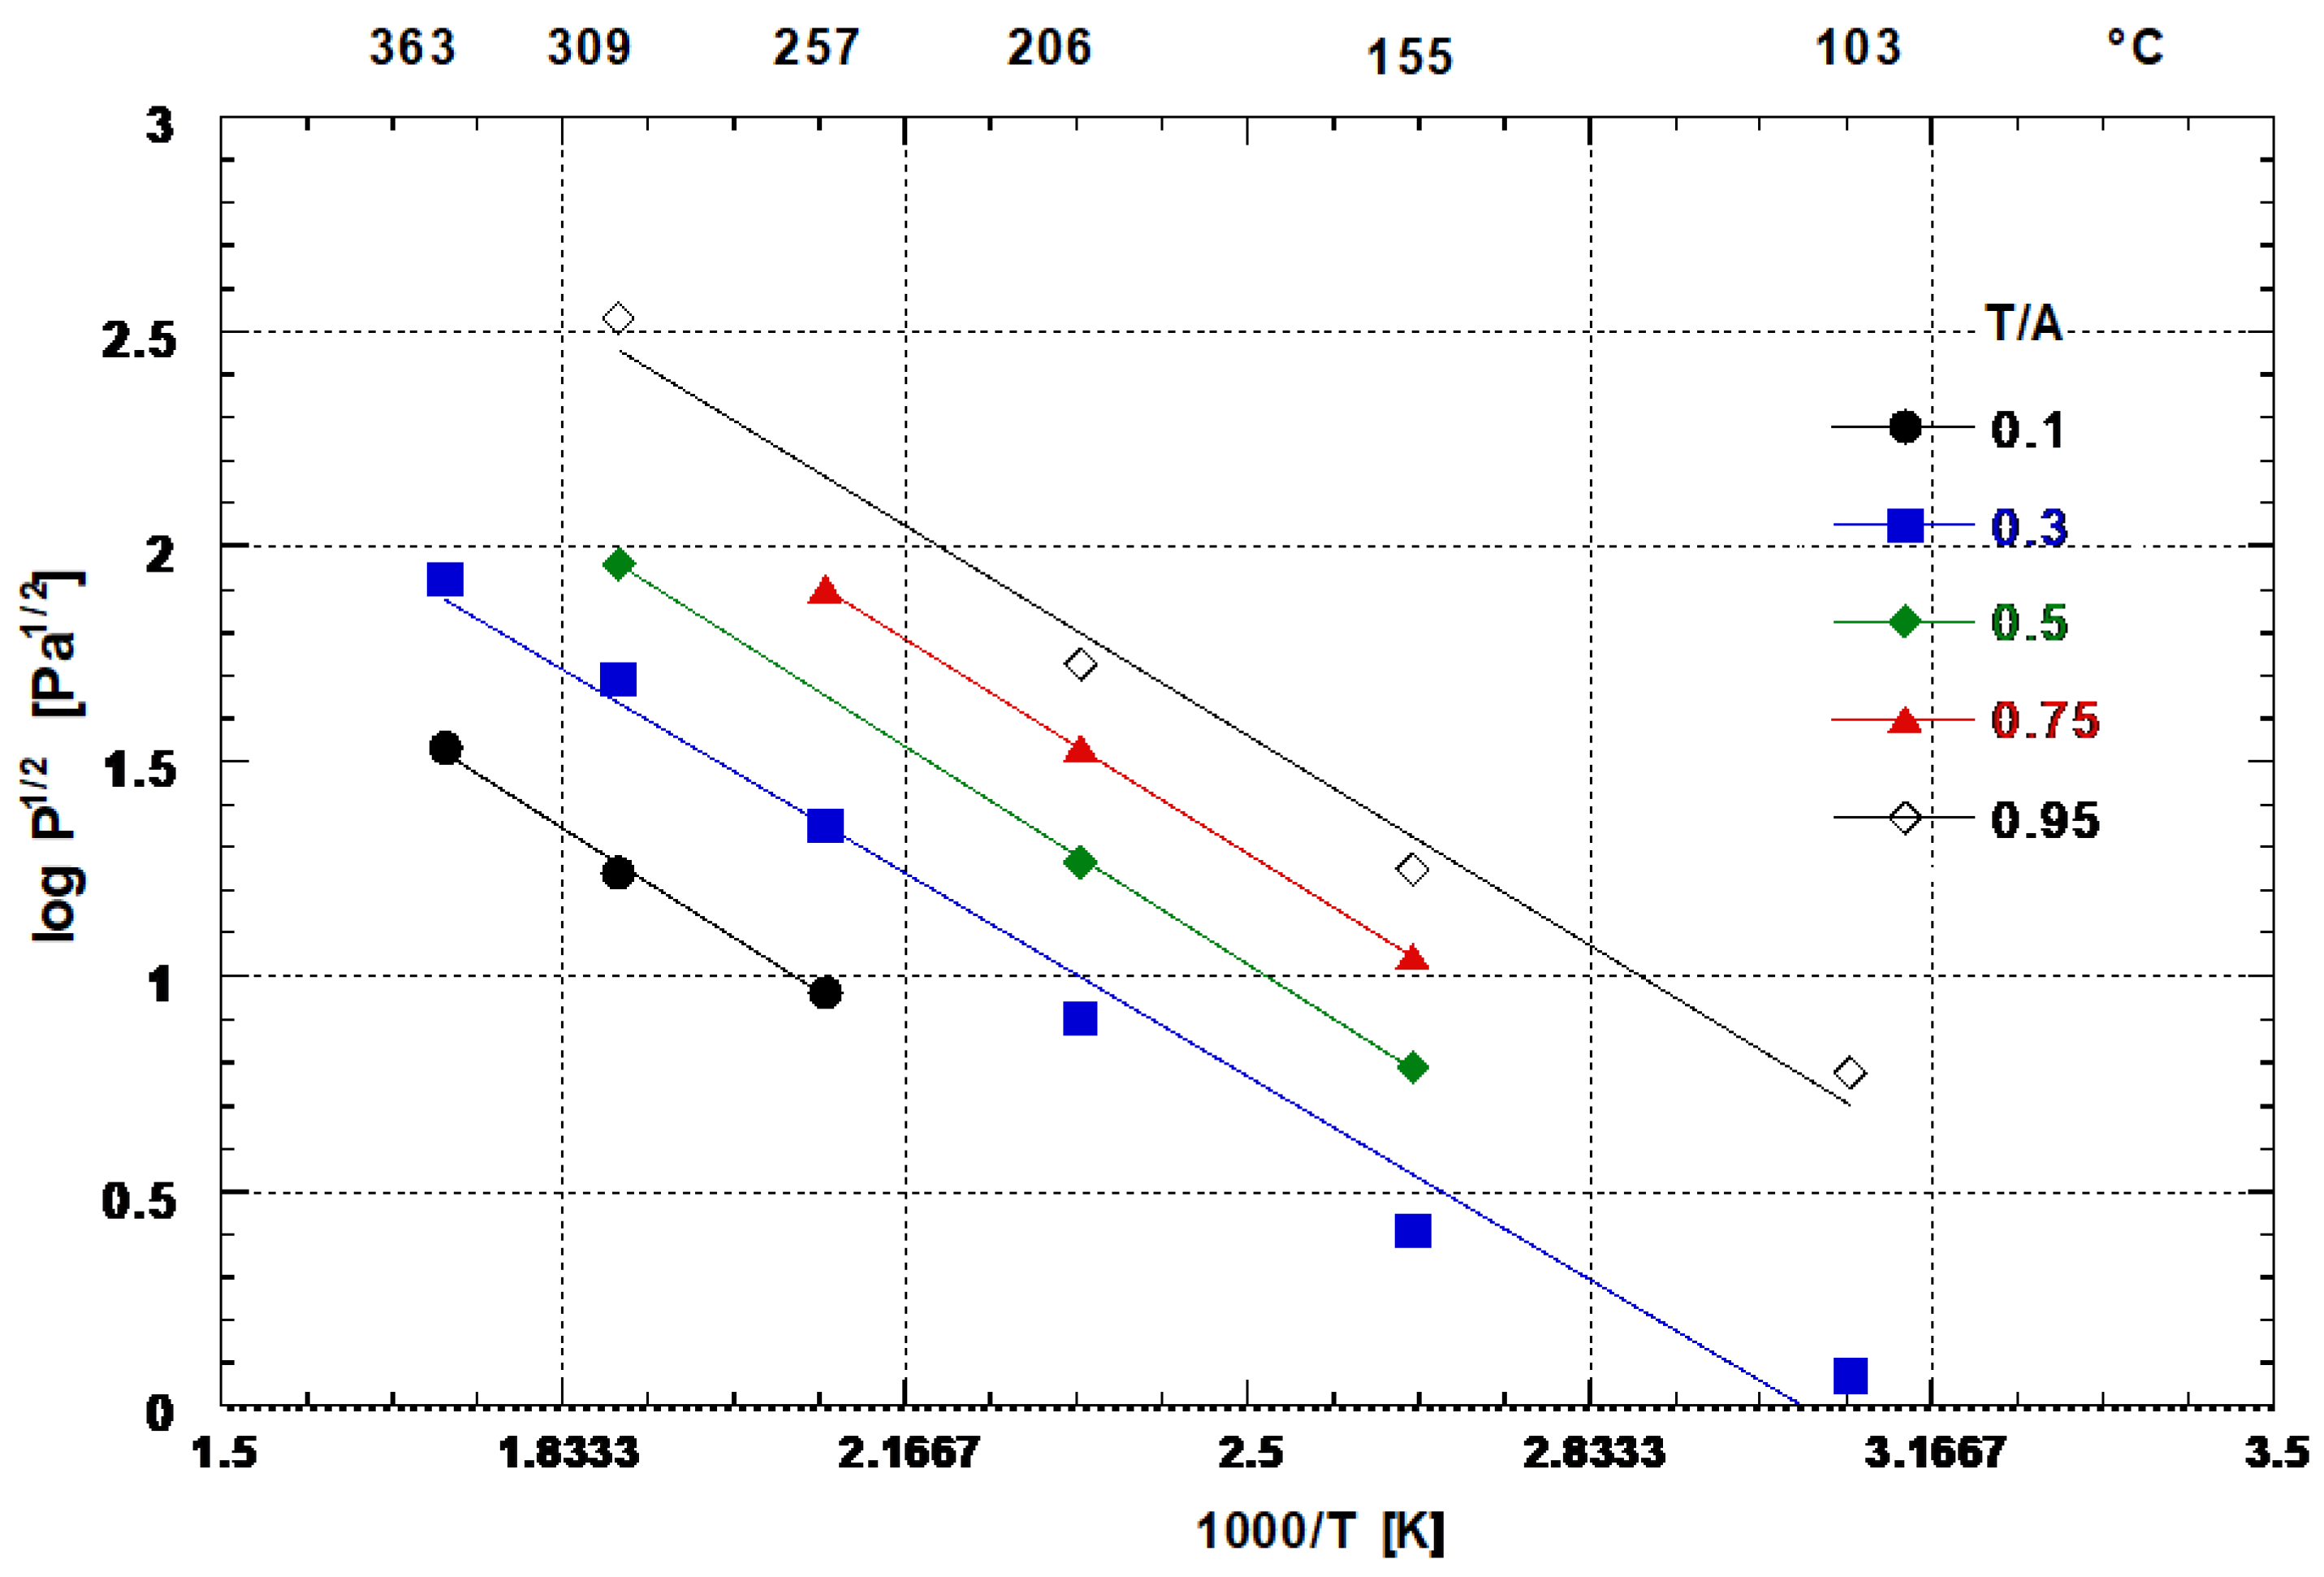
where Q = H or T, xQ is the concentration of solute atom in the alloy, as defined in ref. [1], PQ2 is the equilibrium pressure in Pa and (Ks)Q is the temperature-dependent Sieverts’ constant, is illustrated in Figure 7 and Figure 8 for hydrogen and tritium, respectively. Figure 5, Figure 6, Figure 7 and Figure 8 show a linear relationship for the solubility up to a H/A value of 0.5 and a T/A value of 0.9 at room temperature. Table 2 gives the values of Ks, in unit of the atomic ratio/Pa1/2, calculated from the reciprocal of the slopes of Figure 7 and Figure 8 up to the concentration xmax. Figure 9, where the Sieverts’ constants are plotted vs. the reciprocal temperatures, reveals consistently higher values of Ks for hydrogen than for tritium through the whole temperature range. The ratio (Ks)H/(Ks)T is seen to be reasonably constant and equal to 2.5. According to Equation (1), this further corresponds to PT2/PH2 = 6.25 at an equal temperature and concentration. Looking at the behavior of the hydrogen and tritium isotherms illustrated in Figure 2, this ratio is quite reasonably confirmed in the α-region.
xQ = (Ks)Q • (PQ2)1/2
Detailed information on the dissolution process can be extracted from the thermodynamic relations for infinitely diluted H2 and T2 in the alloy. As described in Appendix A, the values ∆ and ∆ (non-configurational or excess entropy) at infinite dilution can be easily extracted from the data of Figure 9. The calculation of the entropy term requires knowing xs, the maximum H/A value, i.e., the maximum number of hydrogen (tritium) atoms per unit formula that the alloy can dissolve in the interstitial sites. Once the structure of the alloy is known, this value is determined at a first approximation as the number of tetrahedral and octahedral sites associated with a unit formula. Both neutron diffraction and inelastic neutron scattering experiments on other metals and alloys on the site occupancy of hydrogen atoms confirm that the geometrically limited value (full occupancy of all the sites) is never reached [10,11]. Several models have been proposed to explain the interaction of hydrogen with the host lattice and hydrogen–hydrogen interaction. Most of them require the application of exclusion principles on site occupancy and thus the deduction of thermodynamic properties [12,13,14,15]. However, each model seems suited at best for a particular class of alloys, and this further stresses the strong need for experimental confirmations. The Zr(Fe0.5V0.5)2 compound forms an exact hcp lattice with parameters a = 5.092 Å and c = 8.314 Å, so that c/a = 1.633 [16,17]. Its primitive cell belongs to the C14 class with a space group symmetry P63/mmc (MgZn2 type). The C14 Laves phase forms only tetrahedral sites [18] and its unit cell has 4 molecules. The total number of available sites in the unit cell is 68, which results in 17 sites per unit formula. Clearly, hydrogen absorption in these alloys is far from even remotely approaching this number [16]. Applying an exclusion rule for tetrahedron occupancy, Shoemaker [19] showed the maximum number per formula unit to be for the C14 phase. To our knowledge, the alloy most similar to Zr(Fe0.5V0.5)2 that has been investigated by neutron diffraction is ZrMn2D3 deuteride [20], which belongs to the same space group P63/mmc and has lattice parameters a = 5.035 Å and c = 8.276 Å, close to those of Zr(Fe0.5V0.5)2. Moreover, the stoichiometric value of deuteration was found to be 3 ± 0.1 (the value of xs = 6 must not be confused with the correspondent stoichiometric value determined experimentally), which is very close to the value ~3.2 found for Zr(Fe0.5V0.5)2 [1,16]. Evidence was also achieved that on the 17 sites available, only 6 had a finite probability of being occupied. Using these arguments, xs = 6 has been chosen for the Zr(Fe0.5V0.5)2, from which the values for ∆ and ∆ follow as reported in Table 3.
As seen, the enthalpy for tritium at infinite dilution is higher than that for hydrogen (see Table 3). The reason for this can be ascribed to the form of the potential well for tetrahedral sites. For these sites, the energy difference between the vibrational levels of the H, D, T atoms in the metal can be larger than half the difference between the corresponding vibrational levels of the H2, D2, T2 molecules in the gas phase, and this means that T atoms are absorbed more readily than D and H atoms [21]. The entropy term ∆ is governed mostly by the loss of gas entropy upon dissolution in the lattice and therefore is fairly insensitive to the concentration. This feature can be observed looking at Table 4, which summarizes the thermodynamic data obtained fitting the data plotted in Figure 10 and Figure 11 using Equation (A2) for the different values of x.
The value of is found to be close to −7 for a large number of getter materials [22]. For hcp metals, values ranging from −6.2 to −7.08 for hydrogen are reported [23]. Therefore, the values obtained, respectively, of and are reasonable and the assumption of xs = 6 is acceptable. Recalling from Equation (A7) that
using the values listed in ref. [24] for the entropy in the gas phase, we obtain the following non-configurational entropy terms:
and
If the phonon dispersion curves for the lattice of the alloy were known, then using the two values above following the method suggested by Magerl and Stump [25], and recalling that:
a check of the sites’ occupancy, that is xs, could be derived.
4.1.2. Conversion into the Hydride Phase
Upon complete dissolution, hydrogen starts to convert into the nonstoichiometric β phase under constant equilibrium pressure for a perfect binary system. Intermetallic compounds are known to exhibit sloping plateaus in the two-phase region, as shown in Figure 2. The process can be described by the equation:
where Q = H, T, and y and x are the fractions of hydrogen dissolved, respectively, in the solid solution and in the nonstoichiometric β-phase. Further dissolution of hydrogen in the β-phase occurs according to the following equation:
where Zr(Fe0.5V0.5)2 Qa(s) represents the stoichiometrically saturated hydride.
Zr(Fe0.5V0.5)2 Qy(s) + (x − y) Q2 → Zr(Fe0.5V0.5)2 Qx(s)
Zr(Fe0.5V0.5)2 Qx(s) + (a − x) Q2 → Zr(Fe0.5V0.5)2 Qa(s)
When the solubility in the α phase and the deviation of the hydride from stoichiometry are negligible, i.e., for y ≈ 0 and x ≈ a, the standard enthalpy ∆H° and the entropy ∆S° of formation of the hydride can be estimated from the integrated van’t Hoff equation;
where
Kp = PQ2−a/2
In Equation (2), it is assumed that ∆H° is constant over the temperature range considered. When the conditions mentioned above are not fulfilled, then the ∆H° and ∆S° values obtained from a log vs. 1/T plot in the plateau region cannot be ascribed to the formation of the stoichiometric hydride. In practice, however, they are assigned to the reaction taking place in the α − β conversion region. Further to be considered is that the solubility and the deviation from stoichiometry are both temperature dependent.
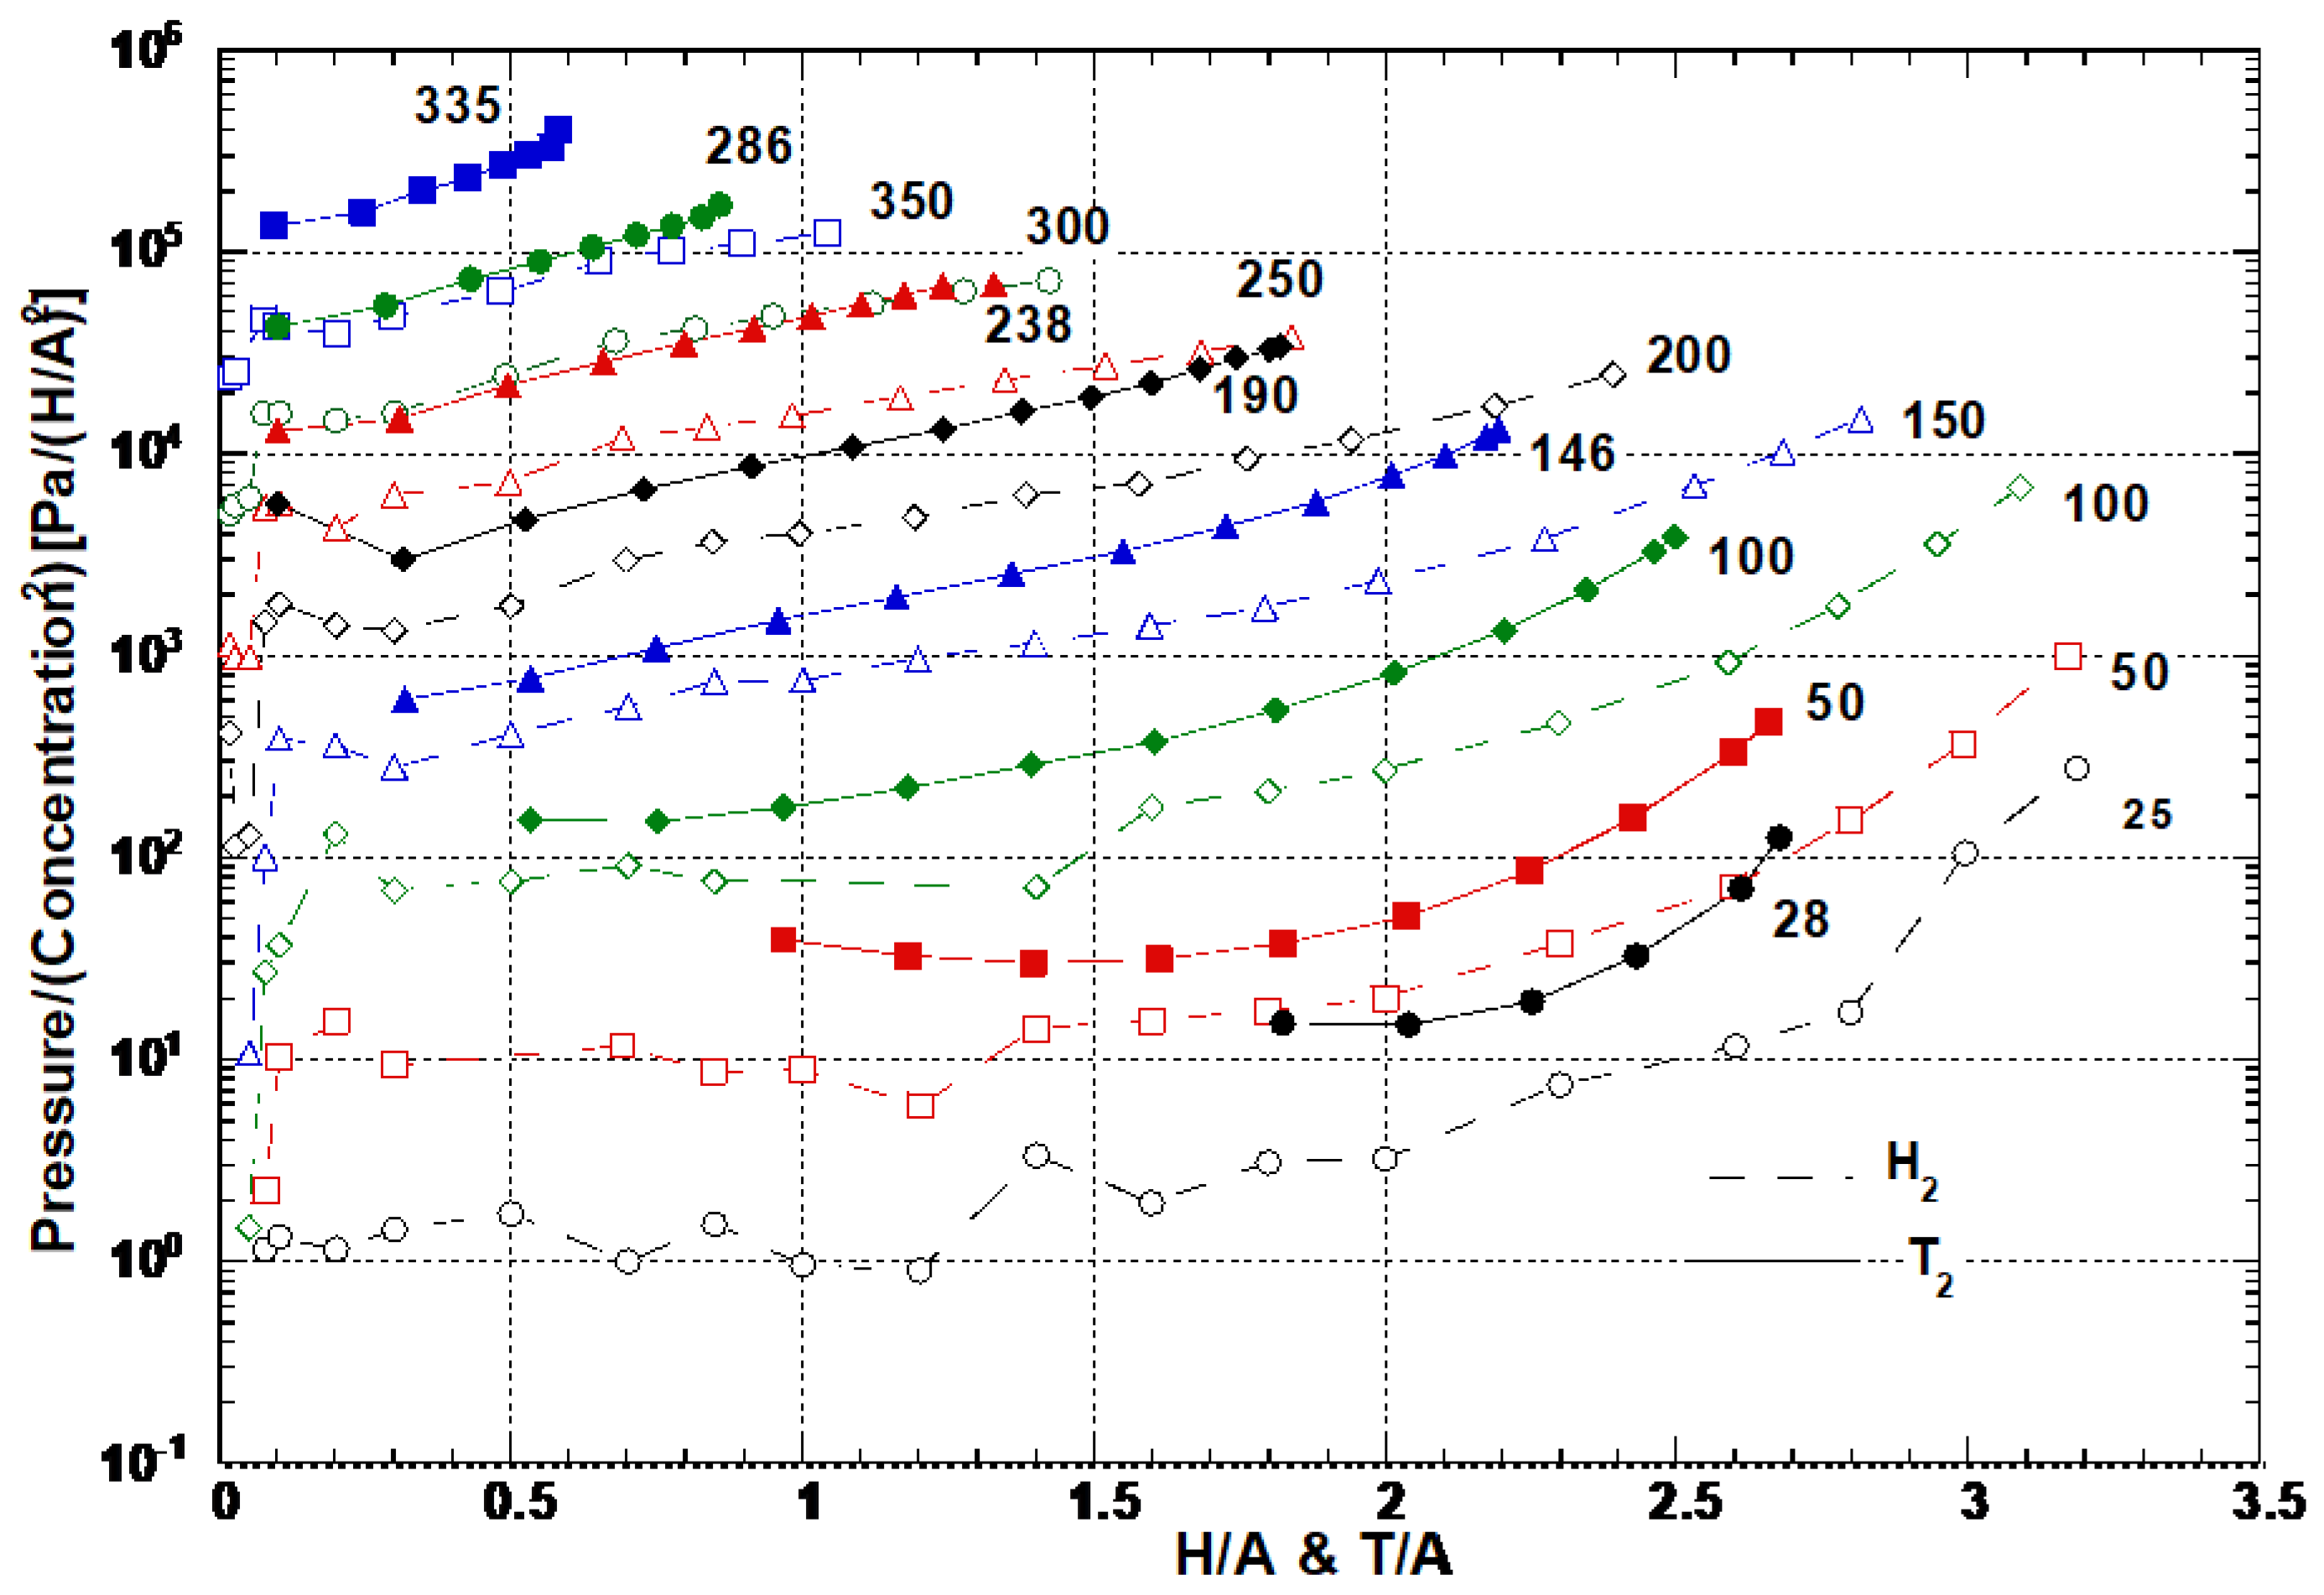
Figure 12 shows the isotherms of the reduced pressure () for the two isotopes. While the analysis for hydrogen [26] gives an H/A value of ~0.4 for the solubility limit, from Figure 12 it appears difficult to establish a corresponding value for tritium, although 0.4 seems reasonable.
Moreover, the slope of vs. concentration is the same for hydrogen and tritium at a fixed temperature. Therefore, in order to extract ∆H° and ∆S° for tritium, a range of concentrations spanning from 0.6 to 2.2 appears reasonable. ∆H° and ∆S° were calculated for the process taking place in the plateau region described by Equation (2) fitting the data with a relationship of the type:
where P is the equilibrium pressure in Pa, P0 = 100 kPa.
A = − ∆H°/R; B = − ∆S°/R + ln 105 and ∆H° and ∆S° are, respectively, the enthalpy and entropy changes, occurring when 1 mole of Q2 (Q = H, T) is adsorbed by the alloy. Table 5 reports the values of ∆H° and ∆S° for different concentrations. The tritium equilibrium pressure always being higher than that of hydrogen, for a fixed temperature and concentration, the entropy term prevails for all the temperatures investigated. The standard entropy difference @ 300 K between gaseous tritium and hydrogen is S°T2 − S°H2 = 22.65 J/mol K, while the difference between the ∆S values for H2 and T2 adsorption is 22.87 J/mol K. Taking into account the large deviation in the ∆S values, the entropy change for adsorption basically reflects the vanishing of the gaseous molecule, as expected.
Equation (3) cannot explain the monotonic increase in the hydrogen and tritium pressures with concentration in the hydride-forming region, as shown in Figure 2. In this case, use can be made of the multi-plateau theory developed by H. A. Kierstead where the interactions between hydrogen atoms on different types of sites are included [27]. Unfortunately, as reported in ref. [20], this type of structure exhibits four different types of sites occupied by hydrogen (formed by 2Zr atoms and 2B atoms, where B = Fe,V) and therefore the mathematical solution for the equilibrium pressure by this theory becomes very complicated and is far beyond the scope of this work. However, assuming that the distribution of hydrogen in the interstitial sites of the Zr(Fe0.5V0.5)2 reflects the distribution presented for the MgZn2 in ref. [20], and considering that the separation distance between the nearest neighboring sites is ~1.3 Å, while the separation distance between the next nearest neighboring sites is ~2 Å, it follows that the nearest neighboring sites are not occupied simultaneously. Only the next nearest neighboring sites are occupied, in agreement with Westlake [13]. Similar results on the hydrogen atom distribution were reported from a neutron diffraction study on ZrMn1.68Fe0.4, an intermetallic compound obtained by substitution, similar to St 737, which belongs to the same space group and has lattice parameters similar to those of St 737 [28]. The result found in the solution regime, xs = 6 for hydrogen and tritium, suggests that, while the distribution along the sites is the same for two isotopes, for tritium the occupancy factor is less than that for hydrogen. This means that the character of long-range weak interaction between different types of sites holds for tritium, even if with an interaction factor z somewhat higher.
4.2. Aging Effect
4.2.1. Helium Production–Release
The He3 produced can be calculated, as ratio, as:
where is the tritium over alloy ratio at time 0 of aging, and λ = 1.782 × 10⁻⁹ s−1 is the tritium decay constant. The value on the second bed obtained after 1500 days was 0.48. The amount of He3 released was measured as 0.1726 Pa·m3, which corresponds to a fraction of 2.72% of the helium produced.
Equation (7) also gives the production rate, still as a ratio, and one has 3.72 × 10⁻⁴/day. The release rate averaged over 1500 days was 9.13 × 10⁻⁶ /day. Moreover, several authors report that during the first two years of aging the release rate is less than 2% of the generation rate (see ref. [5] and other references therein). Neglecting this fraction, the release rate averaged over the period of time remaining after two years is 1.78 × 10⁻⁵/day, which is still considerably lower than the production rate. It has been further observed that for most metals and alloys the accelerated release rate (release rate ≈ production rate) occurs at a He3/A value about 0.3 with the only exception of Zr, for which it is 0.48. According to the percolation theory [4,29], a raw estimate of the critical value of He3/A for the St 737 alloy can be obtained using the average value of 7.1 × 10⁻²⁸/m3 for the density of helium atoms in a bubble and assuming that the alloy belongs to the category of low early-release tritides. The hcp lattice being a three-dimensional lattice, the critical volume fraction f at which the percolation probability becomes unity is 0.255. Using an alloy density of 4.95 × 10⁻²⁸/m3, which accounts for a volume expansion of 30% due to hydriding, Equation (1) of Ref. [4] gives a critical value of He3/A of 0.37, suggesting the value of 0.48 we observed is too high. However, several factors affect this estimate, namely:
- (1)
- The density of the alloy is calculated by the lattice parameters and, as pointed out by Spulak [4], the critical helium concentration strongly depends on the metal atom density;
- (2)
- The density of the helium atoms in a bubble weakly depends on the initial bubble radius as (r0)3/8, but changing the material also changes r0;
- (3)
- The number density of helium bubbles changes from metal to metal;
- (4)
- The release of helium also depends on the effective surface area of the alloy;
- (5)
- Finally, the presence of a large critical value can be argued for due to the particular structure of the alloy.
Concerning Point (3), we note that helium can quickly migrate through interstitial sites thanks to its low migration energy [30] (Em < 0.5 eV) until it is trapped in a vacancy. Due to the high value of the vacancy-binding energy, the diffusion of helium at low temperatures occurs with the time constant of the vacancy migration [31] ( ≈ 1.2−1.4 eV). When a cluster is formed, a bubble grows there, the energy required for helium release being higher than the energy of a single vacancy, and due to this, diffusion is slowed down. Finally, whenever helium is permanently trapped in a bubble, the effective migration energy still increases. The helium distribution therefore depends on the migration of bubbles, whose diffusivity is still lower. To be further considered is that for temperatures T such that T < Tm/3 (Tm = melting temperature) [31], as in the case of interest, no vacancies are created. Their role is replaced by the presence of impurities, dislocations or lattice defects, at which points He can clusterize, distort the lattice and start the process of self-interstitial atom (SIA) with the formation of Frenkel pairs [32]. Further, helium can be trapped in the vacancies so formed, and due to this, the cluster forms a bubble and the bubble center moves because of the SIA. When the bubble reaches a critical dimension, it moves by dislocation loop punching [33] and there is the onset of self-diffusion. Further bubble growth can occur by Ostwald ripening [33]. From this perspective, it seems clear that in T-loaded samples, impurities and defects are responsible for bubble formation. Their concentrations in the alloy therefore directly affect the critical helium concentration at which accelerated release begins to occur.
Concerning Point (4), we stress that at the onset of percolation the channels through which helium can escape to the surface will release more or less helium according to the effective surface area. For example, ref. [5] reports that, while U with a surface area of 0.6 m2/g released 4% of the He after 650 days, with a surface area of 3 m2/g the released amount was 21% of He. Assuming a linear relationship between the release rate and the surface area, an extrapolation to the St 737 alloy, which has a surface area of 0.06 m2/g, would lead to a release of ≈ 1.2% of the He produced in 1500 days. The actual fraction observed is 2.72%. If we assume that this alloy is a low early-release tritide and that the percolation probability is neither unity nor zero, this suggests that either more bubbles were formed in St 737 due to a higher concentration of impurities or to defects present in the U, or that more bubbles diffused to the surface; or that these two mechanisms acted together.
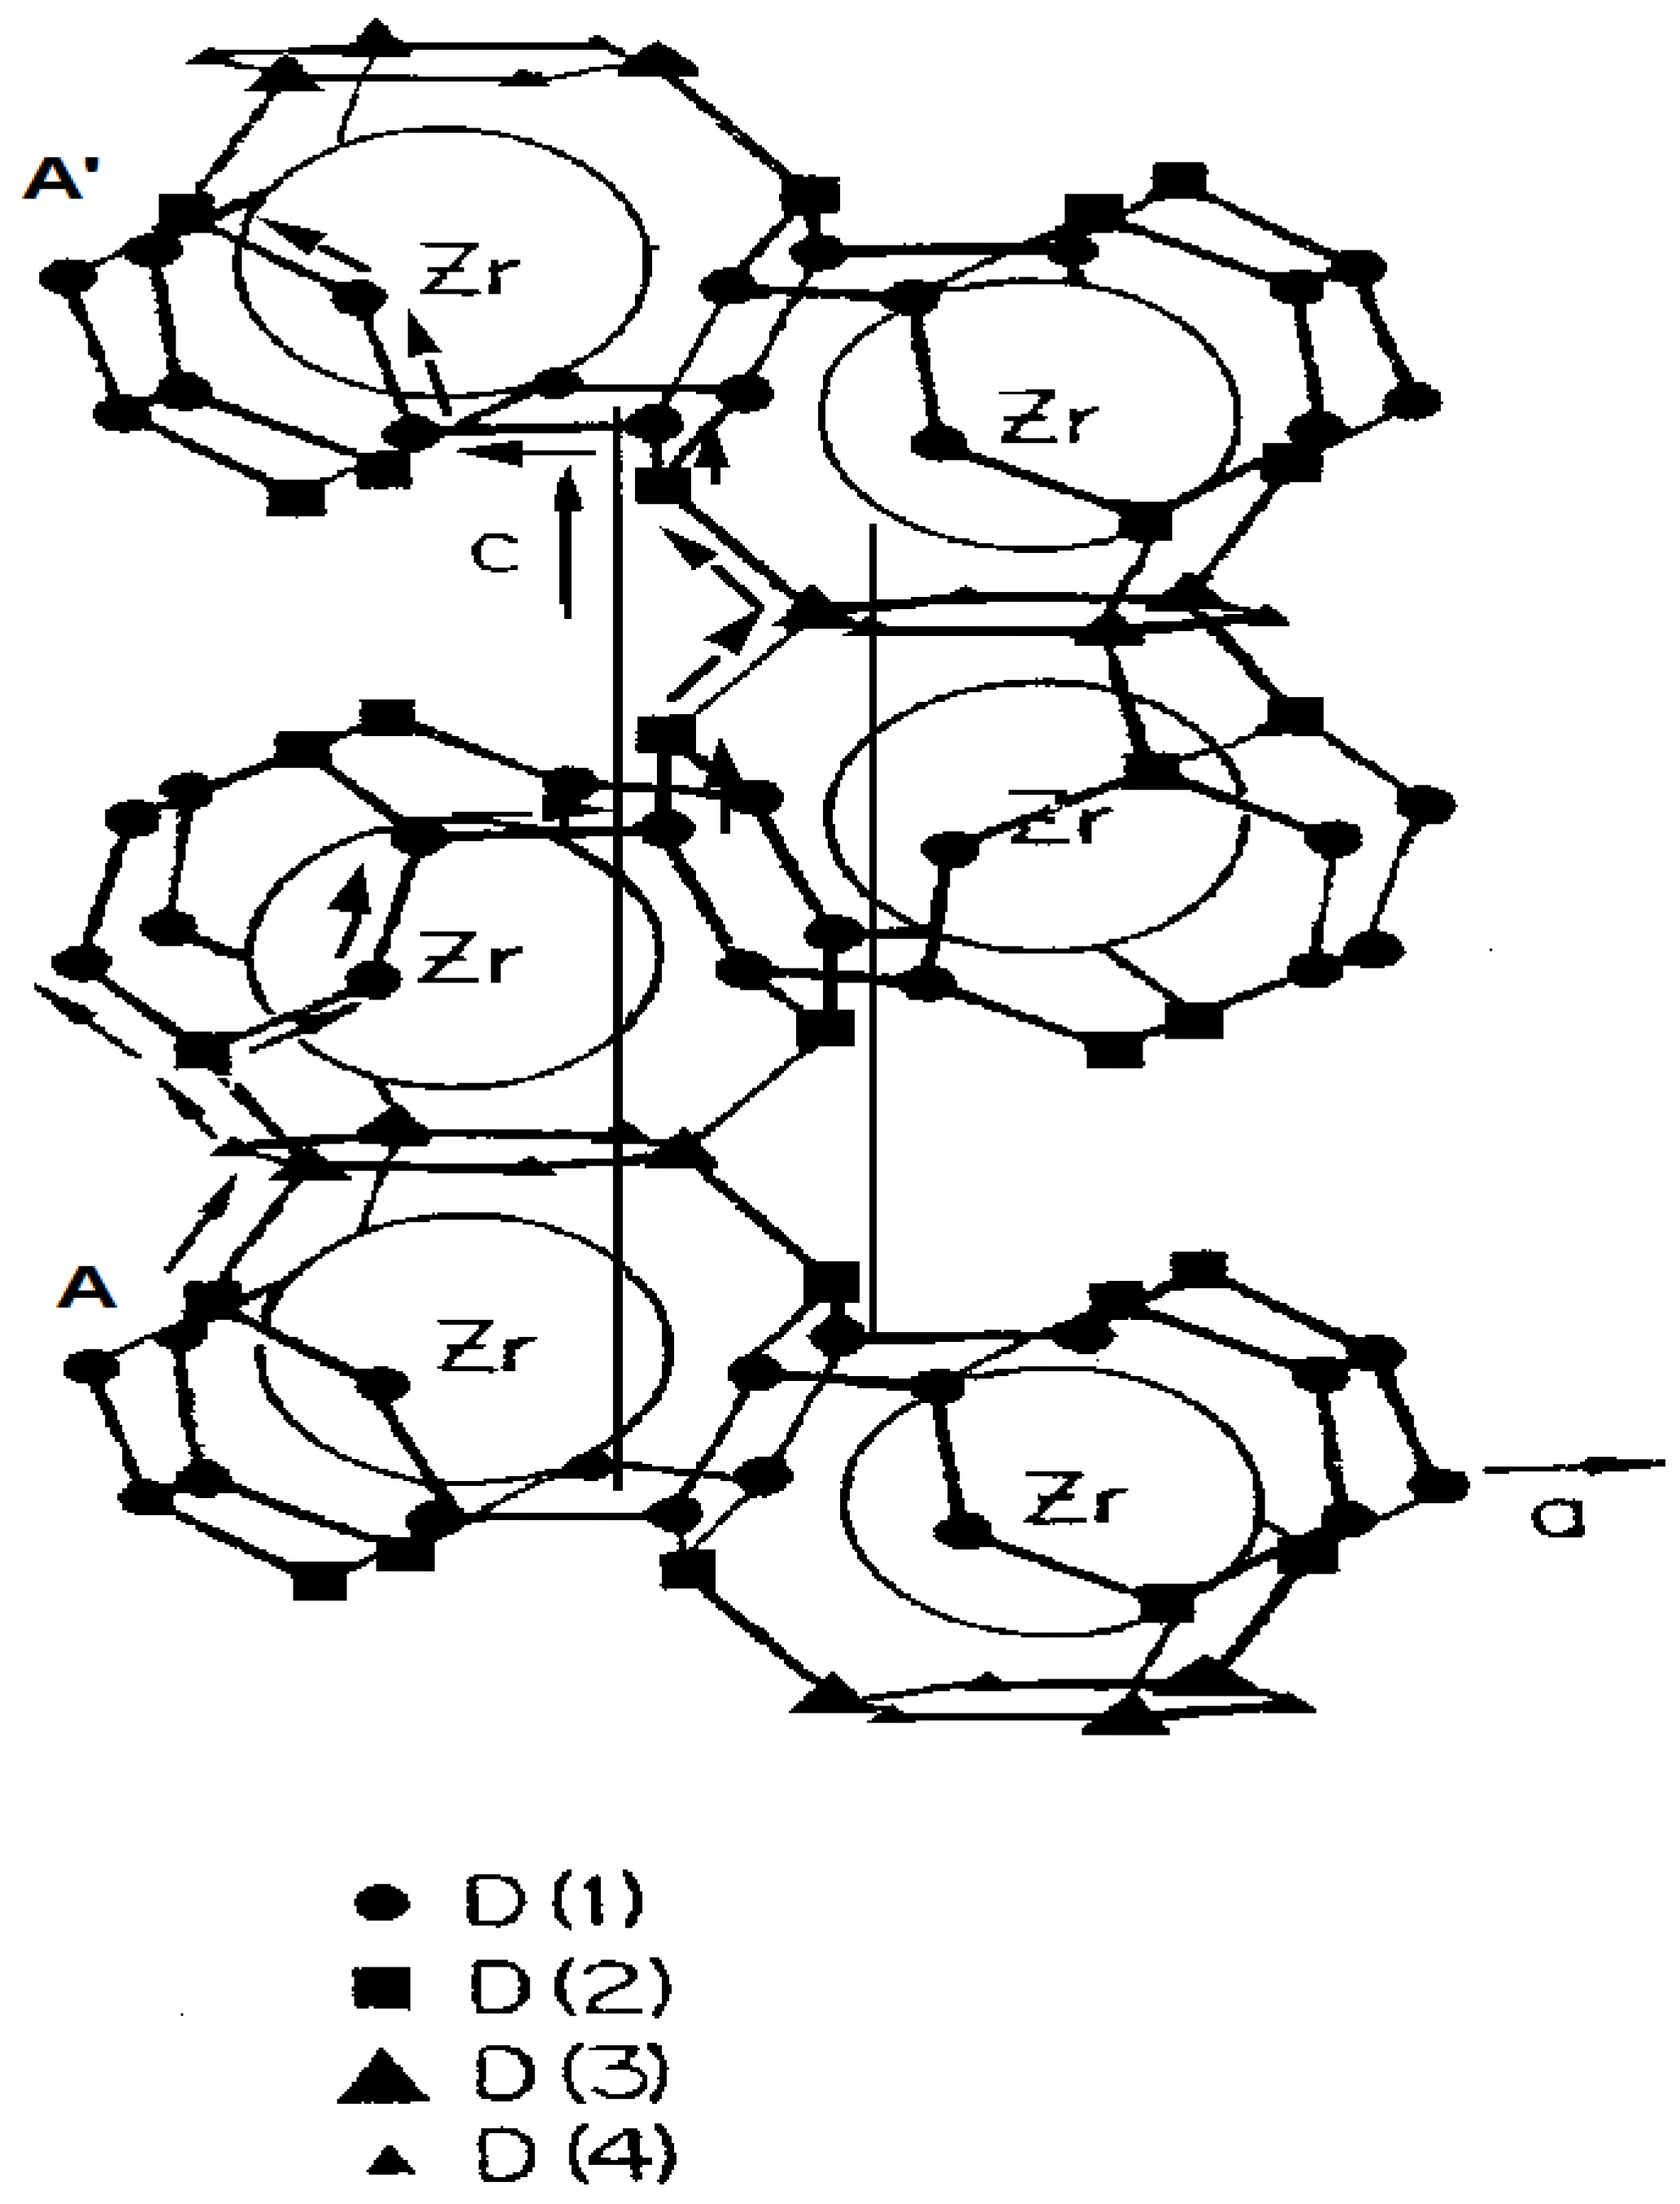
Concerning Point (5), we note that for the case of a perfect crystal lattice the theory predicts that interstitial diffusion is favored between sites sharing a common face and less favored between sites sharing a common atom [34]. For a hcp lattice, the trajectory that a He atom formed in an interstitial position would have to follow to escape to the surface is along the c-axis, which is the stacking direction. Still, according to theory, interstitial diffusion along the c-axis is favored if it occurs between octahedral sites.
Let us then consider for simplicity a He atom which migrates along the c-axis to its equivalent position in the layer immediately above the one where it was formed, after which it starts to form a cluster. For a simple hcp lattice, only 2 jumps among octahedral sites are required; while for the C14 structure, the He atom is forced to pass through tetrahedral sites sharing common faces following the path shown in Figure 13, so that a total of 12 jumps are required. Assuming for simplicity the same value for Em for the two lattices, interstitial migration in the C14 structure is slower than that in a simple three-dimensional lattice. In addition to this, 5–7 He atoms have to reach the same position to form a cluster. Therefore, He has to fill more interstitial sites in the C14 structure before it diffuses to the cluster position. The critical value represents only an average value since the real distribution is unknown. This effect explains a higher for the C14 structure than for a simple lattice provided all the other conditions, such as impurities, defects and surface area, are assumed identical. The fraction of 2.72% of He released remains to be explained. As argued in ref. [20], in a C14 lattice, hydrogen atoms placed in interstitial positions can diffuse along two paths (see Figure 13) inside the same network. Since He3 is formed by decay, it can also diffuse along the same two paths. If the alloy is in the low-release-rate phase, the He released has to reach the surface by interstitial diffusion from the first layers immediately below the surface, from where it finds two channels to escape to the surface. This suggests that, in agreement with the observed release fraction, the release is twice that predicted assuming release mechanisms similar to those present in uranium. The picture also explains the high critical value for this alloy and the observed release fraction. Further support to this interpretation is provided by the fact that during the PCT measurements of the aged bed, no appreciable differences were observed between the adsorption and desorption isotherms and that the He background measured was low, suggesting that the alloy had not yet reached the accelerated release phase.
4.2.2. Tritium Release
A Solution Region
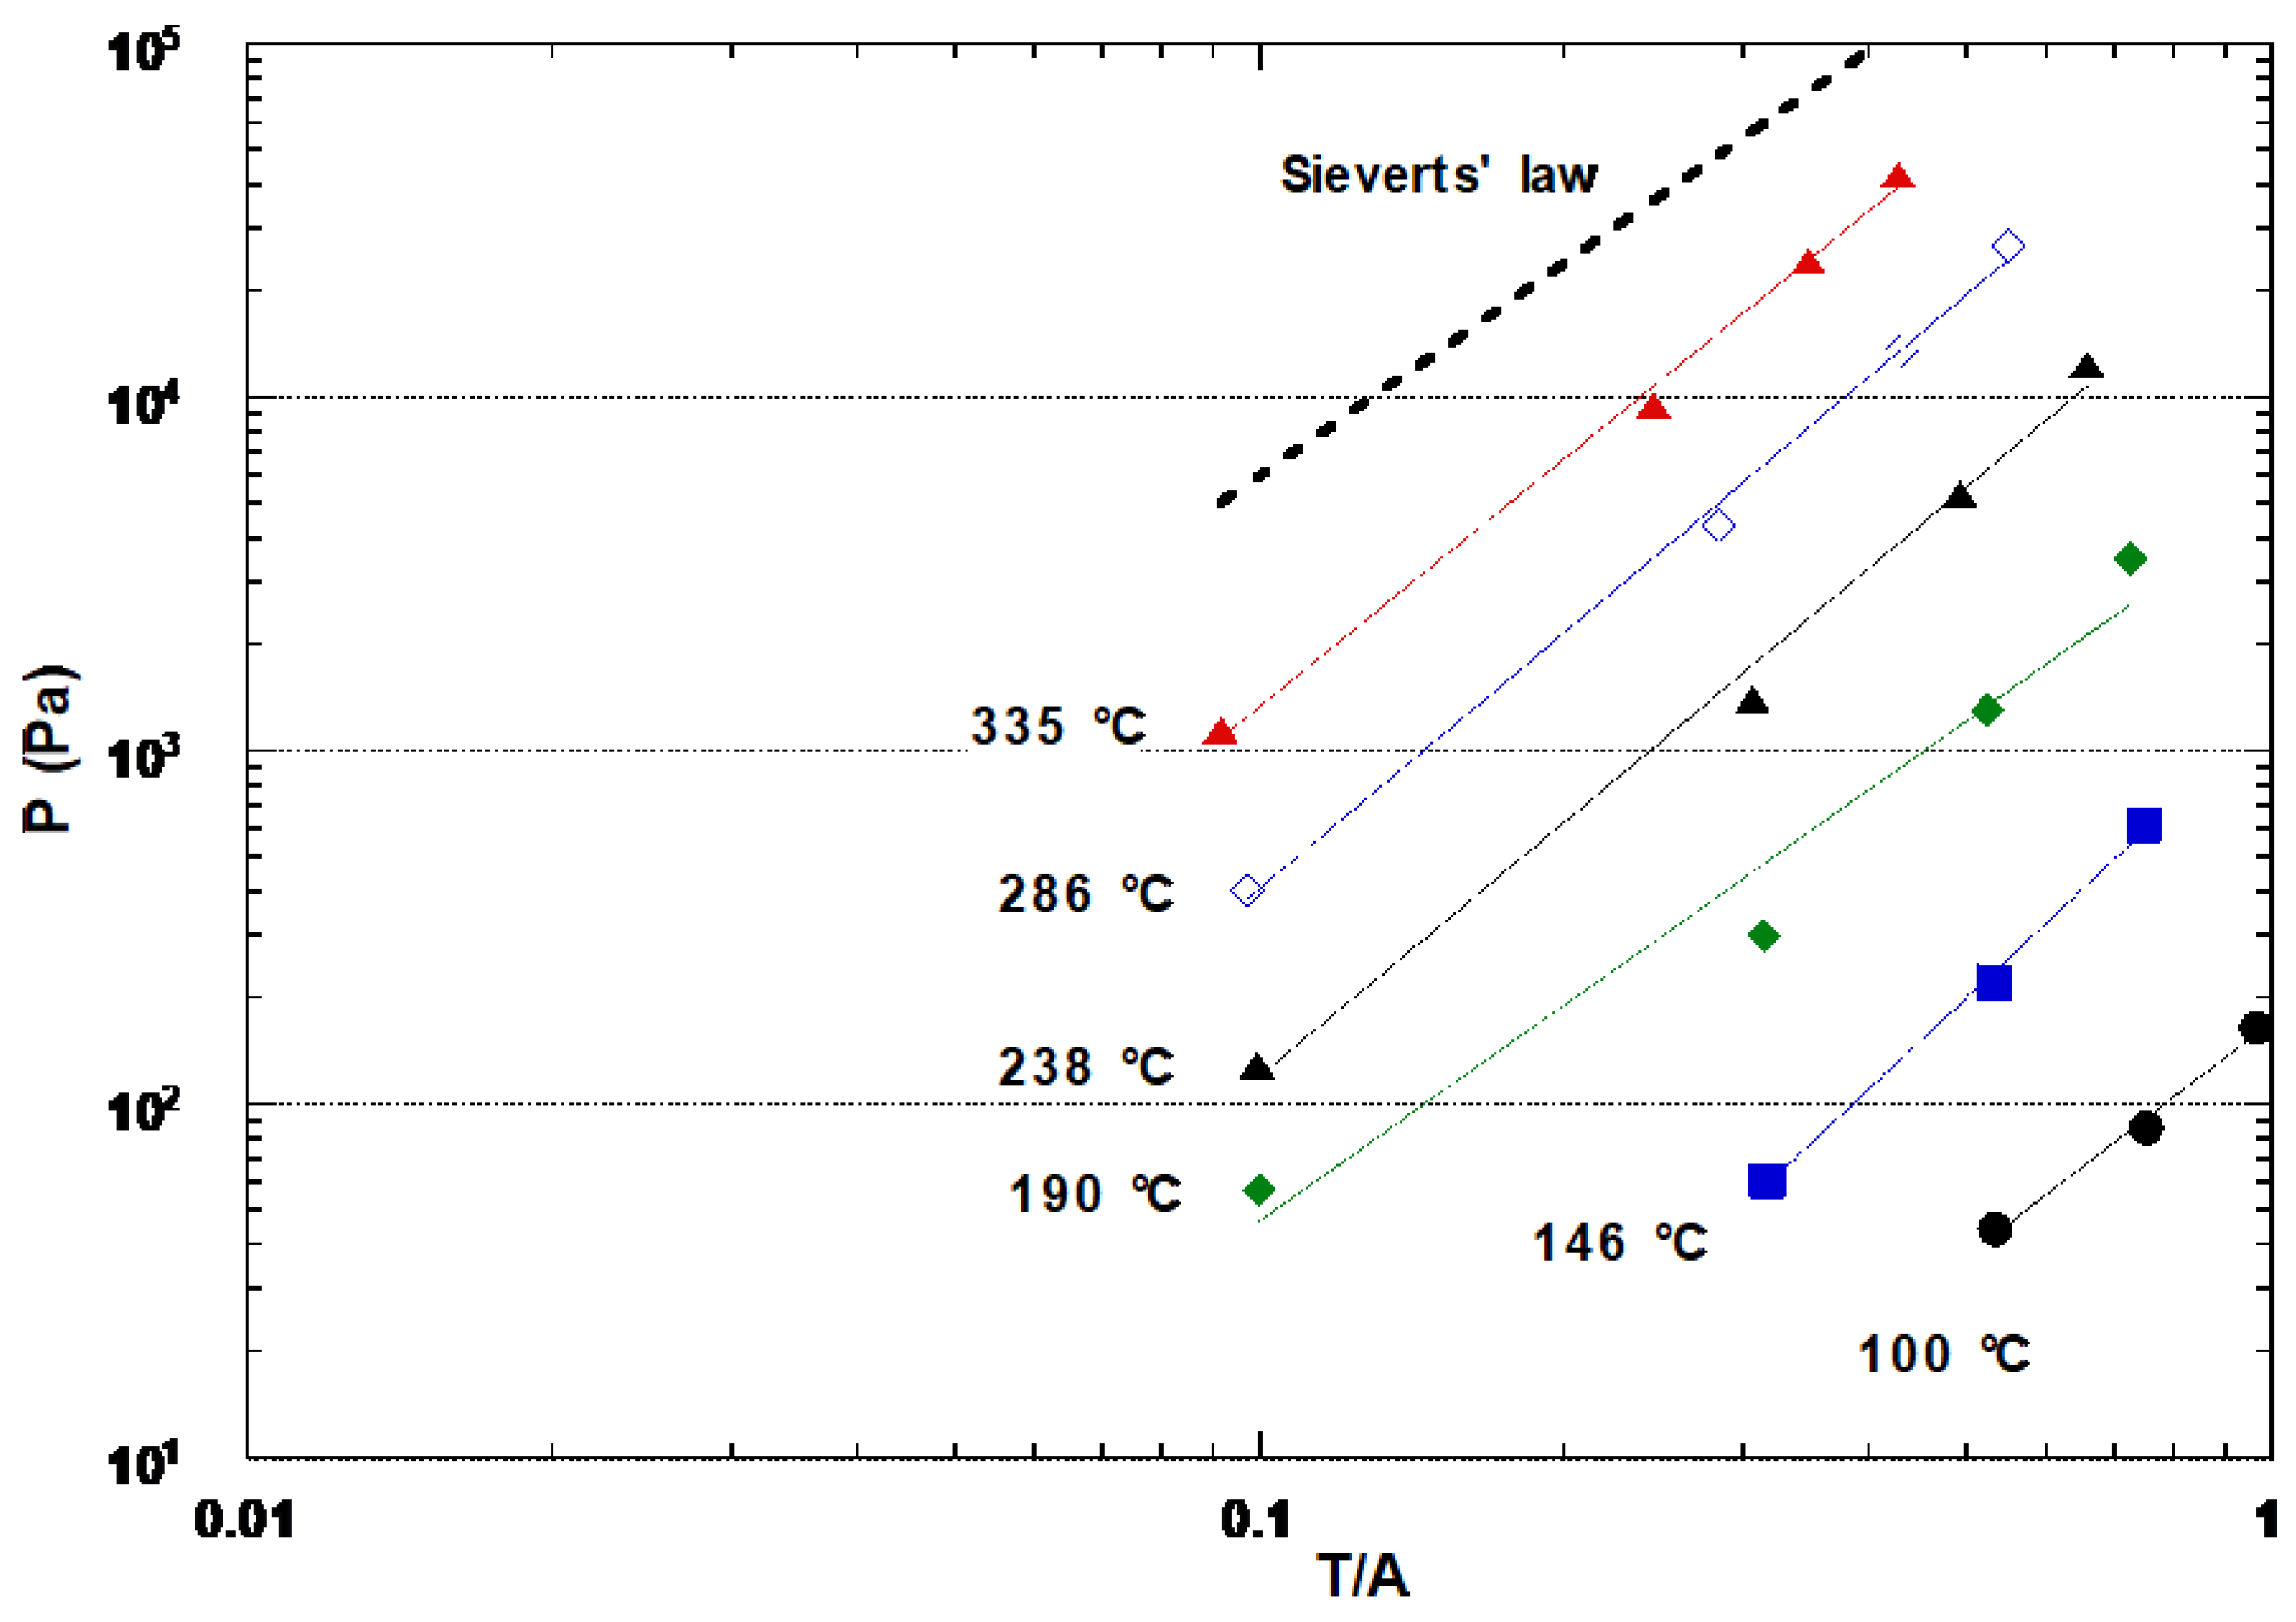
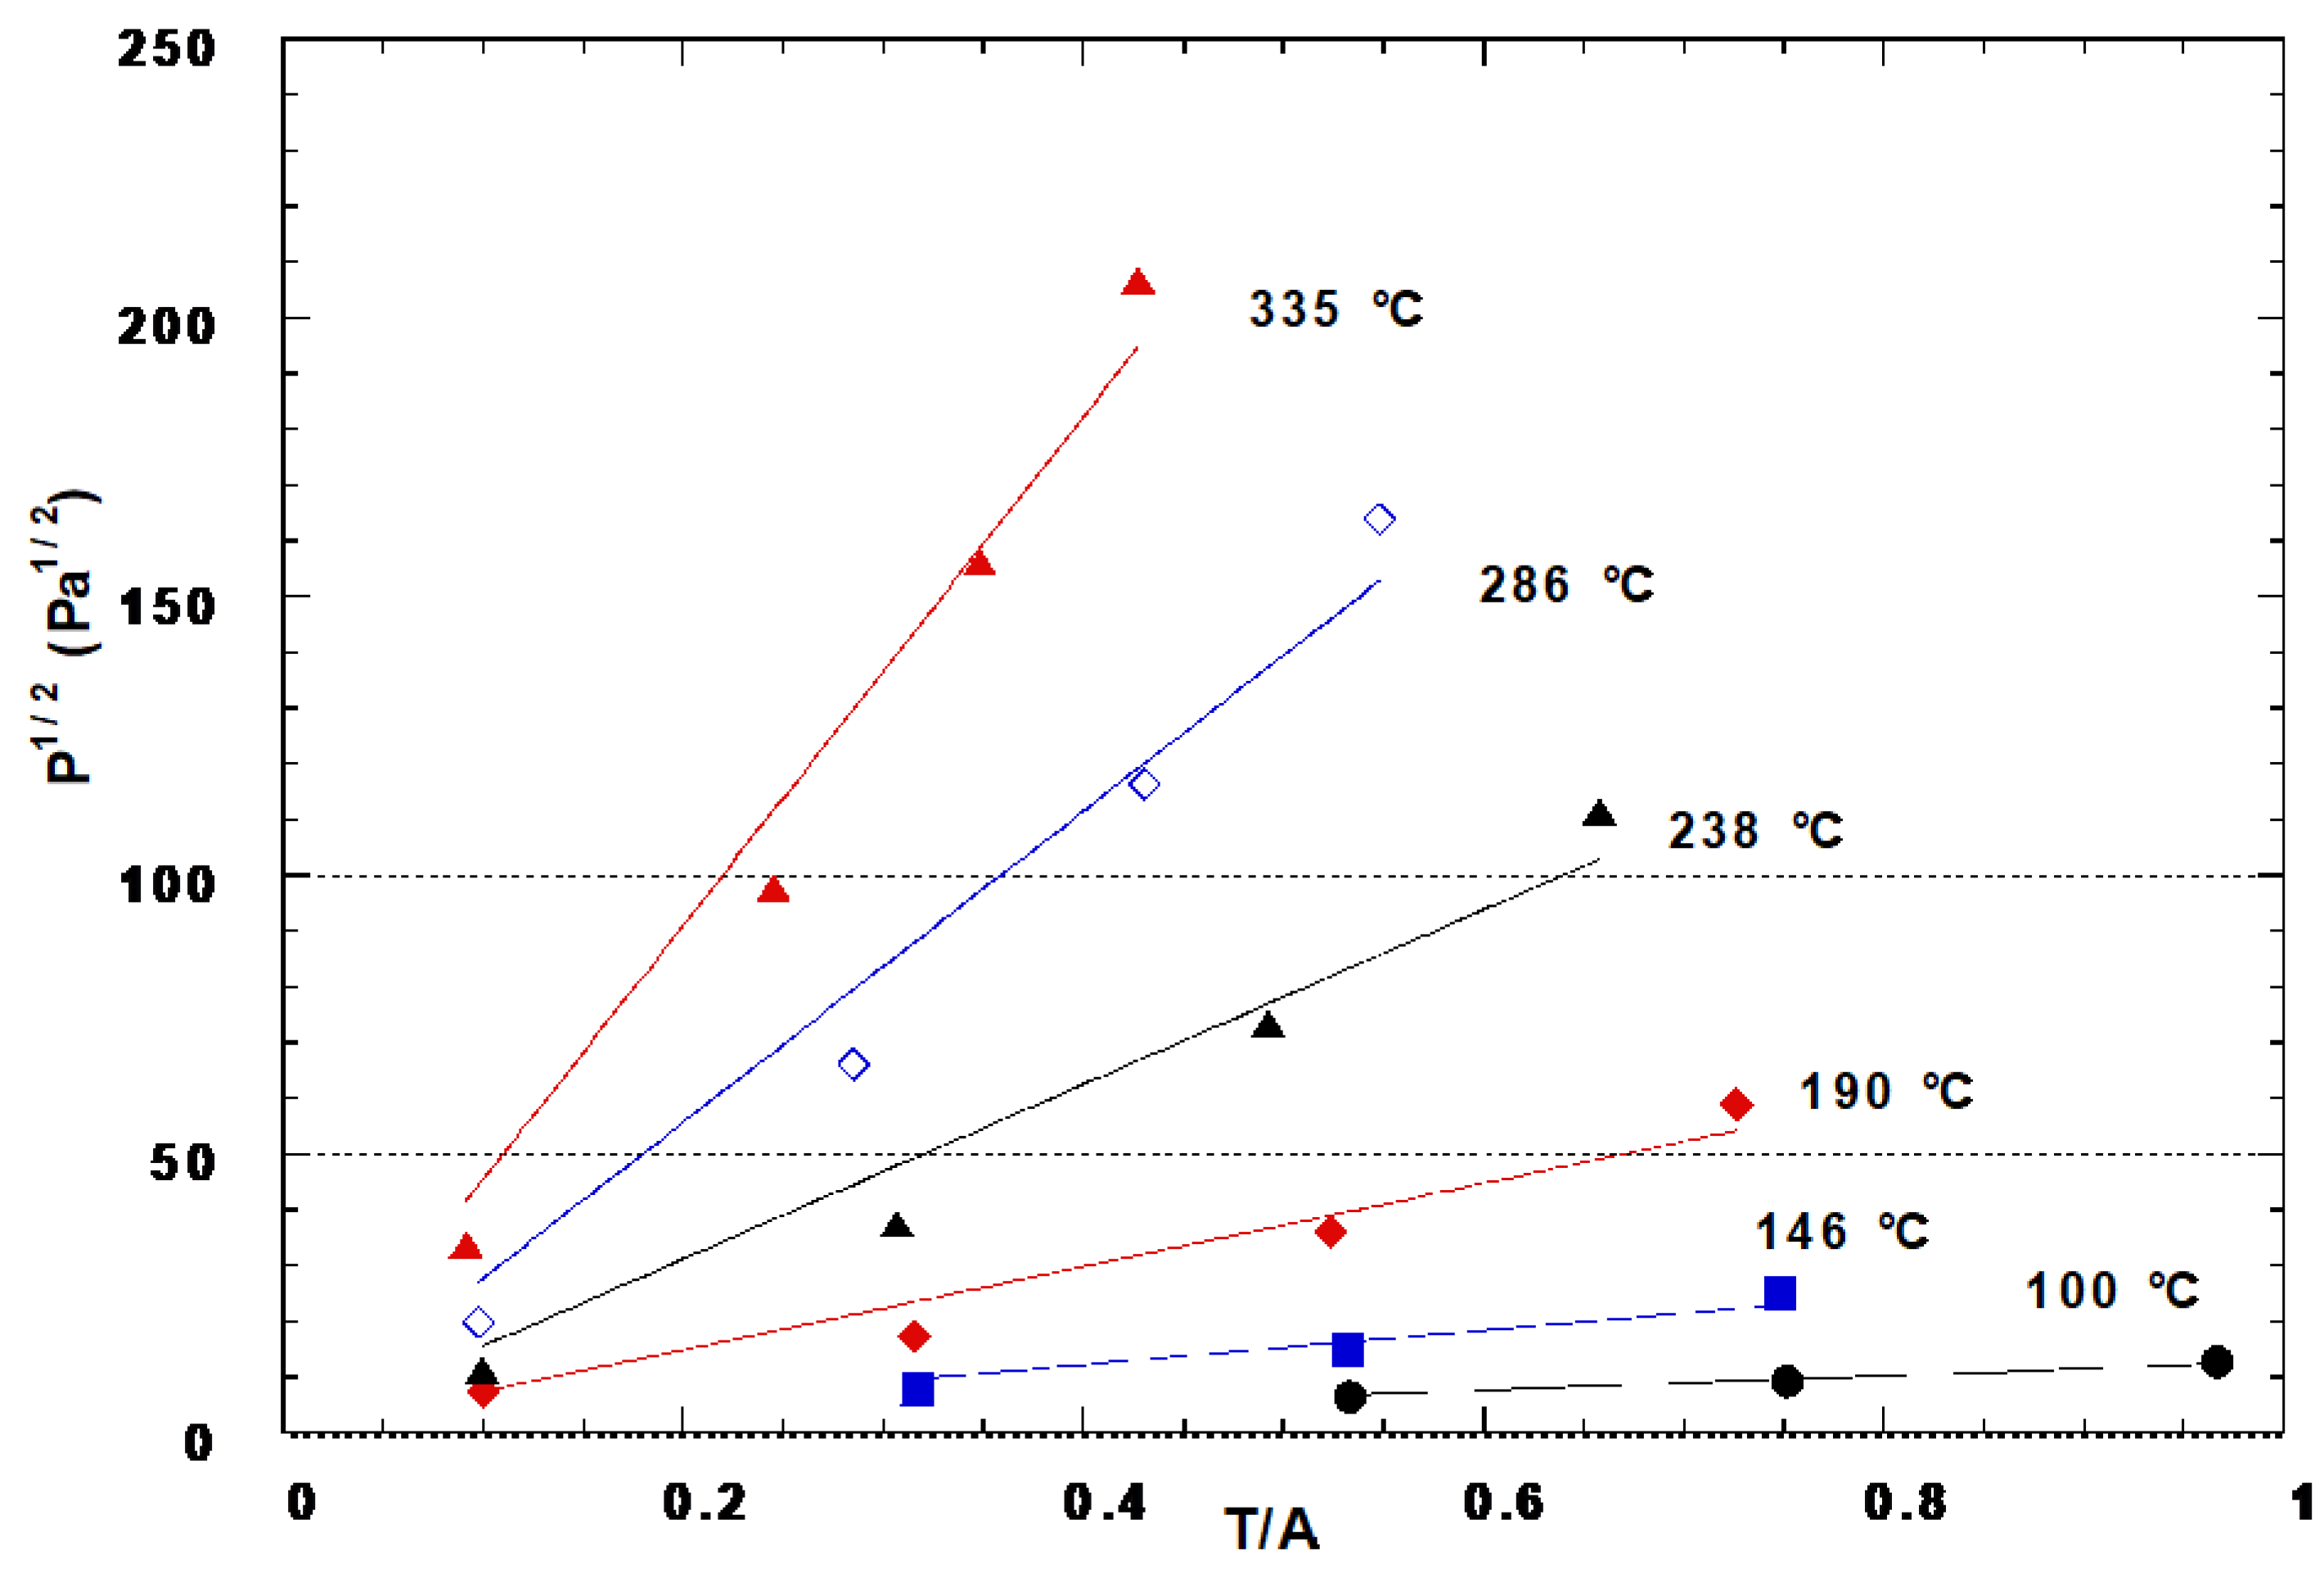
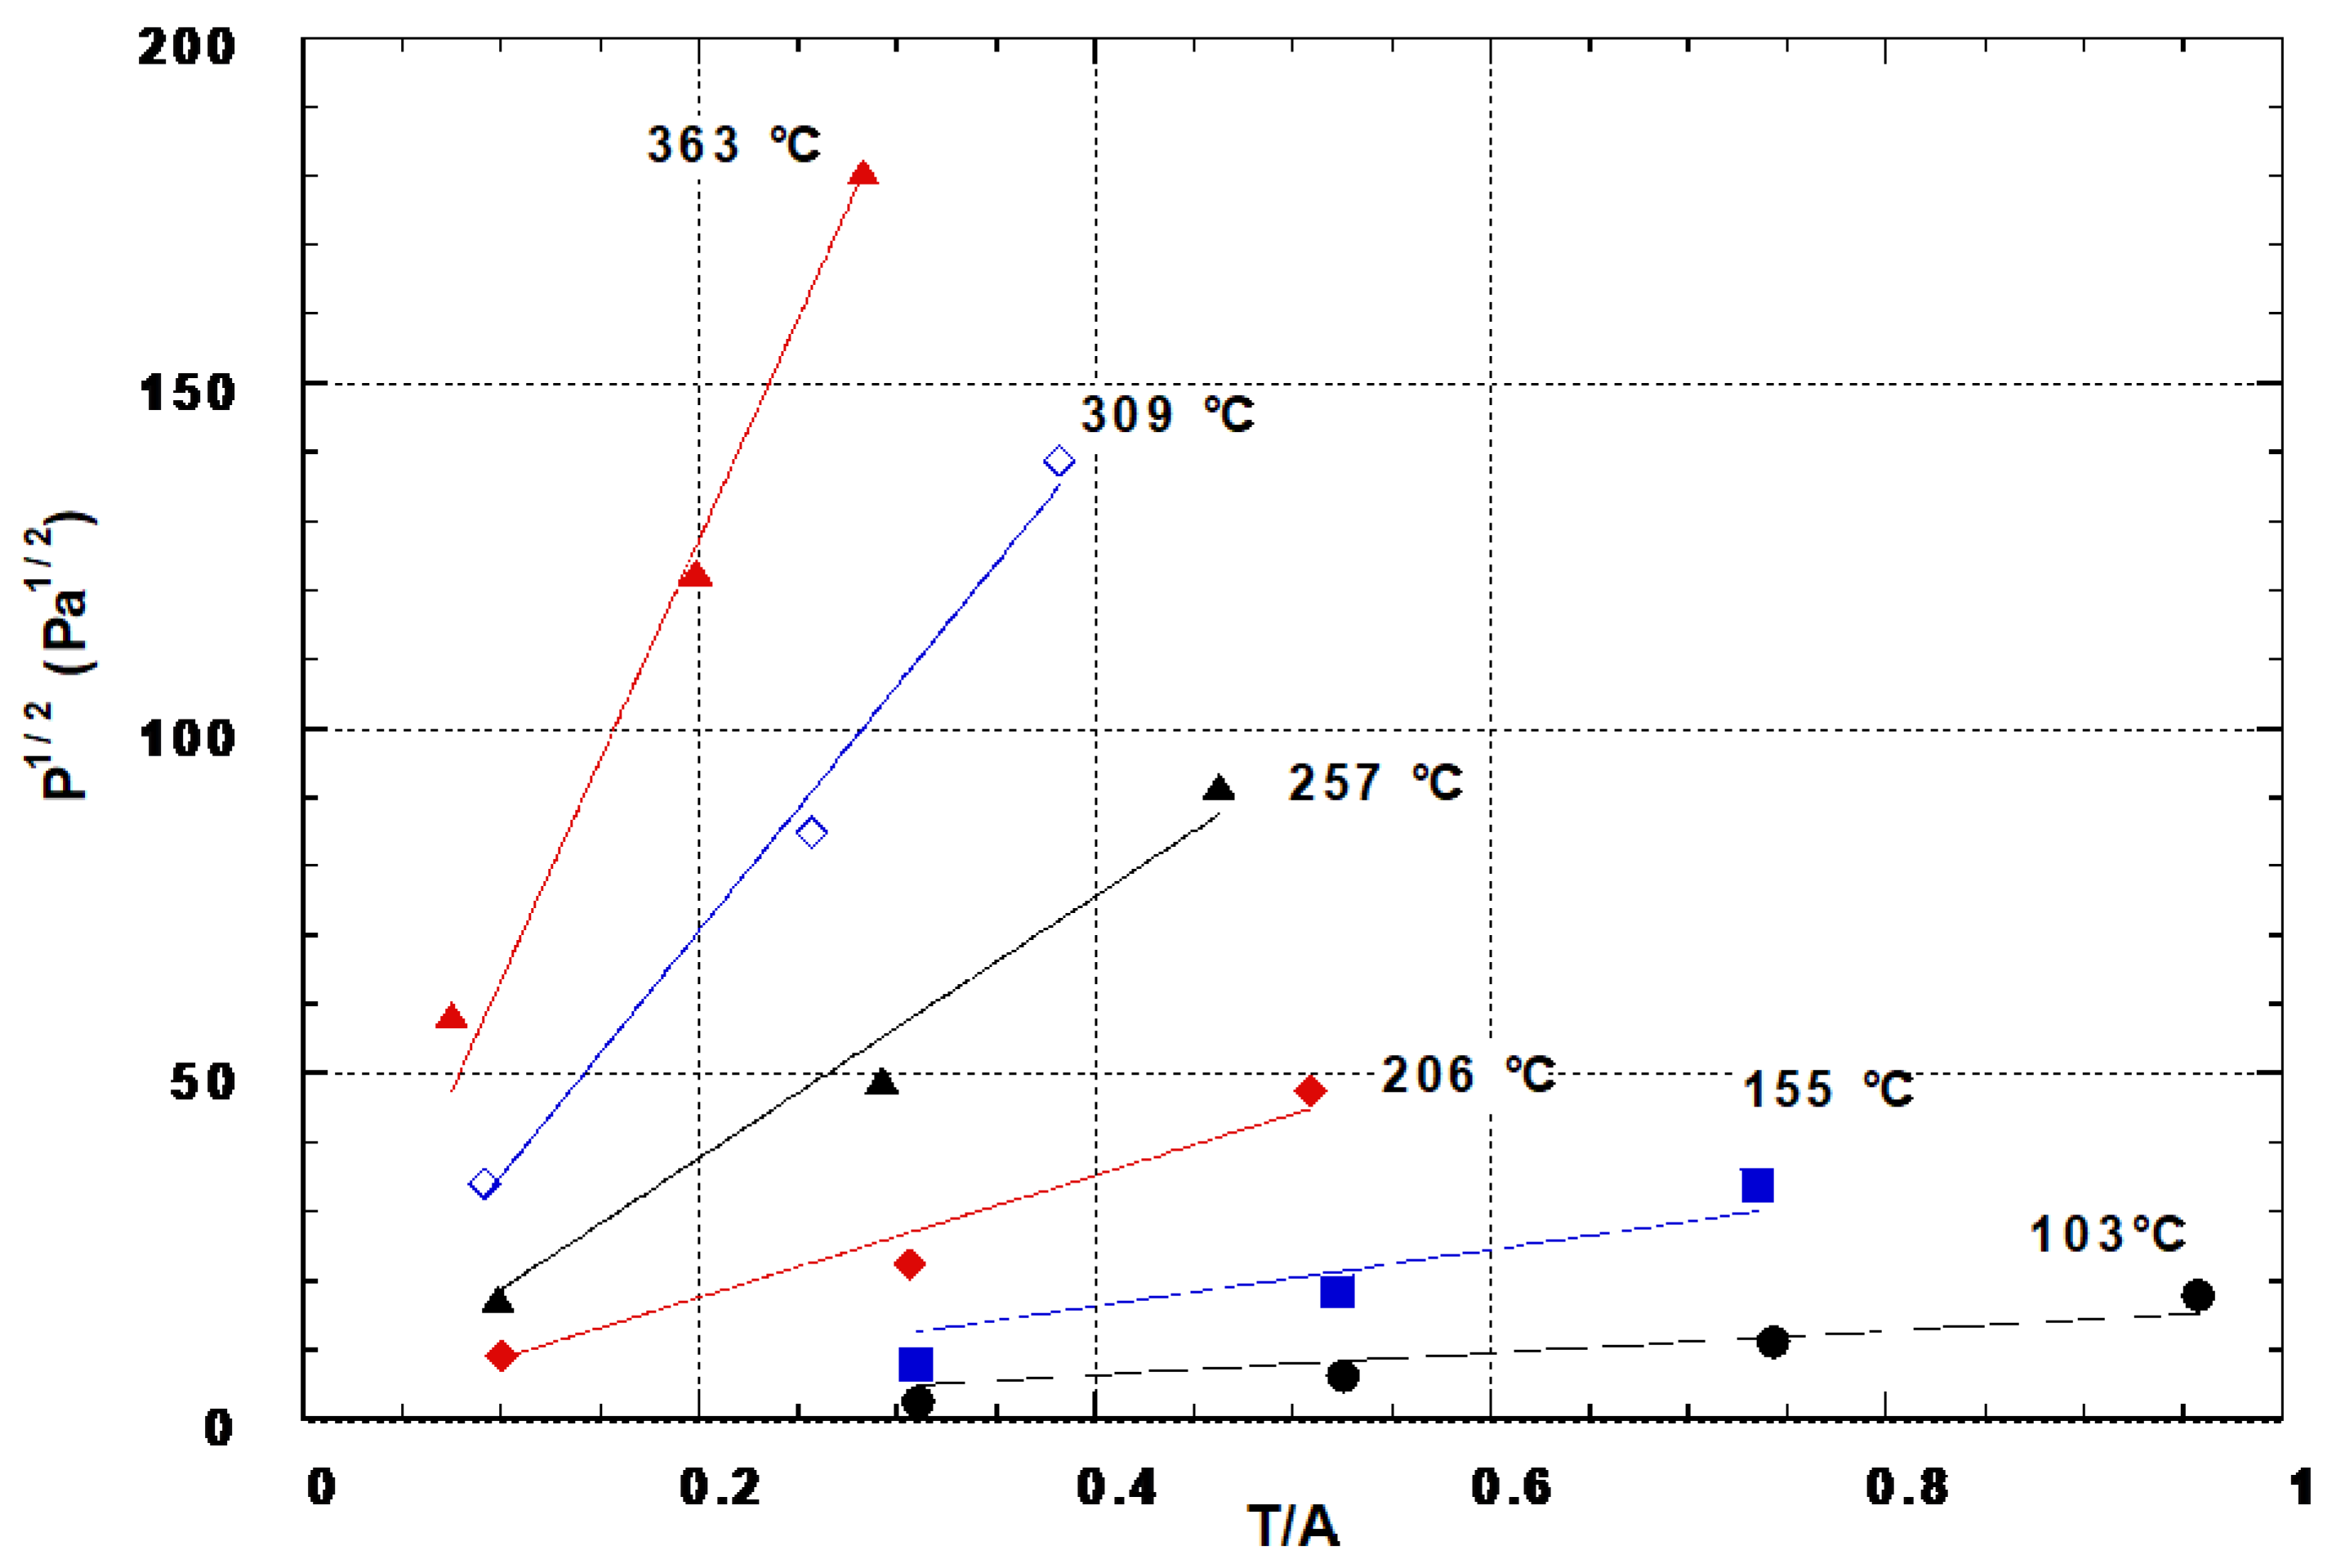
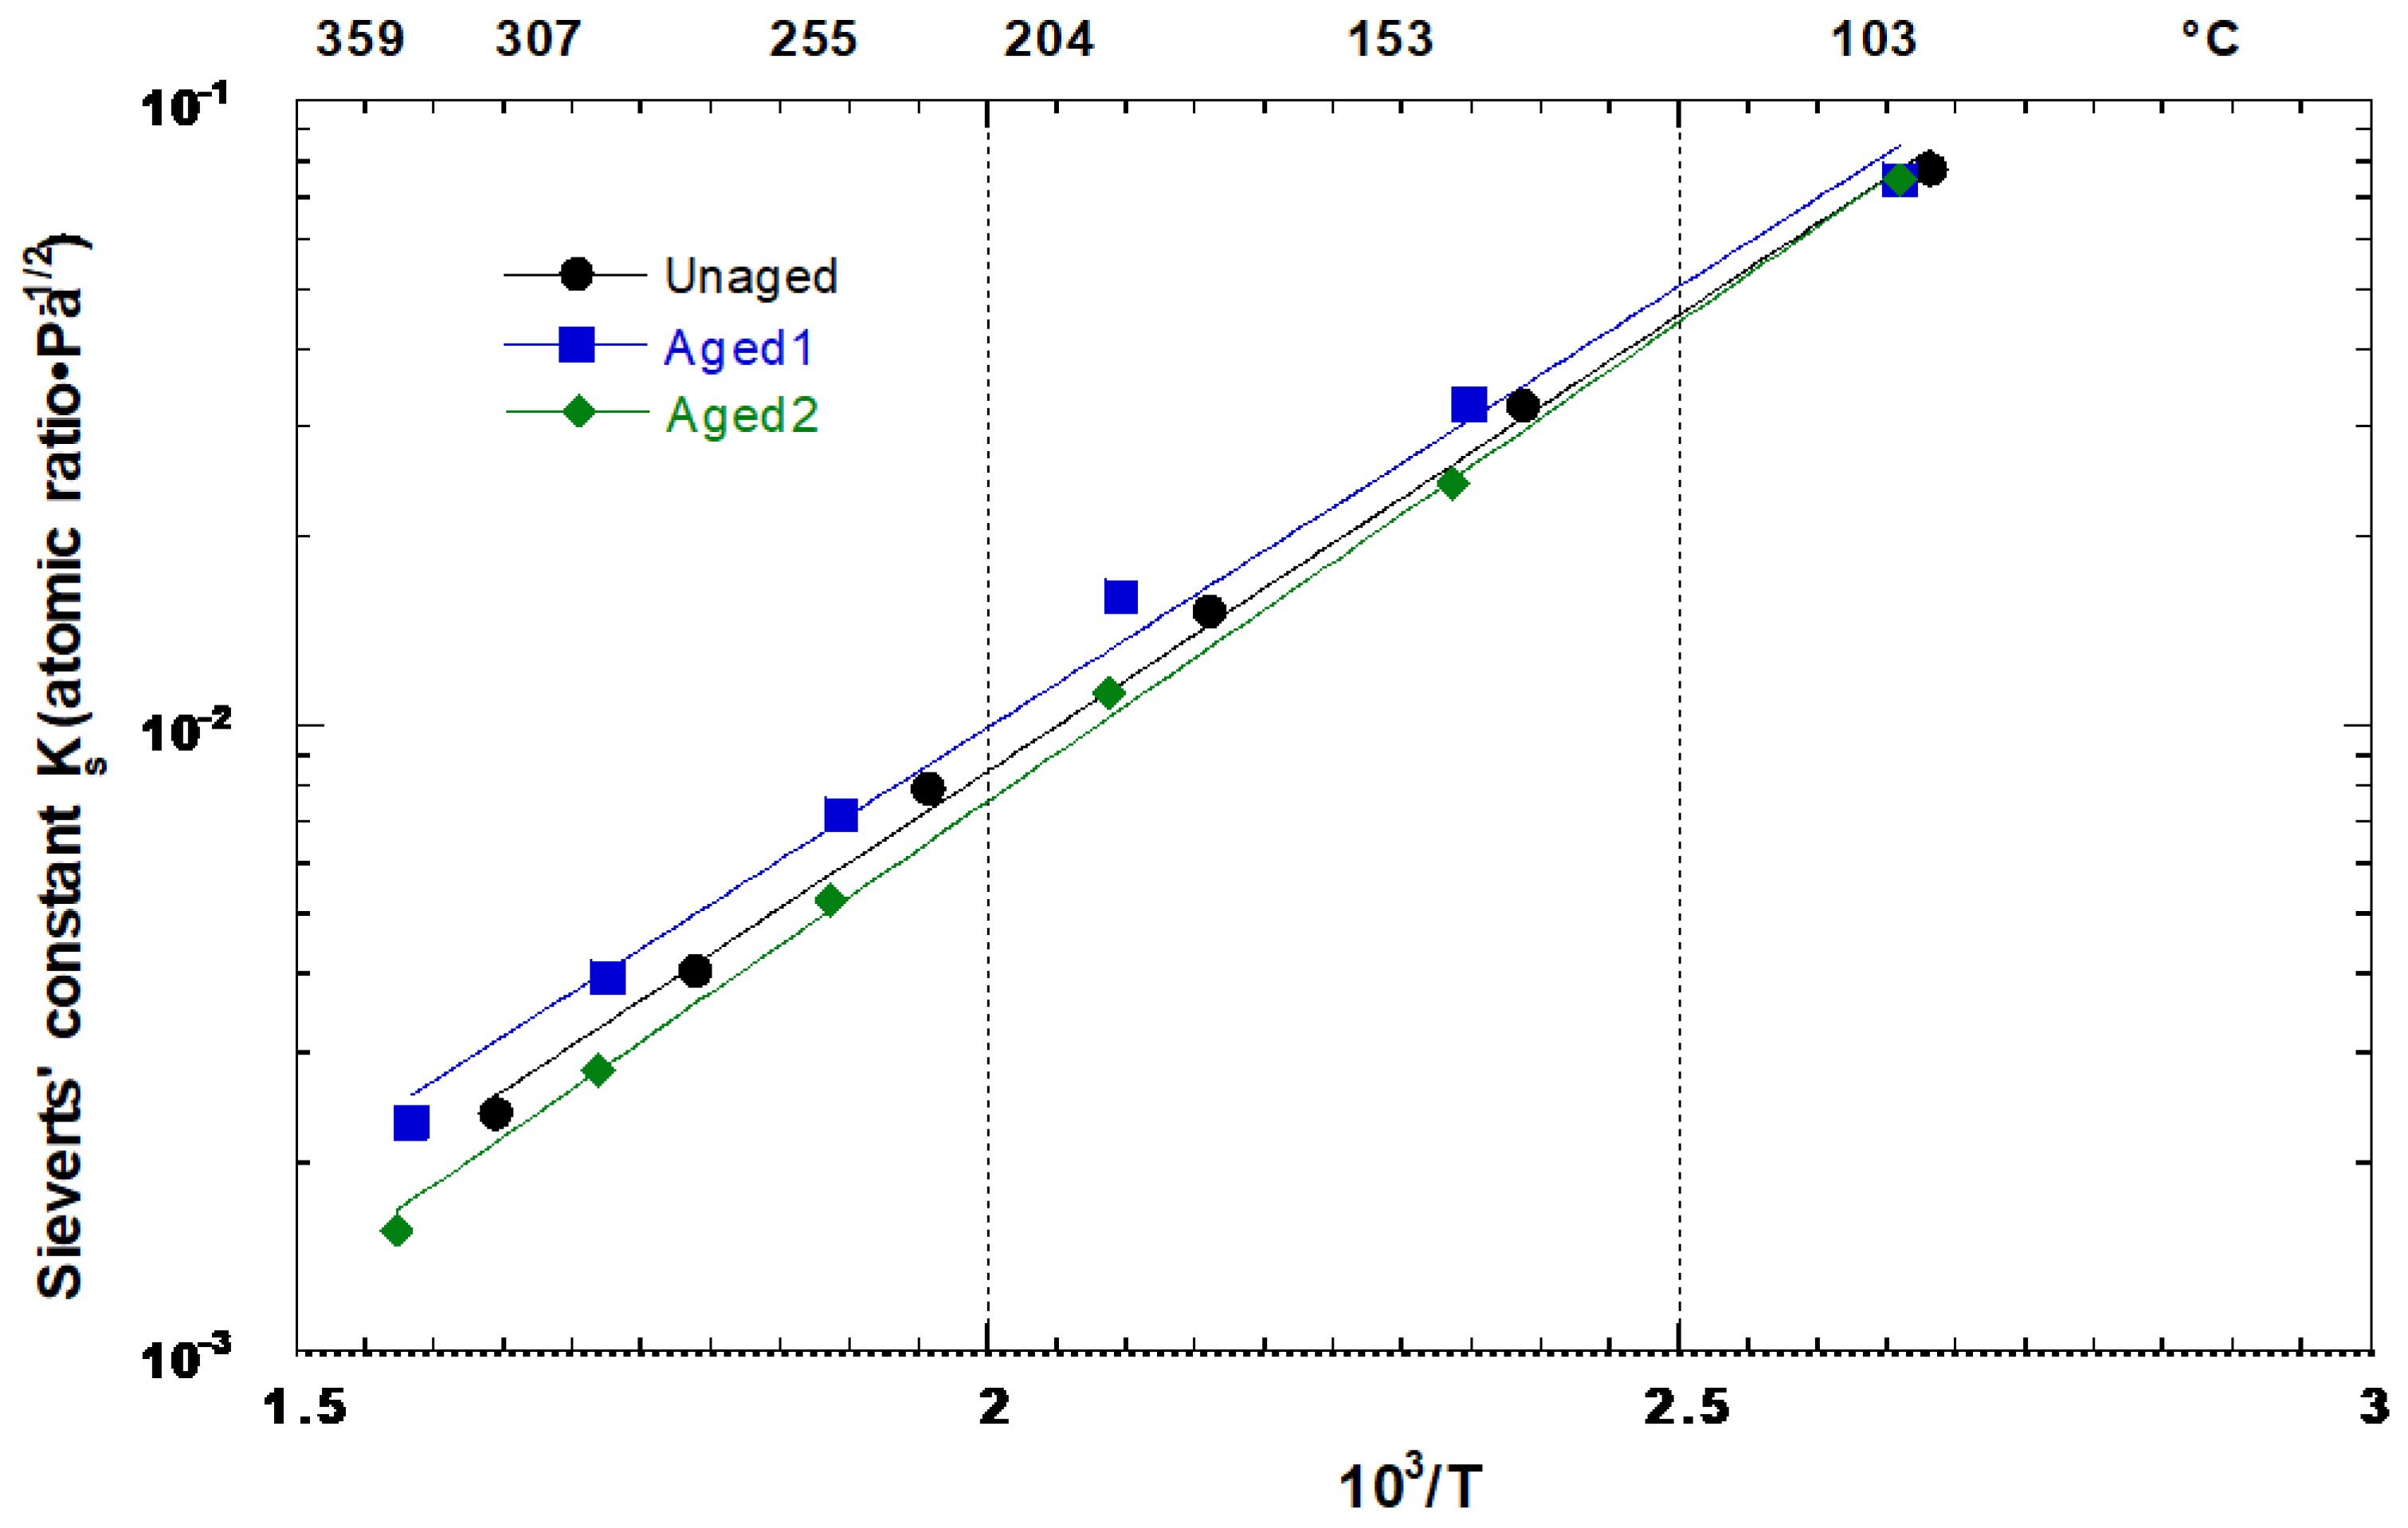
The analysis of the aged data for the solution region was carried out as in Section 4.1.1 and Section 4.1.2, and the results are summarized in Figure 14, Figure 15, Figure 16, Figure 17 and Figure 18. The corresponding thermodynamic data are given in Table 6. The squared correlation factors for the fittings in Figure 18 were very close to unity suggesting that the dissolution of tritium for dilute concentrations can be represented by an Arrhenius plot for the aged data as well.
Let us compare first the UR and Aged1 data. After 1500 days of aging, the distribution of He3 in the alloy can be thought of as predominantly in the form of bubbles and clusters, with only a small fraction in the form of interstitial sites. The dissolution of tritium at dilute concentrations occurs interstitially in a random fashion, neglecting the areas occupied by bubbles (that is, where tritium can no longer dissolve) and focusing our attention on the helium residing in the interstitial sites. A helium atom in a site occupies a larger volume than a tritium atom [35], and therefore causes lattice stress. Depending on the strength of the helium–metal interaction, the original site and the neighbor sites can be modified and no longer be available for tritium dissolution. However, if the helium atom diffuses away from that site, stress release can occur as a consequence of which the lattice can elastically regain its original configuration, or set close to it with a residual strain, so restoring the sites for dissolution. This is equivalent to stating that, far away from the bubble zones, tritium can be still dissolved randomly in the interstitial sites available in the aged alloy. This interpretation is supported by the consideration that the change in ∆ between the UR and the Aged1 data is very small. Recalling that H = U + PV, and that usually the contribution of PV can be neglected, leads us to expect a small change in the potential, hence in the geometry of the sites as well. Looking at at infinite dilution supports the hypotheses that tritium dissolves randomly even though there are sites occupied by helium. The small change in ∆ is acceptable since the value of ∆/R is still close to 7. However, as already mentioned, the values of ∆ for the Aged1 and Aged2 data sets were calculated taking xs = 6, while the real value of xs in the presence of helium is not known. In addition to this, we note that ∆ and ∆∞ cannot change independently. Indeed, normally the major contribution to the change in ∆ is due to a change in the vibrational levels of the atom in the site. A change in the vibrational frequency therefore would also affect ∆ via the Magerl and Stump relation [25]. However, as also shown by Sakamoto [36], a linear decrease in the vibrational frequency of the hydrogen atom as a function of the metal–hydrogen distance occurs for tetrahedral sites in a transition metal hydride, as it is in our case. This means that whenever the change in ∆ (whose fitting is not affected by xs) is not ascribable to a change in the geometry of the sites, the vibrational frequency does not change and the change in ∆ therefore must be necessarily ascribed to a change in xs.
Now switching to the Aged1 and Aged2 data, we note that the magnitude of the changes in ∆ and ∆ is larger than that between UR and Aged1, and that, besides this, these changes are in the opposite direction. We interpret this as due to the helium produced and retained during the week elapsed between Aged1 and Aged2. Indeed, the amount of helium released during this time was negligible, the temperature at which the isotherms were determined was too low to thermally increase helium migration and, assuming that the helium migration time constant (τ = = 3 × 10¹⁴ d with L ≈ 20 ≈m and, for example, D = 10−25 cm2/s [30]) in the alloy to be longer than a week, the He3 produced can be considered frozen in the sites where it is formed without changing the scenario. The increase in (≈0.0043) between the two sets of measurements therefore can be thought to be distributed in the interstitial sites. The evidence that such a small amount of He3 strongly affects ∆ and ∆ indicates that He3 formed in an interstitial site and there residing considerably modifies the structure surrounding the site.
Two effects can be recognized in this respect: a volume effect and an electronic effect. The volume effect arises from the fact that the He3 atom occupies a larger volume than a tritium atom in a site (rHe3 ≈ 0.93 Å and rT ≈ 0.45 Å) [35]. The corresponding expansion of the site induces a contraction of the neighbor sites, as a consequence of which tritium atoms can no longer reside there. This effect is higher for high-density alloys than for low-density alloys. For example, comparing the St 737 with the Zr hcp, whose atom density is, respectively, 6.43 × 1028/m3 and 4.26 × 1028/m3, we see that Zr has a total of 6 sites per unit cell, while St 737 forms 68 sites per unit cell. Even though, in the hypotheses of rigid spheres, the lattice parameters a and c are larger for the latter, the largest sphere that can be accommodated in a site is in any case smaller for St 737 than for Zr.
In conclusion, a He3 atom produces a large lattice distortion in St 737 and, due to this, some of the neighboring sites can be squeezed, some others can increase their volume which in turn means that a smaller number of sites are available, or that the solubility is lower with respect to the unaged alloy. However, at infinite dilution, tritium dissolves first in the sites where the potential well is deeper (squeezed sites) with a smaller M–H distance and therefore the vibrational frequency (or the temperature) and ∆ increase. This is just what has been observed, for example, in the La alloy [37]. Concerning the electronic effect, this is due to the interaction of helium with the metal atoms. When formed by tritium decay, the He3 atom tries to complete its s shell modifying the electronic distribution in the atoms of the site, which causes a lattice strain. For example, Wilson [32] showed that the He–Ni interaction produces a large deformation in the Ni lattice. As for the case of the Aged1 data, however, such a high value of ∆ for the Aged2 data loses its meaning because, in order to be consistent with the rationale for the change in ∆, some sites become prohibited to tritium, so that the actual value of xs must be necessarily less than 6. For instance, taking xs = 4, we obtain ∆/R = 7.57, which is close to the value for the UR data. However, as already mentioned, if the M-H distance in the site changes, then the vibrational frequency will also change, affecting ∆, which accordingly can be no more uniquely determined. In this perspective, the motivations for a high critical value provided in Section 4.2.1 seem to play in favor of the formation of a higher number of bubbles, or of bubbles with higher helium density, in comparison with other alloys rather than of the formation of He3 in the interstices. Indeed, in this latter case, He3 would have brought a stronger change in ∆ for the Aged1 data.
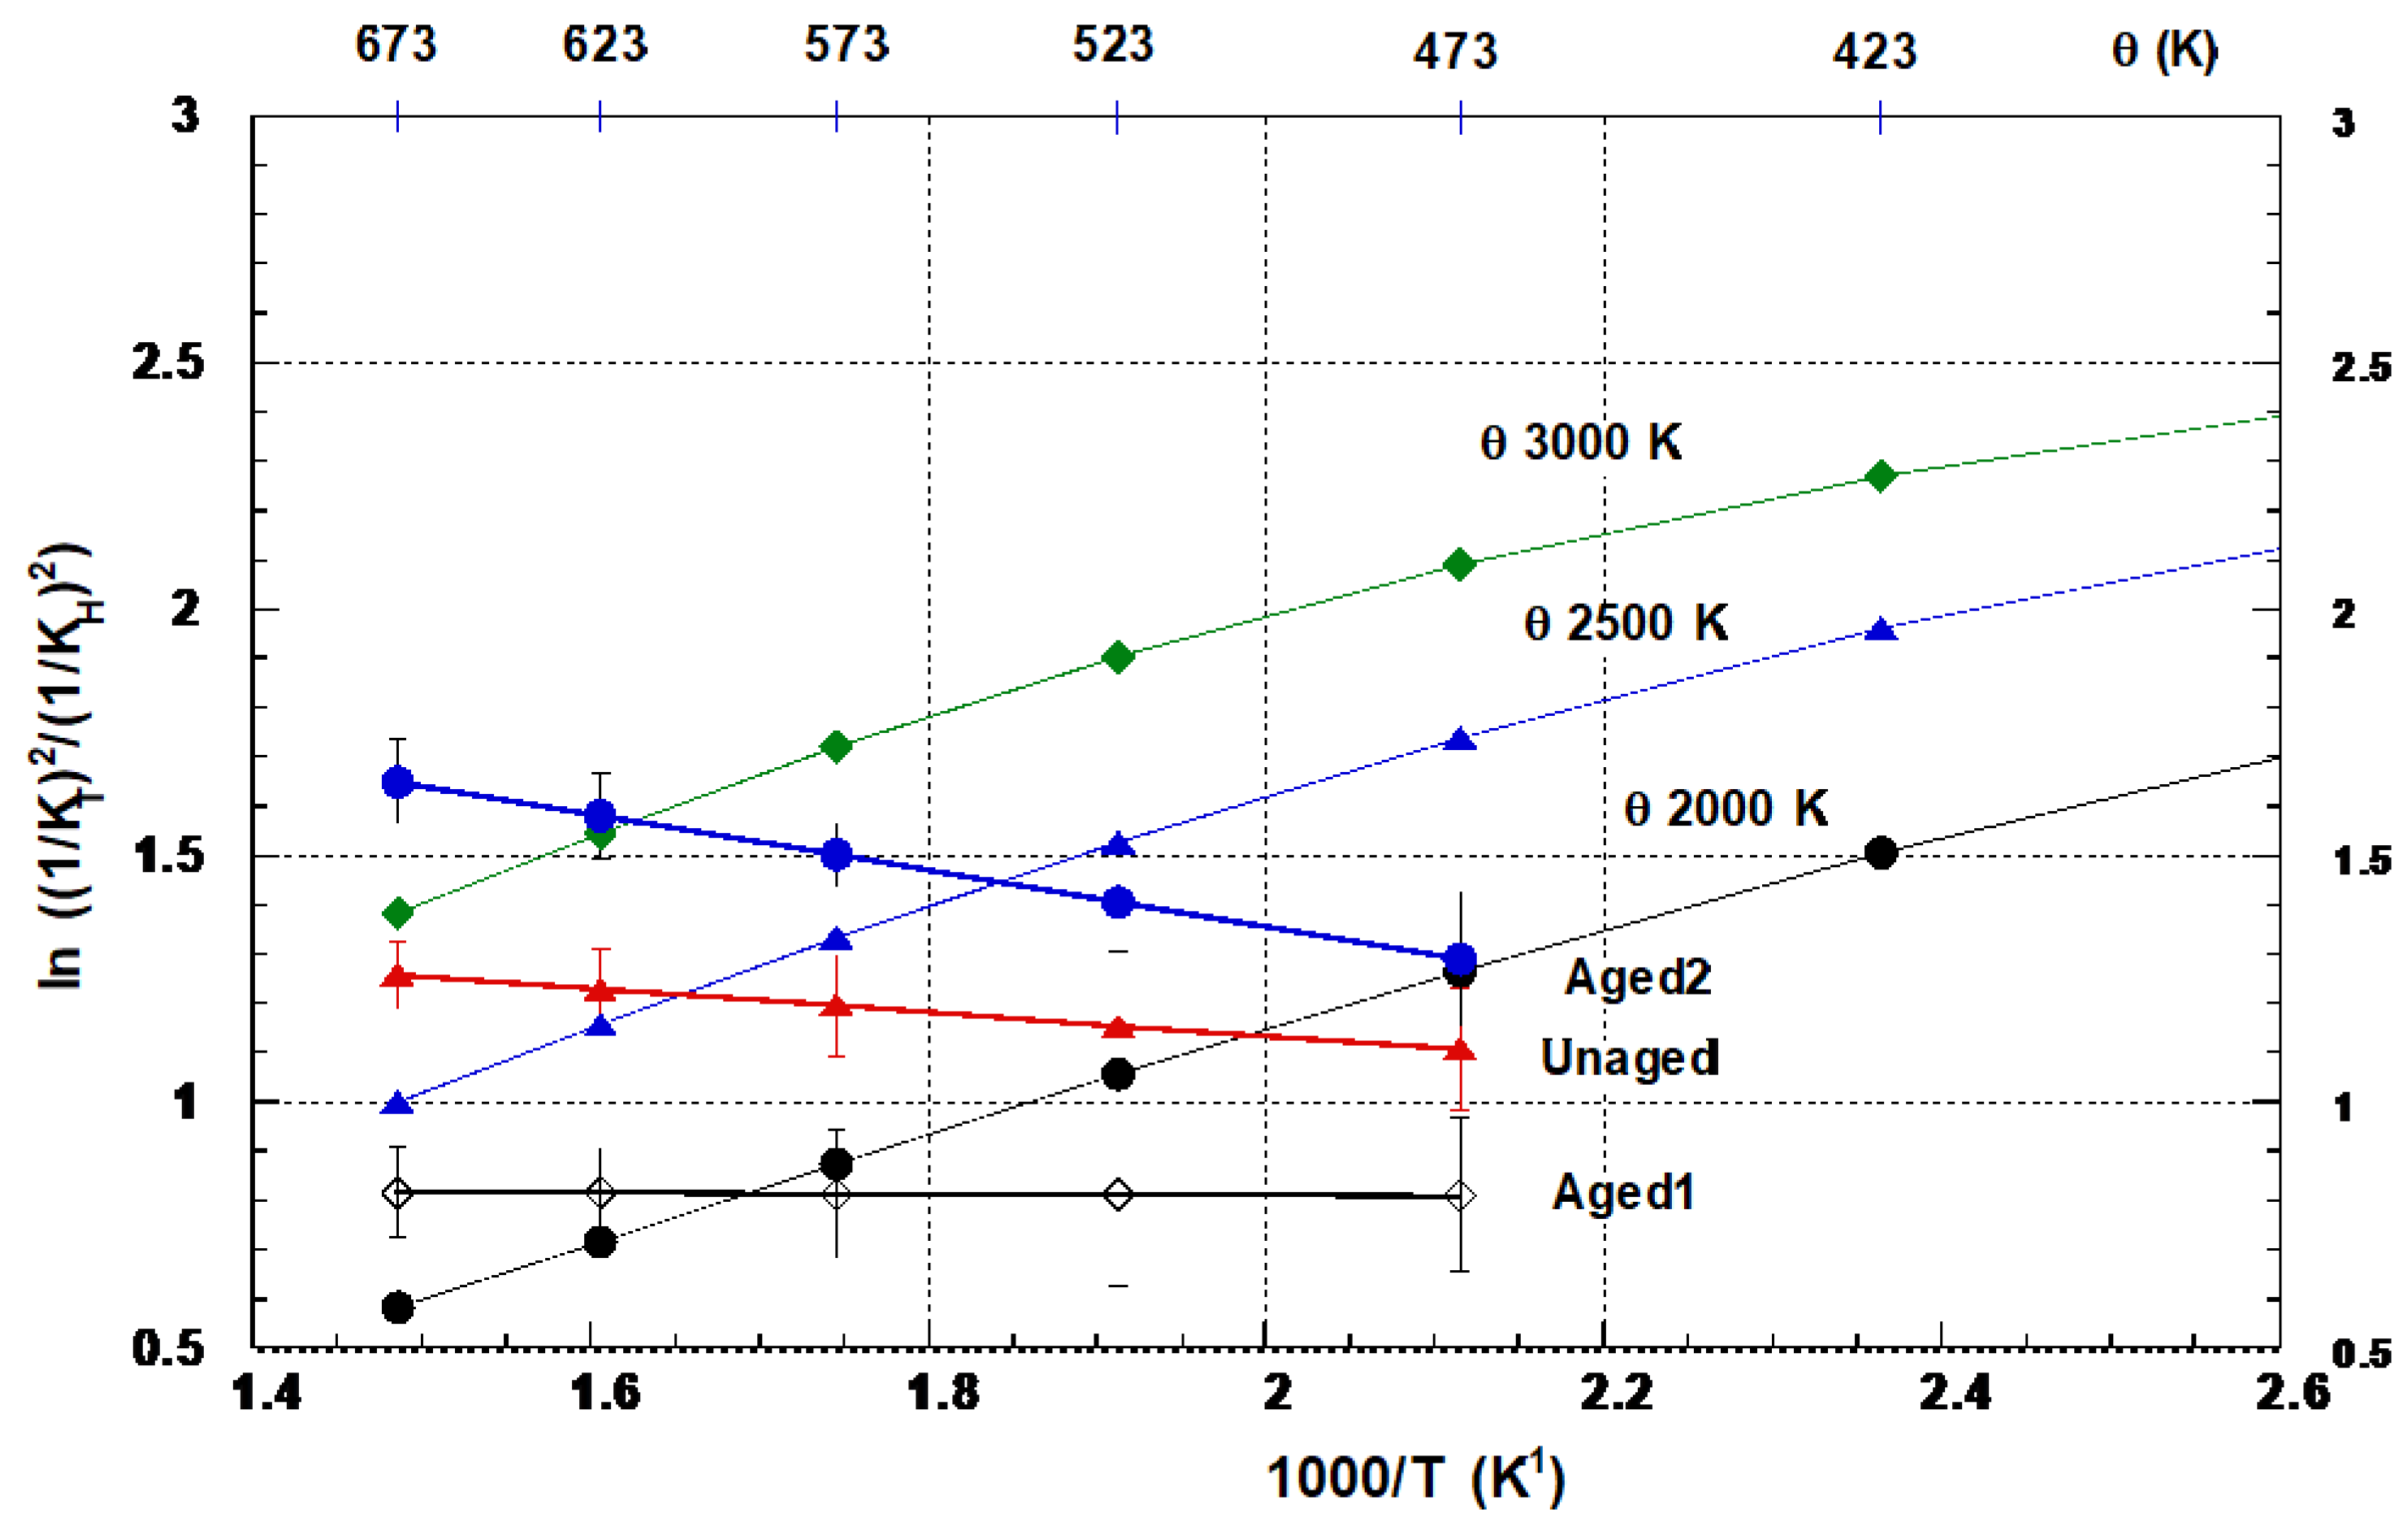
An attempt to justify the rationale regarding the site occupancy in the aged alloy discussed above was accomplished applying a model suggested by McLellan on the solubility data [23,38] and usually applied to infer the hydrogen vibration temperature in the site, assuming that the frequency varies with the square root of the mass ratio of the isotopes. First, the hydrogen and deuterium solubility data are fitted and then the vibrational frequency is extrapolated to tritium, using the rule above, and the diffusional pre-exponential coefficient is obtained via the Zener approximation. The model also accounts for the anharmonic corrections for the vibration partition function of the hydrogen molecule [39] and has been successfully applied to Ti, Zr and Zr-Al alloy [40,41]. Figure 19 shows the ratio of the tritium over hydrogen solubility vs. 1/T, as given by this model for three hydrogen vibration temperatures, θ′. For comparison, the figure includes the same ratio obtained from the experimental data. As seen, a temperature of 2500 K seems to fit the UR data with an error of ±500 K, while for the Aged1 and Aged2 data, respectively, a lower and a higher θ′ seems to be better. A point to be stressed is that in this plot the hydrogen solubility data of the UR case have also been used for the aged alloy. Since we can reasonably expect that the behavior of hydrogen in the modified lattice reflects the behavior of tritium, as for the UR case, this could have led to an overestimate of the change in the temperature θ’. The extrapolation of θ′ for the Aged1 and Aged2 data therefore does not give the actual new temperatures. What is important is nevertheless the trend of θ′, and there is no doubt that this is toward a lower temperature for Aged1 and toward a higher temperature for Aged2. In conclusion, while for the Aged2 data tritium dissolves first in the squeezed sites, for the Aged1 data the decrease in θ′ reflects a general volume expansion of the sites after stress release.
As far as the entropy term is concerned, according to McLellan [40], the more tightly bound proton would vibrate with a higher frequency and give rise to a smaller vibrational entropy and a smaller partial excess entropy. Therefore, ∆ should be expected to increase for the Aged1 data and to decrease for the Aged2 data, which is the opposite to what we observed. Indeed, in order for the trend described above to occur, the lattice contribution to the excess entropy must be negligible and this is no longer true when the lattice is modified as in the case considered. While no positive argument can be provided in support, it is the opinion of the authors that in this case the lattice contribution prevails over the vibrational entropy to form the partial excess entropy.
B Hydride-Forming Region
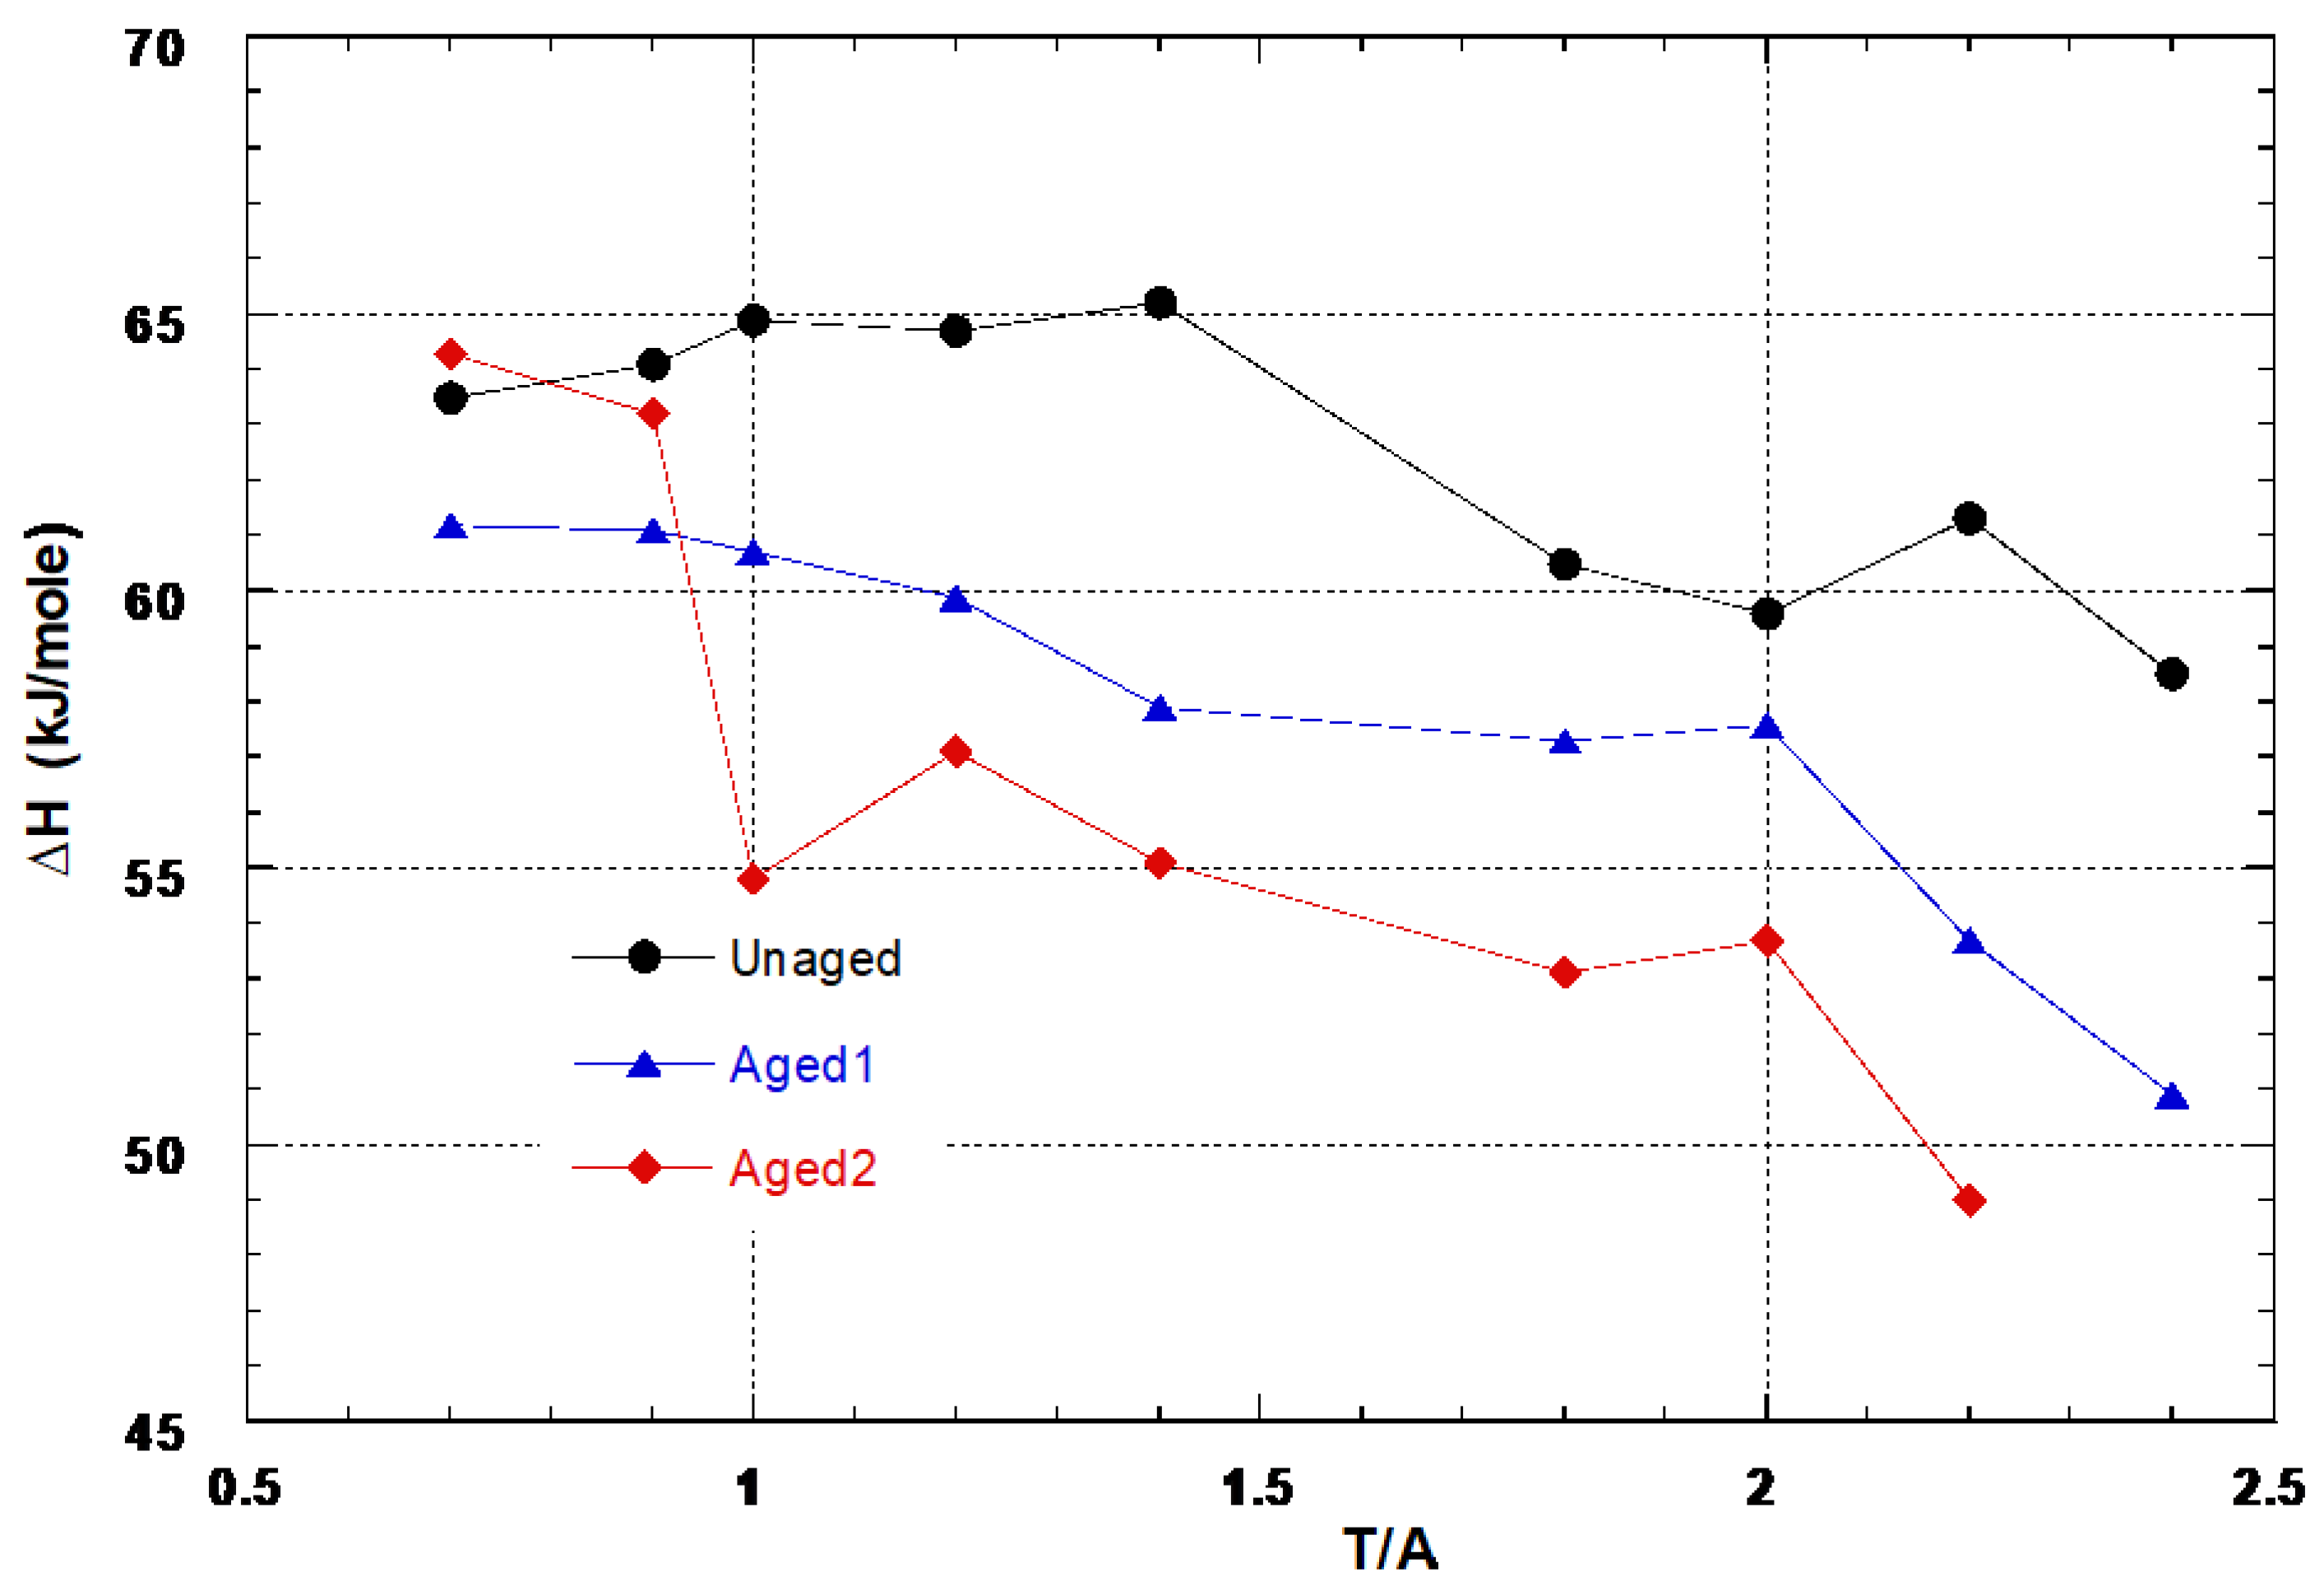
The behavior of the enthalpy and entropy change with the tritium concentration in the hydride-forming region for the aged beds are shown in Figure 20 and Figure 21, respectively, and summarized in Table 7, where the values for the UR bed are also included for comparison.
As seen, in the region considered, the values of ∆H of the aged data are always lower than the corresponding values of the UR data. In addition to this, the ∆H values for the Aged2 data are lower than the ∆H values for the Aged1 data at any concentration, with the only exception of T/A = 0.7. Whether the inverse effect observed at this concentration is due to the scatter of the data or to the presence of a considerable fraction of tritium still in the solute phase remains an open question. Therefore, the values for this concentration were not taken into account in performing the average. The reason for such a different behavior of the thermodynamic data in the hydride-forming region with respect to the solution region must be found in the different nature of the tritium bond. Indeed, transitional d metals such as Fe, Zr and V are known to form covalent bonds with hydrogen [42]. It is therefore reasonable to conjecture that the presence of He3 which tries to complete its s shell can subtract electrons from tritium, and not from the d shell of the metal atoms as one might think, thus impeding the formation of the M–H bond.
In support of this interpretation, the following arguments are noteworthy:
- (a)
- The ionization potential for He is higher than that for hydrogen; therefore, the capture of a tritium electron entering into the metal lattice is possible;
- (b)
- The capture of an electron of the d shell of the metal by He3 would decrease the d character of the metal, increasing the heat of formation [42], and favouring the conversion to hydride, which is not what we observed;
- (c)
- Increasing the tritium concentration would make more electrons available for He3 capture, thus hampering the hydride formation, as indicated by the decrease in ∆H.
The behavior of ∆S reflects in magnitude (aging) and trend (concentration) the behavior of ∆H. As explained in Section 4.1.2, decreasing ∆H decreases ∆S but raises the pressure.
5. Consequences to the Application of the Alloy
Much emphasis was given to the study of tritium in the solution region rather than in the tritiding-forming region. This is due to the foreseeable use for this alloy as a tritium oxide reducer [2,3,43], as a simple and cost-effective solution with a non-contaminated, or very low level contaminated, waste. This makes the method suitable to reduce small amounts of highly tritiated water.
Several experiments on water conversion showed that the best system configuration is a series of batch reactors in which the alloy undergoes alternating conversion and regeneration cycles. During the conversion cycle, water is dissociated on the alloy surface and a small fraction of the tritium delivered is adsorbed. During the regeneration cycle, oxygen diffuses from the surface to the bulk of the alloy and tritium is extracted via diffusion to the surface. This study shows that He3 present in the interstitial sites induces more tightly bound tritium at infinite dilution, which to the purpose of conversion represents the residual contaminating inventory. An increase in the temperature of the alloy during the regeneration to extract this fraction should be avoided to keep the permeation losses through the walls of the bed to a minimum. Therefore, as regards the comparison of the aged data, it can be said that to minimize the residual inventory, tritium should reside in the alloy for no longer than a week.
6. Conclusions
The effects of aging in Zr(Fe0.5V0.5)2 tritides were studied in view of the application of the alloy. Two beds containing 1 gram of alloy each were used. In the first bed, the isotherms of tritium were obtained and used as a reference for the virgin alloy. These data and the isotherms with hydrogen were used to investigate the reliability of the UR data and the thermodynamic parameter for dissolution and tritide formation. The second bed was loaded with tritium at 75% of stoichiometry and aged for 1500 days. Then, the bed was unloaded and the new isotherms were determined and checked a week later for repeatability. The new thermodynamic parameters were calculated and compared with those of the virgin alloy.
The main results can be summarized as follows:
- The alloy shows a high critical value of He3 concentration (0.48) before it enters into the accelerated helium release rate phase; the reasons for this seems to reside in the lattice structure of the alloy and in the number of defects and impurities which form an elevated number of high-density helium bubbles;
- The study of tritium dissolution after 1500 days of aging suggests that He3 is mainly present as bubbles; the lattice sites where tritium dissolves relax close to their original configuration, slightly changing the enthalpy of solution; the number of sites available for the unit cell, however, reduces and therefore the equilibrium pressures increase;
- The He3 present in the interstitial site distorts the lattice of the alloy in such a way that tritium dissolved at infinite dilution turns out to be more tightly bound than hydrogen;
- The behavior of the thermodynamic parameters in the hydride-forming region is different than that in the solution region; however, the change in the nature of the tritium bond due to the presence of He3 is not sufficient to exhaustively explain this behavior;
- To minimize the residual inventory, tritium should reside in the alloy for no longer than a week.
These results provide a guideline for the design of a system in view of the application of this alloy. However, further investigation of the subject, by neutron diffraction on deuterated samples and inelastic neutron scattering, would be advisable to definitely validate the rationale of this study.
Author Contributions
F.G.: Conceptualization, methodology, formal analysis, investigation; writing—original draft preparation and editing. W.T.S.: writing—review, supervision. All authors have read and agreed to the published version of the manuscript.
Funding
This research received no external funding.
Data Availability Statement
Data are contained within the article.
Acknowledgments
The author wish to thank N. Venkataramani of Institute for Plasma Research, Bhat, Gandhinagar, Gujarat, India and N. P. Kherani of University of Toronto, Ontario, Canada for their valuable help and the several suggestions.
Conflicts of Interest
The authors declare no conflict of interest.
List of Symbols
| (Ks)Q | temperature-dependent Sieverts’ constant Q = H, T |
| ∆ | enthalpy change at infinite dilution |
| ∆ | non-configurational entropy at infinite dilution |
| ∆ | non-configurational entropy |
| configurational entropy | |
| ∆H° | enthalpy for hydride formation |
| ∆S° | entropy for hydride formation |
| R | universal gas constant |
| H/A | hydrogen over alloy ratio |
| T/A | tritium over alloy ratio |
| He3/A | helium over alloy ratio |
| µQ | chemical potential for the Q atom Q = H or T |
| θ′ | hydrogen vibrational temperature |
Appendix A
Under equilibrium, the chemical potential of Q2 in the gas phase is equal to the chemical potential of the soluted Q atom:
that is:
where µ is the chemical potential, ∆ is the free Gibbs energy, R is the universal gas constant, T is the absolute temperature and P is the pressure.
The relative partial molar enthalpies and entropies are defined, respectively, as
and
where and are the partial molar enthalpy and entropy of Q in the metallic phase, and H°Q2(g) and S°Q2(g) are the partial molar enthalpy and entropy of Q2 in the gas phase, with reference to the standard state as T = 298 K and p° = 105 Pa. The entropy is given by two main contributions:
- (a)
- nonconfigurational, or excess, entropy comprising vibrational electronic and magnetic contributions;
- (b)
- configurational entropy.
This last term is a statistical contribution which can be calculated from Boltzmann’s distribution once the number of interstitial sites available for the Q atoms in the host lattice is known. In the hypothesis of a random distribution of non-interacting hydrogen atoms in the metal sites,
where x is the atomic hydrogen to alloy ratio (H/A or T/A) and xs is the saturation value of x. For an infinitely diluted solution x « xs, Equation (A5) can be approximated as
and Equation (A5) written as
Further, Equation (A2) can be rewritten as:
Reorganizing the terms, we then obtain:
Equation (A9) is a Sieverts’ law type expression in which the constant (Ks)Q (≡) is obtained dividing the expression by (PQ2)1/2.
Plotting the values of (Ks)Q in an Arrhenius form as in Figure 9, i.e., letting
the values ∆ and ∆ at infinite dilution can be extracted from the parameters a and b, and one obtains:
and
log Ks = a + (b/T),
References
- Shmayda, W.; Kherani, N.; Ghezzi, F.; Bonizzoni, G. St 737 for Tritium Service—An experimental evaluation. Fusion Technol. 1992, 21, 1024–1029. [Google Scholar] [CrossRef]
- Ghezzi, F.; Venkataramani, N.; Conte, A.; Colombo, M.; Bonizzoni, G.; Shmayda, W.T. Isotopic Water Handling and Hydrogen Isotope Recovery for Fusion Application Using a Metallic Getter: I-Sorption and role of Hydrogen and Oxygen in the Batch Conversion Method. Fusion Technol. 1995, 27, 458–475. [Google Scholar] [CrossRef]
- Santucci, A.; Farina, L.; Tosti, S.; Novel, A.F. Non-Evaporable Getter Materials and Their Possible Use in Fusion Application for Tritium Recovery. Molecules 2020, 25, 5675. [Google Scholar] [CrossRef] [PubMed]
- Spulak, R.G., Jr. On Helium release from metal tritides. J. Less Common Met. 1987, 132, L17–L20. [Google Scholar] [CrossRef]
- Lässer, R. Properties of Helium-3 in Selected Metals in Tritium and Helium-3 in Metals; Springer: Berlin/Heidelberg, Germany, 1989; p. 112. [Google Scholar]
- Nobile, A.; Walters, R.T.; Wermer, J.R. Aging Effect in Palladium and LaNi4.25Al0.75 Tritides. Fusion Technol. 1992, 21, 769–774. [Google Scholar] [CrossRef]
- Santucci, A.; Incelli, M.; Noschese, L.; Moreno, C.; Di Fonzo, F.; Utili, M.; Tosti, S.; Day, C. The Isuue of Tritium in EMO colant and mitigation Strategies. Fusion Eng. Des. 2020, 158, 111759. [Google Scholar] [CrossRef]
- Klein, J.E.; Wilison, J.; Heroux, K.J.; Poore, A.S.; Babineau, D.W. Design option to minimize tritium inventory at Savannah River. Fusion Eng. Des. 2016, 109–111, 42–46. [Google Scholar] [CrossRef]
- Li, R.; Sun, Y.; Wei, Y. Aging effect in uranium tritide. Fusion Eng. Des. 2006, 81, 859–862. [Google Scholar] [CrossRef]
- Fukai, Y. Site preference of interstitial hydrogen in metals. J. Less Common Met. 1984, 101, 1–16. [Google Scholar] [CrossRef]
- Yvon, K. Structural aspects of ternary metal hydrides: A critical review. J. Less Common Met. 1984, 103, 53–70. [Google Scholar] [CrossRef]
- Nørskov, J.K.; Besenbacher, F. Theory of hydrogen interaction with metals. J. Less Common Met. 1987, 130, 475–490. [Google Scholar] [CrossRef]
- Westlake, D.G. Hydrides of intermetallic compounds: A review of stabilities, stoichiometries and preferred hydrogen sites. J. Less Common Met. 1983, 91, 1–20. [Google Scholar] [CrossRef]
- Jacob, I.; Shaltiel, D.; Davidov, D.; Miloslavski, I. A phenomenological model for the hydrogen absorption capacity in pseudobinary laves phase compounds. Solid. State Commun. 1977, 23, 669–672. [Google Scholar] [CrossRef]
- Lundin, C.E.; Lynch, F.E.; Magee, C.B. Relationships between intermetallic compound structure and hydride formation. J. Less Common Met. 1977, 56, 119–138. [Google Scholar]
- Shaltiel, D.; Jacob, I. Hydrogen absorption and desorption properties of AB2 laves-phase pseudobinary compounds. J. Less Common Met. 1977, 53, 117–131. [Google Scholar] [CrossRef]
- Boffito, C. (SAES Getters, Milan, Italy). Private communication, 2000.
- Pebler, A.; Gulbransen, E.A. Equilibrium Studies on the Systems ZrCr2-H2, ZrV2-H2 and ZrMo2-H2 Between 0° and 900 °C. Trans. TMS-AIME 1967, 239, 1593–1600. [Google Scholar]
- Shoemaker, D.P.; Shoemaker, C.B. Concerning atomic sites and capacities for hydrogen absorption in the AB2 Friauf-Laves phase. J. Less Common Met. 1979, 68, 43–58. [Google Scholar] [CrossRef]
- Didisheim, J.J.; Yvon, K.; Shaltiel, D.; Fischer, P. The distribution of the deuterium atoms in the deuterated hexagonal laves-phase ZrMn2D3. Solid. State Commun. 1979, 31, 47–50. [Google Scholar] [CrossRef]
- Lässer, R. Tritium and Helium-3 in Metal; Springer: Berlin/Heidelberg, Germany, 1989; p. 56. [Google Scholar]
- Wenzl, H. Properties and applications of metal hydrides in energy conversion systems. Int. Met. Rev. 1982, 27, 140–168. [Google Scholar] [CrossRef]
- McLellan, R.B.; Harkins, C.G. Hydrogen interactions with metals. Mater. Sci. Eng. 1975, 18, 5–35. [Google Scholar] [CrossRef]
- Haar, L.; Freeman, A.S.; Beckett, C.W. (Eds.) Ideal Gas Thermodynamic Functions and Isotope Exchange Functions for the Diatomic Hydride, Deuterides and Tritides; National Bureau of Standards Circ. No 37: Washington, DC, USA, 1961. [Google Scholar]
- Magerl, A.; Stump, N.; Wipf, H.; Alefeld, G. Thermodynamic aspects of hydrogen motions in dilute metallic solutions. J. Phys. Chem. Solids 1977, 38, 683–686. [Google Scholar] [CrossRef]
- Ghezzi, F.; Shmayda, W.T.; Kherani, N.P.; Bonizzoni, G. Zr(Fe0.5V0.5)2 for TRITIUM STORAGE: An Experimental Investigation, CFFTP Report I-9178. 2 October 1992.
- Kierstead, H.A. A theory of hydrogen absorption with interactions. J. Less Common Met. 1984, 96, 141–152. [Google Scholar] [CrossRef]
- Souberyuox, J.L.; Pontonnier, L.; Miraglia, S.; Isnard, O.; Fruchart, D.; Akiba, E.; Hayakawa, H.; Fujitani, S.; Yonezu, I. Structural Transformations in NiTi, a Potential Material for Hydrogen Storage. Z. Phys. Chem. 1993, 179, 225–236. [Google Scholar]
- Shante, V.K.S.; Kirkpatrick, S. An introduction to percolation theory. Adv. Phys. 1971, 20, 325–357. [Google Scholar] [CrossRef]
- Lewis, M.B.; Farrell, K. Migration behavior of helium under displacive irradiation in stainless steel, nickel, iron and zirconium. Nucl. Instr. Meth. 1986, 16, 163–170. [Google Scholar] [CrossRef]
- Lucas, A.A. Helium in Metals, Physica 127B. In Proceedings of the 4th General Conference of the Condensed Matter. Division of EPS, Hague, The Netherlands, 19–22 March 1984; pp. 225–239. [Google Scholar]
- Wilson, W.D.; Bisson, C.L.; Baskes, M.I. Self trapping of helium in metals. Phys. Rev. 1981, 24, 5616–5624. [Google Scholar] [CrossRef]
- Trinkaus, H. Energetics and formation kinetics of helium bubbles in metals. Radiat. Eff. 1983, 78, 189–211. [Google Scholar] [CrossRef]
- Nowick, A.S.; Burton, J.J. (Eds.) Diffusion in Solid; Academic Press: New York, NY, USA, 1975; p. 213. [Google Scholar]
- Flament, J.L.; Lozes, G. Localization de l’helium forme dans les composes trities. In Proceedings of the 3ème Congrès International Hydrogène et Matèriaux; Azou, P., Ed.; University of Boumerdes: Paris, France, 1982; Volume 3, pp. 173–178. [Google Scholar]
- Sakamoto, M. Study of Hydrogen Vibration in Transition Metal Hydride by Thermal Neutron Transmission. J. Phys. Soc. Jpn. 1964, 19, 1862–1866. [Google Scholar] [CrossRef]
- Boucour, V.P.; Percheron-Guegan, A.; Achard, J.C.; Gasnier, P.; Varriat, J.Y.; Limacher, B.; Leroy, D. EXAFS Study of the Aging of LaNi5 and LaNI4.5Mn0.5 Compounds during Tritium Storage. Z. Phys. Chem. 1994, 183, 109–116. [Google Scholar]
- McLellan, R.B. Phase Solubility in Metals and Alloys; Rudman, P.S., Stringer, J., Jaffee, R.I., Eds.; McGraw-Hill: New York, NY, USA, 1966; p. 415. [Google Scholar]
- Katz, L.; Guinan, M.; Borg, R.J. Diffusin of H2, D2 and T2 in Single-Crystal Ni and Cu. Phys. Rev. 1971, 4, 330–341. [Google Scholar] [CrossRef]
- Nagasaka, M.; Yamashina, T. Solubility of hydrogen and deuterium in titanium and zirconium under very low press. J. Less Common Met. 1976, 45, 53–62. [Google Scholar] [CrossRef]
- Knize, R.J.; Cecchi, J.L.; Dylla, H.F. Measurement of H2, D2 Solubilities in Zr-Al. J. Vac. Sci. Technol. 1982, 20, 1135–1137. [Google Scholar] [CrossRef]
- Mueller, W.M.; Blackedge, J.P.; Libowitz, G.G. Metal Hydrides; Academic Press: New York, NY, USA, 1968; p. 67. [Google Scholar]
- Chen, C.A.; Liu, L.; Wang, B.; Xiang, X.; Yao, Y.; Song, J. Assesment of tritiated activities in the radwaste generated from ITER Chinese helium cooled ceramic breeding test blanket module system. Fusion Eng. Des. 2016, 112, 569578. [Google Scholar] [CrossRef]
Figure 1.
Cutaway view of the St 737 bed.

Figure 2.
Hydrogen and tritium equilibrium pressure over the unaged reference St737. The numbers represent the temperature in °C. Solid symbols represent hydrogen data, open symbols represent unaged tritium data.
Figure 2.
Hydrogen and tritium equilibrium pressure over the unaged reference St737. The numbers represent the temperature in °C. Solid symbols represent hydrogen data, open symbols represent unaged tritium data.

Figure 3.
Comparison of tritium pressure over St737 unaged and Aged1. The numbers represent the temperature in °C.
Figure 3.
Comparison of tritium pressure over St737 unaged and Aged1. The numbers represent the temperature in °C.

Figure 4.
Comparison of tritium pressure over St733 Aged1 and Aged2. The numbers represent the temperature in °C. Solid line: Aged1; dashed line: Aged2.
Figure 4.
Comparison of tritium pressure over St733 Aged1 and Aged2. The numbers represent the temperature in °C. Solid line: Aged1; dashed line: Aged2.

Figure 5.
H2 solubility in St737.

Figure 6.
T2 solubility in St737.

Figure 7.
Sieverts’ law for H2 in St737.

Figure 8.
Sieverts’ law for T2 in St737.

Figure 9.
Temperature dependence of Sieverts’ constant for H2 and T2 in St737.

Figure 10.
Van’t Hoff plot in the solubility region of Zr(Fe0.5V0.5)2–H system.

Figure 11.
Van’t Hoff plot in the solubility region of Zr(Fe0.5V0.5)2–T system.

Figure 12.
Reduced hydrogen and tritium equilibrium pressure over St737. The numbers represent the temperature in °C.
Figure 12.
Reduced hydrogen and tritium equilibrium pressure over St737. The numbers represent the temperature in °C.

Figure 13.
Distribution of hydrogen atoms in the interstitial site of the alloy: D(1) are the 24 l tetrahedral sites, D(2) the 12 k sites, D(3) and D(4) the 6 h sites. The sites which are less than 1.3 Å apart have been joined by lines. The arrows departing from site D(2) indicate the two possible diffusion paths for hydrogen atoms (helium). V and Fe atoms are omitted for clarity. A He atom created in site A migrating to its equivalent position in the layer above (A′) along the shortest path, indicated by the arrows, makes 12 jumps [20]. Figure reprinted from [20] with permission from Elsevier.

Figure 14.
Sieverts’ law for T2 in St 737 Aged1.

Figure 15.
Sieverts’ law for T2 in St 737 Aged2.

Figure 16.
Van’t Hoff plot in the solubility region of Zr(Fe0.5V0.5)2–T system for the Aged1 bed.

Figure 17.
Van’t Hoff plot in the solubility region of Zr(Fe0.5V0.5)2–T system for the Aged2 bed.

Figure 18.
Temperature dependence of Sieverts’ constant for T2 in the unaged, Aged1 and Aged2 beds.

Figure 19.
Hydrogen vibration temperature in the original and modified lattices.

Figure 20.
Molar enthalpy change versus tritium over alloy ratio for the unaged and aged beds.

Figure 21.
Molar entropy change versus tritium over alloy ratio for the unaged and aged beds.


Table 1.
Elemental characterization of St 737 by inductively plasma atomic mass spectroscopy.
| Element | % by Weight |
|---|---|
| Zirconium | 45.38 |
| Vanadium | 27.2 |
| Iron | 23.75 |
| Chromium | 1.04 |
| Aluminium | 0.75 |
| Tin | 0.65 |
| Silicon | 0.33 |
| Manganese | 0.034 |
| Nickel | 0.017 |
| Niobium | <0.01 |
| Titanium | 0.006 |
| Copper | 0.0046 |
| Cadmium | <0.005 |
| Cobalt | 0.002 |
Table 2.
Sieverts’ constant Ks for hydrogen in Zr(Fe0.5V0.5)2.
| T (K) | Xmax | Ks (at. Ratio/Pa1/2) | |
|---|---|---|---|
| H2 | 298 | 0.2 | 0.9153 |
| 323 | 0.3 | 0.3007 | |
| 373 | 0.5 | 0.1260 | |
| 423 | 0.5 | 0.04987 | |
| 473 | 0.5 | 0.02385 | |
| 523 | 0.5 | 0.01181 | |
| 573 | 0.3 | 0.007921 | |
| 623 | 0.5 | 0.00399 | |
| 673 | 0.5 | 0.002699 | |
| T2 | 373 | 0.97 | 0.07776 |
| 419 | 0.75 | 0.032507 | |
| 463 | 0.52 | 0.01526 | |
| 511 | 0.3 | 0.00796 | |
| 559 | 0.28 | 0.004057 | |
| 608 | 0.25 | 0.002396 |
Table 3.
Enthalpy and non-configurational entropy at infinite dilution for H and T.
| Q | (kJ/molQ) | (J/K molQ) |
|---|---|---|
| H | −26.98 | −55.91 |
| T | −27.97 | −62.61 |
Table 4.
Thermodynamic data of the Zr(Fe0.5V0.5)2–Q system in the solubility region (Q = H or T).
| Q | xQ | −A | −B | kJ/mol Q | J/K mol Q | J/K mol Q |
|---|---|---|---|---|---|---|
| H | 0.075 | 3.5268 | 1452.3 | 27.79 | 19.65 | 55.98 |
| 0.1 | 3.577 | 1408.8 | 26.97 | 20.61 | 54.53 | |
| 0.2 | 3.81 | 1373.9 | 26.29 | 25.073 | 53.07 | |
| 0.3 | 4.273 | 1469 | 28.11 | 31.912 | 56.39 | |
| 0.5 | 4.4027 | 1446 | 27.67 | 36.42 | 56.35 | |
| Average | 27.36 ± 0.59 | 55.3 ± 1.97 | ||||
| T | 0.1 | 4.0123 | 1511.6 | 28.93 | 28.95 | 62.84 |
| 0.3 | 4.4913 | 1503.5 | 28.76 | 38.1129 | 62.59 | |
| 0.5 | 4.6863 | 1451.7 | 27.79 | 41.845 | 61.782 | |
| 0.75 | 4.8963 | 1463.2 | 28.005 | 45.865 | 62.0437 | |
| 0.95 | 5.1229 | 1492 | 28.55 | 50.2016 | 64.092 | |
| Average | 28.4 ± 0.41 | 62.68 ± 0.64 |
Table 5.
Thermodynamic data of the Zr(Fe0.5V0.5)2–Q system in the hydride-forming region.
| Q | xQ | kJ/mol Q2 | J/K mol Q2 |
|---|---|---|---|
| H | 0.8 | 56 | 88.4 |
| 1 | 55.6 | 90.5 | |
| 1.4 | 60.7 | 110.1 | |
| 1.6 | 55.3 | 103.3 | |
| 1.8 | 55.9 | 108.6 | |
| 2 | 56.5 | 114 | |
| 2.2 | 54.1 | 115.4 | |
| 2.6 | 54.2 | 122.9 | |
| 2.8 | 51.3 | 122.4 | |
| Average | 55.5 ± 1.9 | 108.4 ± 5.5 | |
| T | 0.9 | 64.1 | 118.3 |
| 1.2 | 64.9 | 125.8 | |
| 1.4 | 64.7 | 130.2 | |
| 1.6 | 65.2 | 136.5 | |
| 1.8 | 60.5 | 130.7 | |
| 2.0 | 59.6 | 133.1 | |
| 2.2 | 61.3 | 144.3 | |
| Average | 62.9 ± 2.1 | 131.3 ± 5.7 |
Table 6.
Thermodynamic data of the Zr(Fe0.5V0.5)2–T system in the solubility region.
(kJ/mol T) | (J/K mol T) | /R (J/K mol T) | |
|---|---|---|---|
| UR | 27.97 ± 0.7 | 62.61 ± 1.5 | 7.53 |
| Aged1 | 27.02 ± 1.1 | 59.38 ± 2.3 | 7.14 |
| Aged2 | 33.78 ± 0.6 | 66.3 ± 1.2 | 7.97 |
Table 7.
Thermodynamic data of the Zr(Fe0.5V0.5)2–T system in the hydride-forming region.
| (kJ/mol) | (J/K mol) | |||||
|---|---|---|---|---|---|---|
| T/A | Unaged | Aged1 | Aged2 | Unaged | Aged1 | Aged2 |
| 0.7 | 63.5 | 61.2 | 64.3 | 110.6 | 104.4 | 115.2 |
| 0.9 | 64.1 | 61.1 | 63.2 | 118.3 | 110.6 | 119.8 |
| 1 | 64.9 | 60.7 | 54.8 | 125.8 | 116.6 | 108.2 |
| 1.2 | 64.7 | 59.9 | 57.1 | 130.2 | 121.4 | 119.5 |
| 1.4 | 65.2 | 57.9 | 55.1 | 136.5 | 122.8 | 120 |
| 1.8 | 60.5 | 57.3 | 53.1 | 130.7 | 128.4 | 121.1 |
| 2 | 59.6 | 57.6 | 53.7 | 133.1 | 135.9 | 130.9 |
| 2.2 | 61.3 | 53.7 | 49 | 144.3 | 133.9 | 126.4 |
| 2.4 | 58.5 | 50.9 | 142.7 | 133.7 | ||
| Average | 62.9 ± 2.1 | 57.4 ± 2.6 | 55.2 ± 2.9 | 131.3 ± 5.7 | 125.4 ± 7.5 | 120.8 ± 4.5 |
Disclaimer/Publisher’s Note: The statements, opinions and data contained in all publications are solely those of the individual author(s) and contributor(s) and not of MDPI and/or the editor(s). MDPI and/or the editor(s) disclaim responsibility for any injury to people or property resulting from any ideas, methods, instructions or products referred to in the content. |
© 2024 by the authors. Licensee MDPI, Basel, Switzerland. This article is an open access article distributed under the terms and conditions of the Creative Commons Attribution (CC BY) license (https://creativecommons.org/licenses/by/4.0/).
Share and Cite
MDPI and ACS Style
Ghezzi, F.; Shmayda, W.T. Aging Effects in Zr(Fe0.5V0.5)2 Tritides. Crystals 2024, 14, 159. https://doi.org/10.3390/cryst14020159
AMA Style
Ghezzi F, Shmayda WT. Aging Effects in Zr(Fe0.5V0.5)2 Tritides. Crystals. 2024; 14(2):159. https://doi.org/10.3390/cryst14020159
Chicago/Turabian StyleGhezzi, Francesco, and Walter Theodore Shmayda. 2024. "Aging Effects in Zr(Fe0.5V0.5)2 Tritides" Crystals 14, no. 2: 159. https://doi.org/10.3390/cryst14020159
Note that from the first issue of 2016, this journal uses article numbers instead of page numbers. See further details here.