
Insights in the Structural Hierarchy of Statically Crystallized Palm Oil
 , , ,
, , ,  and
and
Abstract
:1. Introduction
2. Materials and Methods
2.1. Palm Oil
2.2. Temperature Protocols
2.3. Thermal Behavior by Differential Scanning Calorimetry
2.4. Crystallization and Melting Behavior by Differential Scanning Calorimetry
2.5. Microscale
2.5.1. Crystal Floc Morphology by Polarized Light Microscopy
2.5.2. Spatial Distribution of Triglycerides by Raman Spectroscopy
2.5.3. Floc and Crystallite Morphology by Cryo-Scanning Electron Microscopy
2.5.4. Triglyceride Analysis of Palm Oil and Extracted Samples
2.6. Nano- and Mesoscale
2.6.1. Crystal Nanoplatelet Visualization by Transmission Electron Microscopy
2.6.2. Crystal Nanoplatelet Morphology and Size by Ultra-Small-Angle X-ray Scattering and Polymorphism by Wide-Angle X-ray Scattering
2.6.3. Lamellar Spacing, Average CNP Thickness, and Thickness Distribution by Small-Angle X-ray Scattering
2.7. Graphs and Statistics
3. Results and Discussion
3.1. Microscale
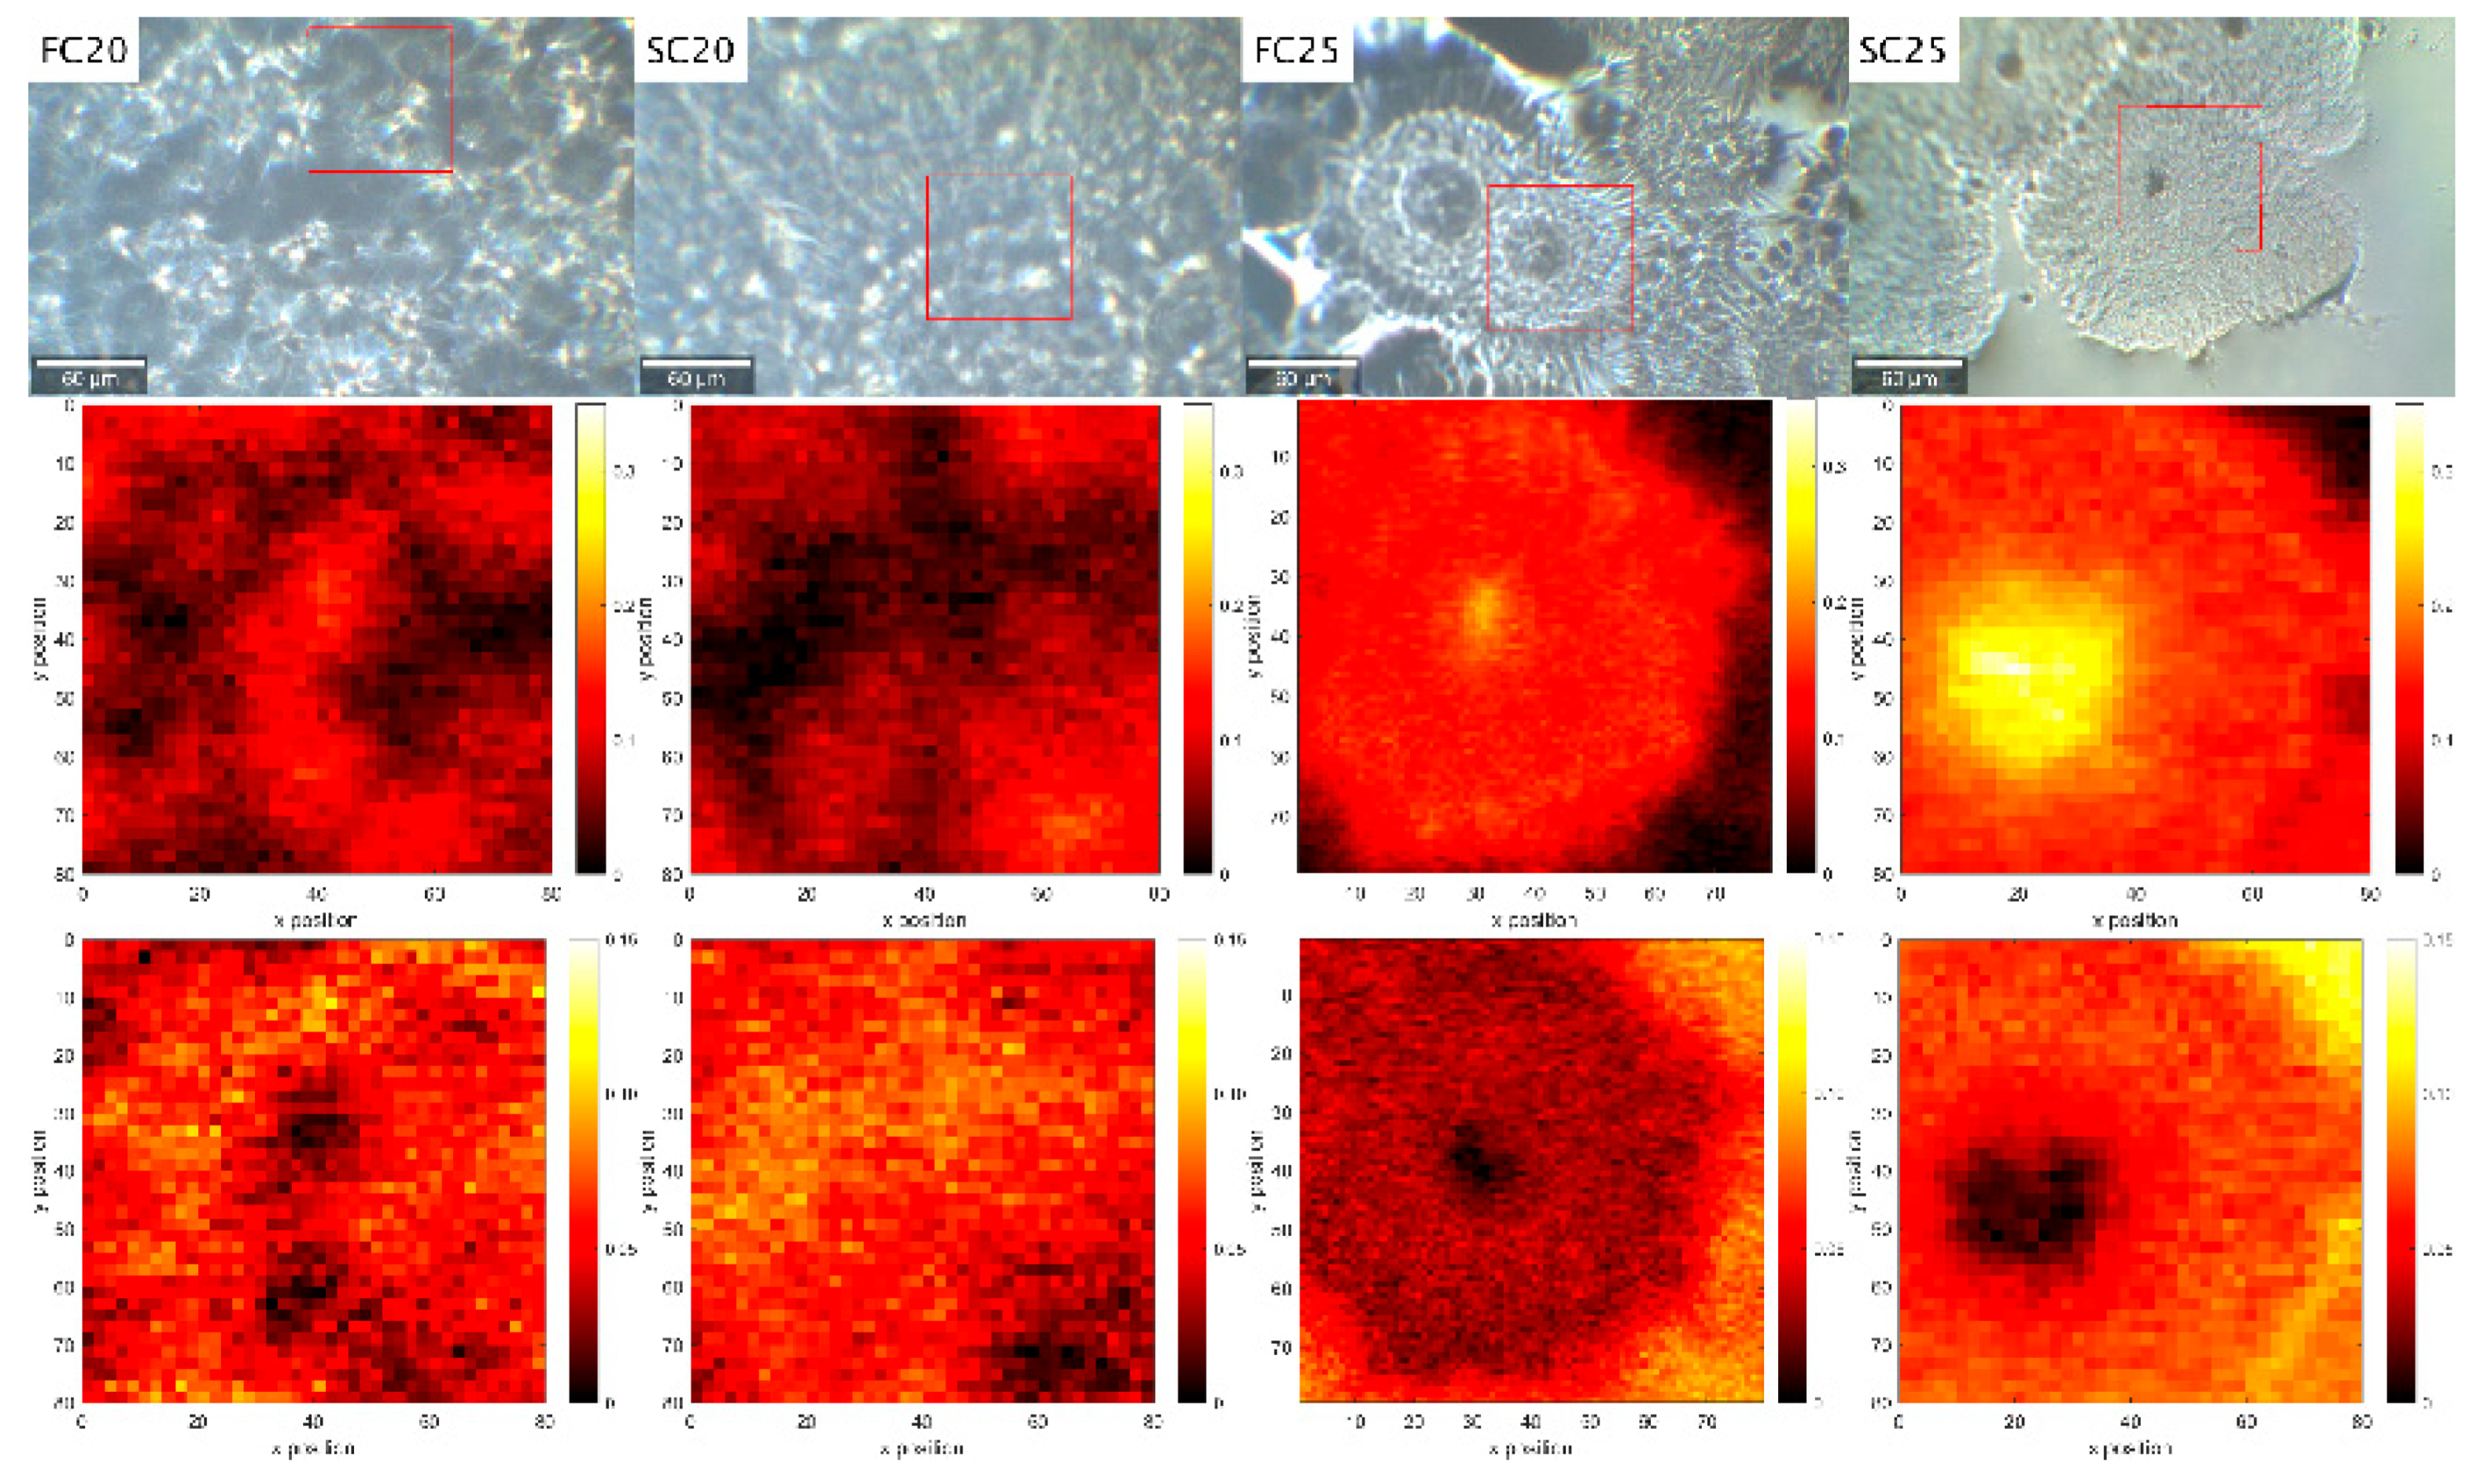
3.1.1. PLM
3.1.2. Cryo-SEM
3.1.3. Triglyceride Analysis
3.1.4. Raman Spectroscopy
3.2. Nano- and Mesoscale
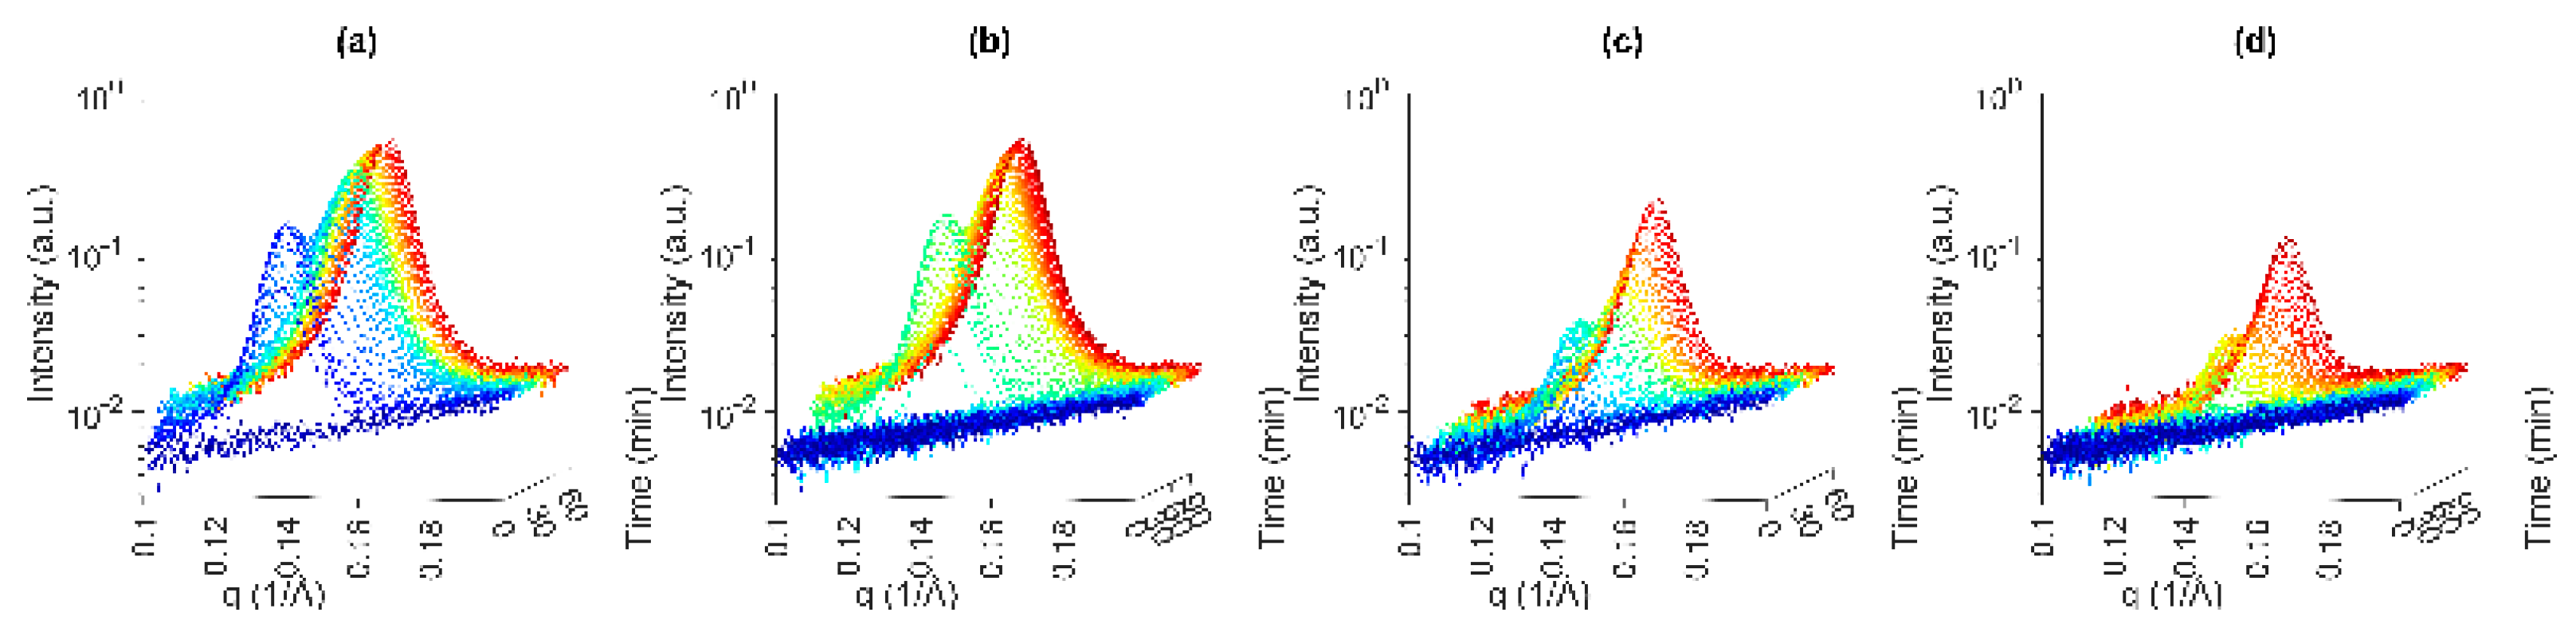
3.2.1. USAXS and WAXS
Fast Cooling of PO to 20 °C
Slow Cooling of PO to 20 °C
Fast Cooling of PO to 25 °C
Slow Cooling of PO to 25 °C
3.2.2. SAXS
Fast Cooling of PO to 20 °C
Slow Cooling of PO to 20 °C
Fast Cooling of PO to 25 °C
Slow Cooling of PO to 25 °C
Average Thickness and Thickness Distribution of CNPs
4. Conclusions
Author Contributions
Funding
Data Availability Statement
Acknowledgments
Conflicts of Interest
Appendix A


References
- Aini, I.N.; Miskandar, M.S. Utilization of palm oil and palm products in shortenings and margarines. Eur. J. Lipid Sci. Tech. 2007, 109, 422–432. [Google Scholar] [CrossRef]
- Rondou, K.; De Witte, F.; Van Bockstaele, F.; Dewettinck, K. Microstructure development in semi-liquid shortenings upon storage. J. Am. Oil Chem. Soc. 2022, 99, 57. [Google Scholar]
- Sato, K. Polymorphic Properties of Palm Oil and Its Major Component Triacyglycerols; AOCS Press: Champaign, IL, USA, 2012; pp. 393–429. [Google Scholar]
- Macias-Rodriguez, B.; Marangoni, A.G. Rheological characterization of triglyceride shortenings. Rheol. Acta 2016, 55, 767–779. [Google Scholar] [CrossRef]
- Bayés-García, L.; Calvet, T.; Cuevas-Diarte, M.; Ueno, S.; Sato, K. Crystallization and transformation of polymorphic forms of trioleoyl glycerol and 1,2-dioleoyl-3-rac-linoleoyl glycerol. J. Phys. Chem. B 2013, 117, 9170–9181. [Google Scholar] [CrossRef] [PubMed]
- Bayés-García, L.; Calvet, T.; Cuevas-Diarte, M.À.; Ueno, S.; Sato, K. Heterogeneous microstructures of spherulites of lipid mixtures characterized with synchrotron radiation microbeam X-ray diffraction. Cryst. Eng. Comm. 2011, 13, 6694–6705. [Google Scholar] [CrossRef]
- Sainlaud, C.; Tache, O.; Testard, F.; Saiter, J.M.; Bohin, M.C.; Coquerel, G. Impact of Cooling Profile on Refined Palm Oil Crystallization: Microscopic and Small and Wide-Angle X-Ray Scattering Investigations. Eur. J. Lipid Sci. Tech. 2022, 124, 2100045. [Google Scholar] [CrossRef]
- Marangoni, A.; Acevedo, N.; Maleky, F.; Co, E.; Peyronel, F.; Mazzanti, G.; Quinn, B.; Pink, D. Structure and functionality of edible fats. Soft Matter 2012, 8, 1275–1300. [Google Scholar] [CrossRef]
- Mishra, K.; Kummer, N.; Bergfreund, J.; Kampf, F.; Bertsch, P.; Pauer, R.; Nystrom, G.; Fischer, P.; Windhab, E.J. Controlling lipid crystallization across multiple length scales by directed shear flow. J. Colloid Interface Sci. 2023, 630, 731–741. [Google Scholar] [CrossRef]
- Tang, D.; Marangoni, A.G. Quantitative study on the microstructure of colloidal fat crystal networks and fractal dimensions. Adv. Colloid Interface Sci. 2006, 128–130, 257–265. [Google Scholar] [CrossRef] [PubMed]
- Omar, Z.; Hishamuddin, E.; Sahri, M.M.; Fauzi, S.H.M.; Dian, N.L.H.M.; Ramli, M.R.; Abd Rashid, N. Palm Oil Crystallisation: A Review. J. Oil Palm Res. 2015, 27, 97–106. [Google Scholar]
- Zaliha, O.; Chong, C.L.; Cheow, C.S.; Norizzah, A.R.; Kellens, M.J. Crystallization properties of palm oil by dry fractionation. Food Chem. 2004, 86, 245–250. [Google Scholar] [CrossRef]
- Nguyen, V.; Rimaux, T.; Truong, V.; Dewettinck, K.; Van Bockstaele, F. Granular Crystals in Palm Oil Based Shortening/Margarine: A Review. Cryst. Growth Des. 2020, 20, 1363–1372. [Google Scholar] [CrossRef]
- De Graef, V. Microstructural Properties of Isothermal Palm Oil Crystallization; Ghent University: Ghent, Belgium, 2009. [Google Scholar]
- Peyronel, F.; Pink, D.A. Chapter 9-Ultra-Small Angle X-ray Scattering: A Technique to Study Soft Materials. In Structure-Function Analysis of Edible Fats, 2nd ed.; Marangoni, A.G., Ed.; AOCS Press: Champaign, IL, USA, 2018; pp. 267–285. [Google Scholar]
- Peyronel, F.; Pink, D. Using USAXS to Predict the Under-tempered Chocolate Microstructure. J. Am. Oil Chem. Soc. 2021, 98, 56. [Google Scholar]
- Peyronel, F.M.; Pink, D.A. The nano-to meso-scale solid structure of edible fats as seen by USAXS: Static versus dynamics results. In Proceedings of the 7th International Symposium on Food Rheology and Structure, Zurich, Switzerland, 10 June 2015. [Google Scholar]
- Peyronel, F.; Ilavsky, J.; Mazzanti, G.; Marangoni, A.G.; Pink, D.A. Edible oil structures at low and intermediate concentrations. II. Ultra-small angle X-ray scattering of in situ tristearin solids in triolein. J. Appl. Phys. 2013, 114, 234902. [Google Scholar] [CrossRef]
- Nikolaeva, T.; Adel, R.D.; Velichko, E.; Bouwman, W.G.; Hermida-Merino, D.; As, H.V.; Voda, A.; Duynhoven, J.V. Networks of micronized fat crystals grown under static conditions. Food Funct. 2018, 9, 2102–2111. [Google Scholar] [CrossRef] [PubMed]
- Narayanan, T.; Sztucki, M.; Zinn, T.; Kieffer, J.; Homs-Puron, A.; Gorini, J.; Van Vaerenbergh, P.; Boesecke, P. Performance of the time-resolved ultra-small-angle X-ray scattering beamline with the Extremely Brilliant Source. J. Appl. Crystallogr. 2022, 55, 98–111. [Google Scholar] [CrossRef] [PubMed]
- Patterson, A.L. The Scherrer Formula for X-Ray Particle Size Determination. Phys. Rev. 1939, 56, 978–982. [Google Scholar] [CrossRef]
- Scherrer, P. Bestimmung der Größe und der inneren Struktur von Kolloidteilchen mittels Röntgenstrahlen. Nachrichten Ges. Wiss. Göttingen Math. Phys. Kl. 1918, 1918, 98–100. [Google Scholar]
- Acevedo, N.C.; Marangoni, A.G. Characterization of the Nanoscale in Triacylglycerol Crystal Networks. Cryst. Growth Des. 2010, 10, 3327–3333. [Google Scholar] [CrossRef]
- den Adel, R.; van Malssen, K.; van Duynhoven, J.; Mykhaylyk, O.O.; Voda, A. Fat Crystallite Thickness Distribution Based on SAXD Peak Shape Analysis. Eur. J. Lipid Sci. Tech. 2018, 120, 1800222. [Google Scholar] [CrossRef]
- Ramel, P.R.R.; Peyronel, F.; Marangoni, A.G. Characterization of the nanoscale structure of milk fat. Food Chem. 2016, 203, 224–230. [Google Scholar] [CrossRef] [PubMed]
- Sato, K.; Bayés-García, L.; Calvet, T.; Cuevas-Diarte, M.À.; Ueno, S. External factors affecting polymorphic crystallization of lipids. Eur. J. Lipid Sci. Tech. 2013, 115, 1224–1238. [Google Scholar] [CrossRef]
- Smith, P.; Shiori, T.; Hondoh, H.; Wallecan, J.; Ueno, S. Polymorphic and microstructural behaviors of palm oil/lecithin blends crystallized under shear. J. Am. Oil Chem. Soc. 2022, 99, 665–674. [Google Scholar] [CrossRef]
- Chen, C.W.; Lai, O.M.; Ghazali, H.M.; Chong, C.L. Isothermal crystallization kinetics of refined palm oil. J. Am. Oil Chem. Soc. 2002, 79, 403–410. [Google Scholar] [CrossRef]
- Herrera, M.L.; Hartel, R.W. Effect of processing conditions on crystallization kinetics of a milk fat model system. J. Am. Oil Chem. Soc. 2000, 77, 1177–1188. [Google Scholar] [CrossRef]
- Campos, R.; Narine, S.S.; Marangoni, A.G. Effect of cooling rate on the structure and mechanical properties of milk fat and lard. Food Res. Int. 2002, 35, 971–981. [Google Scholar] [CrossRef]
- Chawla, P.; deMan, J.M.; Smith, A.K. Crystal Morphology of Shortenings and Margarines. Food Struct. 1990, 9, 2. [Google Scholar]
- Berry, S. Triacylglycerol structure and interesterification of palmitic and stearic acid-rich fats: An overview and implications for cardiovascular disease. Nutr. Res. Rev. 2009, 22, 3–17. [Google Scholar] [CrossRef]
- Toro-Vazquez, J.; Dibildox-Alvarado, E.; Herrera-coronado, V. Triacylglyceride crystallization in vegetable oils: Application of models, measurements, and limitations. Cryst. Solidif. Prop. Lipids 2001, 8, 53–78. [Google Scholar]
- Bresson, S.; El Marssi, A.; Khelifa, B. Raman spectroscopy investigation of various saturated monoacid triglycerides. Chem. Phys. Lipids 2005, 134, 119–129. [Google Scholar] [CrossRef]
- Czamara, K.; Majzner, K.; Pacia, M.Z.; Kochan, K.; Kaczor, A.; Baranska, M. Raman spectroscopy of lipids: A review. J. Raman Spectrosc. 2015, 46, 4–20. [Google Scholar] [CrossRef]
- Glatter, O. Chapter 6-Contrast Variation. In Scattering Methods and Their Application in Colloid and Interface Science; Glatter, O., Ed.; Elsevier: Amsterdam, The Netherlands, 2018; pp. 111–121. [Google Scholar]
- Peyronel, F. Ultra Small Angle X-Ray Scattering Studies of Triacylglycerol Crystal Networks. Ph.D. Thesis, University of Guelph, Guelph, ON, Canada, 2014. [Google Scholar]
- Hammouda, B. A new Guinier-Porod model. J. Appl. Crystallogr. 2010, 43, 716–719. [Google Scholar] [CrossRef]
- Beaucage, G. Approximations Leading to a Unified Exponential/Power-Law Approach to Small-Angle Scattering. J. Appl. Crystallogr. 1995, 28, 717–728. [Google Scholar] [CrossRef]
- Beaucage, G. Small-Angle Scattering from Polymeric Mass Fractals of Arbitrary Mass-Fractal Dimension. J. Appl. Crystallogr. 1996, 29, 134–146. [Google Scholar] [CrossRef]
- Matsui, K.; Kamigaki, T.; Wakui, R.; Nishino, Y.; Ito, Y.; Miyazawa, A.; Yoshioka, K.; Shiota, M. Evaluation of crystal nanoplatelet aggregation in intact butter by atomic force microscopy. LWT 2021, 140, 110801. [Google Scholar] [CrossRef]
- Porod, G. Die Röntgenkleinwinkelstreuung von dichtgepackten kolloiden Systemen. II. Teil. Kolloid-Z. 1952, 125, 108–122. [Google Scholar] [CrossRef]
- Mazzanti, G. Prenucleation Structuring in Liquid Triacylglycerols: Navigating a Non-ideal Landscape. J. Am. Oil Chem. Soc. 2021, 98, 60. [Google Scholar]
- Yap, P.H.; de Man, J.M.; de Man, L. Polymorphism of palm oil and palm oil products. J. Am. Oil Chem. Soc. 1989, 66, 693–697. [Google Scholar] [CrossRef]
- Roe, R.J. Methods of X-ray and Neutron Scattering in Polymer Science. Soft Matter 2000, 54, 60–61. [Google Scholar]
- Glatter, O. Chapter 2-General Theorems and Special Cases. In Scattering Methods and their Application in Colloid and Interface Science; Glatter, O., Ed.; Elsevier: Amsterdam, The Netherlands, 2018; pp. 19–32. [Google Scholar]
- Acevedo, N.C.; Peyronel, F.; Marangoni, A.G. Nanoscale structure intercrystalline interactions in fat crystal networks. Curr. Opin. Colloid Interface Sci. 2011, 16, 374–383. [Google Scholar] [CrossRef]
- Mazzanti, G.; Marangoni, A.G.; Idziak, S.H.J. Modeling phase transitions during the crystallization of a multicomponent fat under shear. Phys. Rev. E 2005, 71, 041607. [Google Scholar] [CrossRef] [PubMed]


| Sample | Abbreviation | Min (µm) | Max (µm) | Average (µm) | N |
|---|---|---|---|---|---|
| Fast cooled (20 °C/min) to 20 °C | FC-20 | 12.3 | 30.1 | 19.5 ± 3.5 c | 70 |
| Slow cooled (1 °C/min) to 20 °C | SC-20 | 21.5 | 70.8 | 46.2 ± 10.5 b | 80 |
| Fast cooled (20 °C/min) to 25 °C | FC-25 | 37.9 | 117.2 | 69.9 ± 18.0 a | 27 |
| Slow cooled (1 °C/min) to 25 °C | SC-25 | 21.4 | 138.2 | 75.5 ± 27.6 a | 104 |
| Sample | SAXS | USAXS | |||||
|---|---|---|---|---|---|---|---|
| Polymorph and Chain Length Structure | d001 (Å) | Scherrer Average Number Lamella (-) | BWA Average Number Lamella (-) | Slope Low q (-) | Cut-Off Point (Å−1) | Slope High q (-) | |
| FC-20 | β’-2L | 42.1 ± 0 a | 12.0 ± 0.1 a | 10.1 ± 0.1 a | 1.9 | 0.0046 | 3.5 |
| SC-20 | β’-2L | 42.1 ± 0 a | 12.3 ± 0.1 a | 10.2 ± 0.1 a | 2.0 | 0.0030 | 3.3 |
| FC-25 | β’-2L | 42.1 ± 0 a | 12.7 ± 0.2 a | 10.6 ± 0.3 a | 2.2 | 0.0021 | 3.3 |
| SC-25 | β’-2L | 42.1 ± 0 a | 11.5 ± 0.5 a | 9.6 ± 0.5 a | 2.2 | 0.0021 | 3.3 |
Disclaimer/Publisher’s Note: The statements, opinions and data contained in all publications are solely those of the individual author(s) and contributor(s) and not of MDPI and/or the editor(s). MDPI and/or the editor(s) disclaim responsibility for any injury to people or property resulting from any ideas, methods, instructions or products referred to in the content. |
© 2024 by the authors. Licensee MDPI, Basel, Switzerland. This article is an open access article distributed under the terms and conditions of the Creative Commons Attribution (CC BY) license (https://creativecommons.org/licenses/by/4.0/).
Share and Cite
De Witte, F.; Penagos, I.A.; Rondou, K.; Moens, K.; Lewille, B.; Tzompa-Sosa, D.A.; Van de Walle, D.; Van Bockstaele, F.; Skirtach, A.G.; Dewettinck, K. Insights in the Structural Hierarchy of Statically Crystallized Palm Oil. Crystals 2024, 14, 142. https://doi.org/10.3390/cryst14020142
De Witte F, Penagos IA, Rondou K, Moens K, Lewille B, Tzompa-Sosa DA, Van de Walle D, Van Bockstaele F, Skirtach AG, Dewettinck K. Insights in the Structural Hierarchy of Statically Crystallized Palm Oil. Crystals. 2024; 14(2):142. https://doi.org/10.3390/cryst14020142
Chicago/Turabian StyleDe Witte, Fien, Ivana A. Penagos, Kato Rondou, Kim Moens, Benny Lewille, Daylan A. Tzompa-Sosa, Davy Van de Walle, Filip Van Bockstaele, Andre G. Skirtach, and Koen Dewettinck. 2024. "Insights in the Structural Hierarchy of Statically Crystallized Palm Oil" Crystals 14, no. 2: 142. https://doi.org/10.3390/cryst14020142