Article

Optimization of Sintering Process Parameters by Taguchi Method for Developing Al-CNT-Reinforced Powder Composites

1
Department of Fuel Minerals and Metallurgical Engineering, Indian Institute of Technology (Indian Schools of Mines), Dhanbad 826004, India
2
Mechanical Engineering Department, Hindustan College of Science & Technology, Mathura 281122, India
3
Department of Mechanical Engineering, Graphic Era Deemed to be University, Dehradun 248002, India
4
Department of Mechanical Engineering, Graphic Era Hill University, Dehradun 248002, India
5
Department of Mechanical Engineering, Dev Bhoomi Uttarakhand University, Dehradun 248007, India
6
Department of Computer Science and Engineering, Graphic Era Deemed to be University, Dehradun 248002, India
7
Faculty of Engineering, Technology and Built Environment, UCSI University, Kuala Lumpur 56000, Malaysia
*
Author to whom correspondence should be addressed.
Crystals 2023, 13(9), 1352; https://doi.org/10.3390/cryst13091352
Submission received: 18 August 2023 / Revised: 30 August 2023 / Accepted: 1 September 2023 / Published: 6 September 2023
(This article belongs to the Special Issue Advances in Multifunctional Nanocomposites)

Abstract

:
In powder metallurgy, the sintering process is a high-power consuming and critical process for better mechanical properties of composites due to proper diffusion of atoms. In this context, different sintering processes were investigated along with their sintering condition. The present work focused on optimizing conventional sintering process parameters for carbon nanotubes (CNTs) reinforced aluminum composites using Taguchi optimization methods. The Taguchi L9 orthogonal array (OA) experiment was considered for the investigation. CNT’s wt.%, sintering temperature, and time were chosen as process parameters in the sintering process, while macro-hardness and relative density were evaluated as performance evaluation characteristics. The signal-to-noise ratio (S/N) and ANOVA statistical procedures were utilized to evaluate the effect of sintering parameters/levels on the micro-hardness and relative density of the Al/CNTs composite sintered. ANOVA statistical analyses revealed that the CNTs wt.% significantly influences relative density (83.58%), followed by temperature (14.58%), whereas CNTs wt.% significantly influenced micro-hardness (77.75%), followed by temperature (13.64%). The sintering of Al/CNTs composites using these optimum conditions is recommended to reduce power consumption and enhance the quality of the sintered composite.

1. Introduction

Aluminium metalmatrix composites (AMMC) have found a wide range of applications in the industries among the composites developed in recent yearsdue to their low density [1], excellent toughness, and corrosion-resistance properties [2]. The automotive, military, and aerospace sectors have a lot of applications [3,4]. In AMMC, various reinforcements such as CNTs [5], silicon carbides [6], aluminium oxide [7], boron carbide [8], etc., are employed. CNTs are becoming a more important reinforcement material for composites due to their outstanding physical and thermo-mechanical characteristics (specific strength of 55.55 GPa/(mg/m3) and specific modulus 555.5 GPa/(mg/m3) [9]. According to estimates, CNTs can withstand temperatures of up to 2800 °C in a vacuum and 750 °C in the air. CNTs also have a larger aspect ratio, superior chemical stability, and electrical characteristics. These CNT qualities make them excellent for use in the aviation and automobile industries, where energy conservation is becoming more crucial [10].
Metal matrix composites can be manufactured using traditional casting or powder metallurgy (PM) processes [11]. Casting methods for manufacturing metal matrix composites (MMCs) have major restrictions, such as reinforcement agglomeration and thermal deterioration during processing. PM is the most commonly used production method for MMCs due to its low-temperature processing and remarkable control over microstructure, including size, shape, matrix fraction, and reinforcing material [12,13]. Due to the low-temperature fabrication process, unwanted phases between the matrix and reinforcement were absent [14]. PM process having more control over the microstructure is one of the benefits of casting. In the PM process, the metal matrix and reinforcement powder are uniformly mixed and compacted to get the required shape. Sintering is used after compaction to improve mechanical characteristics [15].
Sintering is a process of heating the powder to just below its melting point, allowing the particles to bind and form a solid piece. Sintering process parameters like temperature, dwell time, reinforcement concentration, pressures, etc., will depend on the powder type and the desired final product. Higher sintering temperatures cause thermal damage and result in an undesired interfacial reaction between the matrix and reinforcement [16]. Longer sintering time started grain growth and reduced the mechanical properties of composites [17]. Composites with high reinforcement content provide more interfacial reactions that provide a barrier in diffusion reaction. Solid-state diffusion is crucial for developing and propagating inter-particle bonds [18]. Diffusion bonding, therefore, has a significant impact on the mechanical and microstructural characteristics. Also, the temperature and duration of the sintering process affect the diffusion process. Generally, these bonds can be generated by the mutual dissolution or reaction of the matrix metal and the reinforcement particles.
The composites fabricated via the PM process have various properties such as hardness, tensile strength, compressive strength, toughness, and fatigue strength. Variables like the selection of reinforcement, compression pressure during powder compaction, sintering temperature, sintering duration, particle size, and the proportion of reinforcement volume affected these properties. Notably, the sintering temperature and duration are critical factors, significantly influencing hardness and strength [19]. Wang et al. [20] used a powder metallurgical process to fabricate 2% CNT-reinforced aluminium composites. The results revealed that the hardness increased from 62.17 HV to 182.8 HV. This divergence in hardness was due to the proper sintering of uniformly dispersed CNT reinforcement within the Al matrix. Deng et al. [14] fabricate 1wt.% CNTs reinforced aluminium composites by the cold compaction process followed by hot extrusion. The dispersion of CNT restricts grain growth during composite sintering. Due to grain refinement, composite hardness and tensile strength have been enhanced by 30% and 25%, respectively, compared to the base alloy. Choi et al. [21] observed that multi-wall carbon nanotubes form strong interfaces with the aluminium matrix through mechanical interlocking, leading to high yield stress (more than 600 MPa), and using CNTs as reinforcement improved the hardness and strength of the aluminium composite. L. K. Singh et al. [22] examined the sintering temperature and heating rate influence ofAl-0.5 wt.% MWCNT nanocomposites after sintering. Their findings revealed that elevating the sintering temperature from 400 to 600 °C resulted in a 19.1% rise in microhardness and a 20.2% increase in elastic modulus. From this observation, we can say that sintering process parameters play a significant role in enhancing the mechanical properties and microstructures of the composite.
The optimization of sintering process parameters is essential to improve the properties of composite materials. Higher sintering temperature and time are responsible for interfacial reactions that produce undesirable phases in composite materials. L. Liu et al. [23] observed that the interface reaction between CNTs/Al is intensified gradually with the sintering temperature increase from 570 °C to 630 °C. As a result, the formation of an Al4C3 brittle phase occurred, reducing the ductility of the composite. Low sintering temperatures result in insufficient diffusion, leading to low strength and porous structure. Reinforcement content in composite also acts as an important parameter during sintering. The optimum percentage of reinforcement is responsible for a finer microstructure because reinforcement particles behave as a barrier to the grain boundaries [24]. In a previous study, M. A. Awotunde et al. [25] observed that the composites containing a small proportion of CNTs exhibit diminished Al-CNT interfaces and fewer obstacles to Al atom diffusion. It allows for smooth diffusion of Al atoms, effectively filling gaps between neighboring particles during sintering. However, clustered CNTs are a diffusion barrier during sintering, reducing powder sinter ability.
Nowadays, many people employ the DOE technique to overcome the drawbacks of conventional optimization strategies. The commonly used DOE are Taguchi, factorial, and response surface methods [26]. Employing the Taguchi approach to optimize the process variables and shorten experimentation times and expense is a standard practice because it is based on a fractional factorial design [27]. Additionally, by carefully selecting the experimental runs, one should avoid using the whole factorial design. An OA is a matrix with rows and columns filled with all the conceivable combinations of the controllable variables. The S/N and OA are the two critical components of the Taguchi technique. The noise effect lowers the S/N, a ratio of sensitivity to variability, improving the product’s quality.
Regarding the objective function, the S/N that can be classified as large is best, nominal is best, or smaller is best. Taguchi and analysis of variance (ANOVA) approaches are frequently used to perform fewer tests (experiments) and deal with outcomes that are influenced by several variables, using the design of experiment techniques [28]. It is used to find the best combination of variables for a certain result and optimize process variables. This method has been used to determine the parameters influencing the sintering process [29,30,31,32,33].
According to the previous discussions, the sintering properties of composites have been examined using various combinations of reinforcements, matrix, and process parameters. As a result, the current research investigated the sintering properties of aluminium composites reinforced with CNTs. Taguchi and ANOVA analyses were used to determine the importance of sintering parameters for the properties of the created composite in various situations. A scanning electron microscope examined the powder morphology and sintered sample.

2. Materials and Methods

2.1. Materials

The matrix material was aluminium powder (Al; 99% pure), supplied by Sigma Aldrich Chemical Private Limited, Anelak Taluk, Bangalore, India. The size of the Al particle lies in the range of 10–50 µm. Adnano Technologies Private Limited, Machenahalli, Karnataka, India, supplied carbon nanotubes (about 10–30 nm in diameter and 10 µm in length) as reinforcement particles. Polyvinyl Butryal (PVB) Resin (C8H14O2)n and ethanol (C₂H₆O) were used for solution mixing of composites. All the beakers used were properly cleaned with acetone before each experiment.

2.2. Solution Mixing Procedure

Al composites with variable CNT reinforcement (0.0, 0.5, and 1.0 wt.%) were synthesized using a powder metallurgical technique. An optimum Al and CNT powder ratio was blended using a solution mixing approach. Initially, the appropriate wt.% of CNTs (0.0, 0.5, and 1.0) were introduced to 100 mL ethanol and sonicated for 20 min to separate pristine CNT bundles into individual tubes. Meanwhile, the same amount of PVB as CNTs was dissolved in 100 mL ethanol. The PVB–ethanol solution was then mixed with 50 gm Al powder. The surface of the Al particles was ideally coated by a thin layer of PVB after magnetic stirring the Al-PVB-ethanol slurry for 2 h at 400 rpm, which decreased the surface tension of Al and enabled to absorb CNTs on the surface of the Al particles. The 100 mL PVB-coated Al-ethanol slurry was then added to the 100 mL CNTs–ethanol solution for 4 h of magnetic stirring at 500 rpm to distribute CNTs in the Al matrix homogeneously, as shown in Figure 1. The uniformly mixed slurry was dried for 15 h at 100 °C before being shaken for another 10 min to break down any powder lumps into uniform composite powder.

2.3. Compaction and Sintering Procedure

A universal testing machine (Instron 8801, 4th Phase Peenya Industrial Area, Bangalore, Karnataka, India) was used to compact the powder composite before sintering. A 20mmdiameter die (made of H13Die steel) was loaded with the composite powder mixture and compacted using the right punch. A thin layer of graphite spray was applied between the powder sample and the die wall to make it simple to remove the compressed sample after compression. In total, 400 KN of the load was applied to the punch to form green pallets of composite powder. After holding for 3 min at this load, the load on the punch was released, and the sample was taken out from the die. The green pallets were then sintered in a tube furnace (supplied by Ants Innovations Pvt. Ltd., Maharashtra, India) with a heating rate of 1 °C/min and a continuous inert gas supply for proper composite sintering.
Taguchi’s DOE was used in the current work to optimize the sintering process parameter. High micro-hardness and relative density of composite results were used to predict the optimum sintering condition. Thus, statistical analysis was conducted using the higher is better principle. The formula in Equation (1) [34] is used to determine the S/N for larger is best:
S N = 10 log 1 n ( i = 1 n 1 y i 2 )
where n indicates the number of observations and yi (i = 1, 2,..., n) are the mean data observed. The experiments were carried out applying a standard OA. When the number of degrees of freedom is equal to or greater than the total of the parameters, the orthogonal array is chosen. This work analyzes the three factors: sintering temperature (S. Temp.), sintering time (S. Time), and concentration of CNTs for sintering. Overall, 500 °C, 550 °C, and 600 °C for S. Temp; 30 min, 60 min, 90 min for S. Time; and 0.0 wt.%, 0.5 wt.%, and 1.0 wt.% for CNTs, each exhibiting three levels in the testing. An L9 orthogonal array was employed with nine rows and three columns, as shown in Table 1. Micro-hardness and relative density were the responses that needed to be examined. They were both taken through an ANOVA to find that larger is best.
According to the L9 orthogonal array in Table 1, the pellets were sintered (in nine runs) in an argon atmosphere using a tube furnace at three levels of CNTs ratio, sintering temperature, and time. A thermocouple was inserted into the furnace’s center to measure the sintering temperature during sintering.

2.4. Characterizations

Field emission scanning electron microscope (Supra 55, Zeiss, Jena, Germany) and X-ray diffraction (XRD) (Smartlab, Rigaku, Tokyo, Japan) have been used to observe the morphology and phase analysis of Al and CNTs before mixing. An optical microscope (DM2700M, Leica, Tokyo, Japan) was used to analyze the morphology of CNTs-Al composites after sintering. For the microscopic examination, sintered samples were cut for polishing and ground to remove any remaining graphite. The polishing operation used SiC paper with grit sizes of 100, 120, 400, 600, 800, 1000, and 2000. Alumina slurry polishing was done after this step. The samples were submerged in an ethanol solution and ultrasonically cleaned for 15 min using a digital ultrasonic cleaner to remove the fine alumina particles that got attached to the composites during polishing. After polishing, samples were carefully chemically etched using an acid solution containing 25% HNO3, 15% HCl, 10% HF, and 50% H2O in volume.
The density of the sintered Al composite sample was calculated using Archimedes’ principle. The samples were weighed using a digital scale with an accuracy of 0.00001 g. Here, a mean of five density values is calculated. The prepared composites’ theoretical density (TD) was calculated using the rule-of-mixture approach, as shown in Equation (2) [35], whereas the relative density of samples was calculated using Equation (3).
Theoretical   density ( ρ Bulk ) = ( %   Al ρ Al + %   CNTs ρ CNTs ) 1
Relative   density = ( A c t u a l d e n s i t y T h e o r e t i c a l d e n s i t y × 100 ) %
where ρ Bulk , ρ Al , ρ CNTs are density for bulk composite, Al and CNTs, respectively, and %Al and %CNTs are the percentage composition of each powder in compact.
The Vickers hardness (Hv) test was performed on metallographically polished samples using digital micro-Vickers hardness testing equipment (HM220, Mitutoyo, Tochigi, Japan). The specimen’s micro-hardness was determined by calculating the indentation depth and diagonal length of intent on a sample surface. The experiments were performed at an applied load of 200 gf and a dwell time of 15 s. The mean of five readings for Hv values was used as the hardness value of the sample.

3. Results and Discussion

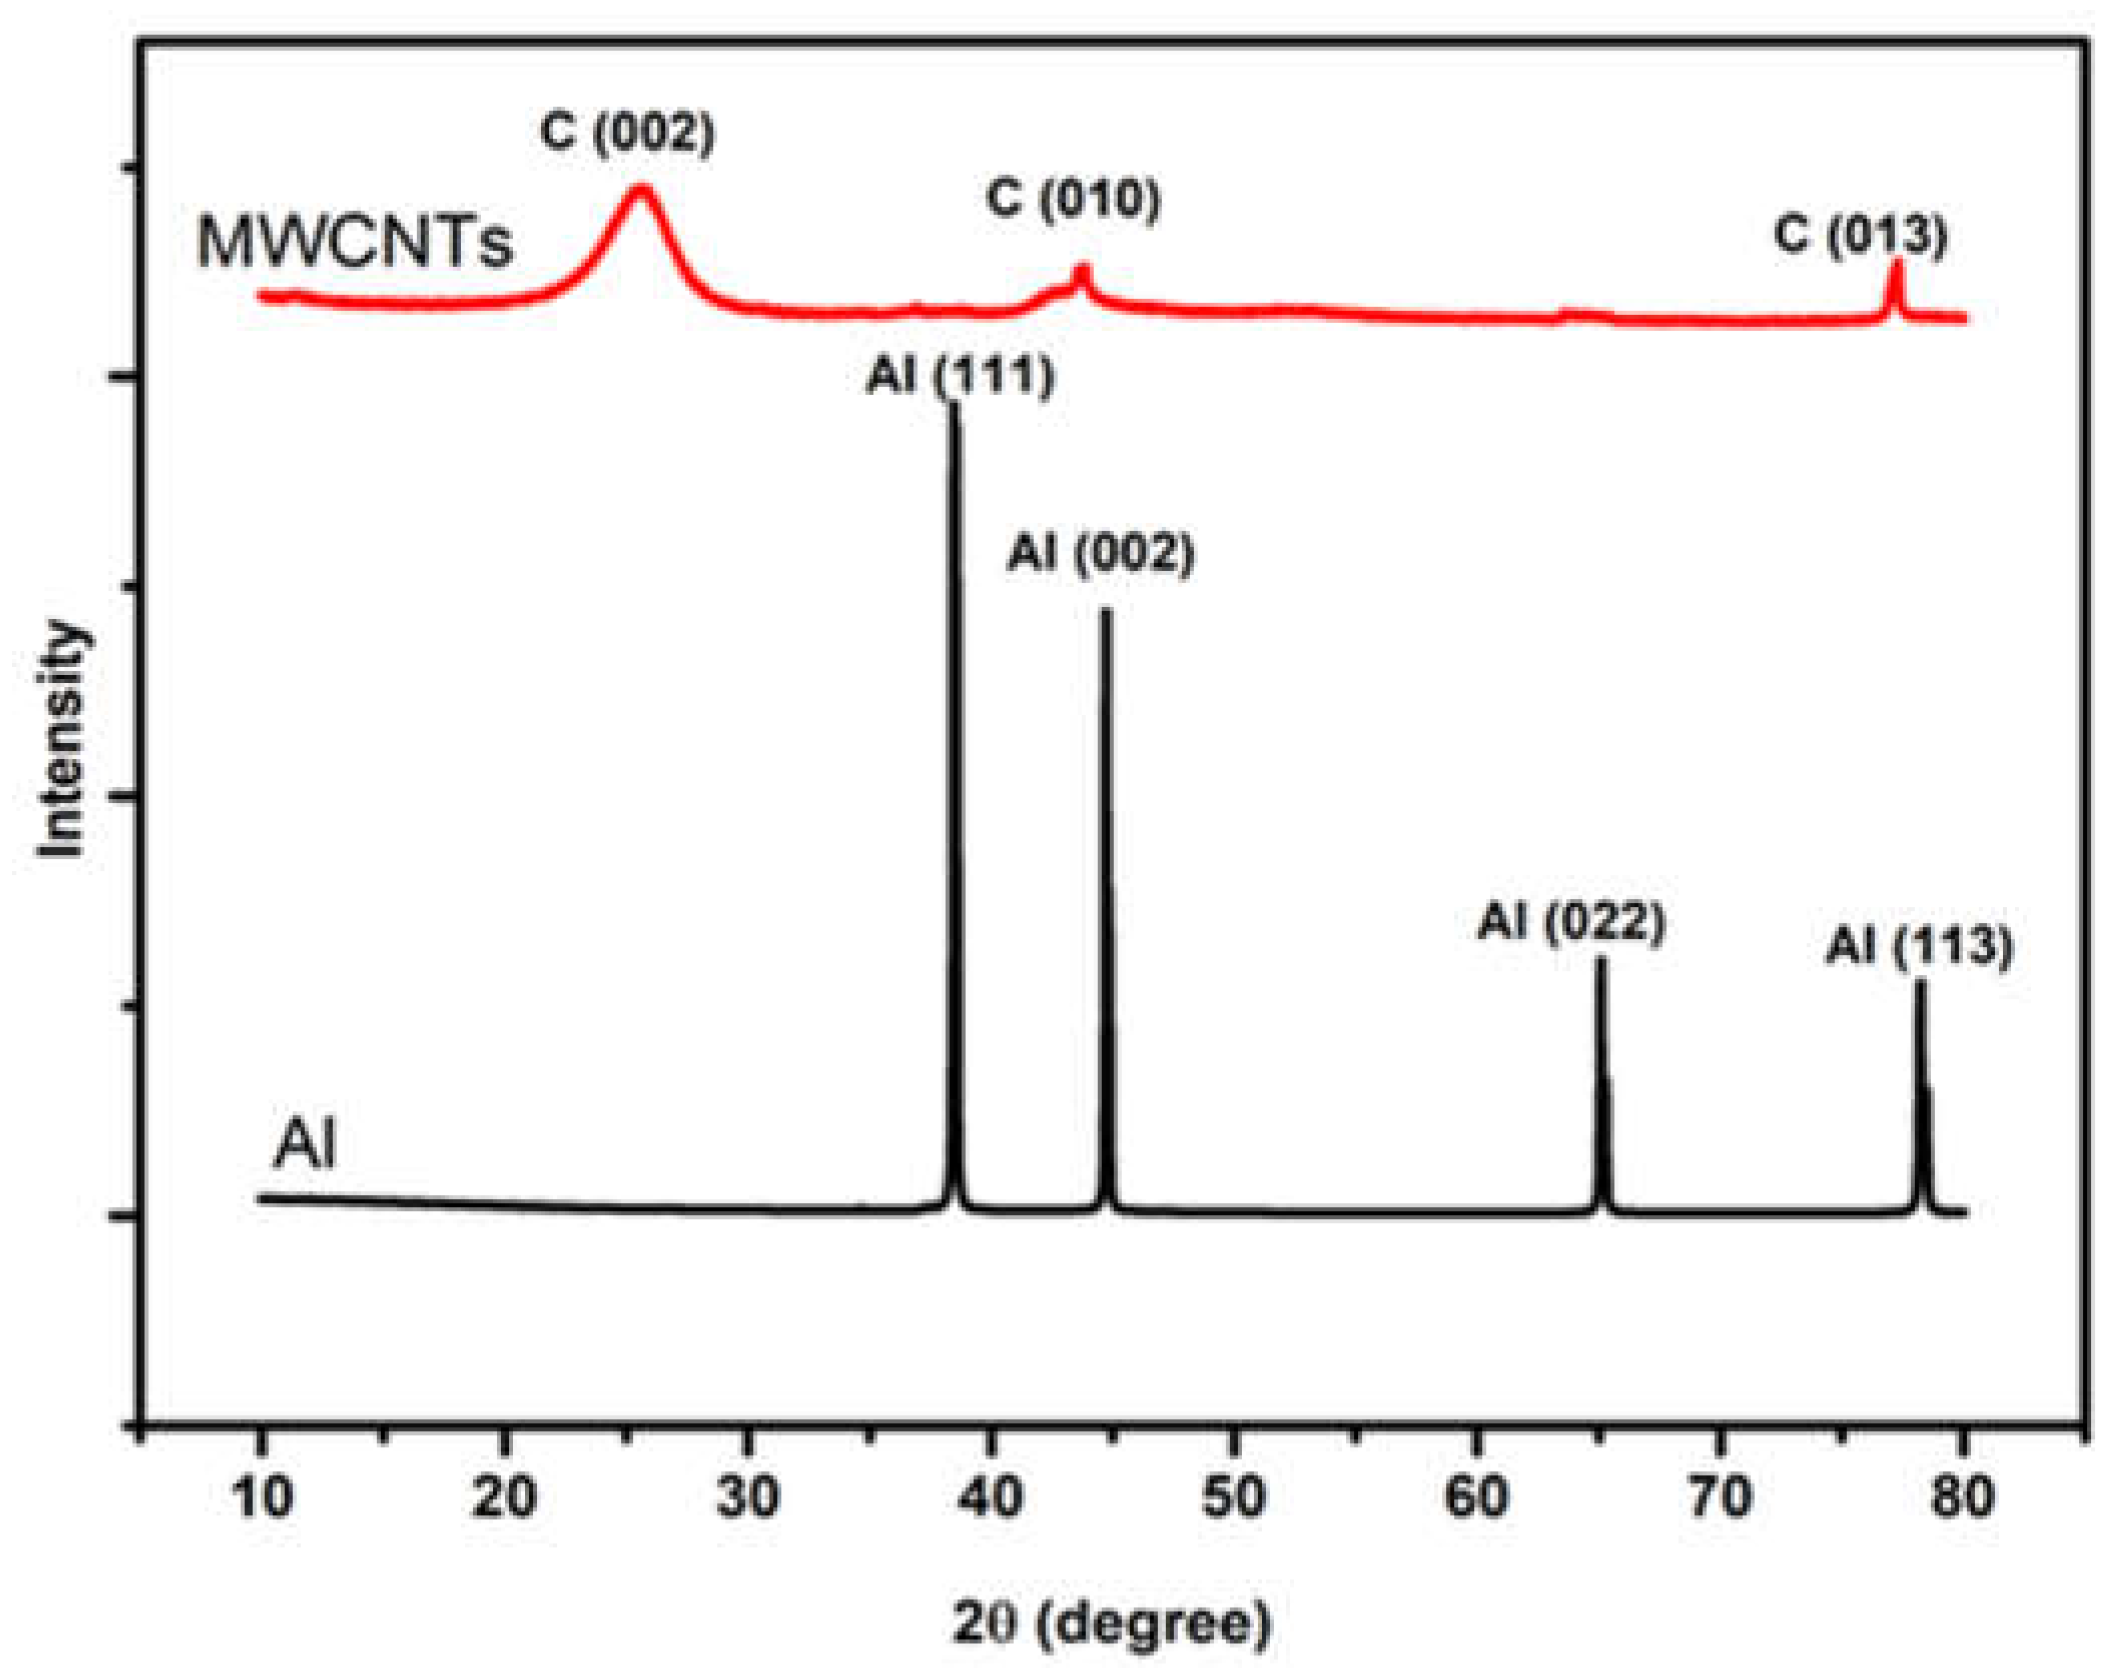
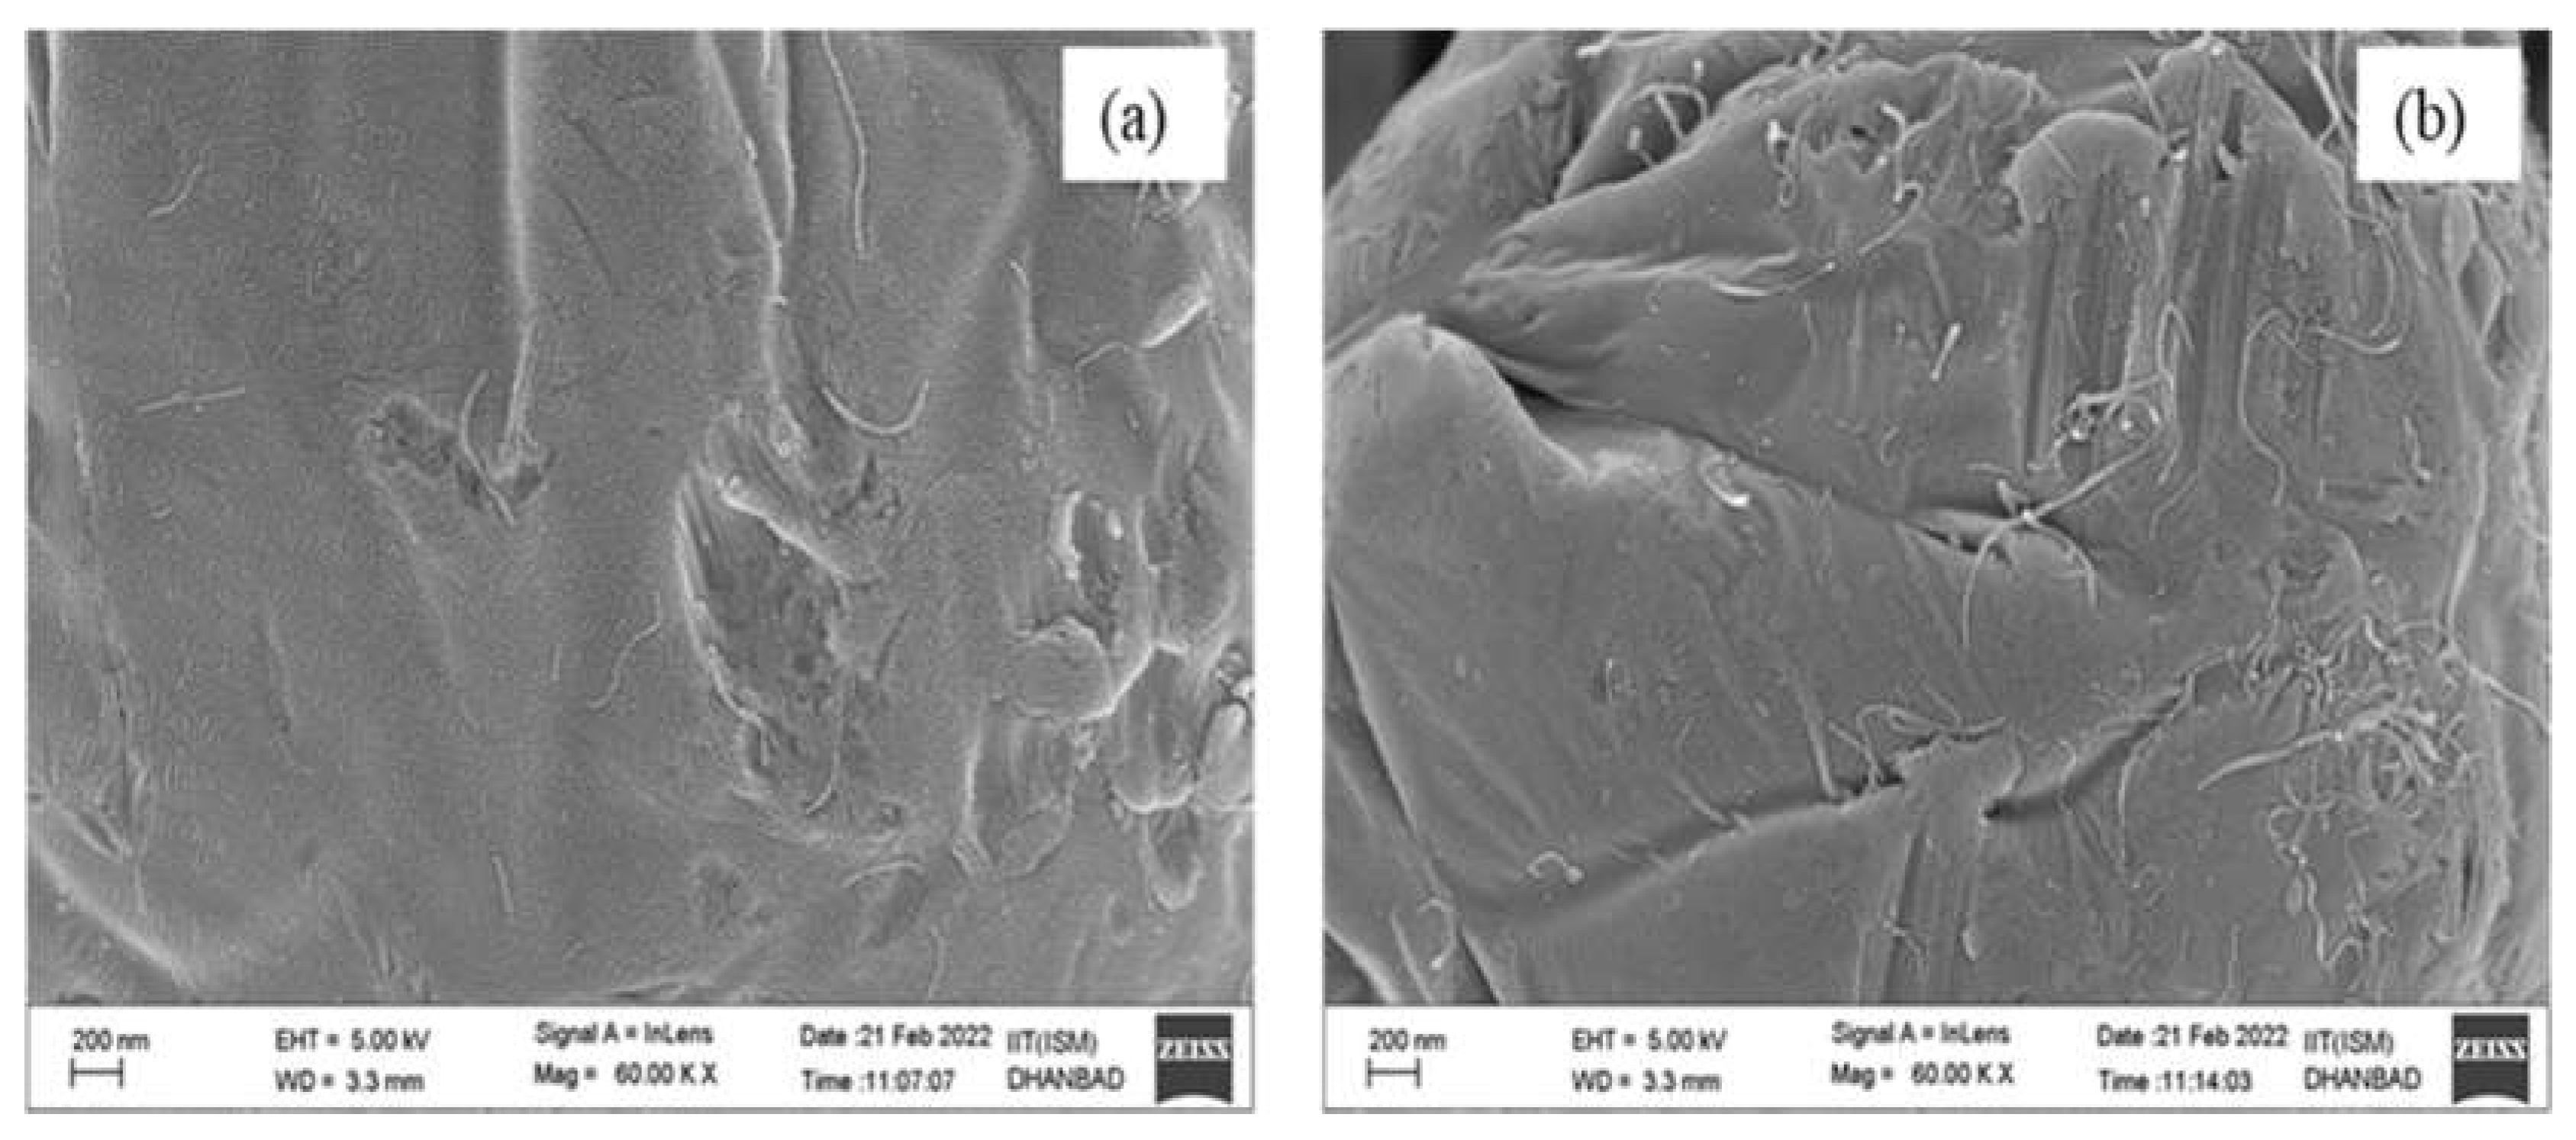
3.1. Macrostructure and Phase Analysis

The shape and structure of the initial Al and CNT powders are shown in Figure 2a,b. Aluminium powders have granular structures that provide a surface for CNT dispersion, in Figure 2a. Pristine CNTs are agglomerated due to their strong Van der Waals force, shown in Figure 2b. Aspect ratios are advantageous for achieving excellent load transmission efficiency of CNT in composites. The XRD micrograph of the Al and CNTs powders as received is shown in Figure 3. Al nano powder contains four sharp crystalline peaks at 2θ of 38,45,65 and 78, respectively, consistent with the previous result [36]. The broad CNT peaks were observed at 2θ of 26, 43, and 77, respectively. The presence of broad peaks confirmed the presence of nano-sized particles. During the particle size reduction process, nanoparticles are extensively strained and distorted. As a result, their peaks were always broadened [37].
Figure 4 demonstrates the morphology of a solution mixed with an Al powder surface coated with CNTs. After the solution-mixing process, the Al powders and CNTs’ morphology does not change. A high-magnification image of the powder surface revealed CNT dispersion. The CNTs were dispersed uniformly and randomly across the Al surface.
In Figure 4a, the concentration of CNTs was 0.5 wt.%, which shows the random dispersion of CNTs without any agglomeration. In contrast, Figure 4b shows the dispersion of 1.0 wt.% CNTs in Al powder. Some dispersed CNTs were observed on the Al powder surface at higher concentrations. So, as the concentration increases, CNTs start agglomerating on the powder surface. A greater proportion of CNT appeared to make CNT dispersion in the aluminium matrix more problematic. Amal et al. [38] reported that more than 1 wt.% CNT levels are utilized. It starts forming clusters in processed composites, reducing strength, stiffness, and ductility.
Figure 5 shows the optical micrograph of the sintered sample produced by varying sintering parameters. The fine pores (black area shown by the arrow) were uniformly spread throughout the aluminium matrix. As the CNT concentration increases, large and irregular pores are observed. Manikandan et al. [39] also reported as the CNT content increases, The microstructure becomes less homogeneous and more porous regions are detected. It happened due to the presence of undispersed CNT clusters in the composite. It suggests that micropores are made due to the agglomeration of composite powder, and it is very difficult to eliminate during the sintering process. These pores get completely reduced after performing the metal-forming process (like extrusion, forging, and rolling) on sintered composites to enhance their properties [40]. Figure 5a shows a lower amount of grain growth due to partial sintering. During the sintering process, the slow diffusion of Al particles occurred due to low temperature and short sintering time. Figure 5b shows proper sintering and fine grains when the sintering temperature was 550 °C and the sintering time was 60 min. In Figure 5c, grain growth has been observed due to a large sintering time of 90 min at a high sintering temperature of 600 °C. During the initial state of sintering at low temperatures, the densification of Al started with neck growth and reduced as the sintering time increased. CNT concentration hampered neck formation by restricting atomic diffusion [41]. At high concentrations of CNTs, the sintering of concurrent particles did not occur, which produced a number of interconnected pores. When the sintering temperature was high, the diffusion of Al increased, resulting in the non-uniform distribution along grain boundaries and producing micro-pores. Figure 5d,h show the proper sintering of composites with low porosity defects and grain refinement. Figure 5e,f show grain growth after sintering, whereas Figure 5g,i do not show visible grain growth, which might be due to the high concentration of CNTs. Hou et al. [42], while performing the sintering of Al/CNTs composites, observed that CNTs and their clusters have a pinning effect, which restricts grain growth. CNTs in Al powders hinder the Al particles’ sintering process, resulting in a less dense structure.

3.2. Influence of Input Parameters on Micro-Hardness

The hardness of Al-CNT-reinforced composites was as high as pure Al. Three main reasons are considered for the increase in the hardness of Al CNTs composites. The first reason is the higher dislocation motion produced by CNTs due to an increase in the CNTs phase [43]. Second, the matrix of Al-CNTs MMCs has a higher dislocation density due to dislocation generation caused by differences in the thermal expansion coefficients of aluminium and CNT, which causes thermal mismatch (or Orowan looping) stresses, resulting in increased dislocation density and increasing Al-CNTs MMCs micro-hardness [44]. Due to restrictions in dislocation motion, fine grains are produced responsibly to increase the hardness of composites. The third reason is the nature of the interface between the CNTs phase and the aluminium ductile matrix [45]. This strongly influences the mechanical properties of Al-CNTs composites, as this interface controls the efficiency of load transfer from the Al matrix to the CNTs.
Table 2 shows the L9 OA for micro-hardness calculated from the Vickers hardness test and their S/N value. Figure 6 shows the effect of process parameters on macro-hardness. The hardness values in Figure 6 were calculated by taking the mean of all the sintering processes performed at the parameter mentioned on the x-axis. It was observed that the hardness of the composite started increasing with an increase in CNT concentration, but at above 0.5 wt.% of CNTs, the increasing rate gets reduced. The low content of CNTs indicates less Al-CNTs interface and more diffusion of Al atoms. At higher CNT concentrations, the cluster of CNTs along the grain boundaries acts as a diffusion barrier during sintering [46]. When we observed the effect of sintering temperature on micro-hardness, it increased with an increase in temperature up to 550 °C, whereas between 550 to 600 °C, the micro-hardness shows a small change, and as the sintering temperature was raised, the micro-hardness value significantly declined, eventually reaching a minimum of 42.3 Hv. The increased grain growth at elevated heat can be ascribed to this result. The Hall–Petch relationship applies as the micro-hardness reduces with grain size increases [46]. As a result, there were fewer grains per grain border, which increased grain size.
Moreover, the micro-hardness of Al-CNTs is slightly influenced by the sintering period and increases with longer heating times. After sintering for 90 min, the highest value of 43.1 HV was attained; however, micro-hardness slightly decreased with increased sintering duration. This outcome can result from excessive grain growth due to prolonged exposure to high temperatures. Ninety minutes of sintering time ensures minimum or no reaction between CNTs and Al metal matrix.

3.3. Influence of Input Parameters on Density

Relative density determined using Equations (2) and (3), along with the S/N value obtained from Taguchi DOE, is shown in Table 2. Figure 7 shows the average density main effect plots. As shown, the density decreases as CNTs wt.% increases. Due to the lightweight and hollow structures of CNTs, the overall density of the composite decreased. The presence of CNTs hampered neck formation by restricting atomic diffusion during sintering [47]. Due to that, the sintering of concurrent particles does not occur and produces a number of interconnected pores. This typical response for the Al-CNTs composite at 600 °C can be attributed to melting solid particles and improved diffusion that minimizes porosity. When the sintering temperature rose to 600 °C, the produced composite’s volume expanded, and its density eventually increased.
With a minor abrupt change, the effect of the sintering duration mostly on the RD of Al-CNTs is comparable to that of the sintering temperature. Due to inadequate diffusion and inter-particle voids, the density was initially lower, and the porosity was larger. However, at a sintering period of 90 min, the diffusion was enough to fill the pre-existing pores and raise the RD either unchanged or with minimal volume changes. The composite material was exposed to high temperatures for longer after extending the sintering duration to 90 min. Temperature and time during sintering were insignificant variables. However, the sintering duration was the least significant factor determining the change in the RD. The sintering temperature was the most significant of the insignificant variables impacting the composite experimental density, with a max–min value of 0.06.

3.4. Selection of Optimum Sintering Condition

The mean S/N responses obtained for hardness are shown in Table 3. The mean S/N graph formed in the Minitab software tool is shown in Figure 6. A higher S/N value indicates a smaller variance gap between the desired and measured output [48]. The means and S/N ratios were calculated in the response tables (Table 3 and Table 4). The calculated delta (the difference between the maximum and minimum value) for CNTs%, temperature, and time is 2.38, 0.38, and 0.22 in Table 3 for the means of hardness. The largest delta (∆) for CNT% suggests that it has the most impact on sintering. Table 4 bolded the corresponding level values for easy interpretation from the response table. The mean S/N responses obtained for relative density are shown in Table 4. The mean S/N for relative density is shown in the graph depicted in Figure 7. The calculated delta for CNTs%, temperature, and time is 0.15, 0.06, and 0.02 in Table 4 for means of RD. The largest delta (∆) for CNTs% suggests it has the most impact on sintering.

3.5. ANOVA for Hardness and Relative Density

ANOVA identified the process parameters that have the most significance over performance-defining sintering properties [49]. The ANOVA results for hardness and relative density are reported in Table 5 and Table 6, respectively. Table 5 and Table 6 show that the hardness and density of sintered composites are influenced by CNTs wt.%, temperature and time. The percentage contribution of CNTs, temperature and time on hardness was 77.5%, 13.64%, and 5.11%, respectively, shown in Table 5. Similarly, the percentage contribution of sintering parameters CNTs, temperature and time on relative density was 83.58%, 14.58%, and 1.63%, respectively, as shown in Table 6. ANOVA analysis confirmed that the CNTs wt.% has the most significant influence on hardness and relative density during the sintering process.
The derived values of S, R-sq., R-sq.(adj), and R-sq.(pred) also support the findings. The parameter ‘S’ represents the dispersion extent of data points from the fitted values. A smaller ‘S’ value indicates enhanced performance. In this instance, the ‘S’ value of 1.2250 (as shown in Table 5) suggests that the model effectively portrays the response. R-sq. reflects the proportion of variance in the response variable captured by the model—a higher R-sq. percentage corresponds to a better model fit. With a calculated R-sq. value of = 98.7%, the model effectively explains the variation in micro-hardness. Moreover, the R-sq.(adj) value of 94.7% suggests that even when additional variables are incorporated, the model maintains its strength in elucidating hardness variability. The R-sq.(pred) value of 85.23% underscores the utility of the regression model in predicting outcomes for new observations. Similarly, the obtained results are further validated for RD by evaluating the metrics S, R-sq., R-sq.(adj), and R-sq.(pred). The value of ‘S’ 0.07337 underscores the strength of the model and its satisfactory ability to account for the response. The R-sq. score of 99.8% highlights the model’s significant contribution to explaining the variation in RD. The R-sq.(adj) value obtained indicates the enduring effectiveness of the model in explaining variation, even in the presence of additional variables. It is worth noting that the R-sq.(pred) value of 89.09%underscores the regression model’s aptitude in predicting responses for new observations.

3.6. Modeling

The Minitab 17.0 software was used in the current work to create predictive mathematical models for the dependent variables of relative density and micro-hardness as a function of CNTs wt.%, sintering time, and temperature. Equations (4) and (5) are the regression-derived prediction equations for micro-hardness and relative density, respectively.
H a r d n e s s = 33.0 32.6 × C N T s + 0.0900 × t e m p e r a t u r e + 11.25 × t i m e + 0.1160 × C N T s × t e m p e r a t u r e 1.846   C N T s × t i m e 0.01634 × t e m p e r a t u r e × t i m e
R e l a t i v e   D e n s i t y = 89.651 1.620 × C N T s + 0.00663 × t e m p r a t u r e + 0.0230 × t i m e  
The competence of the developed models was tested using the R2 coefficient of determination. The coefficient of determination can range between 0 and 1. If it is close to 1, it indicates that the independent and dependent variables are well-matched. If R2 = 95%, the new observations were estimated with a 95% variability. This study’s proposed regression models for hardness and relative density had high R2 values of 98.7% and 99.79%, respectively. The residual plot was used to assess the importance of the predicted model’s coefficients. If the residual plot appears straight, it suggests that the model’s residual errors have normal distributions and that its coefficients are now significant [50]. The residual plots for micro-hardness and relative density are shown in Figure 8 and Figure 9, respectively. The residuals in Figure 8 and Figure 9 are close to a straight line for micro-hardness and relative density, implying that the produced coefficient model is significant.
The contour and 3D surface plot representations of the micro-hardness and relative density are depicted in Figure 10 and Figure 11. The surface plots in Figure 10b showcase a curvilinear shape consistent with the fitted quadratic model. As illustrated in Figure 10a, it becomes apparent that the maximum hardness is observed when the sintering temperature is 550 °C, and the CNT concentration is maximum, whereas in the case of relative density, in Figure 11b, the surface plot shows a flat face. It indicates a slight variation in RD due to sintering. Figure 11a shows the maximum relative density at low CNT concentration and high sintering temperature. This optimization leads to hardness and RD values of 48.5 Hv and 93.27%, respectively.

4. Conclusions

A conventional sintering process was effectively used in this study to sinter Al/CNTs composite with desirable properties suitable for automotive and aerospace sectors. In the investigation and evaluation process of the ideal process parameters levels involving CNTs wt.%, sintering temperature, and dwell time on the relative density and micro-hardness of Al/CNTs composite sintered, the Taguchi L9 orthogonal array, S/N, and ANOVA statistical techniques were applied. The previous discussion leads to the following conclusions:
  • The conventionally sintered composite had high CNT agglomerations across grain boundaries, which act as obstacles to effective heat transmission during sintering and produce pre-existing crack sites, enhancing porosity and preventing effective load transfers between the matrix and matrix reinforcements, resulting in material failure at low-stress levels.
  • When the temperature was raised from 550 °C to 600 °C, the relative densification and micro-hardness increased, and when the CNTs concentration increased, the relative density decreased and micro-hardness increased. The S/N results, on the other hand, demonstrated that the CNT concentration, followed by the temperature, has the most critical influence on the optimal quality attributes of micro-hardness and relative density obtained.
  • The statistical studies based on ANOVA revealed that CNT concentration significantly influences relative density with an 83.58% percentage contribution, followed by temperature with a 14.58% percentage contribution. In the case of micro-hardness, CNT contributed the most (77.75%), followed by the temperature (14.58%) percentage contribution. The effect of noise factor on hardness and relative density contributed from the error source was 3.48% and 0.2%,which is very low.
  • According to the created mathematical models for micro-hardness and relative density, the projected response results and experimental data were in close agreement. As a result, the generated models might be used for optimal sintering condition selection to enhance the product quality without requiring trial tests on Al/CNTs materials.

Author Contributions

Methodology and Formal analysis by N.K. and R.P., Investigation, Writing—original draft and editing by N.K., Y.S. and H.N., Supervision by S.S., A.S. and W.H.L.; data curation by R.P. and Y.S.; Conceptualization by Y.S.; writing—review and editing, A.S., W.H.L. and Resources—W.H.L. and S.S.T.; Funding Acquisition—W.H.L. and S.S.T. All authors have read and agreed to the published version of the manuscript.

Funding

This research received no external funding.

Data Availability Statement

All relevant data are contained in the present manuscript.

Acknowledgments

The authors thank the Indian Institute of Technology (ISM) for providing material characterization facilities in their Central Research Facilities lab.

Conflicts of Interest

The authors declare no conflict of interest.

References

  1. Esawi, A.M.K.; Morsi, K.; Sayed, A.; Taher, M.; Lanka, S. Effect of carbon nanotube (CNT) content on the mechanical properties of CNT-reinforced aluminium composites. Compos. Sci. Technol. 2010, 70, 2237–2241. [Google Scholar] [CrossRef]
  2. Reboul, M.C.; Baroux, B. Metallurgical aspects of corrosion resistance of aluminium alloys. Mater. Corros. 2011, 62, 215–233. [Google Scholar] [CrossRef]
  3. Miracle, D.B. Metal matrix composites—From science to technological significance. Compos. Sci. Technol. 2005, 65, 2526–2540. [Google Scholar] [CrossRef]
  4. Omrani, E.; Moghadam, A.D.; Menezes, P.L.; Rohatgi, P.K. Influences of graphite reinforcement on the tribological properties of self-lubricating aluminum matrix composites for green tribology, sustainability, and energy efficiency—A review. Int. J. Adv. Manuf. Technol. 2016, 83, 325–346. [Google Scholar] [CrossRef]
  5. Khanna, V.; Kumar, V.; Bansal, S.A. Mechanical properties of aluminium-graphene/carbon nanotubes (CNTs) metal matrix composites: Advancement, opportunities and perspective. Mater. Res. Bull. 2021, 138, 111224. [Google Scholar] [CrossRef]
  6. Rahman, M.H.; Al Rashed, H.M.M. Characterization of silicon carbide reinforced aluminum matrix Composites. Procedia Eng. 2014, 90, 103–109. [Google Scholar] [CrossRef]
  7. Alaneme, K.K.; Sanusi, K.O. Microstructural characteristics, mechanical and wear behaviour ofaluminium matrix hybrid composites reinforced with alumina, rice husk ash and graphite. Eng. Sci. Technol. Int. J. 2015, 18, 416–422. [Google Scholar] [CrossRef]
  8. Alizadeh, A.; Abdollahi, A.; Biukani, H. Creep behavior and wear resistance of Al 5083 based hybrid composites reinforced with carbon nanotubes (CNTs) and boron carbide (B4C). J. Alloys Compd. 2015, 650, 783–793. [Google Scholar] [CrossRef]
  9. George, R.; Kashyap, K.T.; Rahul, R.; Yamdagni, S. Strengthening in carbon nanotube/aluminium (CNT/Al) composites. Scr. Mater. 2005, 53, 1159–1163. [Google Scholar] [CrossRef]
  10. Dorri Moghadam, A.; Omrani, E.; Menezes, P.L.; Rohatgi, P.K. Mechanical and tribological properties of self-lubricating metal matrix nanocomposites reinforced by carbon nanotubes (CNTs) and graphene—A review. Compos. Part B Eng. 2015, 77, 402–420. [Google Scholar] [CrossRef]
  11. Shirvanimoghaddam, K.; Hamim, S.U.; Karbalaei Akbari, M.; Fakhrhoseini, S.M.; Khayyam, H.; Pakseresht, A.H.; Ghasali, E.; Zabet, M.; Munir, K.S.; Jia, S.; et al. Carbon fiber reinforced metal matrix composites: Fabrication processes and properties. Compos. Part A Appl. Sci. Manuf. 2017, 92, 70–96. [Google Scholar] [CrossRef]
  12. Liang, A.; Jiang, X.; Hong, X.; Jiang, Y.; Shao, Z.; Zhu, D. Recent developments concerning the dispersion methods and mechanisms of graphene. Coatings 2018, 8, 33. [Google Scholar] [CrossRef]
  13. Torralba, J.M.; Da Costa, C.E.; Velasco, F. P/M aluminum matrix composites: An overview. J. Mater. Process. Technol. 2003, 133, 203–206. [Google Scholar] [CrossRef]
  14. Deng, C.F.; Wang, D.Z.; Zhang, X.X.; Li, A.B. Processing and properties of carbon nanotubes reinforced aluminum composites. Mater. Sci. Eng. A 2007, 444, 138–145. [Google Scholar] [CrossRef]
  15. Kumar, R.; Bhowmick, H.; Gupta, D.; Bansal, S. Development and characterization of multiwalled carbon nanotube-reinforced microwave sintered hybrid aluminum metal matrix composites: An experimental investigation on mechanical and tribological performances. Proc. Inst. Mech. Eng. Part L J. Mater. Des. Appl. 2021, 235, 2310–2323. [Google Scholar] [CrossRef]
  16. Guo, B.; Ni, S.; Yi, J.; Shen, R.; Tang, Z.; Du, Y.; Song, M. Microstructures and mechanical properties of carbon nanotubes reinforced pure aluminum composites synthesized by spark plasma sintering and hot rolling. Mater. Sci. Eng. A 2017, 698, 282–288. [Google Scholar] [CrossRef]
  17. Azarniya, A.; Azarniya, A.; Sovizi, S.; Hosseini, H.R.M.; Varol, T.; Kawasaki, A.; Ramakrishna, S. Physicomechanical properties of spark plasma sintered carbon nanotube-reinforced metal matrix nanocomposites. Prog. Mater. Sci. 2017, 90, 276–324. [Google Scholar] [CrossRef]
  18. Housaer, F.; Beclin, F.; Touzin, M.; Tingaud, D.; Legris, A.; Addad, A. Interfacial characterization in carbon nanotube reinforced aluminum matrix composites. Mater. Charact. 2015, 110, 94–101. [Google Scholar] [CrossRef]
  19. Ankur; Bharti, A.; Prasad, D.; Kumar, N.; Saxena, K.K. A Re-investigation: Effect of various parameter on mechanical properties of copper matrix composite fabricated by powder metallurgy. Mater. Today Proc. 2021, 45, 4595–4600. [Google Scholar] [CrossRef]
  20. Wang, L.; Choi, H.; Myoung, J.M.; Lee, W. Mechanical alloying of multi-walled carbon nanotubes and aluminium powders for the preparation of carbon/metal composites. Carbon 2009, 47, 3427–3433. [Google Scholar] [CrossRef]
  21. Choi, H.J.; Lee, S.M.; Bae, D.H. Wear characteristic of aluminum-based composites containing multi-walled carbon nanotubes. Wear 2010, 270, 12–18. [Google Scholar] [CrossRef]
  22. Singh, L.K.; Bhadauria, A.; Jana, S.; Laha, T. Effect of Sintering Temperature and Heating Rate on Crystallite Size, Densification Behaviour and Mechanical Properties of Al-MWCNT Nanocomposite Consolidated via Spark Plasma Sintering. Acta Metall. Sin. (Engl. Lett.) 2018, 31, 1019–1030. [Google Scholar] [CrossRef]
  23. Liu, L.; Li, S.; Zhang, X.; Pan, D.; Gao, L.; Chen, B.; Umeda, J.; Kondoh, K. Syntheses, microstructure evolution and performance of strength-ductility matched aluminum matrix composites reinforced by nano SiC-cladded CNTs. Mater. Sci. Eng. A 2021, 824, 141784. [Google Scholar] [CrossRef]
  24. Vani, V.V.; Chak, S.K. The effect of process parameters in Aluminum Metal Matrix Composites with Powder Metallurgy. Manuf. Rev. 2018, 5, 7. [Google Scholar] [CrossRef]
  25. Awotunde, M.A.; Adegbenjo, A.O.; Obadele, B.A.; Okoro, M.; Shongwe, B.M.; Olubambi, P.A. Influence of sintering methods on the mechanical properties of aluminium nanocomposites reinforced with carbonaceous compounds: A review. J. Mater. Res. Technol. 2019, 8, 2432–2449. [Google Scholar] [CrossRef]
  26. Astkahov, V.P.; Outeiro, J.C. Finite Element Modellin. InMachining. Fundamentals and Recent Advances; Springer: Berlin/Heidelberg, Germany, 2008; ISBN 978-3-319-23837-1. [Google Scholar]
  27. Sahoo, P.; Pratap, A.; Bandyopadhyay, A. Modeling and optimization of surface roughness and tool vibration in CNC turning of aluminum alloy using hybrid RSM-WPCA methodology. Int. J. Ind. Eng. Comput. 2017, 8, 385–398. [Google Scholar] [CrossRef]
  28. Sukumar, S.; Saravanan, S.; Prabhu, T.R.; Parameswaran, P. Optimization of process parameter of sintered powder metallurgical TiC reinforced tungsten matrix composites. Met. Powder Rep. 2021, 76, S1–S8. [Google Scholar] [CrossRef]
  29. Dhemla, P.; Somani, P.; Swami, B.L.; Gaur, A. Optimizing the design of sintered fly ash light weight concrete by Taguchi and ANOVA analysis. Mater. Today Proc. 2022, 62, 495–503. [Google Scholar] [CrossRef]
  30. Hegde, A.L.; Shetty, R.; Chiniwar, D.S.; Naik, N.; Nayak, M. Optimization and Prediction of Mechanical Characteristics on Vacuum Sintered Ti-6Al-4V-SiCp Composites Using Taguchi’s Design of Experiments, Response Surface Methodology and Random Forest Regression. J. Compos. Sci. 2022, 6, 339. [Google Scholar] [CrossRef]
  31. Stalin, B.; Sudha, G.T.; Ravichandran, M. Optimization of Powder Metallurgy Parameters for AA7072-MoO3 Composites through Taguchi Method. Mater. Today Proc. 2020, 22, 2622–2630. [Google Scholar] [CrossRef]
  32. Jailani, H.S.; Rajadurai, A.; Mohan, B.; Kumar, A.S.; Sornakumar, T. Multi-response optimisation of sintering parameters of Al-Si alloy/fly ash composite using Taguchi method and grey relational analysis. Int. J. Adv. Manuf. Technol. 2009, 45, 362–369. [Google Scholar] [CrossRef]
  33. Ali, M.; Hussein, M.A.; Al-Aqeeli, N. Optimization of Spark Plasma Sintering Parameters Using the Taguchi Method for Developing Mg-Based Composites. Jom 2020, 72, 1186–1194. [Google Scholar] [CrossRef]
  34. Sharma, A.; Tirumuruhan, B.; Muthuvel, G.S.; Gupta, A.K.; Sujith, R. Optimization of Process Parameters of Boron Carbide-Reinforced Al-Zn-Mg-Cu Matrix Composite Produced by Pressure-Assisted Sintering. J. Mater. Eng. Perform. 2022, 31, 328–340. [Google Scholar] [CrossRef]
  35. Abe, J.O.; Popoola, O.M.; Popoola, A.P.; Ajenifuja, E.; Adebiyi, D.I. Application of Taguchi design method for optimization of spark plasma sintering process parameters for Ti-6Al-4V/h-BN binary composite. Eng. Res. Express 2019, 1, 25043. [Google Scholar] [CrossRef]
  36. Rijesh, M.; Sreekanth, M.S.; Deepak, A.; Dev, K.; Surendranathan, A.O. Effect of milling time on production of aluminium nanoparticle by high energy ball milling. Int. J. Mech. Eng. Technol. 2018, 9, 646–652. [Google Scholar]
  37. Ujah, C.O.; Popoola, A.P.I.; Popoola, O.M.; Aigbodion, V.S. Influence of CNTs addition on the mechanical, microstructural, and corrosion properties of Al alloy using spark plasma sintering technique. Int. J. Adv. Manuf. Technol. 2020, 106, 2961–2969. [Google Scholar] [CrossRef]
  38. Esawi, A.M.K.; El Borady, M.A. Carbon nanotube-reinforced aluminium strips. Compos. Sci. Technol. 2008, 68, 486–492. [Google Scholar] [CrossRef]
  39. Manikandan, P.; Sieh, R.; Elayaperumal, A.; Le, H.R.; Basu, S. Micro/Nanostructure and Tribological Characteristics of Pressureless Sintered Carbon Nanotubes Reinforced Aluminium Matrix Composites. J. Nanomater. 2016, 2016, 9843019. [Google Scholar] [CrossRef]
  40. Guo, B.; Song, M.; Yi, J.; Ni, S.; Shen, T.; Du, Y. Improving the mechanical properties of carbon nanotubes reinforced pure aluminum matrix composites by achieving non-equilibrium interface. Mater. Des. 2017, 120, 56–65. [Google Scholar] [CrossRef]
  41. Singh, L.K.; Bhadauria, A.; Laha, T. Al-MWCNT nanocomposite synthesized via spark plasma sintering: Effect of powder milling and reinforcement addition on sintering kinetics and mechanical properties. J. Mater. Res. Technol. 2019, 8, 503–512. [Google Scholar] [CrossRef]
  42. Hou, P.X.; Liu, C.; Cheng, H.M. Purification of carbon nanotubes. Carbon 2008, 46, 2003–2025. [Google Scholar] [CrossRef]
  43. Cavaliere, P.; Sadeghi, B.; Shabani, A. Carbon nanotube reinforced aluminum matrix composites produced by spark plasma sintering. J. Mater. Sci. 2017, 52, 8618–8629. [Google Scholar] [CrossRef]
  44. Matvienko, O.; Daneyko, O.; Kovalevskaya, T.; Khrustalyov, A.; Zhukov, I.; Vorozhtsov, A. Investigation of Stresses Induced due to the Mismatch of the Coefficients of Thermal Expansion of the Matrix and the Strengthening Particle in Aluminum-Based Composites. Metals 2021, 11, 279. [Google Scholar] [CrossRef]
  45. Kwon, H.; Estili, M.; Takagi, K.; Miyazaki, T.; Kawasaki, A. Combination of hot extrusion and spark plasma sintering for producing carbon nanotube reinforced aluminum matrix composites. Carbon 2009, 47, 570–577. [Google Scholar] [CrossRef]
  46. Anand Sekhar, R.; Rakesh Pillai, R.; Mubarak Ali, M.; Shyam Kumar, C.N. Enhanced mechanical and wear properties of aluminium-based composites reinforced with a unique blend of granite particles and boron carbide for sustainable material recycling. J. Alloys Compd. 2023, 963, 171165. [Google Scholar] [CrossRef]
  47. Singh, L.K.; Bhadauria, A.; Laha, T. Comparing the strengthening efficiency of multiwalled carbon nanotubes and graphene nanoplatelets in aluminum matrix. Powder Technol. 2019, 356, 1059–1076. [Google Scholar] [CrossRef]
  48. Dutta, S.; Kumar Reddy Narala, S. Optimizing turning parameters in the machining of AM alloy using Taguchi methodology. Measurement 2021, 169, 108340. [Google Scholar] [CrossRef]
  49. Joardar, H.; Das, N.S.; Sutradhar, G.; Singh, S. Application of response surface methodology for determining cutting force model in turning of LM6/SiCP metal matrix composite. Measurement 2014, 47, 452–464. [Google Scholar] [CrossRef]
  50. Ajith Arul Daniel, S.; Pugazhenthi, R.; Kumar, R.; Vijayananth, S. Multi objective prediction and optimization of control parameters in the milling of aluminium hybrid metal matrix composites using ANN and Taguchi-grey relational analysis. Def. Technol. 2019, 15, 545–556. [Google Scholar] [CrossRef]
Figure 1. Schematic diagram of the solution mixing process.
Crystals 13 01352 g001
Figure 2. FESEM morphologies of as-received powders: (a). Al and (b). CNTs.
Crystals 13 01352 g002
Figure 3. XRD diffractograms of the as-received Al and CNTs powders.
Crystals 13 01352 g003
Figure 4. SEM morphologies of Al/CNTs powders: (a). Al-0.5 wt.% CNTs and (b).Al-1.0 wt.% CNTs.
Crystals 13 01352 g004
Figure 5. Optical micrographs of the sintered Al and Al/CNTs composite at various sintering conditions (a) Al at 500°C for 30 min, (b) Al at 550°C for 60 min, (c) Al at 600°C for 90 min, (d) Al-0.5 wt.% CNTs at 500°C for 60 min, (e) Al-0.5 wt.% CNTs at 550°C for 90 min, (f) Al-0.5 wt.% CNTs at 600°C for 30 min, (g) Al-1.0 wt.% CNTs at 500°C for 90 min, (h) Al-1.0 wt.% CNTs at 550°C for 30 min, and (i) Al-1.0 wt.% CNTs at 600°C for 60 min.
Crystals 13 01352 g005
Figure 6. Response graph for macro-hardness means.
Crystals 13 01352 g006
Figure 7. Response graph for relative density means.
Crystals 13 01352 g007
Figure 8. Normal probability plot of the residuals for micro-hardness.
Crystals 13 01352 g008
Figure 9. Normal probability plot of the residuals for relative density.
Crystals 13 01352 g009
Figure 10. Micro-hardness for (a) contours and (b) surface plot in temperature–CNTs concentration at sintering time of 90 min.
Crystals 13 01352 g010
Figure 11. Relative density for (a) contours and (b) surface plot in temperature–CNTs concentration at sintering time of 90 min.
Crystals 13 01352 g011aCrystals 13 01352 g011b
Table 1. Taguchi orthogonal array generated for the experiment.
L9
Test Sample
CNTs
(wt.%)
Sintering Temperature
(°C)
Sintering Time
(Minute)
10.050030
20.055060
30.060090
40.550060
50.555090
60.560030
71.050090
81.055030
91.060060
Table 2. Details of the relative density and macro-hardness measurement.
Test No.Relative density (%)Micro-Hardness (Hv)S/N Ratios of Results
Relative DensityMacro-Hardness
192.45334.339.318430.7059
292.83136.439.353931.2220
393.42736.739.409431.2933
491.64245.239.241933.1028
591.83246.339.259933.3116
692.14843.839.289732.8295
791.12546.339.192833.3116
891.09248.539.189633.7148
991.63346.439.241033.3304
Table 3. The obtained S/N response table for hardness.
Process ParametersMean S/N Hardness
Level 1Level 2Level 3Max–Min (∆)Rank
CNTs (wt.%)31.0733.0833.452.381
Sintering temperature (°C)32.3732.7532.480.382
Sintering time (Minutes)32.4232.5532.640.223
Table 4. The obtained S/N response table for relative density.
Process ParametersMean S/N Density
Level 1Level 2Level 3Max–Min (∆)Rank
CNTs (wt.%)39.3639.2639.210.151
Sintering temperature (°C)39.2539.2739.310.062
Sintering time (Minutes)39.2739.2839.290.023
Table 5. ANOVA results in relation to macro-hardness.
Control FactorsDofSum of SquaresMean Squaresp-Value% Contribution
CNTs (wt.%)22.55401.276990.01377.75
Sintering temperature (°C)20.44810.224060.36213.64
Sintering time (Minutes)20.16800.084010.6285.11
Error20.11460.05732 3.48
Total83.2848 100
S = 1.225; R-sq. = 98.7%; R-sq.(adj) = 94.7%; R-sq,(pred) = 85.23%
Table 6. ANOVA results in relation to relative density.
Control FactorsDofSum of SquaresMean Squaresp-Value% Contribution
CNTs (wt.%)20.0358410.0179200.00283.58
Sintering temperature (°C)20.0062530.0031270.01414.58
Sintering time (Minutes)20.0007000.0003500.1101.63
Error20.0000860.000043 0.2
Total80.042881 100
S = 0.07337; R-sq. = 99.8%; R-sq.(adj) = 99.1%; R-sq,(pred) = 89.09%
Disclaimer/Publisher’s Note: The statements, opinions and data contained in all publications are solely those of the individual author(s) and contributor(s) and not of MDPI and/or the editor(s). MDPI and/or the editor(s) disclaim responsibility for any injury to people or property resulting from any ideas, methods, instructions or products referred to in the content.

