1. Introduction
Tourmalines represent the most widespread borosilicate supergroup of minerals in the Earth’s crust. The incredible increase in interest in these minerals in recent years is due to the wide chemical and structural variability that can be found in the same specimen [
1]. These minerals typically occur in evolved granitic rocks, especially pegmatites, but also leucogranites and associated veins. Tourmalines are typical primary accessory phases in peraluminous granites, but not in metaluminous granites, where they may occur as a late hydrothermal phase. The crystallization of mainly elbaite-shorl-liddicoatite tourmalines in late-stage igneous and hydrothermal rocks is favored by enrichment in the residual granitic melt of incompatible elements, like boron and lithium. In particular, hydrothermalism can also lead to the crystallization of tourmaline as a metasomatic product in the aureole surrounding granitic plutons. This process, called ‘tourmalinization’, refers to the replacement of ferromagnesian minerals, like biotite, by tourmaline.
Dravite-schorl tourmalines occur as accessory phases mainly in metamorphic rocks as a recrystallization product of detrital tourmaline present in the sedimentary protolith or due to boron metasomatism.
The multiple occurrences of tourmaline in different geologic environments reflect a large stability range in both pressure and temperature. It ranges from diagenetic/epigenetic through high-grade metamorphic conditions up to magmatic conditions. The presence of tourmalines in diagenetic zones and hydrothermal deposits suggests that the lower limit for the formation of these minerals is defined approximately at 150 °C and 100 MPa [
2,
3]. The upper thermal stability has been observed in high temperature experiments between 725 °C and 950 °C depending on the pressure and composition [
4,
5,
6,
7,
8,
9].
The general formula of the tourmaline supergroup can be written as:
XY3Z6(T6 O18)(BO3)3V3W
where the most common constituents are:
X = Na, Ca, K or □ (vacancy)
Y = Al, Li, Fe, Mg, Mn, V, Cr, Ti, etc.
Z = Al, Mg, Cr, V, Fe
T = Si, Al, B
B = B
V = OH, O
The letters in the formula (X, Y, Z, T, and B) represent groups of constituents at the
[9]X,
[6]Y,
[6]Z,
[4]T, and
[3]B crystallographic sites. The letters V and W represent groups of anions at the
[3]O3 and
[3]O1 sites, respectively. The H atoms occupy the H3 and H1 sites, which are related to O3 and O1, respectively [
10].
The B site is fully occupied by boron and the T site is predominantly occupied by Si but also can contain Al and B. The Y and Z sites can incorporate many elements with different sizes and charges.
Tourmaline minerals belong to the cyclosilicate subclass. Paraphrasing from Bosi [
11], the crystal structure may be described as follows: The nine-coordinated
XO
9 antiprism, which may also be vacant, and T
6O
18 ring combine with two sets of three octahedra
YO
6; a [Y
3O
15] triplet of octahedra caps the
XO
9 polyhedron toward the
+c axis, with the other [
Y3O
12] capping the [
T6O
18] ring of tetrahedra toward the
−c axis. The BO
3 groups are oriented sub-parallel to (0001) and lie between the rings of tetrahedra. The structural arrangement of [
T6O
18],
XO
9, [
Y6O
18], and (BO
3)
3 form “islands” that are stacked in columns along the
c axis. These islands are attached to one another along the
a and
b crystallographic axes by spiral chains of
ZO
6 octahedra, which also extend along the
c axis via a 3
1 triad screw axis. The three-dimensional framework of the tourmaline structure is therefore given by the screw-like arrangement of
ZO
6.
Due to the chemical composition flexibility, tourmaline is classified as a supergroup that comprises thirty-nine different species approved by the International Mineralogical Association.
Thanks to the great variability of the substitutions occurring in tourmalines, these minerals show very different colors and often appear zoned. The color zoning mainly reflects the growth condition evolution under which the minerals were formed. The changes in chemical composition of the growth medium and variations in temperature and pressure force the mineral to readjust its composition during its formation, creating, in some cases, abrupt modification of color and composition in the same crystal [
11].
The stunning array of colors that characterize tourmalines makes them highly appreciated in the gemological trade. The most important varieties used as gems belong to elbaite (indicolite, rubellite, verdelite, etc.) but also, for example, species such as dravite, fluor-liddicoatite, and, rarely, schorl.
A very singular variety of tourmaline heavily zoned perpendicularly to the c axis, with a dark green rim and a usually pink or multicolored core, is named watermelon.
Generally, this variety consists of a liddicoatitic or elbaitic composition, even so, to the best of our knowledge, the literature contains an uncomplete crystal chemical characterization of watermelon tourmaline. Using only chemical analyses, an elbaitic composition was found by Johnson et al. [
12] for watermelon tourmalines from Zambian deposits and by Roda-Robles et al. [
13] for watermelon tourmalines from Berry–Havey pegmatite (Maine, Oxford, MS, USA). An elbaitic composition was also found by Natkaniec-Nowak et al. [
14] and Wesełucha-Birczyńska et al. [
15] in samples of watermelon tourmaline from Paprok mine (Afghanistan) using both chemical and spectroscopic Raman analyses. Conversely, a liddicoatitic composition was found only based on optical observations on samples from Anjanabonoina district (Madagascar) and Möng Long and Molo (Myanmar) that showed the typical trigonal stars of this tourmaline species [
16,
17]. A coexistence between liddicoatitic and elbaitic compositions was observed by Akizuki et al. [
18] and Dirlam et al. [
19], both of Malagasy origin. In detail, Akizuki et al. [
18] observed, by EPMA and X-ray diffraction, growth sectors of liddicoatitic composition and an outer rim zone of elbaitic composition. Similarly, Dirlam et al. [
19] observed by X-ray mapping an elbaitic and liddicoatitic portion in different zones of the same sample. In both studies, light elements such as H, Li and B were calculated without any crystal structure information.
In this study, a detailed characterization of a watermelon tourmaline from Anjanabonoina was performed for the first time using chemical and structural information, including measurements of light elements like Li.
2. Materials and Methods
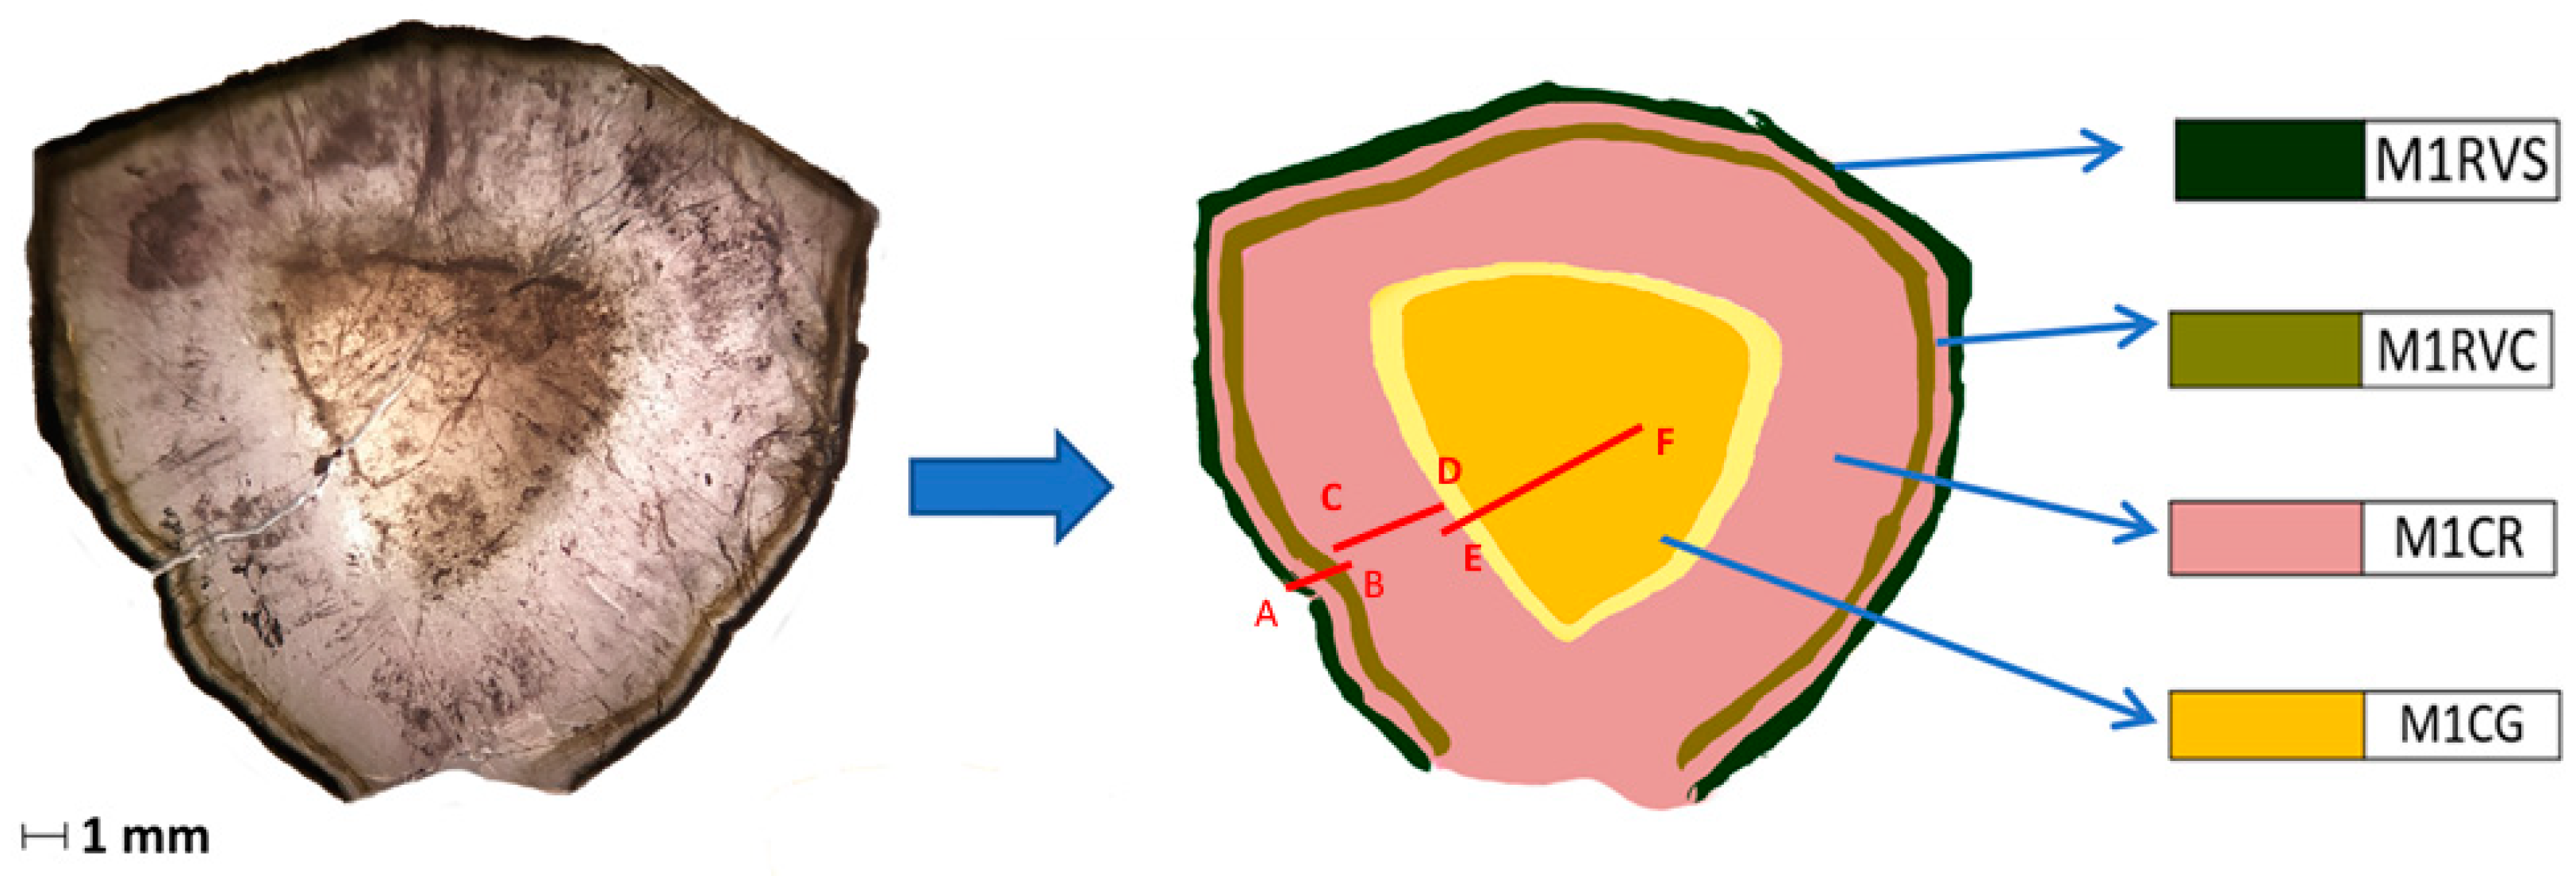
The studied tourmaline, labelled MADAG 1, comes from the Anjanabonoina aplite–pegmatite located in central Madagascar. The bulk sample (
Figure 1a) originally showed a dark-brownish color and an elongated prismatic morphology deeply striated parallel to the
c axis, with a basal section with a size of about 3.5 cm in length and 1.4 cm in diameter. From this raw sample, one basal thin section was cut and polished to perform a multi-analytical investigation. The basal slice shows the color zoning typical of the watermelon variety, consisting of a triangular core with a brownish yellowish color, an intermediate pink zone and a green rim (
Figure 1b).
2.1. Occurrence
The Anjanabonoina pegmatite (55 km west-southwest of the city of Antsirabe, central Madagascar) is one of the most important sources of multicolor and giant crystal tourmalines. These pegmatites were emplaced 490 million years ago during late-stage granitic plutonism related to the Pan-African event, which occurred from 570 to 455 million years ago [
20]. The host rocks consist of quartzites, schists and marbles (Itremo group,
Figure 2) locally tourmalinized near the pegmatites [
21]. The Anjanabonoina pegmatite shows the characteristics of both lithium–cesium–tantalum (LCT) and niobium–yttrium–fluorine (NYF) pegmatite families according to pegmatite classification by Simmons [
21]; these hybrid pegmatites are very rich in rare elements which contributes to the crystals’ formation in mialoritic cavities known as pockets. Gem-bearing pockets usually represent the ultimate concentrations of exotic elements, volatiles and other fluxes present in pegmatites.
During the final stage of solidification, the fluid pressure inside this pocket may cause rupture, and other elements can be introduced from the outside (for example, Ca or Fe), which contributes to donating polychrome endings to this variety of tourmaline [
21].
2.2. Experimental Methods
In the present study, a Malagasy tourmaline of the watermelon variety has been studied using a multi-analytical approach: optical microscopy, scanning electron microscopy (SEM) ((Zeiss, Oberkochen, Germany), electron microprobe Cameca, Los Angeles, CA, USA), micro-laser induced breakdown spectroscopy (μ-LIBS) (Marwan, Pisa, Italy) and single-crystal structure refinement (SREF) (Billerica, MA, USA).
Optical observations were made using a Carl Zeiss Axioskop 40 Pol polarizing microscope at the Department of Earth and Geo-environmental Sciences, University of Bari “Aldo Moro”.
The SEM microscope used was a Zeiss LEO, model EVO-50XVP, housed at the Department of Earth and Geo-environmental Sciences, University of Bari “Aldo Moro”, coupled with an X-max (80 mm2) energy dispersive (ED) silicon drift Oxford detector (Oxford Instruments, Oxford, UK) equipped with a Super Atmosphere Thin Window. The accuracy of the analytical data was also checked using several standard minerals manufactured by Micro-Analysis Consultants Ltd. (St. Ives, UK). After a preliminary chemical analysis with SEM-EDS (Zeiss, Oberkochen, Germany), high-resolution images were also acquired under variable pressure (Variable Pressure Scanning Electron Microscopy (VPSEM)) to obtain cathodoluminescence effects.
EMPA data were obtained in wavelength dispersive spectrometry mode (WDS) with a Cameca SX50 instrument available at the Istituto di Geologia Ambientale e Geoingegneria (Rome, Italy), CNR, operating at an accelerating potential of 15 kV and a sample current of 15 nA, with a 10 µm beam diameter. The following minerals and synthetic compounds were used as standards: wollastonite (Si, Ca), magnetite (Fe), rutile (Ti), corundum (Al), vanadinite (V), fluorphlogopite (F), periclase (Mg), jadeite (Na), K-feldspar (K), rhodonite (Mn), sphalerite (Zn) and metallic Cr and Cu. The counting time was 20 s for all elements. The PAP correction procedure for quantitative electron probe micro analysis was applied [
24].The relative error of the data was ≤5% and the detection limits were ≤0.03%. The polished slice was investigated performing three traverses: 60 analysis points for the rim (one step point every 12 µm), 12 analysis points for the pink rim zone (one point analysis every 260 µm) and 10 analysis points for the core (one analysis point every 295 µm), which did not show any pronounced oscillatory zoning.
The LIBS method was used to perform traverses on the sample’s surface with an average of five shots for each point in the four selected zones. LIBS was applied using a double pulse Q-switched (Nd-YAG, λ = 1064 nm) laser with a 1 μs delay between the two pulses with an energy of 20 mJ per pulse at the Department of Earth and Geo-environmental Sciences, University of Bari “Aldo Moro”. The small spot size (7–10 μm) was obtained using a petrographic optical microscope (objective lens 10 × NA 0.25 WD 14.75 mm). The LIBS spectra were acquired by an AvaSpec Fiber Optic Spectrometer (390–900 nm with 0.3 nm resolution) with a delay of 3.28 μs after the second pulse and an integration time of 1 ms. The quantitative data were calculated from linear regression using the main lithium emission line intensity (670.706 nm). The calibration was performed using two standard glasses, NIST610 and FLX-SLAG1, with a Li
2O content, respectively, of 0.105% and 5.0% and a Tsilaisite sample (NaMn
2+3Al
6(Si
6O
18) (BO
3)
3(OH)
3(OH)) from Bosi et al. [
25] with a Li
2O content of 2.04%, quantified by secondary ion mass spectrometry (SIMS).
Single-crystal structure refinement was performed on four fragments extracted from each of the colored zones of the bulk sample. The fragments were mounted on a glass fiber for X-ray diffraction acquisition. X-ray intensity data were collected with a Bruker KAPPA APEX-II single-crystal diffractometer (Sapienza University of Rome, Earth Science Department) equipped with a charge-coupled device (CCD) area detector and a graphite crystal monochromator using a MoKα X-ray source (0.70930 Ǻ). Crystal structure refinement was performed in SHELXL-2013 software [
26]. All structures were refined in the space group
R3m.
3. Results
Optical observations of the basal slice (perpendicular to the
c axis) show four main pronounced color zones from the rim to the core: a dark green rim (M1RVS); a pale green rim (M1RVC); a pale pink rim (M1CR); and a brownish yellow triangular core (M1CG) (
Figure 3). The light yellow zone that surrounds the brownish yellow core indicates the transition between the (M1RVS), (M1RVC) and (M1CR) zones that perpendicularly cross the prismatic growth bands and the (M1CG) core zone that cuts the side of the inner pyramidal growth sectors of the slice.
3.1. Chemical Analyses
To deeply investigate the optically observed color zoning, comparisons were made between optical and high-resolution images acquired at a high depth of field with Variable Pressure Scanning Electron Microscopy (VPSEM) (
Figure 4). This correlation shows that the slice is characterized by a succession of narrow tiny layers highlighted by cathodoluminescence and this sequence also characterizes the optically homogeneous pink region.
To investigate the chemical compositional variations, three EPMA traverses were performed (
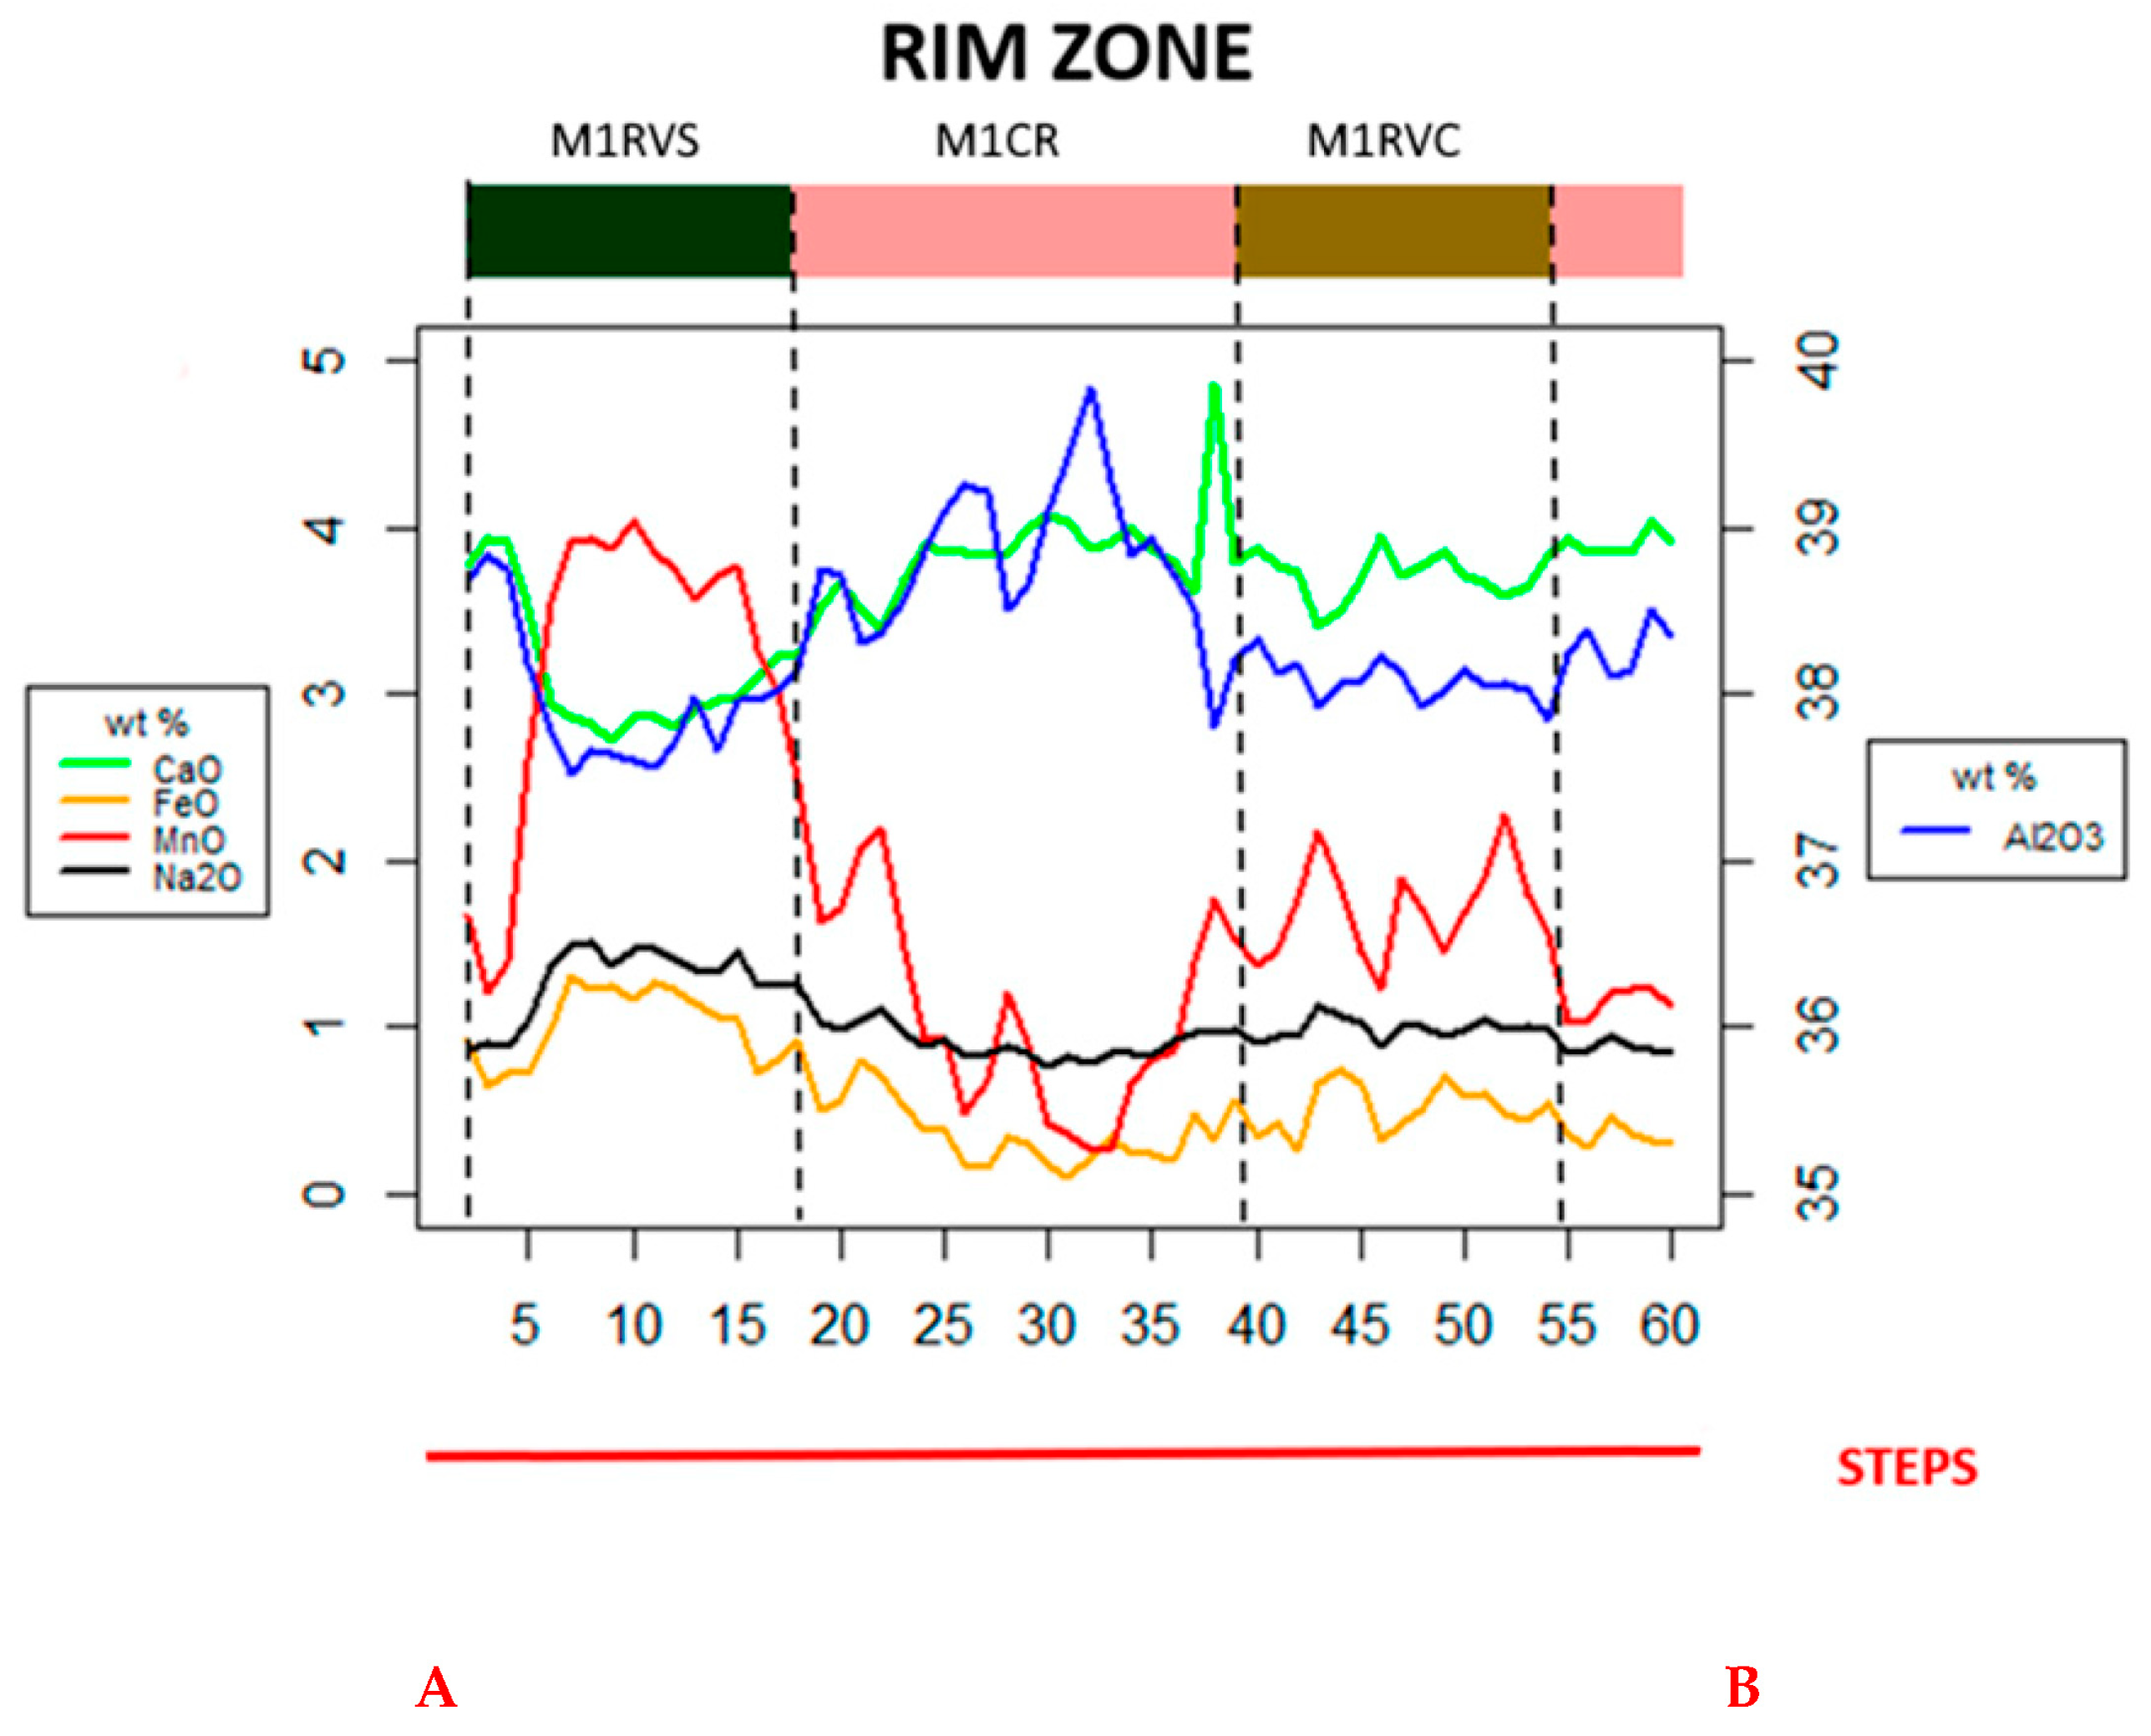
Figure 3): a first traverse investigating the outer rim zone (A-B) (
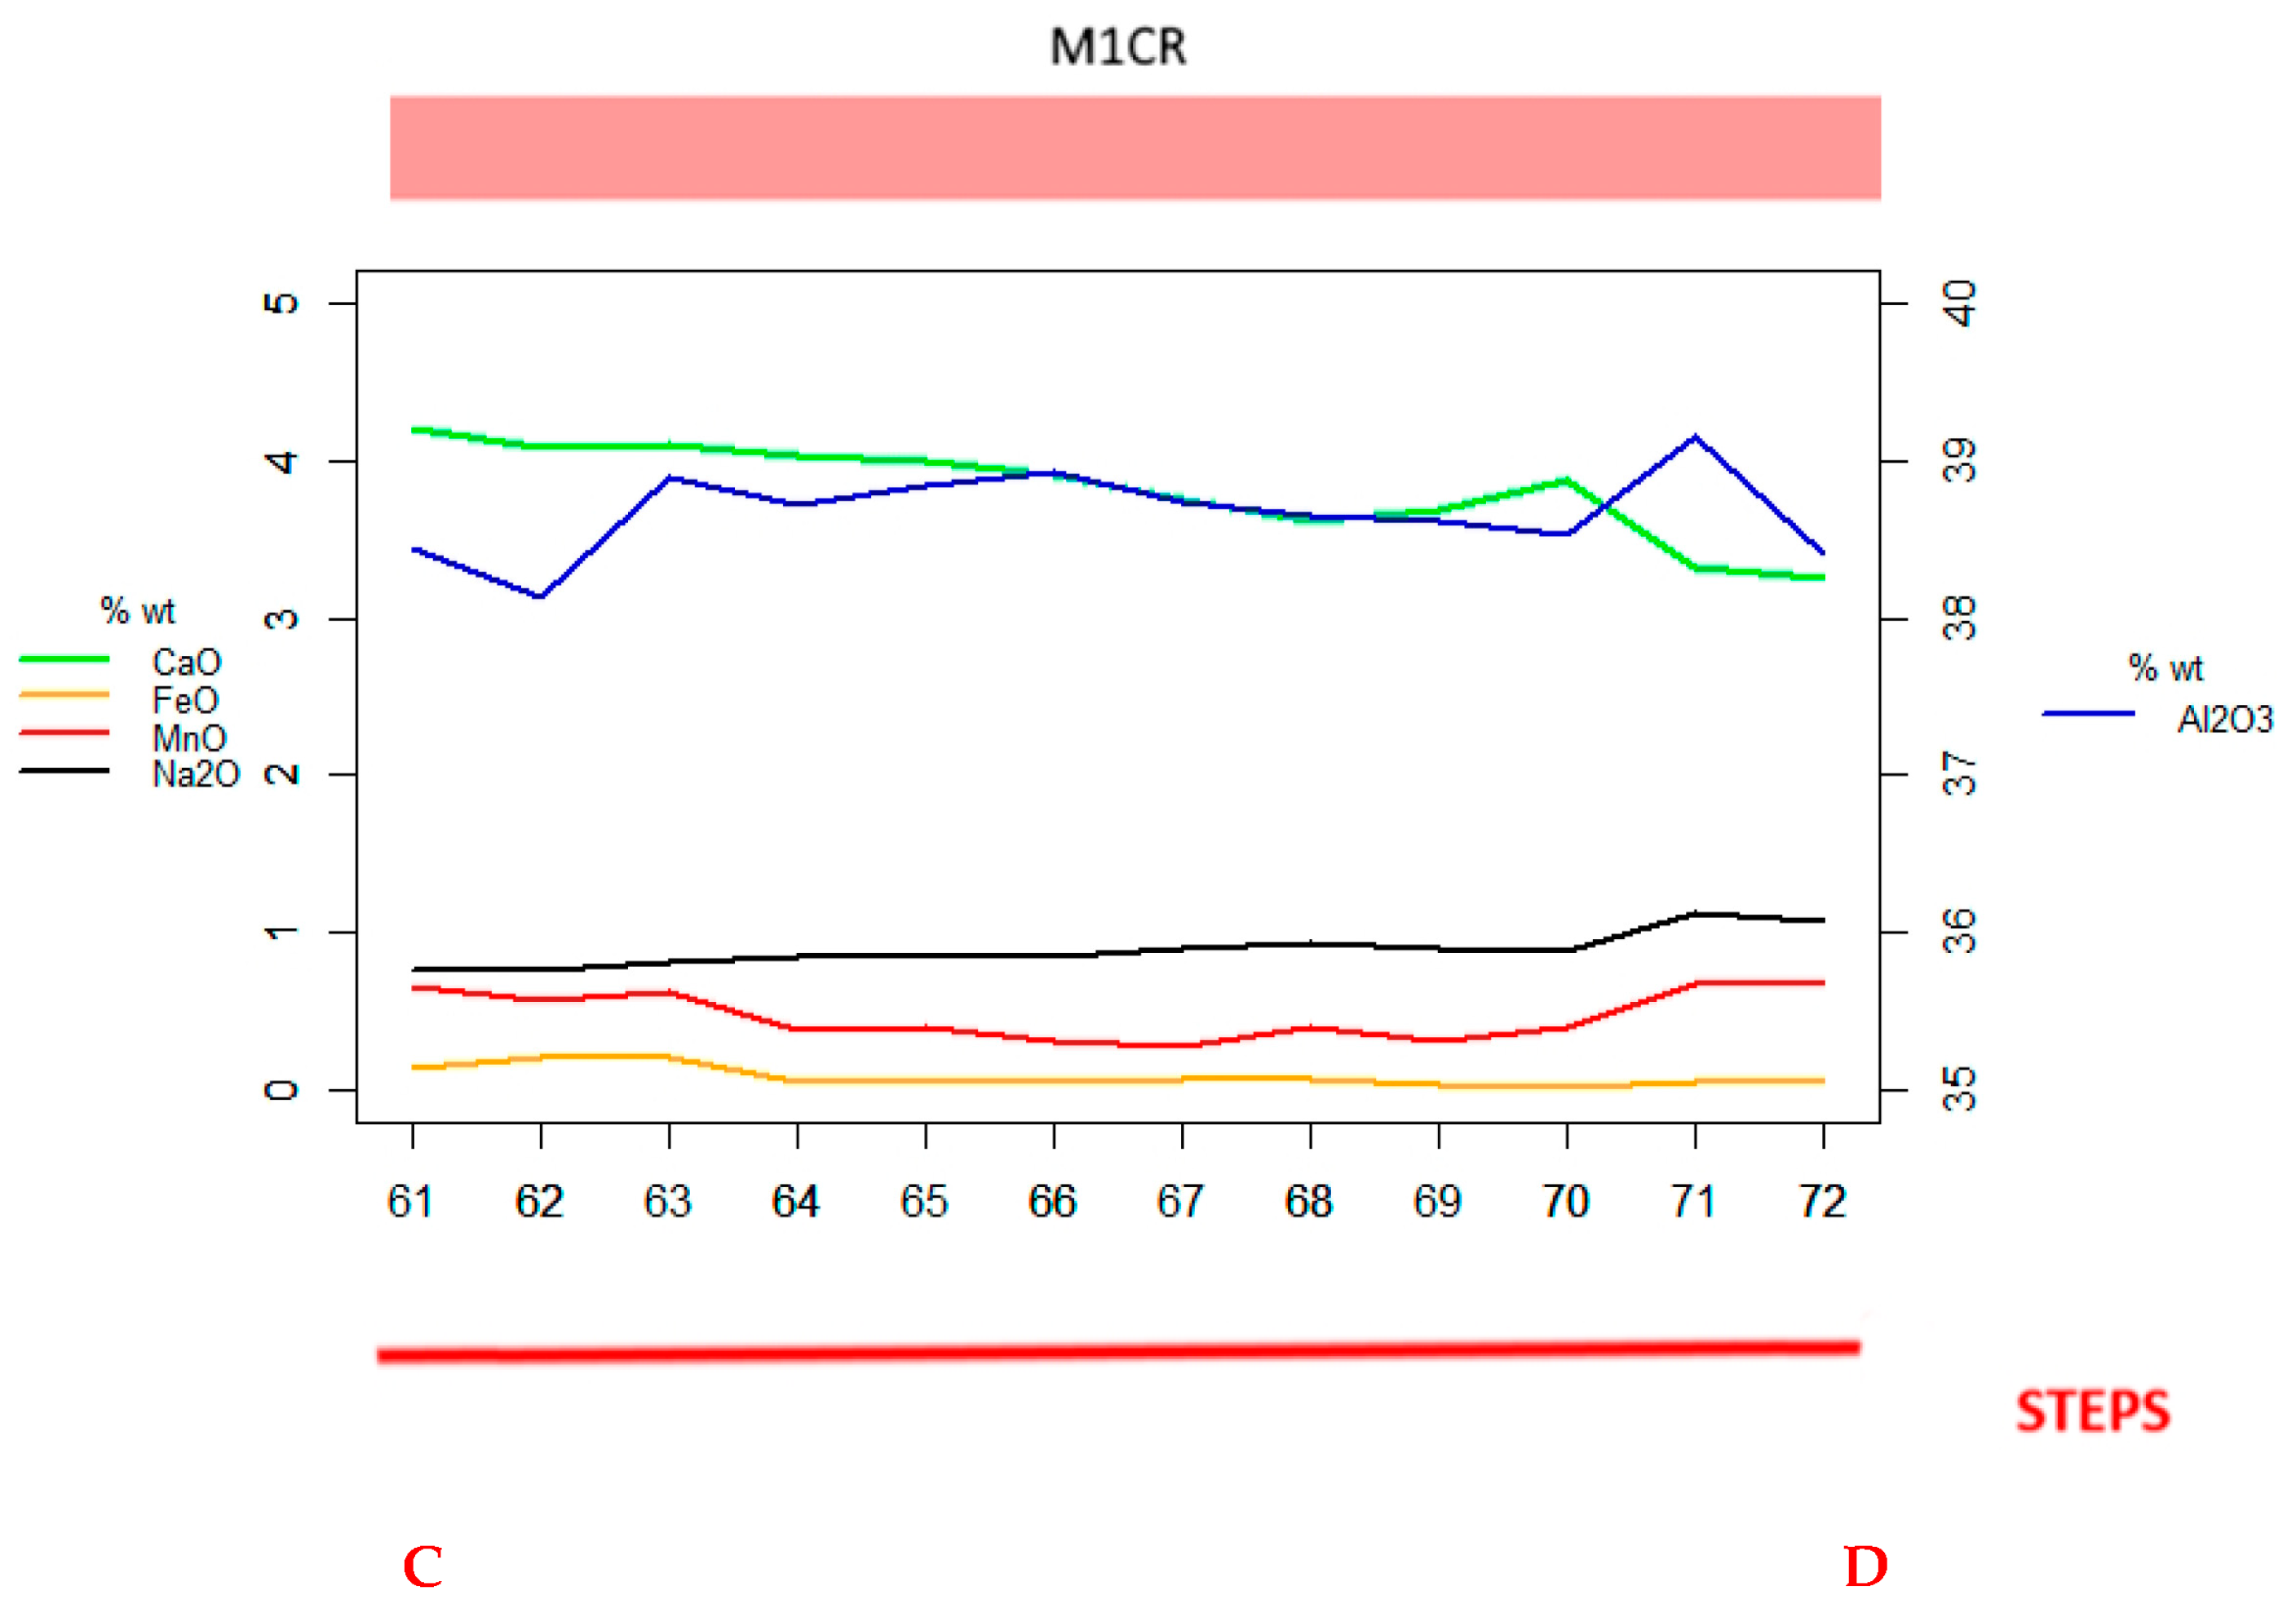
Figure 5), a second traverse was carried out on the pink rim zone (C-D) (
Figure 6) and a third traverse was performed on the core zone (E-F) (
Figure 7).
The A-B traverse of outer rim was performed for a total length of 724 µm, with 60 analysis points and a step size of 12 µm to fully characterize the entire zone.
The A-B traverse of the outer zones (M1RVS, M1RVC and M1CR) exhibits an important oscillatory zoning; the dark green rim shows a high content of MnO (up to 4.03 wt %) that at the interface with the pink zone decreases (to 0.25 wt %) then slightly increases in the pale green rim (to 2.28 wt %) (
Figure 5). MnO shows a negative correlation with Al
2O
3 and CaO and a positive correlation with Na
2O and FeO. The three rim zones show different FeO content, with the dark green outer rim characterized by a higher amount of FeO (maximum value 1.27 wt %). In the pink rim zone, the FeO content decreases (to 0.10 wt %) and slightly increases in the pale green rim (up to 0.74 wt %).
The different content of FeO in the M1RVS, M1CR and M1RVC zones, along with the MnO content, is responsible for the different colors of these zones. The rim is rich in CaO, especially in the pink rim (maximum value 4.07 wt %) and pale green rim zone (maximum value 3.95 wt %). It decreases slightly in the outer dark green rim zone (2.71 wt %), showing a negative correlation with Na2O. The fluorine content is almost constant across the entire sample (about 1.20 wt %) and TiO2 is present in very small amounts in this rim zone (about 0.26 wt %).
The C-D traverse of the pink rim zone (M1CR) exhibits an almost constant trend of the main elements. MnO is present throughout this zone with a slight decrease in the central part of the traverse (minimum value 0.28 wt %) and an increase towards the core (up to 0.69 wt %). A similar trend is observed for Na2O, which tends to increase towards the central zone (from 0.77 wt % to 1.07 wt %), while CaO tends to decrease (from 4.20 wt % to 3.25 wt %). Al2O3 shows some higher values (up to 39.26 wt %), possibly due to spot analyses of inclusions present in the sample. In this zone, the FeO quantity is slightly higher in the outer areas and decreases towards the yellow core (from 0.14 wt % to 0.07 wt %). TiO2 is present in small amounts (about 0.06 wt %) in this pink rim zone. Note that the chemical variations observed in this zone do not correspond to the thin layers observed in VPSEM images. On the other hand, the pink color of this region is almost homogeneous and, consequently, the tiny layers could be due to thin growth bands associated with very little compositional variations of elements under the detection limits of WDS analyses.
The traverse E-F from the pink rim zone to the core zone clearly shows a dramatic variation in the main elements. The light yellow transition zone exhibits a high increase in MnO content (up to 6.42 wt %) and a decrease in Al2O3 (to 37.16 wt %). At the interface between the transition zone and the brownish yellow core, it is also observed that the CaO content decreases (to 1.70 wt %), while the Na2O quantity increases (up to 2.00 wt %). The core zone has the highest amount of TiO2 (about 0.27 wt %); even though it is very small content, it seems to be sufficient to give a brownish coloration with a constant quantity of FeO (about 0.03 wt %) along this traverse.
EPMA traverses performed on the slice were integrated with LIBS traverses to detect the Li2O content in each zone.
The calibration line obtained by LIBS (
Figure 8) plotting the counts of the Li emission line at 670.7 nm acquired from the standard materials versus the Li
2O wt % shows an excellent fitting (
r2 = 0.94). Thus, the quantification of Li
2O was obtained using the equation Li
2O% = 0.0004x − 3.0543, where x represents the average of the Li emission line counts at 670.7 nm measured from the sample.
The chemical composition of each of the four zones, calculated by an average of different points for each zone (
Table 1) using LIBS and EPMA is reported in
Table 1.
3.2. Crystal Structure Refinement
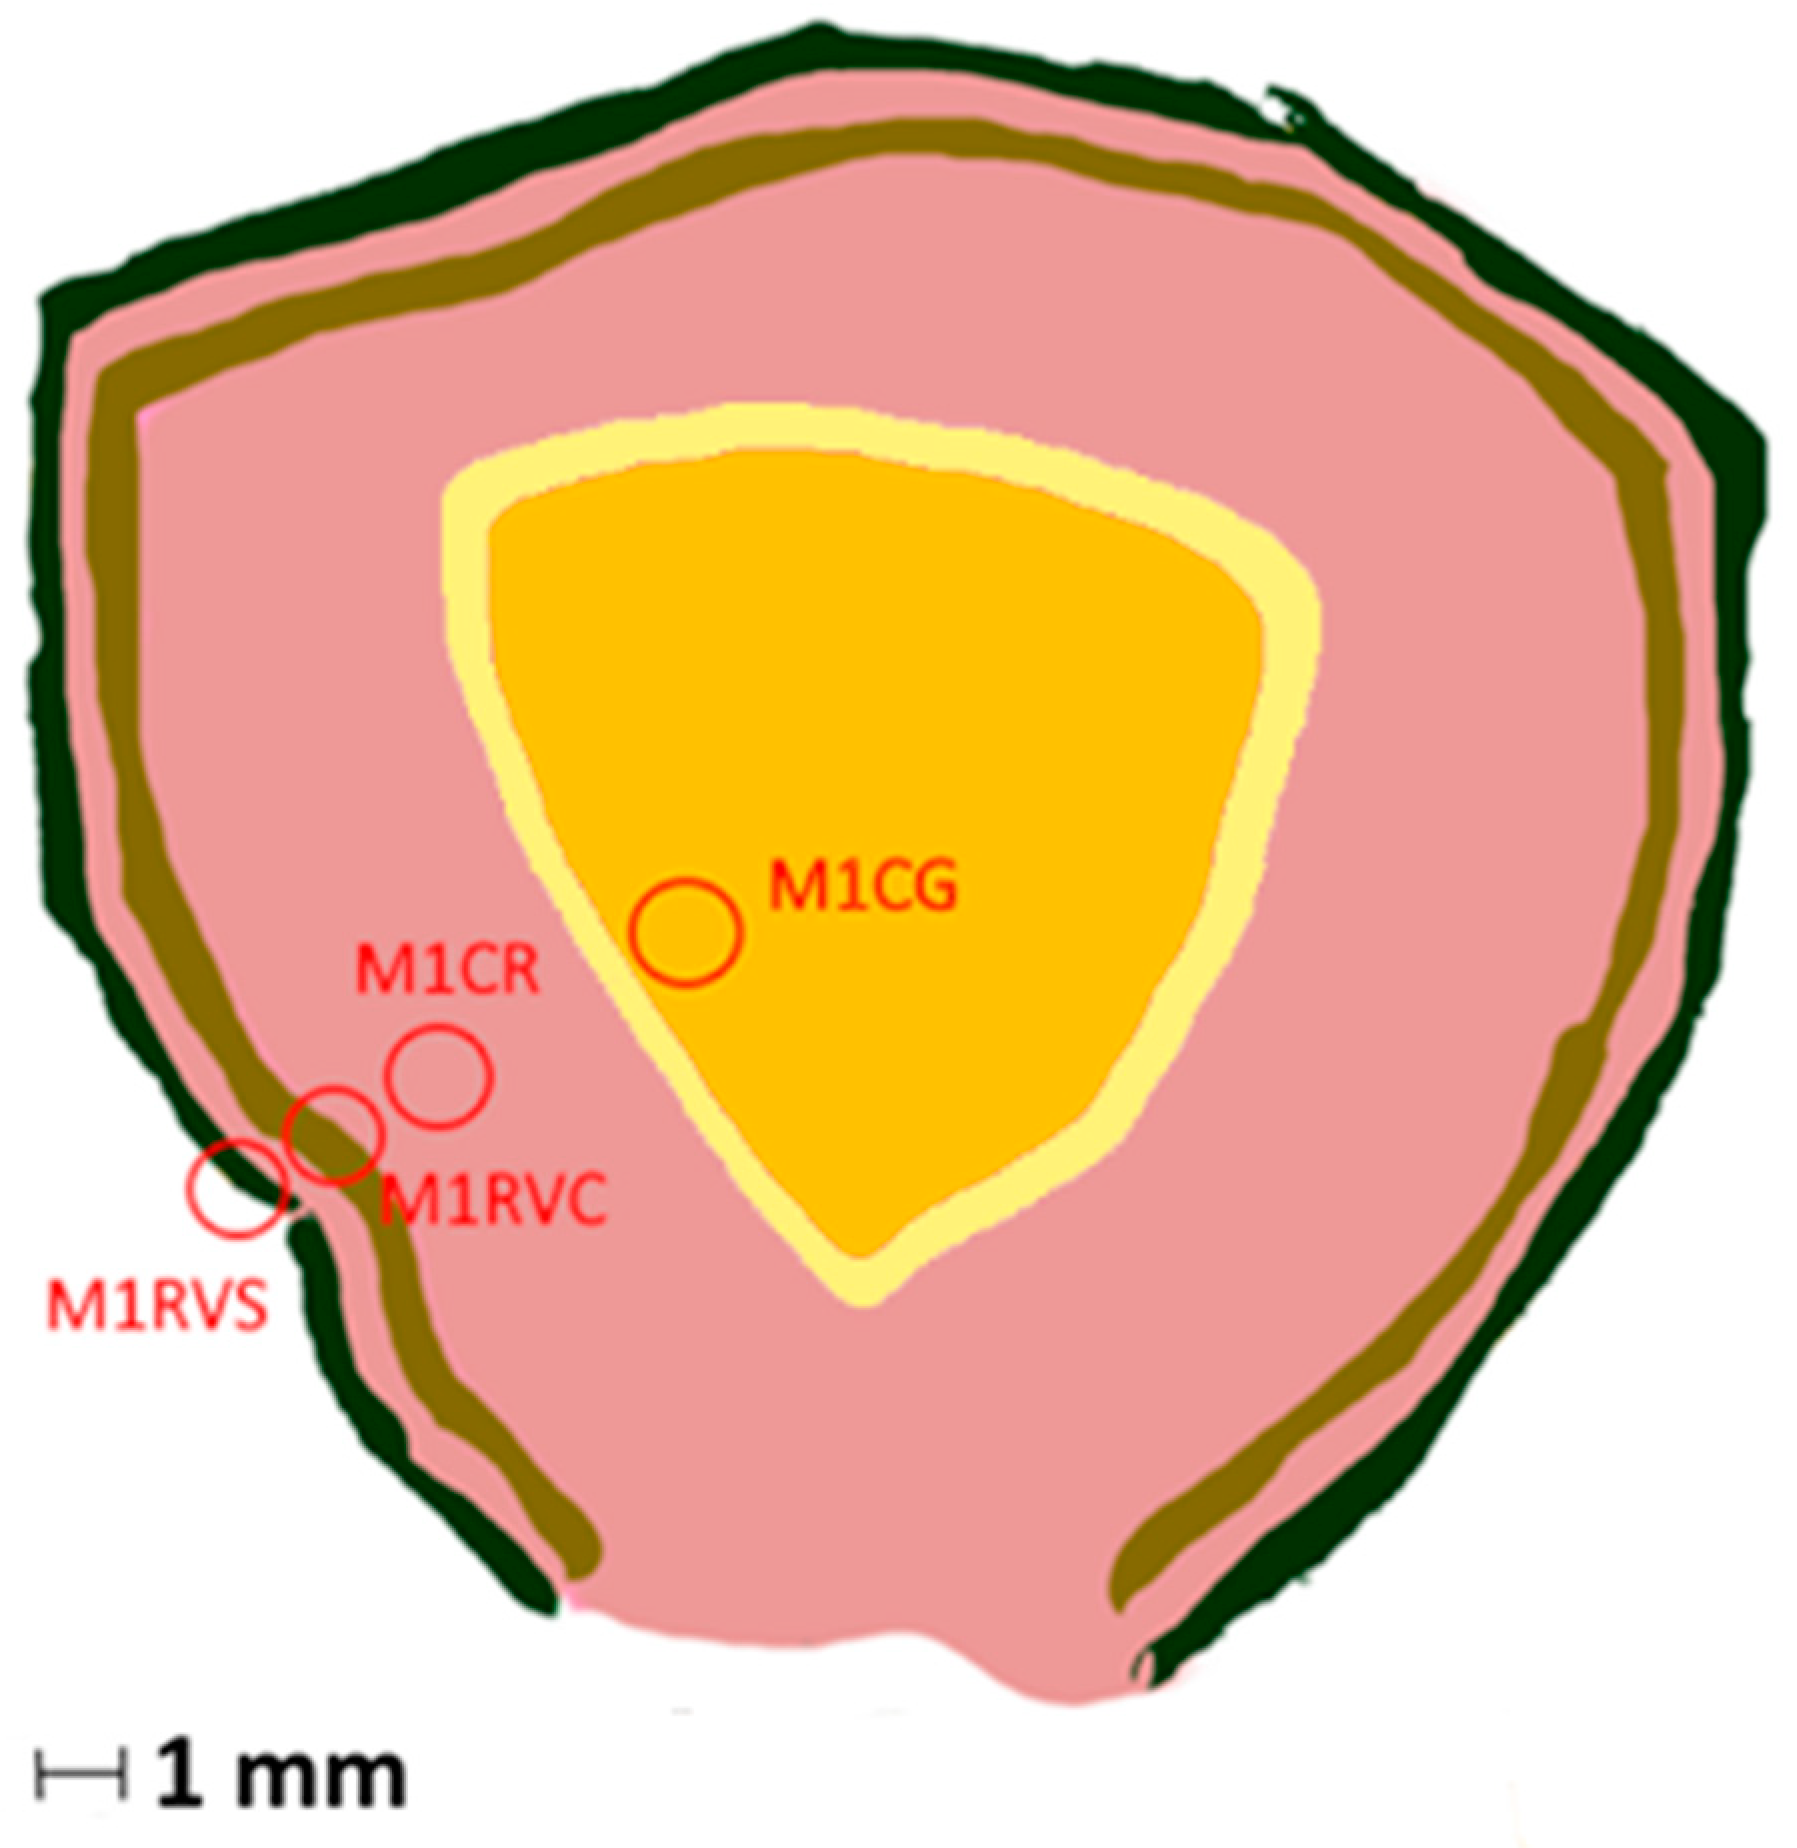
Four fragments were extracted for SREF analysis from the four homogeneous zones (
Figure 9).
Structural refinements were performed with the SHELXL-2013 program [
26]. The starting coordinates were taken from Bosi et al. [
27]. The variable parameters were scale factor, extinction coefficient, atom coordinates, site scattering values and atom displacement factors. In detail, the
X site was modeled by considering the presence of Na and Ca scattering factors and the
Y site was modeled considering Li and Mn. The
Z,
T,
B and anion sites were modeled, respectively, with Al, Si, B and O scattering factors and with a fixed occupancy of 1, because refinement with unconstrained occupancies showed no significant deviations from this value. The position of the H atom bonded to the oxygen at the O3 site in the structure was taken from the Fourier difference map and incorporated into the refinement model; the O3–H3 bond length was restrained (by DFIX command) to be 0.97 Å with the isotropic displacement parameter constrained to be equal to 1.2 times that obtained for the O3 site. Three full matrix refinement cycles with isotropic displacement parameters for all atoms were followed by anisotropic cycles until convergence was attained.
Table 2 lists crystal data, data collection information and refinement details. Structural data such as fractional atom coordinates and bond lengths are available as CIFs (
Supplementary materials).
It can be observed from the crystal data (
Table 2) obtained by refinement and the chemical data (
Table 1) that a and c unit cell parameters are positively correlated (
r2 = 0.997). This correlation results in an increase in the unit cell volume due to increased Mn + Fe content, i.e., cations in octahedral coordinations of larger sizes (
Figure 10).
3.3. Site Populations
In agreement with the structural refinement results, the boron content was assumed to be stoichiometric (B
3+ = 3.00 apfu). Both the site scattering results and the bond lengths of B and T are consistent with the B sites being fully occupied by boron and no amount of B
3+ at the
T site [
11], e.g., the mean bond length <
T-O> varies between 1.618 and 1.620 Å. Lithium was determined by μ-LIBS. The Fe and Mn oxidation state was assumed as +2 in accordance with the structural information. The OH content and the atoms per formula unit (apfu) were then calculated by charge balance with the assumption that (T + Y + Z) = 15 apfu and 31 anions.
Following the standard site preference suggested for tourmaline [
11], the resulting empirical formulae for each of the four zones are as follows:
Dark green rim zone (M1RVS):
X(Ca0.50Na0.41▯0.09)Σ1.00 Y(Li1.39Al1.00Mn0.47Fe0.13Ti0.02)Σ3.00 ZAl6 [T(Si5.99Al0.01)Σ6.00O18] (BO3)3 V(OH)3 W[F0.59(OH)0.35O0.06]Σ1.00
Pale green rim zone (M1RVC):
X(Ca0.64Na0.30▯0.06)Σ1.00 Y(Li1.64Al1.04Mn0.22Fe0.06Ti0.02)Σ2.98 ZAl6(TSi6.02O18)(BO3)3 V(OH)3W[F0.59(OH)0.35O0.06]Σ1.00
Pale pink rim zone (M1CR):
X(Ca 0.52Na0.35▯0.13)Σ1.00 Y(Li1.65Al1.19Mn0.15Ti0.01)Σ3.00 ZAl6 [T(Si5.98Al0.02)Σ6.00O18] (BO3)3 V(OH)3 W[F0.59(OH)0.48]Σ1.07
Brownish yellow core zone (M1CG):
X(Na0.59Ca0.31▯0.10)Σ1.00 Y(Al1.16Li0.93Mn0.87Ti0.03Fe2+0.01)Σ3.00 ZAl6 [T(Si5.99Al0.01)Σ6.00O18] (BO3)3 V[(OH)2.92O0.08]Σ3.00 W(F0.60O0.40)Σ1.00
Note that the occurrence of solely Al in the
Z sites is also supported by <Z-O> distances (1.905–1.907 Å), typical of <
ZAl-O> in tourmaline [
11].
4. Discussion
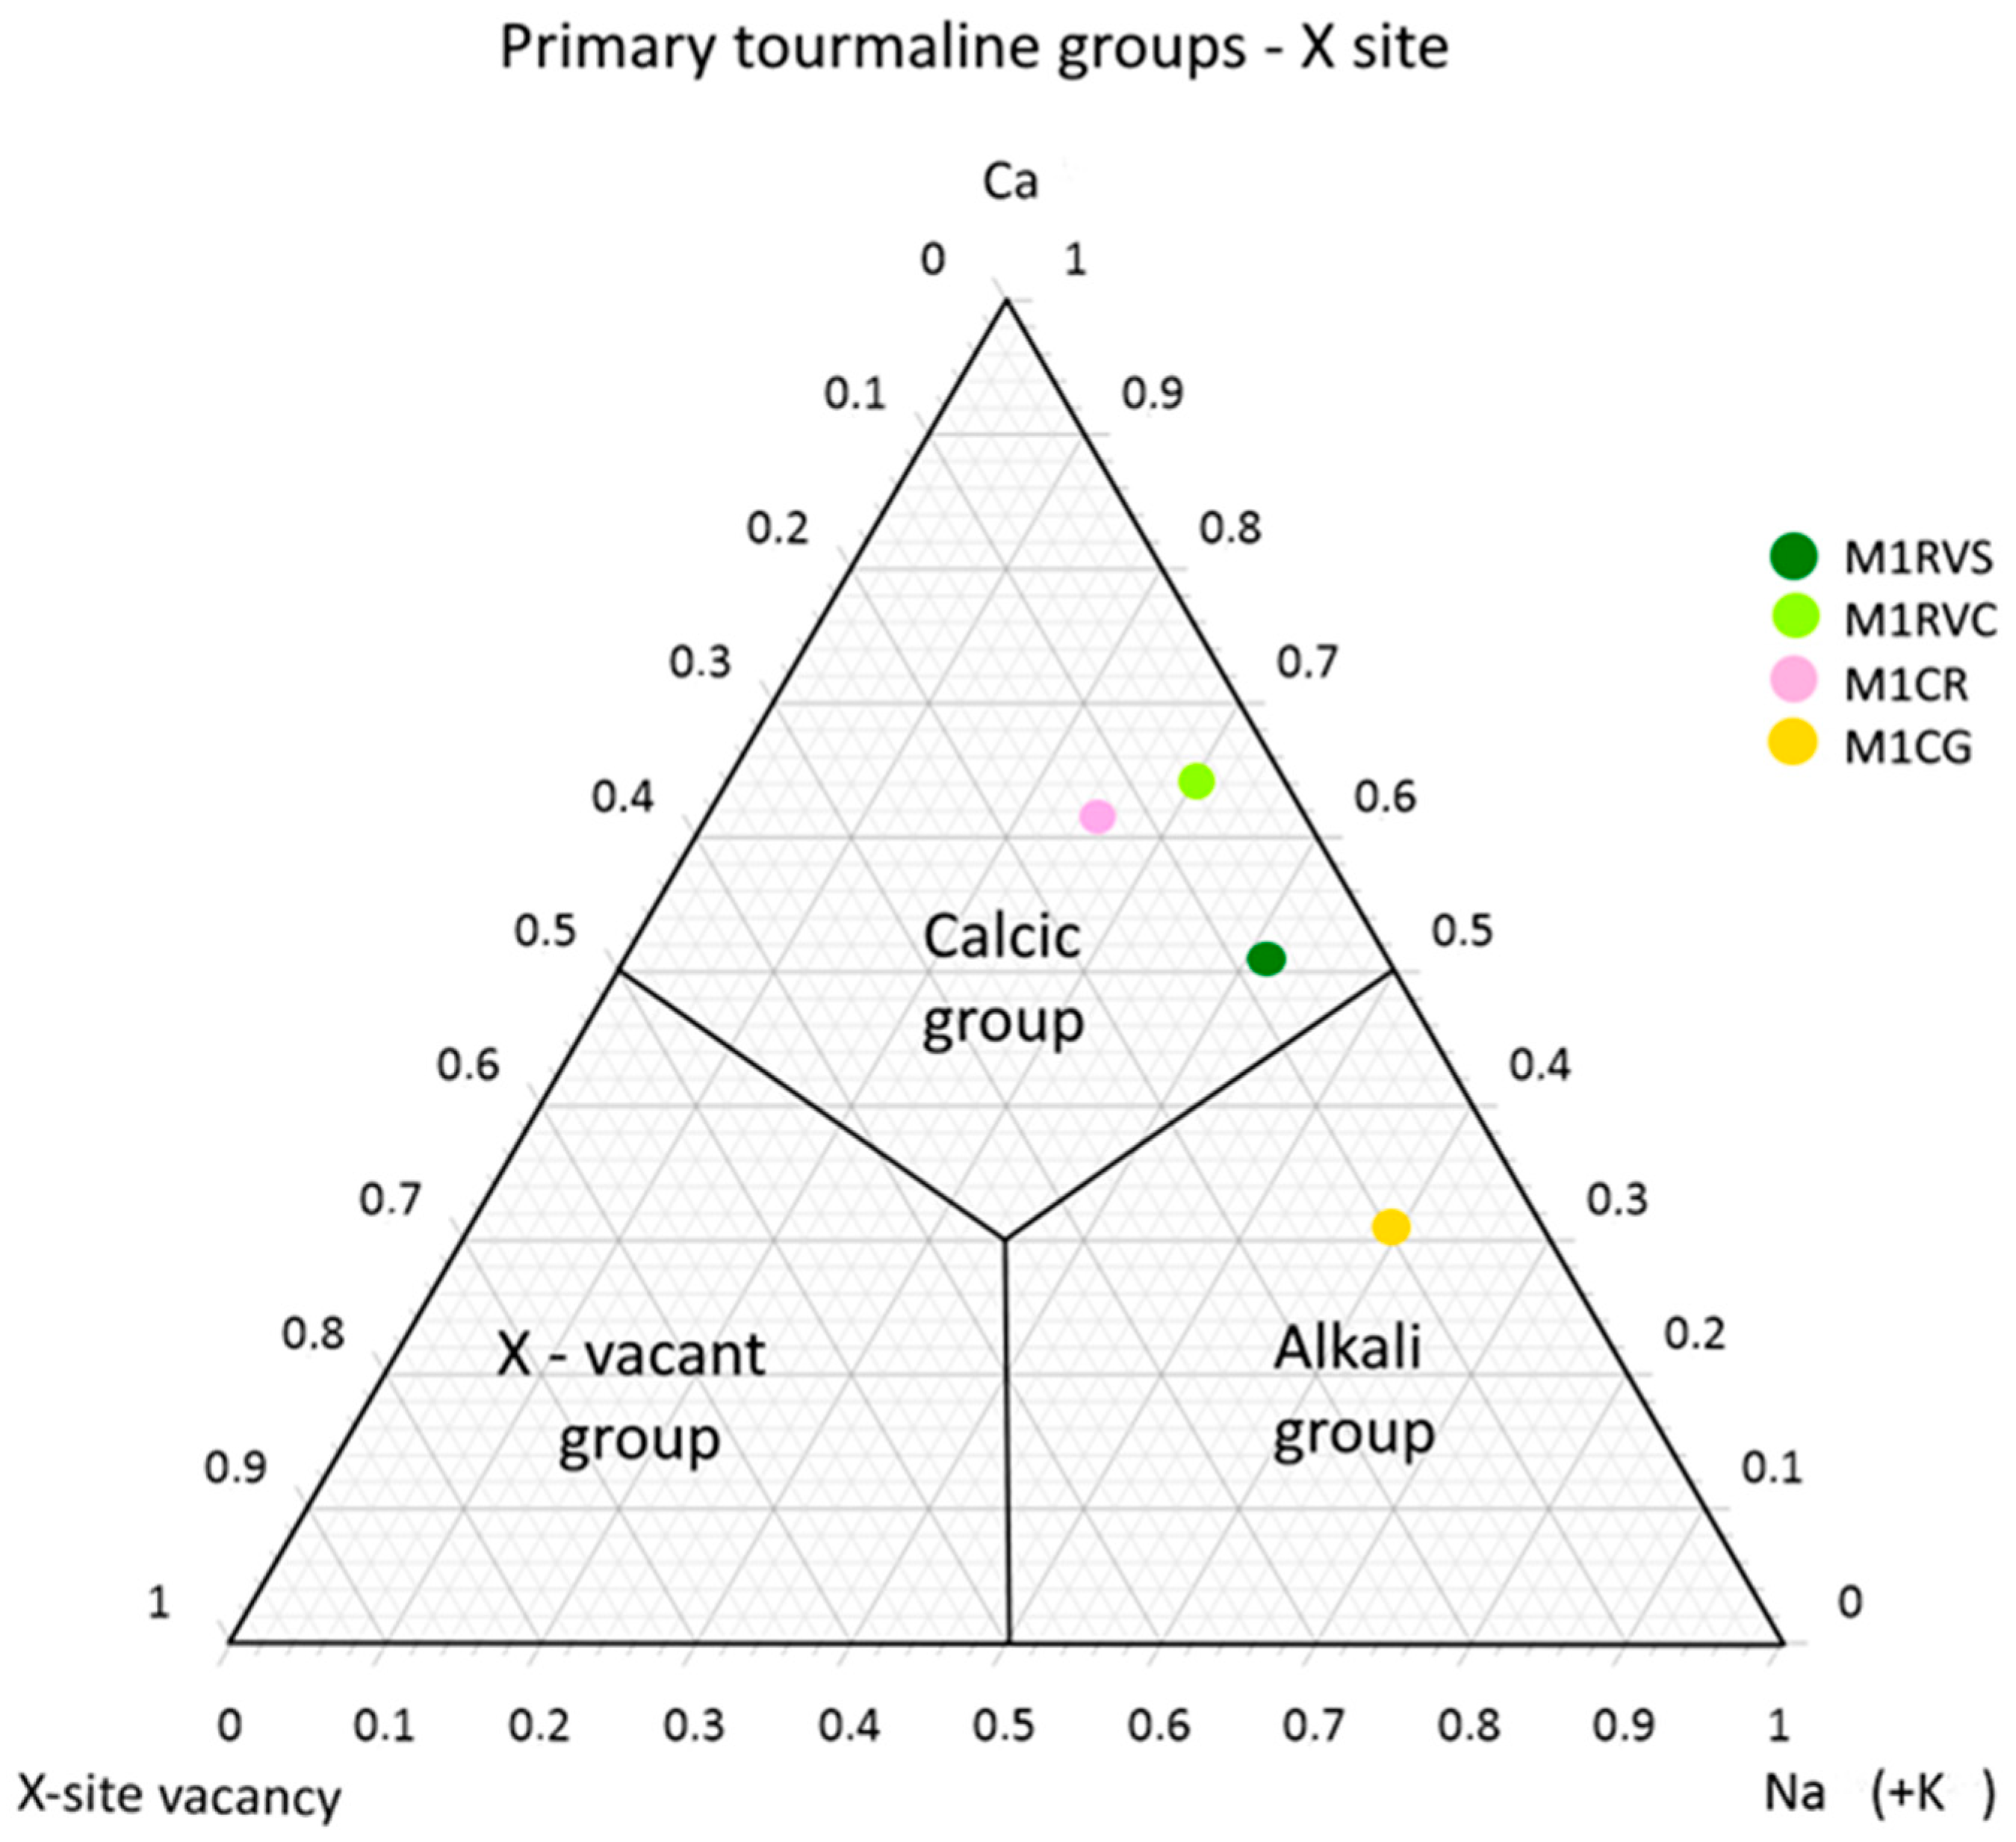
The detailed structural and chemical analyses performed on the MADAG1 slice allow us to characterize the optically observed color zoning and show a coexistence of two tourmaline species in the same crystal. The composition of the triangular brownish yellow core (M1CG) is characterized by predominantly
XNa >
XCa (
Figure 11),
WF >
WO and (Li + Al) at the Y position in the general tourmaline formula, corresponding to a Mn-rich fluor-elbaite, ideally Na(Li
1.5Al
1.5)Al
6(Si
6O
18)(BO
3)
3(OH)
3F [
11].
The outer zones (M1RVS, M1RVC and M1CR) are predominantly
XCa >
XNa (
Figure 8),
WF >
WO and
Y(Li + Al), corresponding to Mn-rich fluor-liddicoatite, Ca(Li
2Al)Al
6(Si
6O
18)(BO
3)
3(OH)
3F [
11].
For the studied samples, the compositional variation may be explained by the substitution XNa + 3Y(Mn2+ + Fe2+) ⇿ XCa + 2YLi + YAl. The plot of (Na + Mn + Fe) vs. (Ca + Li + Al) shows a negative correlation (r2 = 0.995) described by the equation: (Na + Mn + Fe) = 3.9 − (Ca + Li + Al).
According to Henry and Dutrow [
28], tourmaline composition and zoning are generally a result of external influences (temperature, pressure, mineral local assemblages and fluid composition) and internal factors (crystallographic constraints).
The sharp oscillatory zoning observed in the liddicoatitic zone reflects fluctuating external conditions, as well as temperature, recorded as oscillatory compositional variations in adjacent growth stages during the crystallization.
The chemical/color zoning observed in our sample of tourmaline from Anjanabonoina provides useful information about the evolution of the growth environment. As liddicoatitic-elbaitic crystals are the final tourmaline to form, following the crystallization of Ca-bearing schorl and Mn-rich elbaite, they represent geochemically the most evolved tourmaline in the pegmatites [
21]. The color zoning observed in the studied sample reflects specific initial conditions for the formation of Mn-rich yellow tourmalines, including a high concentration of Mn, B and Ti in appropriate proportions as suggested by Simmons et al. [
29]. Additionally, the studied sample shows that throughout the rim, the chemical composition is totally different from that of the core, especially for the significant enrichment of Ca observed in the outer zones. This growth stage can be related to the final stage of solidification of pegmatite, when the fluid pressure inside the pocket causes rupture, promoting access to external fluids. The host rock of the Itremo group (1.1) adjacent to the hybrid Anjanabonoina pegmatite is interested by hydrothermal alteration, so the Ca necessary to form fluor-liddicoatite comes from the host rocks of this group which contain a unit consisting of marble [
30]. The presence of these two coexisting species (fluor-liddicoatite and fluor-elbaite) in the same single crystal proves a melt contamination of this fluid derived from the metasediments of the Itremo group. During the ultimate phase of solidification, the fluid pressure in this cavity could induce rupture, enabling the influx of other elements (such as Ca or Fe) from external sources. These elements donate polychromatic terminations in this particular variety of tourmaline [
22].
This conclusion agrees with Lussier et al. [
31] who studied an oscillatory zoned liddicoatite tourmaline from Anjanabonoina pegmatite with chemical variation due to more than one input of external fluid contamination. Tindle et al. [
32] also explained that the presence of Ca and Fe in the late stage is as a result of low temperature hydrothermal fluids that have reacted with host rocks rich in Ca and ferromagnesian minerals. Tourmaline crystals with a fluor-liddicoatite–fluor-elbaite composition with no potential secondary source of Ca have also been studied by several authors who proposed that Ca can remain in the melt until late fractionation processes [
33,
34].
All this evidence leads to the conclusion that each step of the growth of the studied watermelon Malagasy tourmaline is deeply correlated with the change in the geological environment, making this sample a brilliant example of the ability of tourmaline to record petrogenetic information of the crystallizing melt.


