Article

A Computationally Efficient Multiscale, Multi-Phase Modeling Approach Based on CPFEM to Assess the Effect of Second Phase Particles on Mechanical Properties

by
Amir Asgharzadeh
1,
Taejoon Park
1,
Sobhan Nazari Tiji
1 and
Farhang Pourboghrat
1,2,*
1
Department of Integrated Systems Engineering, The Ohio State University, 210 Baker Systems, 1971 Neil Avenue, Columbus, OH 43210, USA
2
Department of Mechanical and Aerospace Engineering, The Ohio State University, 201 W 19th Ave., Columbus, OH 43210, USA
*
Author to whom correspondence should be addressed.
Crystals 2023, 13(8), 1199; https://doi.org/10.3390/cryst13081199
Submission received: 9 July 2023 / Revised: 25 July 2023 / Accepted: 26 July 2023 / Published: 2 August 2023

Abstract

:
Crystal plasticity finite element (CPFEM) modeling of metals that can be age hardened consisting of second phase particles is extensively performed based on representative volume element (RVE) models. The RVE model is generated for ferritic low-carbon steel using the data obtained from microstructural observation through optical microscopy (OM) and electron backscatter diffraction (EBSD). The generated RVE is required to statistically represent the original material in terms of grain topology and texture in microscale, as well as the configuration of second phase particles in submicron scale. The multiscale, multi-phase nature of the generated RVE leads to a computationally expensive modeling procedure. To overcome this issue, an alternative multiscale modeling approach based on a homogenization scheme is proposed, in which the effect of second phase particles on deformation behavior is accounted for with no need for the explicit presence of particles in RVE. Lastly, a thorough parametric analysis is performed to investigate the sensitivity of the mechanical properties to the second phase particles in terms of size, volume fraction, geometrical distribution, and deformable or non-deformable properties of precipitates in the investigated material. The results show that the proposed multiscale modeling approach successfully accounts for the effect of second phase particles on deformation behavior, while the computational cost is reduced by more than 99%. In addition, the simulations show that the configuration of second phase particles at a microscale plays an important role in defining the mechanical behavior of the material.

1. Introduction

Metallic materials that can be age hardened possess superior mechanical properties when compared to alloys that cannot be age hardened [1]. The superior performance is related to the microstructures that consist of secondary phases of precipitates distributed over the primary phase matrix. One of these materials is carbon steels, which have been used extensively in various industries, and thus attracted widespread attention in the scientific community. Carbon steels derive their strength through the formation of iron-carbon compounds [2]. The macroscopic properties of carbon steels are highly dependent on the properties of second phase precipitates as well as their interaction with the matrix phase at lower scales [3,4]. For instance, the size, spacing, volume fraction, geometrical distribution, and mechanical properties of precipitates at the microscale [5], as well as particle interfacial properties, homogeneity of chemical composition, and the lattice misfit strain at the submicron-scale [6,7] could play an important role in defining the properties of the material at the macroscale. Therefore, a careful design of type, size, spacing, and distribution of second phase particles through a precise heat treatment scheme may lead to a wide range of material properties for various applications.
Modern product design procedures mainly rely on the use of simulation tools to optimize and accelerate the design cycle. To that end, advanced computational simulation tools and material models are required to accurately represent the performance of the final products [8]. The desired precision cannot be achieved unless the behavior of second phase particles is carefully considered, even though it is very challenging to characterize and model them [8,9]. Several material models have been proposed to consider the effect of second phase particles on the initial yield strength, anisotropy behavior, and kinematic hardening of the metallic materials [10,11,12,13]. For instance, Tanaka and Mori [10] developed a constitutive model, in which the effect of rigid inclusions on the work hardening behaviors of crystals has been considered. In a study by Barlat and Liu [11], a constitutive material model was formulated to consider the effect of second phase particles on plastic anisotropy and kinematic hardening in a binary Al-Cu containing hard θ՛ particles. In another study, Han et al. [12] developed a material model formulated in the crystal plasticity setting to account for the effect of precipitates with pure elastic behavior on the elastic-plastic deformation behavior of metallic crystals. Furthermore, Bonfoh et al. [13] proposed a micromechanical modeling approach to model the elastic-plastic behavior of a polycrystalline containing non-shearable particles.
In the recent literature, the effect of second phase particles on mechanical behavior has been formulated through CPFEM modeling. For instance, Wang and Jiang [14] adopted CPFEM to model the fatigue failure of 304 stainless steel under cyclic loading conditions, in which the effect of second phase particles was evaluated. Furthermore, Keshavarz and Ghosh [4] developed a multiscale constitutive model to simulate the mechanical behavior of a Ni-based superalloy through CPFEM simulations considering the effects of material characteristics at different scales, including microstructures and second phase particles. Ali et al. [5] assessed the effect of γ՛ precipitate on the mechanical properties of a Ni-based super alloy through performing a CPFEM simulation of hardness experiment, as well as crystal plasticity coupled with the phase-field method for creep experiment. In another study carried out by Li et al. [15], the effect of T1/T2 precipitates in an Al-Li alloy on the mechanical behavior as well as the microstructure and texture evolution has been investigated through a CPFEM simulation of the uniaxial compression test.
In this study, a CPFEM simulation is performed on an RVE model of ferritic low carbon steel consisting of a matrix phase and second phase particles to investigate the effect of precipitates on the deformation behavior of materials that can be age hardened. To that end, a microstructure-based RVE model is generated using the experimental data, including the properties and distribution of precipitates in submicron scale, as well as the grain topology and orientation distribution of grains in a microscale. The multiscale, multi-phase nature of the generated RVE makes the model computationally very expensive. To overcome this issue, a novel computationally efficient multiscale modeling approach based on a homogenization scheme is developed for the calibration of a CP model, through which the explicit presence of second phase particles is no longer necessary in the RVE model. The primary goal of the multiscale modeling approach is to develop a computationally efficient technique that improves the CPFEM simulations in multiple ways: (a) A significant reduction in computational cost, (b) avoiding the non-unique CP model parameters, (c) examination of the macroscopic properties of the material through incorporating the experimentally validated data of precipitates, and (d) accounting for precipitation hardening in a 3D RVE model with several hundred grains. Furthermore, a thorough parametric study was performed to investigate the sensitivity of the mechanical properties to the second phase particles in terms of size, volume fraction, geometrical distribution, and mechanical properties of precipitates on the macroscopic properties.

2. Experimental Procedure

In this study, a low carbon steel tube with an outer diameter of 38 mm and thickness of 1.24 mm was investigated. The as-received tube was solution heat treated at 900 °C for 75 min and then air cooled to obtain a fully ferritic initial microstructure and uniform chemical composition of Fe—0.13 wt.% C—0.3 wt.% Mn—0.02 wt.%P—0.15 wt.% Si—0.3 wt.% S. To assess the mechanical properties of tubes, a uniaxial tensile test was performed based on the E8-E8M-09 ASTM standard [16]. To that end, the dog-bone specimens were cut in a longitudinal direction with a gauge length and width of 32 mm and 6 mm, respectively. In addition, a pair of special grips was fabricated to accommodate for the curvature of the tubular samples during tensile testing. The uniaxial tensile tests were performed with an INSTRON machine with a 3 mm/min grip speed at room temperature. Further details on sample preparation and testing of tubular materials can be found in the authors’ previous publications [17,18]. Throughout the testing, a 3D Trilion Quality Systems GOM ARAMIS Digital Image Correlation (DIC) machine was used to record the displacement field, while a sensor installed on the tensile machine was used to record the force data. Then, the synchronized force and displacement data were utilized to generate engineering strain-stress curves [19].
To observe the microstructure of the investigated tubes, the specimens were cut along both the hoop and longitudinal directions, so that the surface of both cross sections from almost the same location could be accessed. Then, the samples were mounted, polished to up to 0.05 μm roughness, and etched by Nital detergent containing 100 mL ethanol and 5 mL nitric acid to observe the microstructure through Optical Microscopy (OM). The collected OM images were analyzed through the Dream.3D image processing toolbox [20] to obtain the size distribution of precipitates. Moreover, the crystallographic texture and grain topology of the tubes were measured by means of electron backscatter diffraction (EBSD) imaging. To that end, the EBSD measurements were conducted by a ThermoScienticTMApreoLoVac field emission EBSD microscope equipped with an EDAX Hikari XP camera. The raw EBSD data were analyzed by means of MATLAB toolbox MTEX [21] to obtain diverse microstructural data, including distribution of grain aspect ratio, grain size distribution, and the crystallographic orientation. To obtain the grain structure, a misorientation angle threshold of 15° was adopted to reveal the grain boundaries. Further details on sample preparation, testing procedure, and analyzing techniques can be found in the authors’ previous publications [22,23].

3. Crystal Plasticity Model

In this study, a rate-independent crystal plasticity (CP) model is employed, in which the yield function for a single crystal is defined as follows [24]:
f ( σ ) = 1 m l n { α = 1 N e x p [ m ( | σ : P α | τ y α 1 ) ] }
where σ is the Cauchy stress tensor, τ y α is the critical resolved shear stress (CRSS) on the slip system α, m is a parameter to determine the closeness to the condition, | σ : P α | = τ y α , N is the number of slip systems, and P α is the Schmid tensor for the α-th slip system. Here, tensor variables σ and P α are represented by bold symbols. In this model, the slip rate ( γ ˙ β ) is defined as [25],
γ ˙ α = λ f ( σ ) τ y α = λ s g n ( σ   :   P α ) τ y α e x p [ m ( | σ : P α | τ y α 1 ) ] β = 1 N e x p [ m ( | σ : P β | τ y β 1 ) ]
where α and β are the index of summation for slip systems.
In the present CP model, a dislocation density-based hardening rule is adopted to account for the impact of microstructure barriers on the evolution of CRSS. The CRSS, τ y α , is decomposed into three terms as follows [8,25]:
τ y α = τ 0 + τ H P + τ f o r e s t α
Here, τ 0 is the summation of the initial friction stress and the strengthening contribution of precipitation hardening, which is assumed to be a constant value in the present study. τ H P accounts for the Hall-Petch effect, in which the impact of grain structure on the CRSS is considered. τ H P can be calculated by the following equation [25],
τ H P = μ   H α   b d M F P
where μ is the shear modulus,   H α is the Hall-Petch parameter, b is the Burgers vector, and d M F P is the size of the dislocation mean free path (MFP), which is a function of grain or subgrain microstructures. Lastly, τ f o r e s t considers the effect of dislocation density (ρ) on the CRSS through the following relationship [25],
τ f o r e s t α = μ b β = 1 N h α β   ρ β
The evolution of the dislocation density, ρ α , on the slip system α is calculated based on Kocks’ evolution law as follows [26]:
d ρ α = 1 b ( β = 1 N   ρ β k a α k b α ρ α ) | d γ α |
In this equation, the generation, evolution, and annihilation of dislocation density are controlled by the k a and k b parameters. These parameters mainly control the hardening behavior of the material in the plastic deformation region, which thus should be calibrated against experimental data.
It is worthwhile to note that local effects of geometrically necessary dislocations (GND) and discrete dislocation plasticity are neglected from the present model to improve the computational efficiency. However, the effects of these local mechanisms could play an important role on the plastic deformation characteristics within the submicron scale [25,27]. Therefore, neglecting the effect of GND and discrete dislocation plasticity was compensated for through the statistically stored dislocations (SSD) in the material calibration procedure.

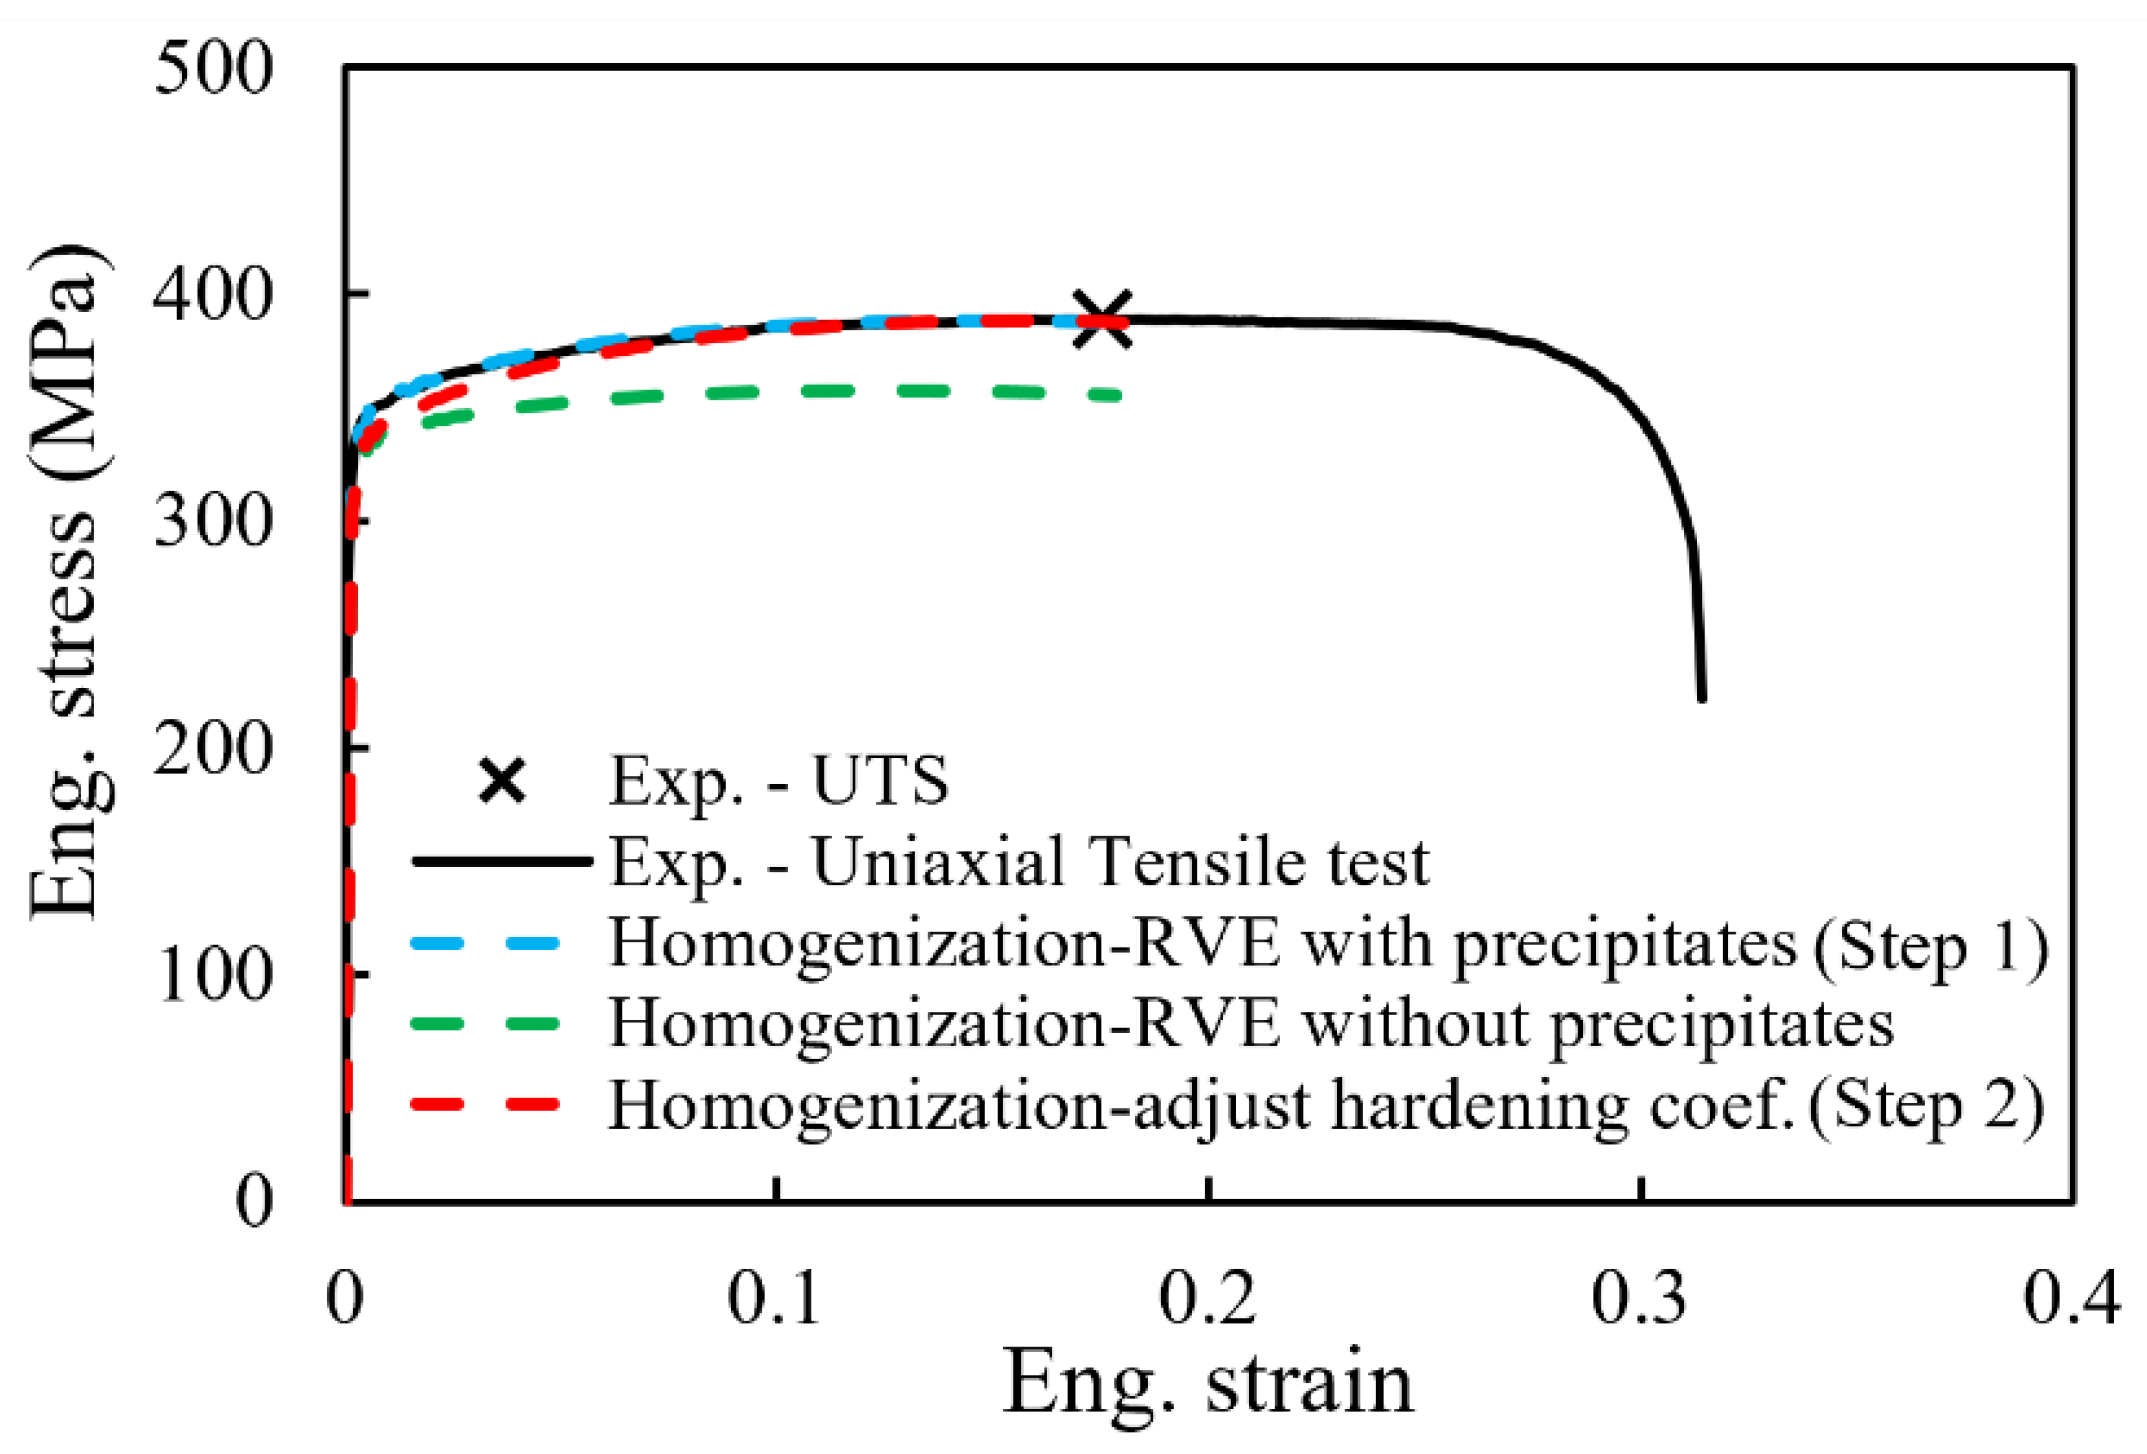
4. Calibration of Crystal Plasticity Model

4.1. Virtual Tensile Testing

The CP model explained in the previous section contains various model parameters that should be determined based on the material being investigated. Table 1 provides a portion of the material parameters that are constants, in which the elastic constants of c 11 , c 12 , and c 44 , as well as shear modulus, μ, and Burgers vector, b, are provided for ferrite with a body-centered cubic (BCC) structure. The rest of the parameters, including τ 0 ,   H α , k a , and k b , are the calibration parameters that are defined through calibration of the model against the experimental data. Among these parameters, τ 0 ,   H α , and the initial dislocation density, ρ 0 α , contribute to the initial yield of the material, while the remaining parameters ( k a and k b ) control the hardening behavior.
As mentioned earlier, a portion of the CP model parameters are defined by calibration of the CPFEM results against the experimental data. It is known that the proper calibration process requires an adequate set of experimental data to achieve accurate and unique CP model parameters. However, the requirement for the type of experimental data depends on the crystal structure of the material and the established modeling setup. The macroscopic uniaxial tensile data is generally used for the calibration of CP model parameters for a material with BCC and FCC crystal structures [25,28]. The author’s previous study showed that at least two stress-strain curves at different orientations are required to properly calibrate the CP model parameters in BCC single crystals [29]. In polycrystalline BCC materials, which capture the heterogeneity/anisotropy of the BCC material, a single stress-strain curve may be sufficient for the calibration. However, the use of a second experimental data point for calibration is highly recommended to avoid non-unique CP parameters. In the present study, due to the lack of availability of much experimental data, a single uniaxial tensile test datum obtained along the extrusion direction (ED) of the steel tube was used for the initial calibration of the CP model parameters using the 3D RVE.
To calibrate the CP model parameters, the virtual tensile test on the representative volume element (RVE) along the ED of the as-received tube was performed. Dream.3D software (Dream 3D-6.5.171) was utilized to generate the 3D RVE model. To that end, a dual phase RVE model consisting of the matrix phase and second phase particles was generated. The grain size, aspect ratio, and crystal orientation for the matrix phase as well as the size distribution of precipitates for second phase particle were obtained from microstructure observations and input to the Dream.3D software for generation of the corresponding RVE. More details on the development of the microstructure-based RVE model is provided in the next section. The generated RVE model was then imported to the Abaqus finite element (FE) commercial package to perform the virtual tensile testing. To perform a virtual tensile test on the RVE along the extrusion direction (ED), the symmetry boundary conditions were applied to three adjacent surfaces, while a tensile displacement boundary condition was defined on the opposite surface along ED, as illustrated in Figure 1. Later, the summation of the reaction force along ED on the surface with a symmetry boundary condition was divided by the initial surface area to obtain the engineering stress, while the average tensile displacement on the opposite surface along ED was divided by the initial RVE size in the same direction to obtain the engineering strain. The synchronized stress-stress data throughout the virtual tensile test would provide the flow behavior of the RVE model. Also, the eight-node linear brick element with reduced integration (C3D8R) was used to mesh the RVE, and a fixed mass scaling factor of 109 is applied to reduce the computational time. To run the simulation, the CP model was incorporated into the commercial Abaqus/Explicit FE code using the user-defined material subroutine VUMAT.

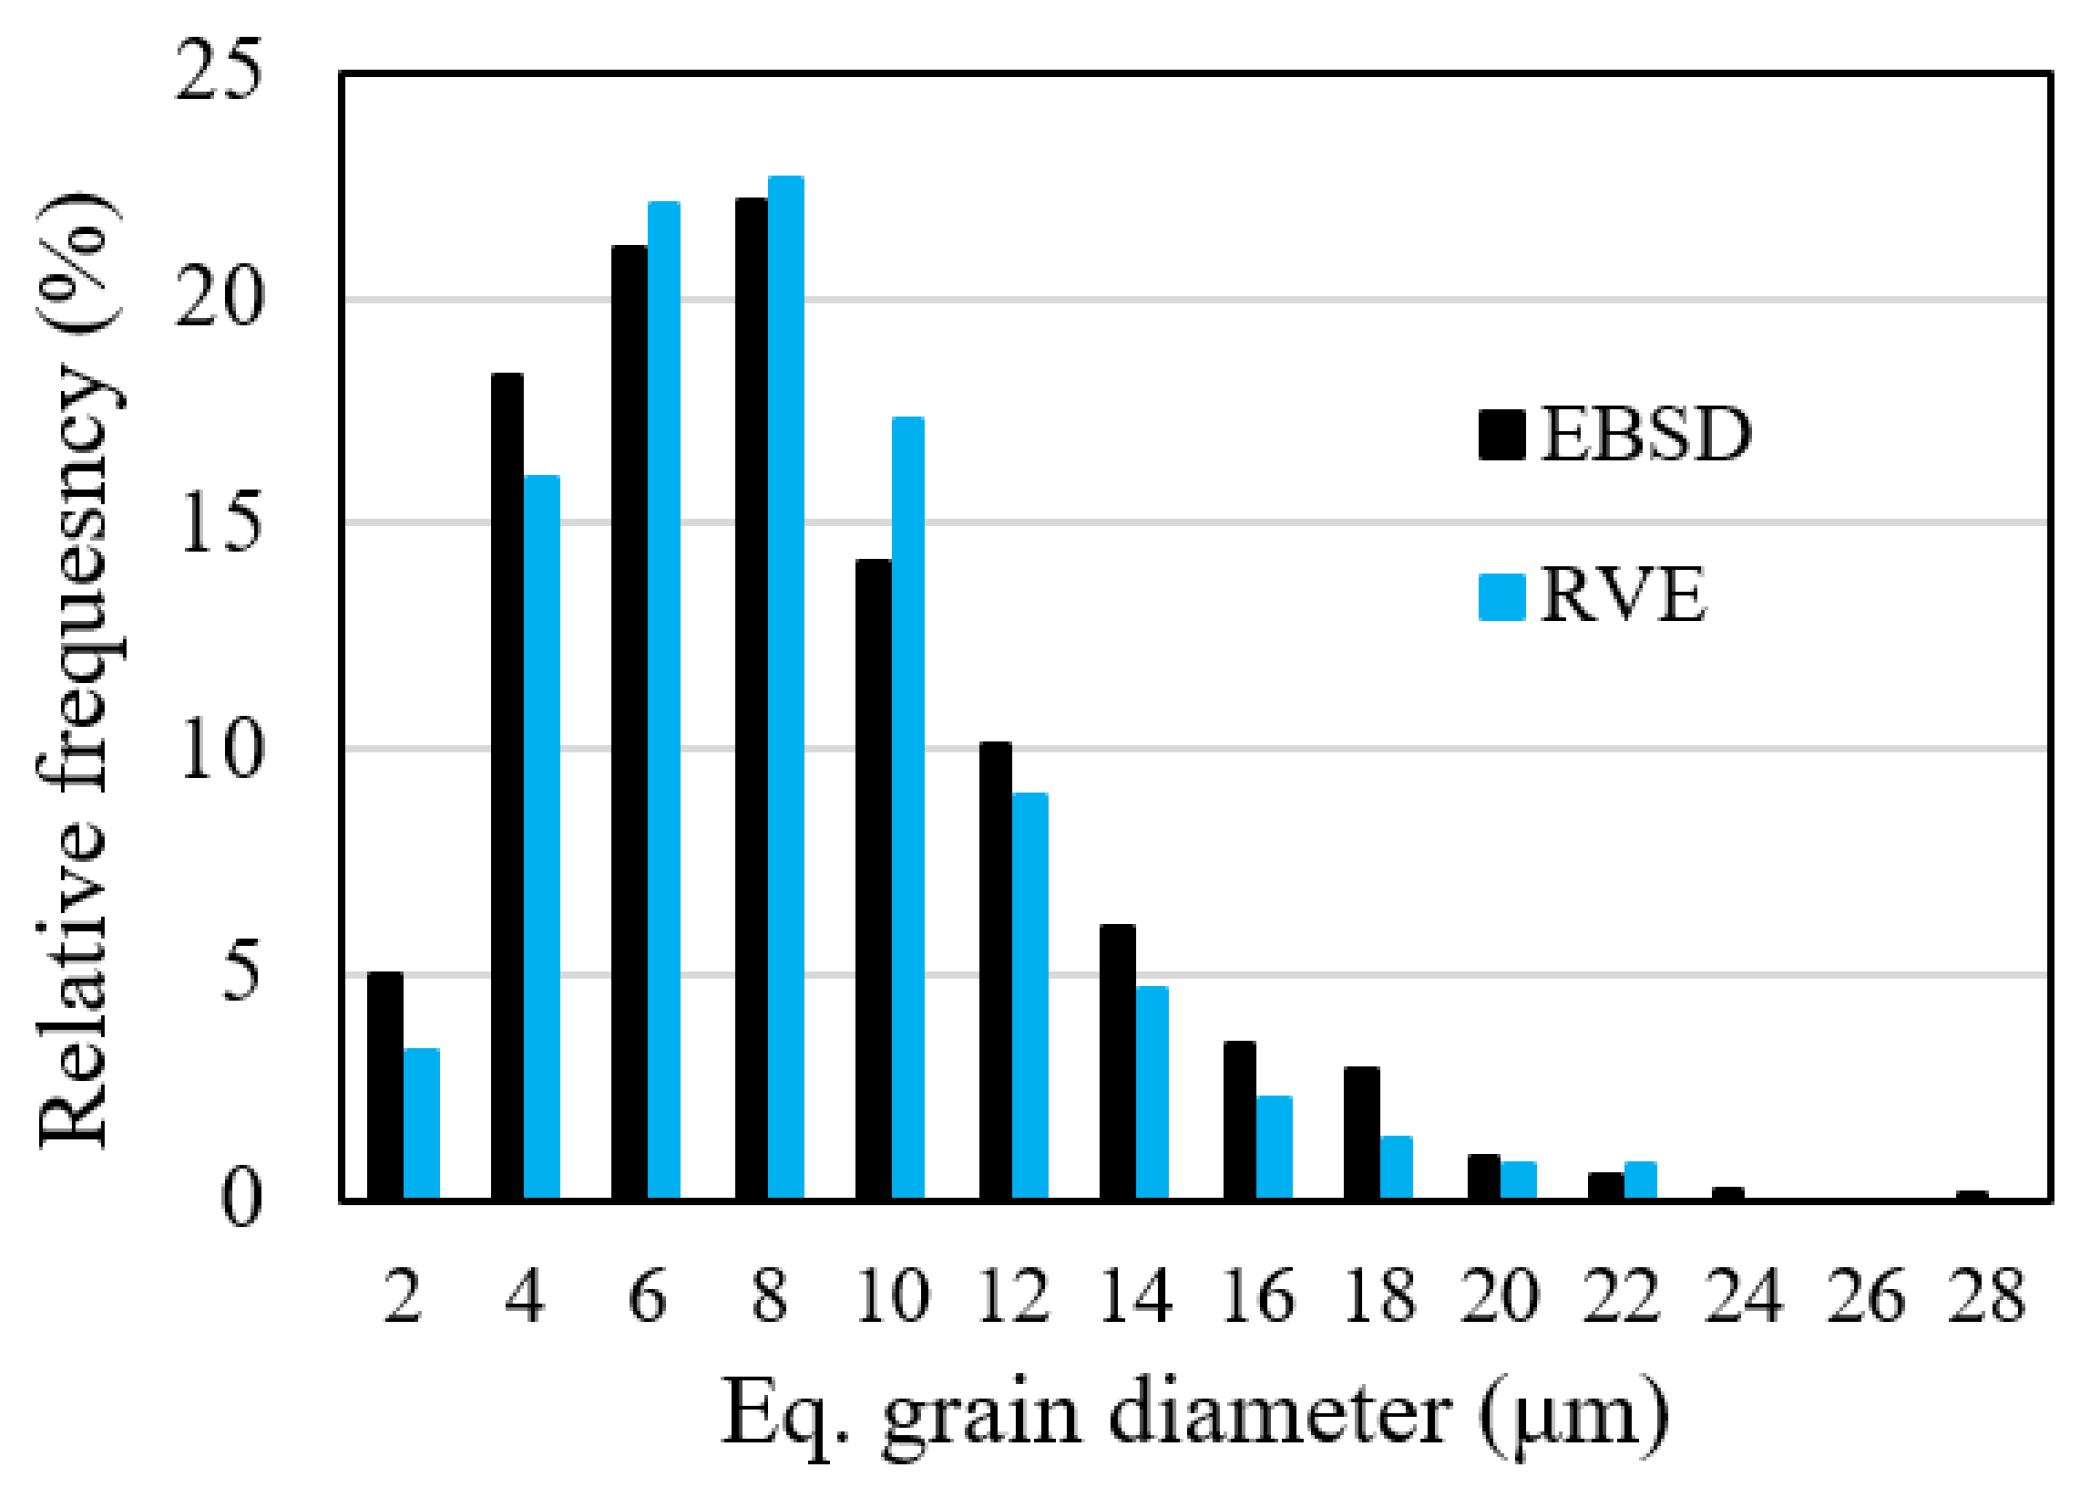
4.2. Microstructure-Based RVE Model

In this section, a 3D RVE model that comprehensively represents the microstructural characteristics of the investigated material is generated to calibrate the dislocation density-based CP model. To that end, Dream.3D software is employed to generate a 3D RVE model consisting of two phases: the matrix phase ferrite, and the second phase particles. For the matrix phase, the distributions of grain size, aspect ratio, and crystal orientation obtained from EBSD measurements are incorporated. The EBSD maps collected from axial and hoop cross-sections of the as-received tube is illustrated in Figure 2. The microstructure on both cross-sections depicts a uniform distribution of fine grains. In addition, these microstructures are comprised of equiaxed grains with some grains slightly elongated toward ED and TD directions, which could be related to the prior production procedure. For this phase, the elastic-plastic deformation condition is considered, in which a total of 12 slip systems of {110} <111> and 12 slip systems of {112} <111> in BCC crystals are assumed to be activated. It is shown that the {110} <111> and {112} <111> slip systems in the BCC crystal equally contribute to the deformation, since the critical resolved shear stresses of the two active slip systems are very similar [30].
As for the second phase particles, the configuration and properties of the precipitates should be correctly defined to effectively model the mechanical behavior at the macroscale. To that end, the second phase particles in the RVE model are generated based on the experimental data, such as average diameter and volume fraction obtained from OM images. As an example, the OM image collected from the hoop cross-section of the as-received tube, along with the corresponding Dream.3D image processing analysis result, is shown in Figure 3. In Figure 3b, the identified precipitants are shown in red, which are unevenly distributed throughout the matrix. As seen, the distribution of second phase particles is random in some regions, while it is aggregated on the grain boundaries in the remaining regions. To simplify the modeling approach, the second phase particles are assumed to be equiaxed and randomly distributed throughout the matrix phase in the RVE. In addition, an isotropic elasticity model with an elastic modulus of 327.58 GPa and Poisson’s ratio of 0.334 was assumed for precipitates [28].
The generated 3D RVE should statistically represent the original material according to three characteristics:
  • Grain topology of the matrix phase,
  • Orientation distribution of the matrix phase, for which the RVE should contain hundreds of grains to accurately represent the texture,
  • Configuration of the second phase particle, for which the RVE’s resolution should be sufficiently fine to account for the small size precipitates.
Figure 4 depicts a 3D RVE model of the as-received steel tube comprised of 670 grains for the matrix phase and 0.5 million second phase particles. For the sake of computational efficiency, this model was found to be the smallest RVE that could accurately represent all the microstructural characteristics of the original material. The size of the generated 3D RVE is determined to be 64 μm × 64 μm × 64 μm, with a total of 32.8 million equal-sized (0.2 × 0.2 × 0.2 μm3) cubic elements. To verify the accuracy of representation, it is crucial to compare the RVE characteristics to the corresponding experimental data. In this regard, the grain size distribution in the matrix phase is compared to the experimental EBSD data in Figure 5, which is found to be accurate. As for the second phase particles, the average equivalent particle diameter and volume fraction obtained from the RVE model are 0.294 μm and 0.028, which is in close agreement with the corresponding experimental values of 0.283 μm and 0.029, respectively. Furthermore, the pole figures of the <001>, <011> and <111> crystal directions for the matrix phase computed from the generated RVE is in good agreement with the measured distributions of the averaged grain orientations obtained from the EBSD data, as depicted in Figure 6. Based on the provided comparisons, it can be confirmed that the generated 3D RVE precisely represents the as-received steel tube in terms of the grain topology and orientation distribution of the matrix phase, as well as the configuration of the second phase particle.
To calibrate the CP model, the calibration parameters are adjusted based on a trial-and-error technique, until the virtual tensile test data performed on the generated 3D RVE matches the experimental uniaxial tensile data. Figure 7 shows the comparison between the engineering flow curves obtained from the CPFEM simulation of virtual tensile test after calibration and the experimental uniaxial tensile test data in ED of the as-received tube. As can be seen, the CPFEM prediction is in reasonable agreement with the experimental data using the material constants listed in Table 1 and the calibration parameters listed in Table 2. Since the deformation behavior beyond the uniform elongation limit basically depends on the sample geometry, the CPFEM simulation is solely performed in the uniform elongation region, and the post-uniform deformation behavior is neglected in the present study.
As mentioned earlier, the RVE model depicted in Figure 4 should represent the original material in terms of the configuration of second phase particles in the submicron scale as well as the grain topology and texture in the microscale. In the submicron scale, the RVE element size of 0.2 × 0.2 × 0.2 μm3 is sufficiently small to precisely account for the fine size of precipitates with an experimental average particle size of 0.283 μm. On the other hand, in microscale, the RVE model should be large enough to contain a sufficient number of grains to represent the original material in terms of grain topology and orientation distribution. To that end, the size of the generated RVE was determined to be 64 μm × 64 μm × 64 μm. According to the extensive literature, the typical number of elements needed in an RVE model to represent a material is less than one million. However, due to the very small size of the precipitates, the RVE model in Figure 4 has 32.8 million elements to represent the carbon steel tube material. The reason for limiting the number of elements in RVE model is that the computational cost rapidly increases with the increase in the number of elements in FE models. It is worthy to note that the CPU time required for the CPFEM simulation with the RVE model depicted in Figure 4 was 1441-h (60 days) using a 24-core 3.00 GHz processor, while the calibration process required multiple rounds of simulation to optimize the CP model parameters.

4.3. Computationally Efficient Algorithm Based on Simplified RVE Model

In the previous section, a 3D RVE was generated to calibrate the CP model against the experimental uniaxial tensile test data by performing a virtual tensile test. Although the characteristics of the created model was in good agreement with the experimental data in terms of the distribution of precipitates, as well as the grain topology and grain orientation distribution of the matrix phase, it was computationally expensive and inefficient. To improve the efficiency in the developed RVE model without sacrificing the accuracy, a multiscale modeling procedure based on a homogenization scheme is proposed to account for the effect of precipitation strengthening.
The proposed multiscale modeling procedure is based on the superposition of the strengthening effects in the metallic materials. In this approach, the effect of precipitation strengthening on the macroscopic mechanical properties is merged with the material’s intrinsic strength. In other words, an increase in the amount of the material’s intrinsic strength could compensate for the contribution of the precipitation strengthening, through which the explicit presence of particles in the RVE model is no longer necessary. The decoupling of the second phase particles from the RVE model would allow improving the efficiency of the computations by reducing the number of finite elements needed in the RVE model. To precisely account for the effect of precipitates on the mechanical properties through the proposed homogenization scheme, the calibration process is broken down into three sequential steps as described below:
Step 1: homogenization—RVE with precipitates—A microscale RVE model with a high resolution consisting of the matrix phase and second phase particles is generated, as depicted in Figure 8a. This RVE model is determined to be 20 μm × 20 μm × 20 μm with 1 million equal sized cubic elements. The average equivalent diameter and volume fraction of second phase particles are 0.288 μm and 0.029, which is in close agreement with the corresponding experimental values of 0.283 μm and 0.029, respectively. Similar to the RVE model in Figure 4, an isotropic elasticity model with an elastic modulus of 327.58 GPa and Poisson’s ratio of 0.334 was assumed for the second phase particles [28]. In addition, the developed RVE model only contains 30 grains with an average grain diameter of 7.24 μm, which is in good agreement with the experimental value of 7.73 μm. It is worth noting that since the generated RVE model does not contain enough grains, it cannot represent the grain size distribution and orientation distribution of the original material, and thus the Hall-Petch effect is excluded from this calculation. In addition, random orientations are assigned to the grains in the RVE model. The generated RVE model is used for the calibration of the CP model parameters against the experimental uniaxial tensile data in ED of the as-received tube. As can be seen in Figure 9, the computationally obtained flow data (blue curve) is in good agreement with the experimental data. The calibration parameters obtained from this calibration are listed under the Step 1 column in Table 3.
Step 2: homogenization—RVE without precipitates—The RVE model developed in Step 2, shown in Figure 8b, has similar characteristics and an identical size and resolution as that in Step 1, except that the second phase particles are removed. This model contains 30 grains with an average grain diameter of 7.85 μm, which is in close agreement with the experimental value of 7.73 μm. Similarly, because of the insufficient number of grains, random orientations are assigned to the grains in the RVE and the Hall-Petch effect is excluded from the calculations. To determine the contribution of the precipitation strengthening on the material’s strength, the CPFEM simulation of the virtual tensile test on the RVE model without the precipitates (Figure 8b) is performed using the CP model parameter obtained from Step 1. The obtained flow data from this simulation (green curve) is shown in Figure 9. The difference between the two flow curves, corresponding to the RVE with precipitates and without precipitates, is identified as the contribution of the precipitation strengthening on the material’s strength. It is worth noting that in the CPFEM simulation, these precipitates act as hard barriers to the free motion of dislocations and cause the material to strain harden. Therefore, by removing these precipitates from the CPFEM simulation, the primary effect will be a reduction on the strain hardening portion of the stress-strain curve. As can be seen in Figure 9, the contribution of the precipitation hardening is significant. To compensate for the contribution of the precipitation strengthening, the CP model parameters obtained from Step 1 are recalibrated against experimental tensile test data by performing simulations with the RVE model developed in Step 2 (Figure 8b). Among the CP model parameters, k a and k b are the parameters that contribute to the shape of the hardening curve by controlling the speed of dislocation evolution and annihilation. To obtain a perfect agreement between the predicted hardening curve and experimentally measured stress-strain curve, both k a and k b are adjusted. The calibrated flow data (red curve) with adjusted calibration parameters (see the Step 2 column of Table 3) are shown in Figure 9. As can be seen, the obtained flow curve is in reasonable agreement with the experimental flow data.
Step 3: homogenization—incorporate the Hall-Petch effect—As mentioned earlier, the Hall-Petch effect was excluded from the simulations during homogenization of the precipitation strengthening due to the insufficient number of grains in the generated microscale RVE models developed in Step 1 and Step 2. In Step 3, the Hall-Petch parameter,   H α , and the initial friction stress, τ 0 , are determined by recalibrating the initial yield point. To obtain these two parameters, the virtual tensile test is performed on a 3D RVE without precipitates, but with 2500 grains to accurately represent the grain structure and orientation distribution of the original material. Figure 10a illustrates the generated RVE for Step 3, in which the size of the model is determined to be 105 μm × 105 μm × 105 μm with an element size of 1.75 μm × 1.75 μm × 1.75 μm. The grain size distribution of the generated RVE is compared to the experimental data in Figure 10b, which are found to be very accurate. In addition, the pole figure computed from the generated RVE is presented in Figure 10c, which is also in close agreement with the corresponding experimental data shown in Figure 6b. Performing the virtual tensile test on the generated RVE model using the calibrated CP model leads to the flow curve illustrated in Figure 11. The comparison between the engineering flow curves obtained from the CPFEM simulation and the experimental uniaxial tensile test data shows a close agreement. The Step 3 column in Table 3 shows the calibrated Hall-Petch coefficient along with the rest of the hardening parameters. As can be seen, the three hardening parameters ( ρ α , k a , and k b ) related to plastic deformation beyond the initial yield were not changed. Based on the observed results, the calibration parameters tabulated in Table 3 corresponding to Step 3 can be adopted for the simulations based on the developed CP model for the as-received material.
The proposed multiscale modeling technique could enhance the CPFEM modeling performance in two ways. Firstly, it could significantly reduce the computation cost at different stages of the modeling procedure, including the generation of an RVE model, the verification of the established model, and conducting simulations to predict the mechanical behavior of the material under complex deformation modes. Based on the comparisons, it is observed that the RVE models depicted in Figure 4 and Figure 10a represent the same material with identical characteristics. The only difference is that the second phase particles are removed from the RVE model in Figure 10a. However, the homogenization scheme is employed to account for the effect of precipitation strengthening on the material’s mechanical properties. In addition, the comparison of results presented in Figure 7 and Figure 11 indicate that carrying out virtual tensile tests with these two RVE models results in similarly accurate predictions of the flow stress of the steel material. However, the CPU time required for completion of the virtual tensile test with the RVE model in Figure 10a takes 12 h with a 24-core 3.00 GHz processor, which is significantly lower than the 1441-h CPU time required for the CPFEM simulation with the RVE model in Figure 4. This result conveys the fact that the proposed multiscale modeling procedure based on a homogenization scheme could successfully improve the computational efficiency of the CPFEM modeling without sacrificing accuracy.
Secondly, the proposed modeling technique is beneficial toward distinguishing the individual effect of precipitation strengthening on each of the CP calibration parameters by breaking down the calibration process into multiple steps. It is well known that the precipitation hardening may impact the elastic, initial yield, and plastic hardening behavior of the material. It was mentioned earlier that the developed CP model has multiple calibration parameters, among which three parameters of τ 0 ,   H α , and ρ 0 α define the initial yielding, and two parameters of k a and k b define the hardening behavior at the plastic deformation region by evolving the dislocation density of each slip system, ρ α . Through the proposed multiscale modeling approach, the calibration process is broken into three sequential steps, such that a portion of the calibration parameters is obtained at each step. Using this multiscale technique, the impact of precipitation strengthening on each of the calibration parameters is identified separately, and the mixed effect of second phase particles on the CP model parameters is avoided. This is not possible when using the traditional calibration technique based on the RVE model in Figure 4.

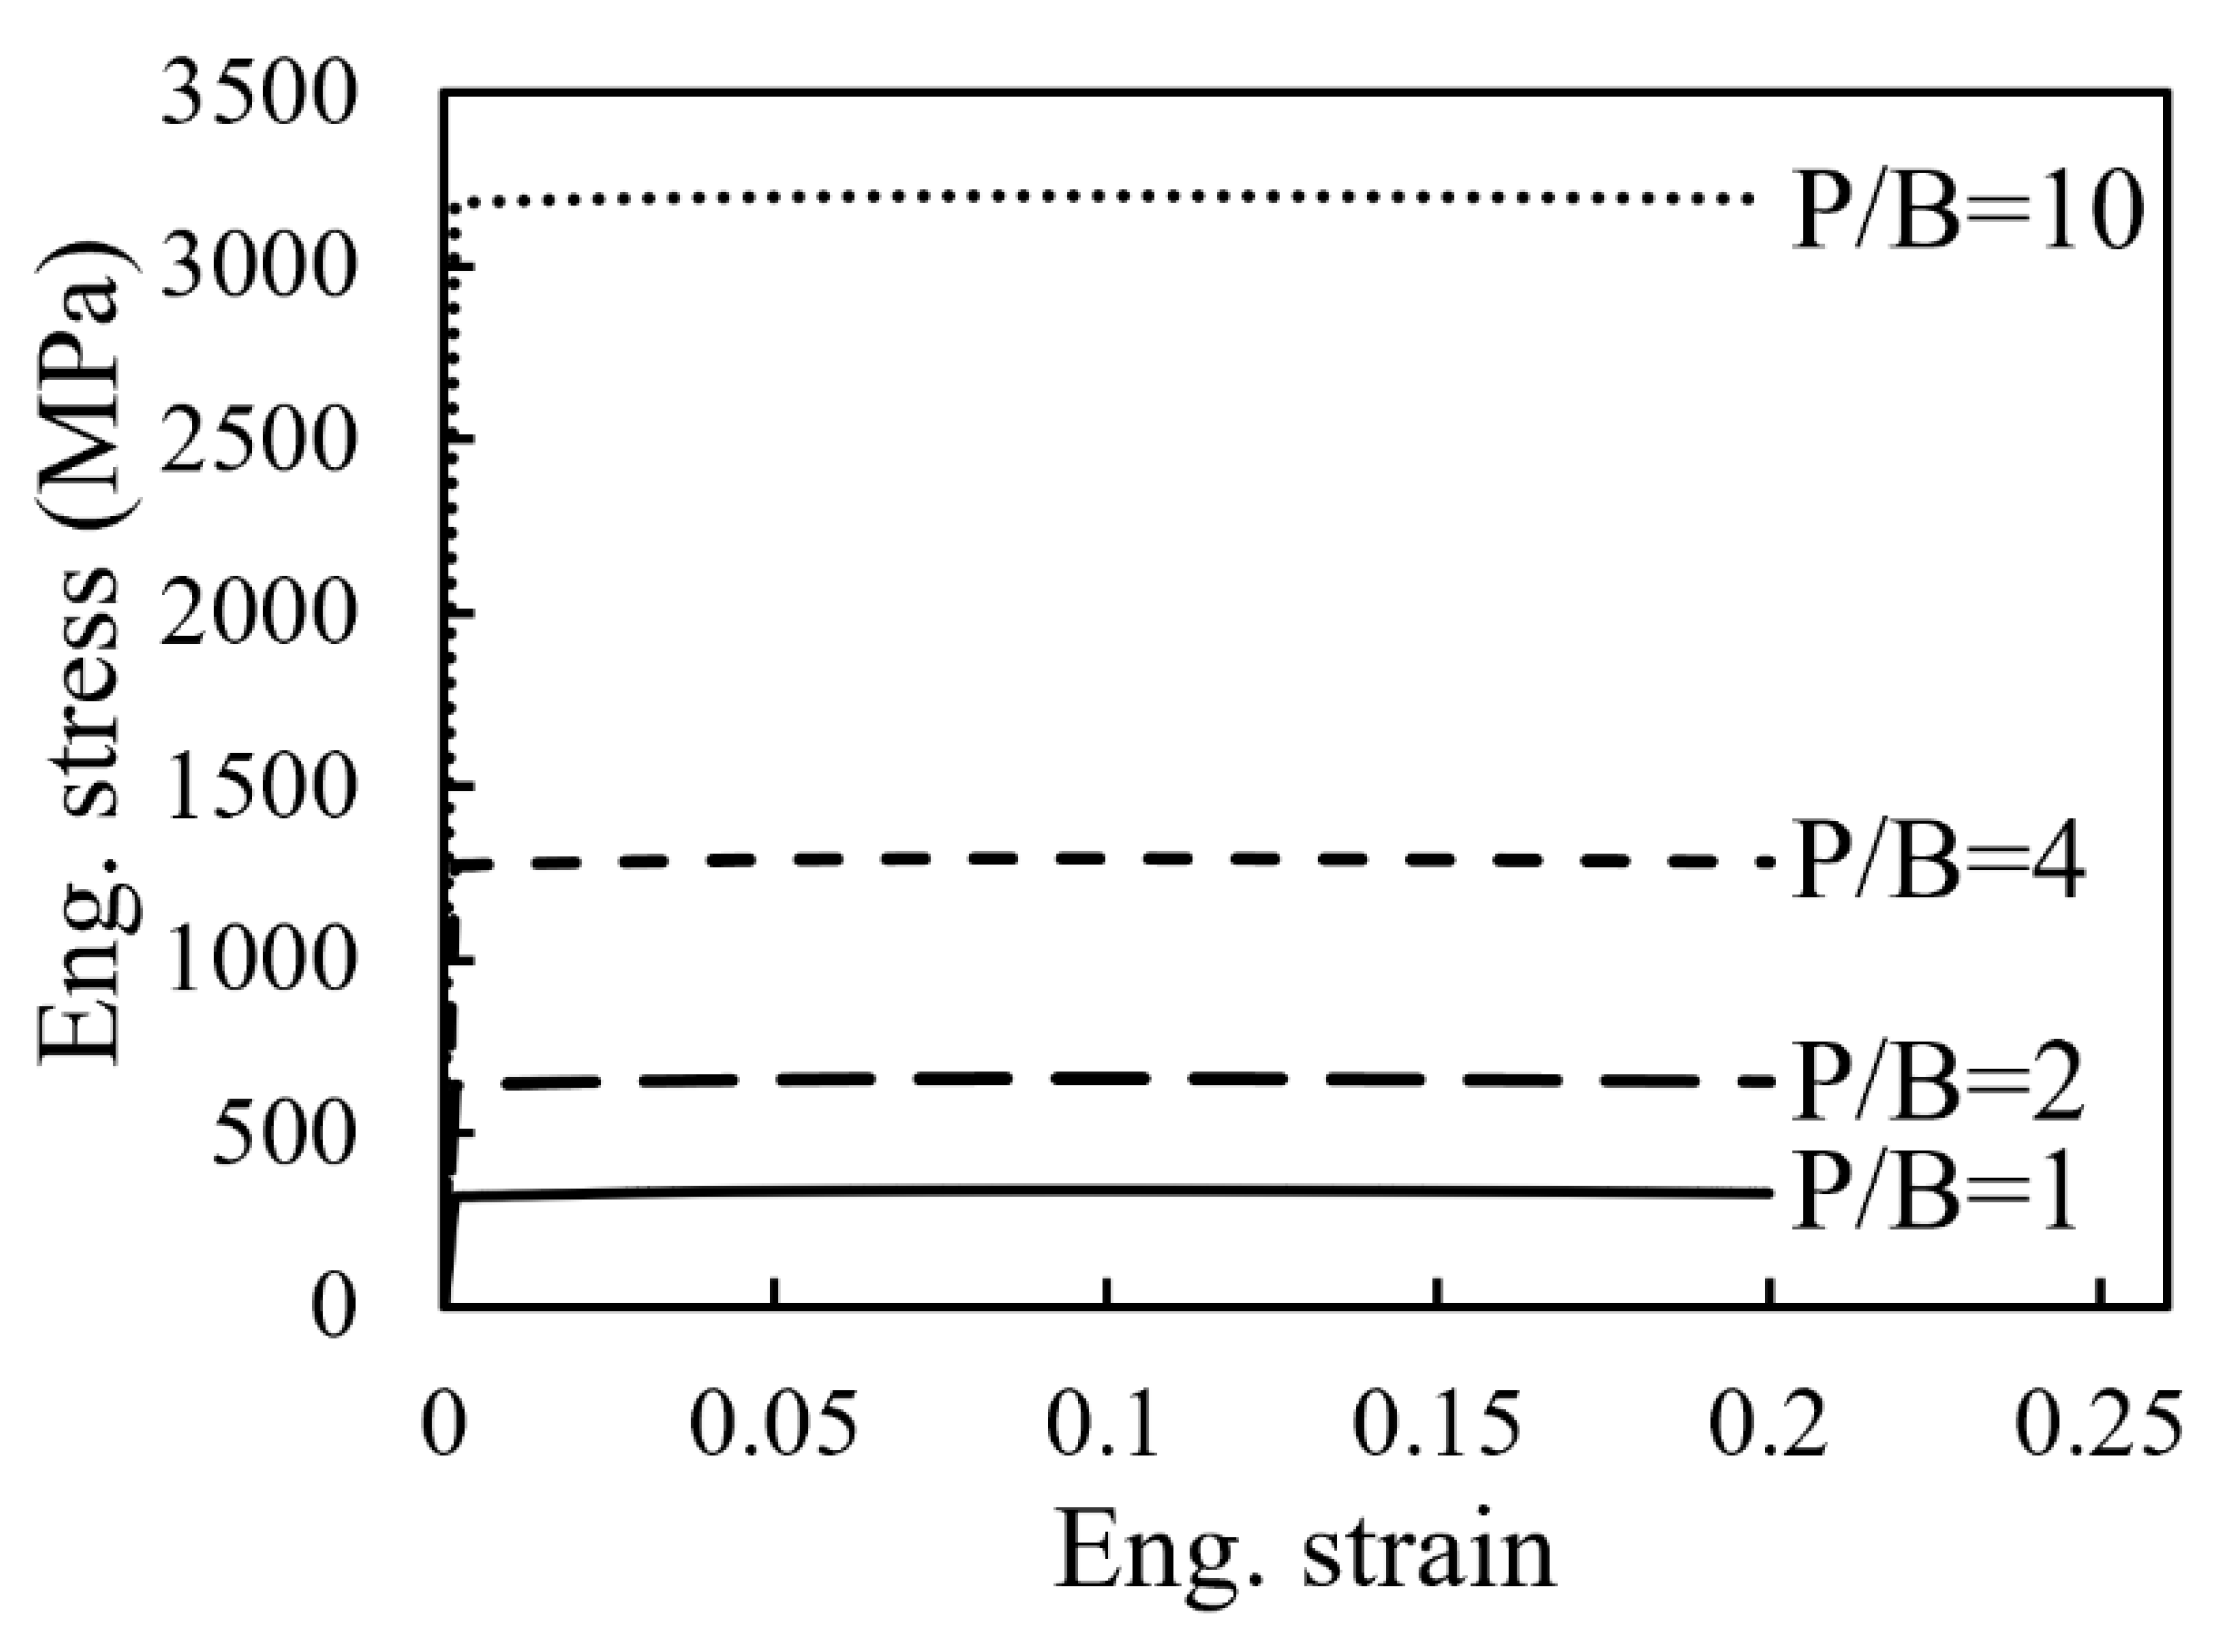
5. Sensitivity of the Macroscopic Mechanical Properties to the Precipitates

As seen earlier, precipitation hardening affects the mechanical properties of metallic materials. The magnitude of the effect on the macroscopic mechanical properties is highly sensitive to the properties of second phase particles at lower scales. It is well known that the microscale properties of precipitates such as size, volume fraction, geometrical distribution, and elasto-plastic properties [5], as well as the submicron scale properties such as particle interface properties, homogeneity of chemical composition, and lattice misfit strain could significantly affect the mechanical properties at larger scales [6,7]. In the present study, the submicron scale parameters are neglected since they are smaller than the resolution of the generated RVE models. However, the influence of microscale precipitate properties on the macroscopic mechanical properties of the material is investigated in this section. To that end, the CPFEM simulation of the uniaxial tensile test is performed on the RVE models with a diverse range of the characteristics of second phase particles to investigate the sensitivity of the macroscopic mechanical properties to the precipitate. The generated RVE models are single grain to eliminate any possible effect caused by grain structure and texture on the mechanical properties. Therefore, the individual effect of the second phase particle on the mechanical properties, as the only varying parameter, is investigated. An example of such RVE models is shown in Figure 12, in which the RVE model is comprised of one grain as the matrix as well as second phase particles with a size and volume fraction of 0.26 μm and 0.025, respectively.
The mechanical behavior of the second phase particles plays a crucial role in determining the contribution of precipitate strengthening on the macroscopic properties. The behavior of the precipitate is basically governed by the alloy system of material. However, it is reported that the size, coherency, and chemical composition of precipitates are the factors that could influence the mechanical behavior of precipitates [31]. The behavior of second phase precipitates are generally assumed to be non-deformable with elastic mechanical properties for simplicity [32], but the deformable behavior with elasto-plastic mechanical properties may better describe the behavior of second phase precipitates under particular conditions [31]. In this regard, the sensitivity of the macroscopic properties to the mechanical behavior of second phase precipitates is investigated through performing a CPFEM simulation of the uniaxial tensile test under various mechanical properties of precipitates.
The effect of the mechanical behavior of second phase precipitates on the macroscopic flow properties is illustrated in Figure 13, in which the effects of deformable precipitates with elasto-plastic behavior and non-deformable precipitates with elastic behavior are shown. Figure 13a depicts the macroscopic flow properties obtained through considering various elasto-plastic properties for deformable second phase precipitates. The elasto-plastic behavior of precipitates is manipulated by increasing the yield strength of the base material at different precipitate to base strength ratios ( P / B = σ y P r e c i p i t a t e / σ y B a s e ), while the hardening behavior beyond the initial yield point is considered similar to the base material, as illustrated in Figure 14. Based on the generated elasto-plastic flow data, the CPFEM simulation of the virtual tensile test is performed on the dual phase RVE model with a second phase particle diameter of 0.26 μm and volume fraction of 0.025, as shown in Figure 12. As shown in Figure 13a, the obtained results are compared to the macroscopic properties of the base material, as well as the material with pure elastic precipitates, in which the elastic modulus and Poisson’s ratio of 171.2 GPa and 0.34, respectively, are considered for precipitates. At the precipitate to base strength ratio of 1 (P/B = 1), in which identical mechanical properties are assigned to both base material and second phase precipitates, a slight increase in the macroscopic strength is observed. further increasing the strength of precipitates (higher P/B) leads to an additional increase in the macroscopic strength of the material. The precipitation strengthening ultimately saturates at P/B = 10, in which the precipitates behave like non-deformable precipitates and demonstrate a similar macroscopic behavior to the pure elastic behavior. As observed, the macroscopic properties are quite sensitive to the elasto-plastic behavior of deformable precipitates. The primary reason is that the dislocations cut through and plastically deform the precipitates during deformation of materials with deformable precipitates. Thus, in the materials with deformable precipitates, the amount of precipitation strengthening is basically controlled by the intrinsic mechanical properties of the precipitates.
Figure 13b depicts the macroscopic flow properties obtained through considering various elastic properties for non-deformable second phase precipitates. In carbon steels, various Fe-C compounds with a diverse range of properties and crystal structures can be formed. In a study performed by Liu et al. [32], the properties of the Fe-C compounds generally found in carbon steels have been investigated. The summary of the elastic properties and crystal structure of the proposed Fe-C compounds are tabulated in Table 4 [32]. These elastic properties are assigned to the second phase particle in the RVE model that is shown in Figure 12 to perform the virtual tensile test. The result of this investigation (Figure 13b) illustrates that the effect of the elastic properties of non-deformable precipitates on the macroscopic mechanical properties is insignificant. This is because the dislocation could not cut through the non-deformable precipitates during the deformation, and could only bypass the precipitates. Therefore, in the materials with non-deformable precipitates, the contribution of precipitates on the macroscopic strength of material is independent of the precipitate properties [31], and is mainly controlled by the topology of precipitates, including size, volume fraction, and configuration of the precipitates across the matrix.
To study the sensitivity of macroscopic properties to the topology of second phase precipitates, the CPFEM simulation of the uniaxial tensile test is performed on RVE models with varying sizes and volume fractions of precipitates. The summary of the RVE models generated for this investigation is provided in Table 5. Both non-deformable and deformable behavior of precipitates are considered when performing the CPFEM simulations. In the case of non-deformable precipitates, the elastic properties of Fe2C provided in Table 4 are assigned to the second phase precipitates. On the other hand, elasto-plastic behavior with a precipitate to base strength ratio of 2 (P/B = 2) is considered for the deformable precipitates.
The flow curves obtained from simulations with non-deformable precipitates on the RVE models introduced in Table 5 are illustrated in Figure 15. First and foremost, the presence of second phase particles in the RVE model leads to the precipitation strengthening, regardless of the size and volume fraction of the particles. According to the data presented in Figure 15a, the increase in the size of the precipitates at a constant volume fraction, i.e., a lower number of particles in the RVE model, would weaken the effect of precipitation hardening. The precipitation strengthening is basically caused by the ability of precipitates to resist against the movement of dislocations on the slip systems. In this case, although the few large particles could locally surge the resistance against dislocation movements, resulting in the overall precipitation strengthening, a more uniform distribution of finer particles may lead to a stronger precipitation strengthening effect. Furthermore, Figure 15b depicts the effect of increasing the volume fraction of precipitates at a constant particle size on the macroscopic mechanical properties. As shown, the increase in the volume fraction in the RVE model not only elevates the strength of the material, but also increases the strain hardening effect. Like the effect of particle size, the increase in the volume fraction of precipitates leads to a huge number of particles spread throughout the microstructure. This number of particles significantly enhances the resistance against the movement of dislocations, and creates dislocation forests behind the precipitates. The dislocation forests may lead to a more intense strain hardening behavior, in addition to an increased material’s strength.
The flow curves obtained from simulations with deformable precipitates on the RVE models introduced in Table 5 are illustrated in Figure 16. Like the behavior previously observed for the material with non-deformable precipitates in Figure 15, the presence of second phase particles in the RVE model leads to precipitation strengthening, regardless of the size and volume fraction of the particles. Figure 16a demonstrates the effect of particle size at a constant volume fraction on macroscopic properties, in which it is seen that the magnitude of precipitation strengthening is independent of the particle size. Figure 16b depicts the effect of an increase in the volume fraction of precipitates at a constant particle size on the macroscopic mechanical properties. Like the behavior observed for non-deformable precipitates in Figure 15, the increase in the volume fraction in the RVE model not only elevates the strength of the material, but also increases the strain hardening effect. However, the amount of precipitation strengthening in the case of deformable precipitate behavior is less significant. To quantify this comparison, the sensitivity of the macroscopic strength to the size and volume fraction of precipitates, considering both deformable and non-deformable precipitate behaviors, is plotted in Figure 17. In this figure, the macroscopic strength at 10% strain is plotted against a wide range of precipitate size-to-volume fraction ratios. As seen, two different behaviors for the sensitivity of the macroscopic strength to the size-to-volume fraction ratio are observed for both deformable and non-deformable precipitate behaviors. Below the size-to-volume fraction ratio of 10, the increase in size and reduction in volume fraction of the precipitates leads to a reduction in the magnitude of precipitation strengthening. In this region, the sensitivity of the macroscopic strength to the topology of precipitates in non-deformable precipitates is more significant in comparison to deformable precipitates. As mentioned earlier, since the dislocations could cut through the deformable precipitates in deformable precipitates, these precipitates cannot act as a rigid barrier against the movement of dislocations. Therefore, the amount of precipitation strengthening is controlled by the intrinsic properties of the precipitates rather than the size-to-volume fraction of the precipitates. However, in non-deformable precipitates, the dislocation could only bypass the precipitates. Therefore, the contribution of precipitates on the macroscopic strength of material is independent of the precipitate properties, and is mainly controlled by the topology of precipitates, including the size-to-volume fraction. Beyond the size-to-volume fraction ratio of 10, the precipitation strengthening becomes independent of the topology of precipitates. The main reason is that the presence of precipitates becomes ineffective in creating resistance against the movement of dislocations on the slip systems at extremely large size or low volume fractions of precipitates. In this condition, the magnitude of the precipitation strengthening reaches a plateau, and a minimal impact of precipitates on the macroscopic strength is observed.
As reported in the literature, the position of the second phase particles in the microstructure may affect the macroscopic mechanical properties [1,32]. To assess the magnitude of this effect, various 3D RVE models with a different distribution of precipitants is constructed and examined through virtual tensile testing. To that end, poly-grain RVE models are constructed in a way that a fraction of the second phase particles is placed on the grain boundaries, while the remainder is spread inside the grains. The 3D RVE models with non-deformable second phase particles constructed for this investigation are shown in Figure 18. As can be seen in Figure 18a, all the second phase particles are randomly distributed inside grains, while none are placed on the grain boundaries. On the other hand, Figure 18b displays the RVE model, in which 50% of precipitates are placed on the grain boundaries, and the remainder is evenly distributed inside the grains. The equivalent diameter of particles, volume fraction of particles, and equivalent grain diameter in both RVEs are identical and equal to 0.36 μm, 0.08, and 7.75 μm, respectively, while random grain orientations are assigned in both models. Figure 19 depicts the flow curves obtained from the virtual tensile tests performed on the RVE models presented in Figure 18. As can be seen, placing more second phase particles on the grain boundaries would slightly increase the strength of material, which may be due to the binding of grain boundaries by the precipitates during the deformation [32]. However, the magnitude of strengthening is less than 2% for the increasing of the fraction of second phase particles placed on the grain boundaries from 0% to 50%, which is determined to be insignificant.

6. Conclusions

In the present study, a CPFEM modeling approach was adopted to investigate the effect of the second phase particles on macroscopic mechanical behavior. To that end, a microstructure-based RVE model was generated using the experimental data, including properties and distribution of precipitates in a submicron scale, as well as the grain topology and orientation distribution of grains in a microscale. Because of the multiscale, multi-phase nature of this investigation, a computationally efficient multiscale modeling approach based on a homogenization scheme was proposed to account for the effect of second phase particles on deformation behavior. Lastly, a parametric analysis was performed to investigate the sensitivity of the macroscopic mechanical properties to the configuration and properties of the second phase particles. The main findings of the present study are as follows,
  • By comparing the simulation results to corresponding experimental data, it was observed that the proposed multiscale modeling approach successfully accounted for the effect of second phase particles on the deformation behavior. In addition, through the proposed algorithm, the computational cost was reduced by more than 99% for an identical simulation, confirming the vastly improved efficiency of the model.
  • It was observed that the topology as well as the mechanical properties of second phase precipitates may heavily affect the macroscopic mechanical properties. It was observed that the amount of precipitation strengthening is controlled by the intrinsic properties of the precipitates in deformable precipitates, while also controlled by topology, including size and volume fraction of precipitates in non-deformable precipitates. In addition, the increase in size and reduction in volume fraction of the precipitates leads to a reduction in the magnitude of precipitation strengthening in both deformable and non-deformable precipitates.
  • It was found that the geometrical distribution of second phase particles throughout the microstructure might have limited impact on the macroscopic mechanical behavior of the material.

Author Contributions

The contribution of authors to this article are as follows, Conceptualization, A.A., T.P. and F.P.; Data curation, A.A., T.P. and S.N.T.; Formal analysis, A.A. and T.P.; Funding acquisition, F.P.; Investigation, A.A., T.P. and S.N.T.; Methodology, A.A., T.P., S.N.T. and F.P.; Project administration, F.P.; Resources, T.P. and F.P.; Software, A.A., T.P., S.N.T. and F.P.; Supervision, F.P.; Validation, A.A., T.P., S.N.T. and F.P.; Writing—original draft, A.A.; Writing—review and editing, A.A. and F.P. All authors have read and agreed to the published version of the manuscript.

Funding

This research received no external funding.

Data Availability Statement

Data sharing is not applicable to this article since it is part of an ongoing project.

Conflicts of Interest

The authors declare no conflict of interest.

References

  1. Gladman, T. Precipitation Hardening in Metals. Mater. Sci. Technol. 1999, 15, 30–36. [Google Scholar] [CrossRef]
  2. Liu, W.H.; Zeng, W.; Liu, F.S.; Tang, B.; Liu, Q.J.; Wang, W.D. The mechanical and electronic properties of o-Fe2C, h-Fe3C, t-Fe5C2, m-Fe5C2 and h-Fe7C3 compounds: First-principles calculations. Phys. B Condens. Matter. 2021, 606, 412825. [Google Scholar] [CrossRef]
  3. Anjabin, N.; Taheri, A.K.; Kim, H.S. Crystal plasticity modeling of the effect of precipitate states on the work hardening and plastic anisotropy in an Al-Mg-Si alloy. Comput. Mater. Sci. 2014, 83, 78–85. [Google Scholar] [CrossRef]
  4. Keshavarz, S.; Ghosh, S. Hierarchical crystal plasticity FE model for nickel-based superalloys: Sub-grain microstructures to polycrystalline aggregates. Int. J. Solids Struct. 2015, 55, 17–31. [Google Scholar] [CrossRef]
  5. Ali, M.A.; López-Galilea, I.; Gao, S.; Ruttert, B.; Amin, W.; Shchyglo, O.; Hartmaier, A.; Theisen, W.; Steinbach, I. Effect of γ′ precipitate size on hardness and creep properties of Ni-base single crystal superalloys: Experiment and simulation. Materialia 2020, 12, 100692. [Google Scholar] [CrossRef]
  6. Ali, M.A.; Görler, J.V.; Steinbach, I. Role of coherency loss on rafting behavior of Ni-based superalloys. Comput. Mater. Sci. 2020, 171, 109279. [Google Scholar] [CrossRef]
  7. Caron, P.; Khan, T. Improvement of Creep strength in a nickel-base single-crystal superalloy by heat treatment. Mater. Sci. Eng. 1983, 61, 173–184. [Google Scholar] [CrossRef]
  8. Li, Y.L.; Kohar, C.P.; Mishra, R.K.; Inal, K. A new crystal plasticity constitutive model for simulating precipitation-hardenable aluminum alloys. Int. J. Plast. 2020, 132, 102759. [Google Scholar] [CrossRef]
  9. Sigli, C.; De Geuser, F.; Deschamps, A.; Lépinoux, J.; Perez, M. Recent advances in the metallurgy of aluminum alloys. Part II: Age hardening. Comptes Rendus Phys. 2018, 19, 688–709. [Google Scholar] [CrossRef]
  10. Tanaka, K.; Mori, T. The hardening of crystals by non-deforming particles and fibres. Acta Metall. 1970, 18, 931–941. Available online: https://www.sciencedirect.com/science/article/pii/0001616070900209 (accessed on 18 July 2023). [CrossRef]
  11. Barlat, F.; Liu, J.; Weiland, H. On precipitate-induced anisotropy modeling in binary Al-Cu alloys. Mater. Sci. Forum. 1996, 217–222, 635–640. [Google Scholar] [CrossRef]
  12. Han, C.S.; Wagoner, R.H.; Barlat, F. On precipitate induced hardening in crystal plasticity: Theory. Int. J. Plast. 2004, 20, 477–494. [Google Scholar] [CrossRef]
  13. Bonfoh, N.; Carmasol, A.; Lipinski, P. Modeling of intra-crystalline hardening of materials with particles. Int. J. Plast. 2003, 19, 1167–1193. [Google Scholar] [CrossRef]
  14. Wang, J.; Jiang, W. Numerical assessment on fatigue damage evolution of materials at crack tip of CT specimen based on CPFEM. Theor. Appl. Fract. Mech. 2020, 109, 102687. [Google Scholar] [CrossRef]
  15. Li, M.; Hu, L.; Huang, W.; Yang, X.; Guo, F. Effects of T1/T2 precipitates on deformation behavior and microstructure evolution of AA2099 Al–Li alloy: Experimental investigation and crystal plasticity finite element modeling. J. Mater. Res. Technol. 2022, 17, 342–352. [Google Scholar] [CrossRef]
  16. Standard, ASTM E8/E8M–09; Standard Test Methods for Tension Testing of Metallic Materials. ASTM International: West Conshohocken, PA, USA, 2009. [CrossRef]
  17. Asgharzadeh, A.; Tiji, S.A.N.; Esmaeilpour, R.; Park, T.; Pourboghrat, F. Determination of hardness-strength and -flow behavior relationships in bulged aluminum alloys and verification by FE analysis on Rockwell hardness test. Int. J. Adv. Manuf. Technol. 2020, 106, 315–331. [Google Scholar] [CrossRef]
  18. Tiji, S.A.N.; Park, T.; Asgharzadeh, A.; Kim, H.; Athale, M.; Kim, J.H.; Pourboghrat, F. Characterization of yield stress surface and strain-rate potential for tubular materials using multiaxial tube expansion test method. Int. J. Plast. 2020, 133, 102838. [Google Scholar] [CrossRef]
  19. Asgharzadeh, A.; Tiji, S.A.N.; Park, T.; Kim, J.H.; Pourboghrat, F. Cellular automata modeling of the kinetics of static recrystallization during the post-hydroforming annealing of steel tube. J. Mater. Sci. 2020, 55, 7938–7957. [Google Scholar] [CrossRef]
  20. Groeber, M.A.; Jackson, M.A. DREAM.3D: A Digital Representation Environment for the Analysis of Microstructure in 3D. Integr. Mater. Manuf. Innov. 2014, 3, 56–72. Available online: http://www.immijournal.com/content/3/1/5 (accessed on 18 July 2023). [CrossRef] [Green Version]
  21. Bachmann, F.; Hielscher, R.; Schaeben, H. Texture analysis with MTEX-Free and open source software toolbox. Solid State Phenom. 2010, 160, 63–68. [Google Scholar] [CrossRef] [Green Version]
  22. Asgharzadeh, A.; Tiji, S.A.N.; Park, T.; Pourboghrat, F. Prediction of softening kinetics and recrystallization texture in non-isothermally annealed bulged tubes using CPFEM and CA models. Mater. Sci. Eng. A 2022, 832, 142308. [Google Scholar] [CrossRef]
  23. Tiji, S.A.N.; Asgharzadeh, A.; Park, T.; Whalen, S.A.; Reza-E-Rabby, M.; Eller, M.; Pourboghrat, F. Microstructure and mechanical properties of the AA7075 tube fabricated using shear assisted processing and extrusion (ShAPE). Arch. Civ. Mech. Eng. 2021, 21, 1–10. [Google Scholar] [CrossRef]
  24. Zamiri, A.R.; Pourboghrat, F. A novel yield function for single crystals based on combined constraints optimization. Int. J. Plast. 2010, 26, 731–746. [Google Scholar] [CrossRef]
  25. Park, T.; Hector, L.G.; Hu, X.; Abu-Farha, F.; Fellinger, M.R.; Kim, H.; Esmaeilpour, R.; Pourboghrat, F. Crystal plasticity modeling of 3rd generation multi-phase AHSS with martensitic transformation. Int. J. Plast. 2019, 120, 1–46. [Google Scholar] [CrossRef]
  26. Kocks, U.F. Laws for Work-Hardening and Low-Temperature Creep. J. Eng. Mater. Technol. 1976, 98, 76–85. [Google Scholar] [CrossRef]
  27. Bergsmo, A.; Dunne, F.P.E. Competing mechanisms of particle fracture, decohesion and slip-driven fatigue crack nucleation in a PM nickel superalloy. Int. J. Fatigue 2020, 135, 105573. [Google Scholar] [CrossRef]
  28. Zhang, Y.; Li, J.; Shen, F.; Zheng, J.; Li, T.; Han, W.; Münstermann, S.; Huang, S. Microstructure-property relationships in HPDC Aural-2 alloy: Experimental and CP modeling approaches. Mater. Sci. Eng. A 2022, 848, 143364. [Google Scholar] [CrossRef]
  29. Mapar, A.; Ghassemi-Armaki, H.; Pourboghrat, F.; Kumar, K.S. A differential-exponential hardening law for non-Schmid crystal plasticity finite element modeling of ferrite single crystals. Int. J. Plast. 2017, 91, 268–299. [Google Scholar] [CrossRef] [Green Version]
  30. Du, C.; Maresca, F.; Geers, M.G.D.; Hoefnagels, J.P.M. Ferrite slip system activation investigated by uniaxial micro-tensile tests and simulations. Acta Mater. 2018, 146, 314–327. [Google Scholar] [CrossRef]
  31. Smallman, R.E.; Bishop, R.J. Strengthening and toughening. Mod. Phys. Metall. Mater. Eng. 1999, 259–296. [Google Scholar] [CrossRef]
  32. Dobosz, R.; Lewandowska, M.; Kurzydlowski, K.J. FEM modelling of the combined effect of grain boundaries and second phase particles on the flow stress of nanocrystalline metals. Comput. Mater. Sci. 2012, 53, 286–293. [Google Scholar] [CrossRef]
Figure 1. The employed displacement boundary conditions used to simulate the virtual tensile test on a developed 3D RVE model.
Crystals 13 01199 g001
Figure 2. The inverse pole figures collected from (a) axial and (b) hoop cross-sections of the as-received tube. The approximate positions corresponding to each EBSD measurement is shown in the schematic drawing.
Crystals 13 01199 g002
Figure 3. (a) The OM image from the hoop cross-section of the as-received ferritic low carbon steel, and (b) the corresponding analyzed result with the Dream.3D image processing toolbox, in which the particles are shown in red.
Crystals 13 01199 g003
Figure 4. Finite element mesh of the reconstructed microstructure of the as received material, consisting of the matrix phase ferrite and the second phase particles.
Crystals 13 01199 g004
Figure 5. The grain size distribution of the constructed RVE model, as shown in Figure 4, compared to the corresponding experimental data obtained from EBSD measurement.
Crystals 13 01199 g005
Figure 6. The comparison of the pole figure in matrix phase; (a) computed from the constructed RVE model as shown in Figure 4, and (b) the corresponding measured experimental data.
Crystals 13 01199 g006
Figure 7. The calibrated flow curve obtained from virtual tensile test on the RVE model depicted in Figure 4 compared to the experimental uniaxial tensile data.
Crystals 13 01199 g007
Figure 8. The generated RVE models in order to implement the homogenization scheme for the effect of precipitation strengthening, corresponding to (a) homogenization-RVE with precipitates (Step 1), and (b) homogenization-RVE without precipitates (Step 2).
Crystals 13 01199 g008
Figure 9. The calibrated flow curve obtained for every step of the homogenization scheme for the effect of precipitation strengthening compared to the experimental uniaxial tensile data.
Crystals 13 01199 g009
Figure 10. (a) The constructed RVE model based on the as-received tube excluding precipitates to obtain a homogenized flow curve (Step 3). The corresponding (b) grain size distribution and (c) pole figure are also illustrated.
Crystals 13 01199 g010
Figure 11. The comparison between the flow curves obtained from the CPFEM simulation of tensile testing and the corresponding experimental data.
Crystals 13 01199 g011
Figure 12. The constructed RVE model to study the effect of second phase particles on the mechanical properties. The RVE model is comprised of single grain matrix and second phase particles with a size and volume fraction of 0.26 μm and 0.025, respectively.
Crystals 13 01199 g012
Figure 13. Effect of the mechanical behavior of second phase precipitates on the macroscopic properties: (a) deformable precipitates with elasto-plastic behavior and (b) non-deformable precipitates with elastic behavior.
Crystals 13 01199 g013
Figure 14. The manipulated elasto-plastic behavior of precipitates by increasing the yield strength of the base material at different precipitate to base strength ratios (P/B).
Crystals 13 01199 g014
Figure 15. Effect of the (a) size and (b) volume fraction according to Table 5 on macroscopic mechanical properties, assuming non-deformable precipitate behavior.
Crystals 13 01199 g015
Figure 16. Effect of the (a) size and (b) volume fraction according to Table 5 on the macroscopic mechanical properties, assuming deformable precipitate behavior.
Crystals 13 01199 g016
Figure 17. The sensitivity of the macroscopic strength to the size and volume fraction of precipitates, considering both deformable and non-deformable precipitate behaviors.
Crystals 13 01199 g017
Figure 18. The RVE models with different distribution of non-deformable precipitates throughout the microstructure, in which (a) 0% and (b) 50% of precipitates are placed on the grain boundaries.
Crystals 13 01199 g018
Figure 19. Effect of the distribution of non-deformable precipitates throughout the RVE on the macroscopic mechanical properties.
Crystals 13 01199 g019
Table 1. The material constants used in CPFEM model [22,25].
ParameterValue
TypeBCC
c 11 231 GPa
c 12 135 GPa
c 44 116 GPa
μ69.3 GPa
b2.48 × 10−4 μm
Table 2. The obtained calibration parameters for dislocation density-based CP model.
ParameterValue
τ 0 5 MPa
  H α 0.17
ρ 0 α 0.1/μm2
k a 186
k b 0.009 μm
Table 3. The obtained calibration parameters for dislocation density-based CP model through the homogenization scheme for the effect of precipitation strengthening.
ParameterStep 1Step 2Step 3
τ 0 120 MPa120 MPa5 MPa
  H α 000.19
ρ 0 α 0.1/μm20.1/μm20.1/μm2
k a 338180180
k b 0.005 μm0.009 μm0.009 μm
Table 4. The structure and elastic properties of the Fe-C compounds generally found in carbon steels [2].
CompoundCrystal StructureElastic Modulus (GPa)Poisson’s Ratio
Fe2COrthorhombic171.20.34
Fe3CHexagonal327.580.334
Fe5C2Triclinic193.510.351
Fe5C2Monoclinic323.450.348
Fe7C3Hexagonal227.440.336
Table 5. The summary of the RVE models generated to study the effect of the size and volume fraction of precipitates on macroscopic properties.
Case #Eq. Diameter of Particles (µm)Volume Fraction of Particles
Case 1N/A0
Case 20.260.025
Case 30.440.025
Case 40.610.025
Case 50.260.05
Case 60.260.1
Disclaimer/Publisher’s Note: The statements, opinions and data contained in all publications are solely those of the individual author(s) and contributor(s) and not of MDPI and/or the editor(s). MDPI and/or the editor(s) disclaim responsibility for any injury to people or property resulting from any ideas, methods, instructions or products referred to in the content.

