Article

Microstructural Control by Cooling Rate in β-type and Sintered Ti-3.6Fe-5Zr-0.2B (Mass%) Alloy Fabricated by Spark Plasma Sintering and Heat Treatment

Department of Mechanical Engineering, Nagaoka University of Technology, 1603-1 Kamitomioka, Nagaoka 940-2188, Japan
*
Author to whom correspondence should be addressed.
Crystals 2023, 13(8), 1184; https://doi.org/10.3390/cryst13081184
Submission received: 21 June 2023 / Revised: 4 July 2023 / Accepted: 25 July 2023 / Published: 29 July 2023

Abstract

:
The β-type and sintered Ti-3.6Fe-5Zr-0.2B (mass%) alloy has been consolidated by spark plasma sintering, followed by a β solution treatment (ST). In order to obtain a high-strength ductile balance, water quenching or air cooling is used after ST. Modification of sintering conditions, which leads to 100% of the relative density, improves the tensile ductility. The Fe addition causes a large local lattice and compressive strain to the bcc Ti lattice; in the water-quenched sample, α” martensite phases appear in the β matrix. When air cooling is applied after the ST, bimodal α lath phases are instead precipitated during the cooling in nanoscale, and the formation of α” martensite phases is suppressed. This results in high strength and better ductility when compared with those in the water-quenched sample, particularly in tensile properties. The air-cooled sample reveals attractive mechanical properties in both tension and compression modes.

1. Introduction

It is widely accepted that certain fabrication processes, including a sponge production of pure Ti, vacuum arc remelting of an alloy, an ingot breakdown above a β-transus temperature, hot forging, heat treatment, and machining in the case of forging products, are very complex when it comes to obtaining Ti alloys based on the casting and plastic deformation processes [1]. These processes are very complicated, and as such, production costs are increased as a result of the need to control the amounts of remaining oxygen content. Ideally, the number of processes should be decreased as long as possible, and simultaneous microstructural controls must be carefully considered.
The spark plasma sintering (SPS) process (or pulsed electric current sintering) is one of the attractive processes for fabricating Ti alloys. It can produce a bulk-sintered sample in a very short time (e.g., 600 s) and with low costs related to the running of the instrument, control of grains and their growth, homogeneity, binder, and high density [2,3]. In addition to those benefits, the ingot breakdown after the melting of Ti alloys can also be avoided, although this process is usually inevitable when seeking to obtain uniform, non-dendritic and globular microstructures using the casting technologies. SPS utilizes a pulsed electric current discharge with applied pressure, leading to interparticle contacts with melting and/or vaporization due to the Joule heating. This assists in the formation of necking between powder particles [4]. An advantage of SPS is the ability to be able to select a blended elemental (BE) or pre-alloyed (PA) method; the former is cost-effective as the separate powders are mixed, and the initial hardness of the powder is low [5]. The shape of the powders is less limited; this is to say that we can accept irregular and non-spherical shapes. This means that new Ti alloys can be designed relatively easily through SPS with only a few processes required. The usage of SPS might also be advantageous when compared with that of a counterpart, additive manufacturing (3D printer); SPS can choose the shape of the powder from limited types and numbers of powders due to their high costs, sluggish processes, and resultant characteristic microstructures.
The fabrication of Ti alloys by SPS has been reported previously. Using ball milling with SPS, Babu et al. fabricated a Ca-bearing Ti-6Al-4V (mass%) alloy. The alloy consisted of α and β phases, and the ultimate tensile strength (σUTS), yield strength (σy), and elongation (εf) were 1153 MPa, 964 MPa, and 15%, respectively [6]. Liu et al. reported that a Ti-Nb-Fe-Co-Al or a Ti-Nb-Cu-Ni-Al alloy with amorphous powder, which was produced by ball milling, was sintered by SPS. The highest σUTS, σy, and εf were 2300 MPa, 1892 MPa, and 19.5%, respectively [7]. Sim et al. reported that by using PA, a Ti-22Al-25Nb (mol%) alloy powder was ball milled and then sintered using SPS. The highest mechanical properties of σUTS, σy, and εf were 1105 MPa, 1092 MPa, and 9.4%, respectively [8]. Bahador et al. fabricated a Ti-35Ta (mol%) alloy with ball milling, SPS, and hot forging. The alloy possessed α and α” phases in β matrix; the σUTS, σy, and εf were 868 MPa, 828 MPa, and 8.5%, respectively [9]. Other reports on the mechanical properties of Ti alloys sintered by SPS were well organized in a reference study [10]. Although these reports show excellent mechanical properties derived from using SPS, the used processes are very complex due to the usage of ball milling and other plastic deformation techniques, and hence the production costs are increased. In general, the usage of such plastic deformations promotes recrystallization, texture development, and/or closure of pores when the alloy is deformed at high temperatures, resulting in improved mechanical properties. As such, we believe that a fundamental study on the mechanical property measurements for spark plasma sintered and as solution-treated states without any additional processes is necessary.
When we consider the material cost and its position as a sustainable resource, Fe is a very attractive element. Its relative abundance in the earth’s crust is 5 mass% [11]. We fabricated a Ti-5Fe-5Zr (mass%) alloy using SPS while taking into consideration its age hardenability [12]. Before our report, Fe-bearing Ti alloys had been developed (the related references were included in [12]), but our usage of SPS and a solution treatment without other processing for the Ti-Fe alloy systems was a new approach. Fe is a β stabilizer, while Zr is known as a weak β stabilizer [13]; hence, the alloy is a β-type Ti alloy. It showed age hardenability when it was measured at 913 K (640 °C) to avoid the formation of the TiFe compound, according to a Ti-Fe binary equilibrium phase diagram, and the peak hardness was obtained due to dispersions of thermal ω phases. Despite the fact that it had a high Vickers hardness of 513 at 20 s of aging, the nominal stress–strain curve revealed a fracture during the elastic deformation regime. We also investigated the effect of a B addition in the developed Ti-5Fe-5Zr alloy; the results were summarized in reference [14]. B was added as TiB2 powder, which was then transformed to TiB (space group of Pnma and lattice parameters of a = 0.612 nm, b = 0.306 nm, and c = 0.456 nm [15]) when SPS was applied, leading to grain refinement of the β matrix due to the Zenner drag [16]. Then, we selected a Ti-5Fe-5Zr-0.75B (mass%) alloy for the hardness measurement and microstructural observations.
Microstructural controls for Ti alloys are very complicated. They depend on the prior working processes (i.e., accumulated strains), heat treatment temperature (β, β-transus or α + β regime), and cooling rates. Depending on the type of processing, such as rolling or forging, those conditions and combinations are used to fabricate desired microstructures [1]. When SPS was considered, we decided to reduce the number of used processes in view of the total cost and simplicity. Subsequently, we had parameters of (1) a type of powder, (2) SPS conditions, and (3) preceding heat treatment conditions. In terms of the heat treatment conditions, we used water quenching after a solution treatment in order to obtain the β phase with a supersaturated solid solution to enhance the age hardenability [12]. However, the tensile ductility was insufficient, as mentioned above. It was reported that in a Ti-5Al-2Fe-3Mo (mass%) alloy, the cooling rate after a solution treatment affected the mechanical properties [17]. Providing that water quenching was used, the 0.2% proof stress was reduced, while air cooling led to the high 0.2% proof stress and sufficient elongation.
Thus, in this study, fundamental mechanical properties obtained by only SPS using a BE method and solution treatment without other plastic deformation processes were evaluated for a modified Ti-3.6Fe-5Zr-0.2B (mass%) alloy. The cooling rate after the solution treatment was controlled by water quenching or air cooling. The obtained microstructures were identified by electron backscatter diffraction (EBSD) and transmission electron microscopy (TEM) so as to clarify the structure-property relationship.

2. Materials and Methods

The Ti-3.6Fe-5Zr-0.2B (Ti-3.2Fe-2.7Zr-0.9B, mol%) alloy was used. Pure Ti (99.9%, particle size ≤ 45 μm, Kojundo Chemical Laboratory, Co., Ltd., Sakado, Japan), Fe (99.9%, particle size ≤ 53 μm, Kojundo Chemical Laboratory, Co., Ltd., Sakado, Japan), Zr (98.8%, particle size ≤ 6.5 μm, Osaka Asahi Co., Ltd., Osaka, Japan), and TiB2 (99%, particle size ≤ 3 μm, Kojundo Chemical Laboratory, Co., Ltd., Sakado, Japan) powders were mixed for 8.64 ks (24 h) in a Y-shaped glass tube in an Ar atmosphere in a glove box. The mixed powders were set in a middle-strength graphite die. SPS was then conducted by a Sinter Land LABOX-1550i75s SPS machine (Nagaoka, Japan) under a mechanical pressure of 75 MPa, sintering temperature of 1273 K (1000 °C), and duration time of 1.2 ks (20 min) in a vacuum below 6 Pa. These SPS conditions were reexamined compared to those in reference [12] in order to reduce remaining pores. The sintered sample size was a diameter of 50 mm and a height of 8 mm, and thus the shape is a disk. Then, the samples were cut using a diamond saw for the following experiments. The relative density of the sintered sample was evaluated by the Archimedes method with pure ethanol (99.5%) at ambient temperature. The sintered samples were sealed in a quartz tube under an Ar atmosphere, and a solution treatment was applied at 1323 K (1050 °C) for 7.2 ks (2 h) in a muffle furnace. The cooling after the solution treatment was controlled by water quenching or air cooling.
Tensile specimens with a gauge length of 10 mm and a cross-section having a width of 4 mm and a thickness of 5 mm, and compressive specimens with a length of 9.6 mm and a diameter of 4.8 mm were prepared from the disk sample. The tensile and compressive specimens were prepared, following the ASTM E8 standard with a scale factor of 1/5 and ASTM E9-09 standard with a scale factor of 1/2.6, respectively, using an electrical discharge machine. The tensile and compressive directions were perpendicular to the compression direction of the sintering. The tensile and compressive tests were performed using an Instron 3382 universal testing machine (Instron Japan, Kawasaki, Japan) with an Instron 2663-902 non-contacting video extensometer in the air at room temperature. The initial strain rates of 1.7 × 10⁻⁴ and 4.2 × 10⁻⁴ s−1 for the tensile and compressive tests were used, respectively.
Microstructures were observed using a Hitachi SU8230 field-emission scanning electron microscope (FESEM, Hitachi High-Tech Tokyo, Japan) operated at 15 kV and an Oxford Instruments NordlysNano EBSD system (Tokyo, Japan), and the results were analyzed by Oxford AZtecHKL v3.1 software. The used step sizes were 1 and 0.05 μm in the water-quenched and air-cooled samples, respectively. TEM thin foils were prepared by a Gatan Model 691 precision ion milling polishing system (Pleasanton, CA, USA). TEM observations were performed using a JEOL JEM-2100F transmission electron microscope (FETEM, Tokyo, Japan) operated at 200 kV. High-angle annular dark field scanning transmission electron microscopy (HAADF-STEM) observations and energy-dispersive X-ray (EDX) spectroscopy analyses with a JEOL JED-2300T EDX spectrometer (Tokyo, Japan) equipped with FETEM were performed.

3. Results

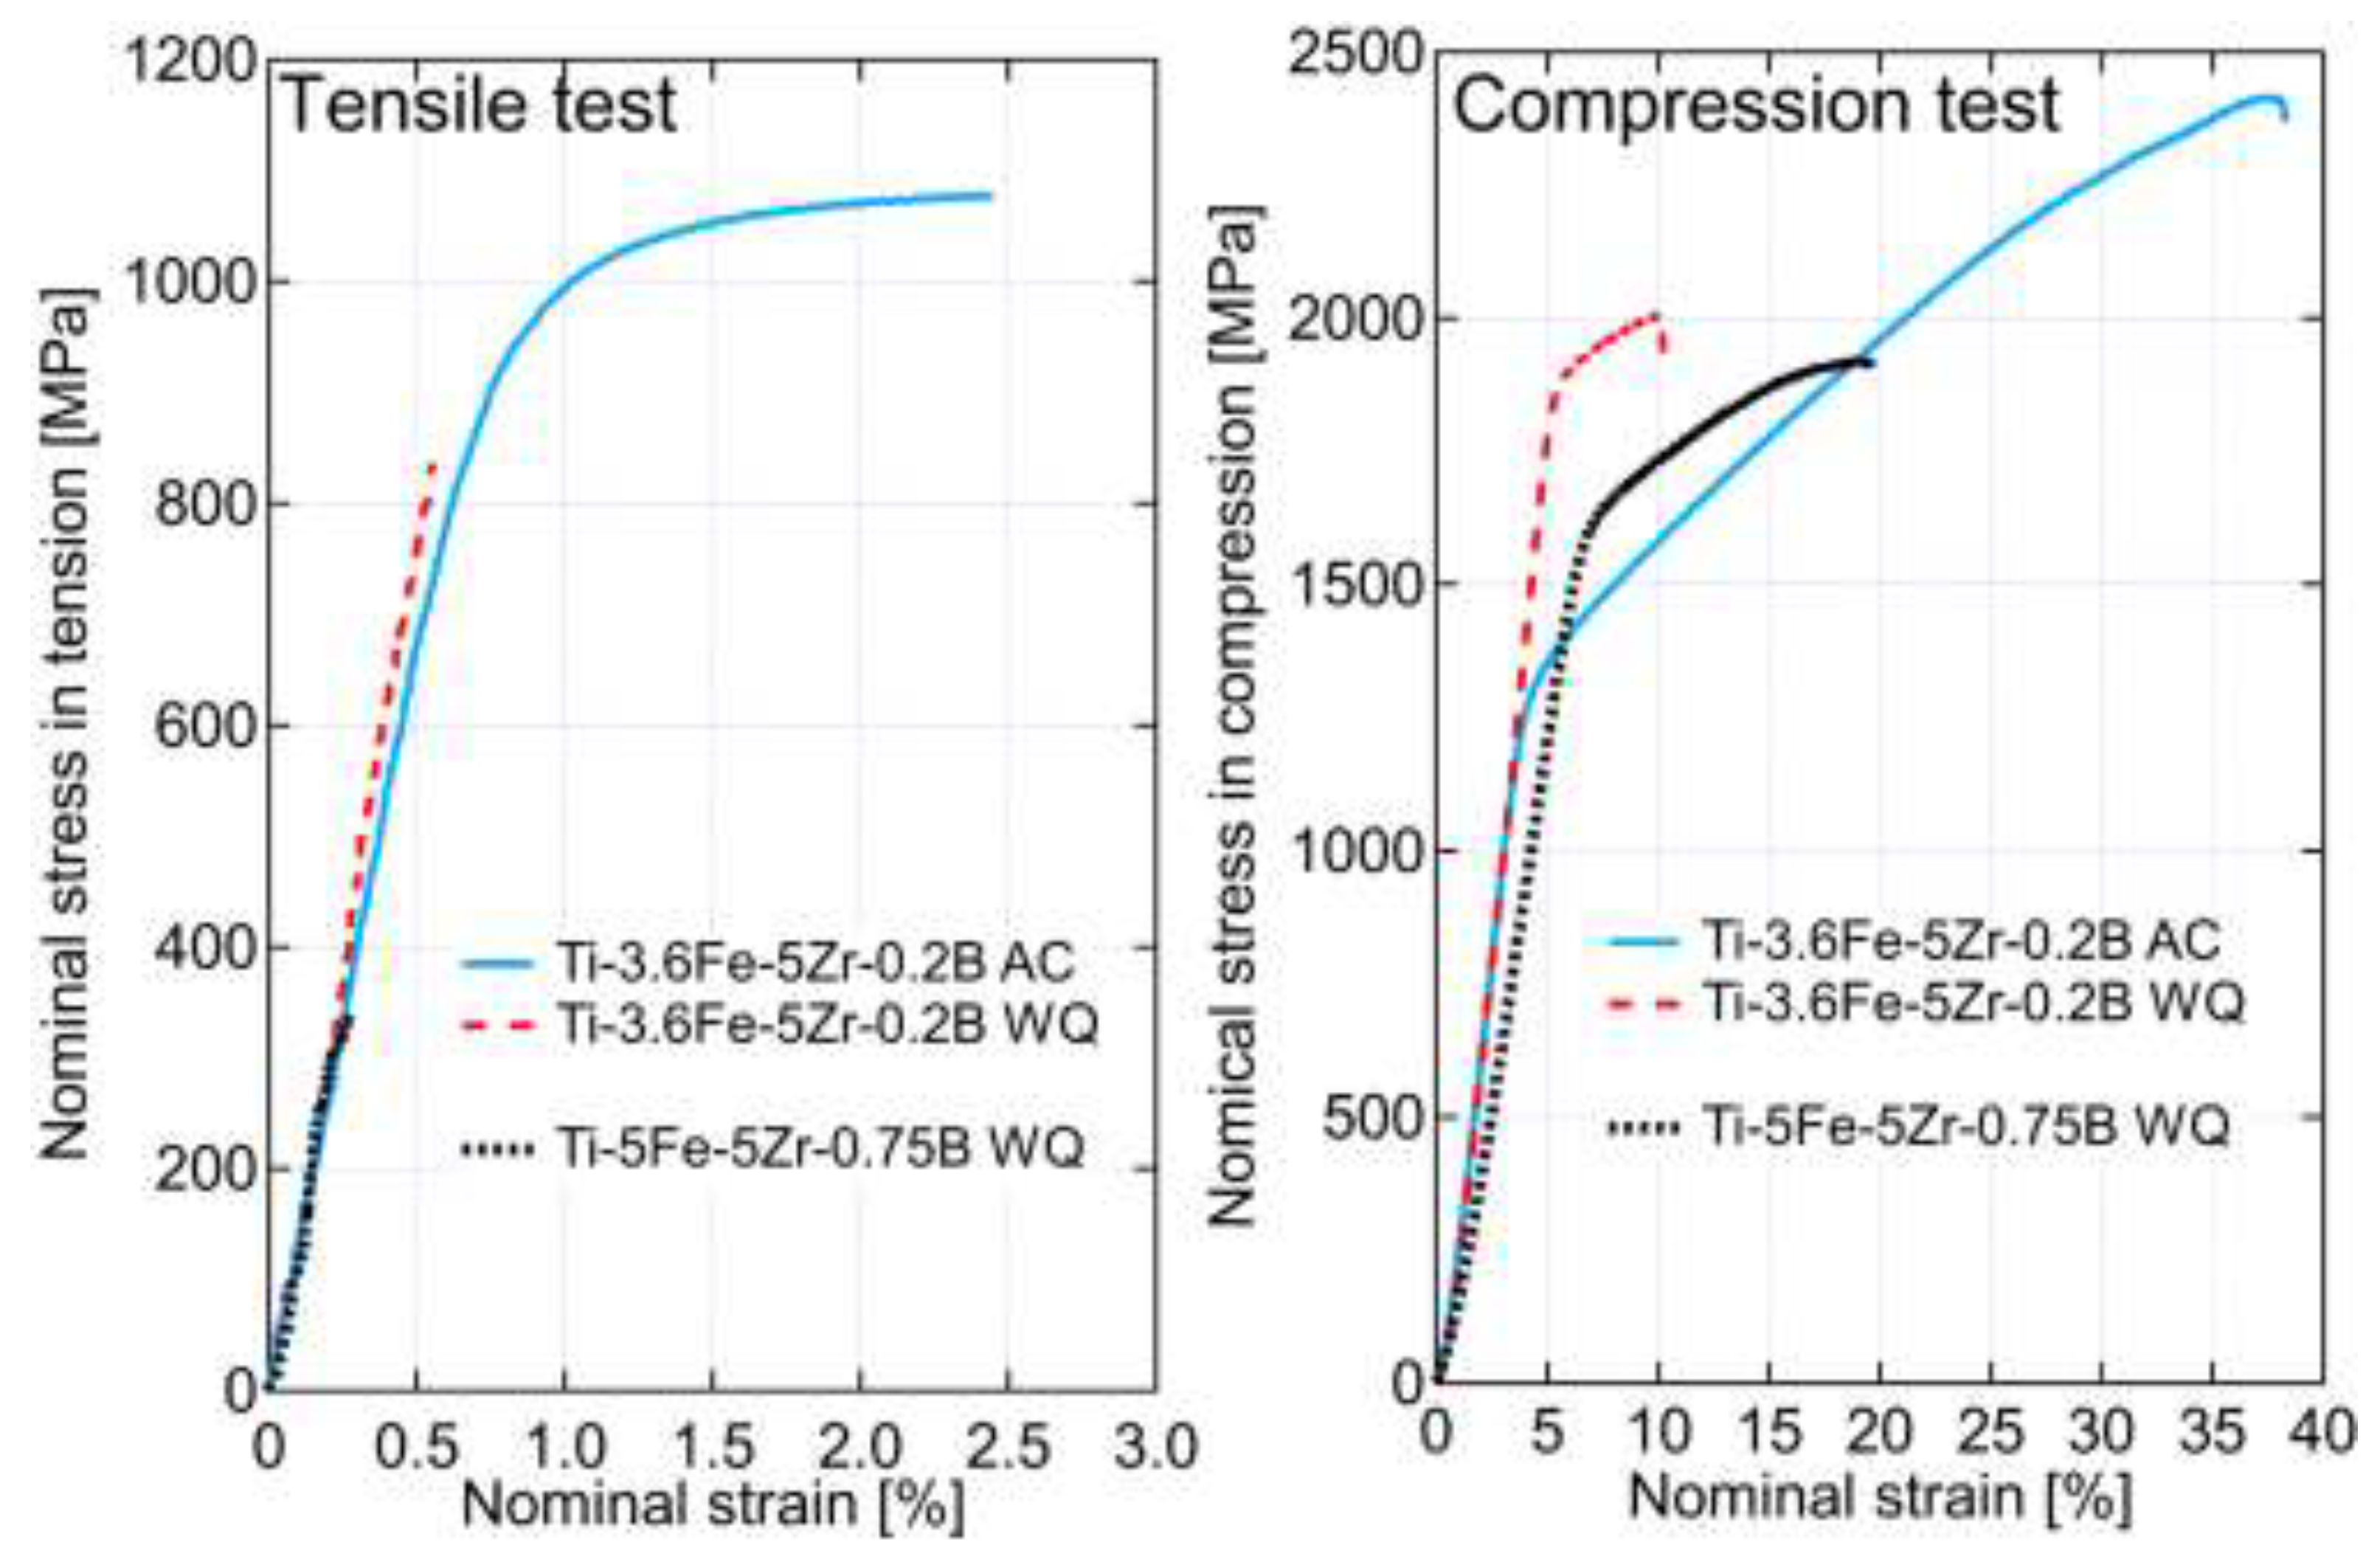
3.1. Relative Density and Nominal Stress–strain Curves

Table 1 shows the relative density of the sintered Ti-3.6Fe-5Zr-0.2B alloy. The relative density of 100% was achieved after sintering. In the previous SPS conditions [12], the mechanical pressure, sintering temperature, and duration time for the SPS were 50 MPa, 973 K (700 °C), and 300 s (5 min), respectively. It is well-accepted that the remaining pores are unavoidable if the sintering conditions are improper [18]. The densification requires adequate creep deformation during the sintering [19]. In particular, the sintering temperature affects the rate of densification [20], leading to low porosities. Thus, the change in the sintering conditions promotes mass transportation and grain boundary diffusions, resulting in the high density of the SPS sample.
Figure 1 depicts nominal stress–strain curves in the tensile and compressive tests of the investigated alloy. For comparison, results of the previous Ti-5Fe-5Zr-0.75B alloy are also given. As mentioned earlier, the tensile elongation of the Ti-5Fe-5Zr-0.75B alloy was insufficient when the alloy was water quenched after solution treatment at 1273 K (1000 °C) for 5 h [14]. Hence, the specimen was fractured within the elastic deformation region. Since Fe plays a role in causing high strains within the βTi matrix as described later and B disperses relatively large TiB compounds mostly at grain boundaries, the contents of those alloying elements in the alloy are decreased in the Ti-3.6Fe-5Zr-0.2B alloy. By contrast, the 0.2% proof stress in tension (σ0.2T) is increased in the water-quenched (WQ) Ti-3.6Fe-5Zr-0.2B alloy in addition to the 0.2% proof stress in compression (σ0.2C), but it is still fractured within the elastic deformation region during the tensile test. It is then realized that the cooling rate used was inappropriate for the sintered Ti-3.6Fe-5Zr-0.2B alloy. Consequently, air cooling was instead applied after the solution treatment. The results are shown in Table 2. The air-cooled (AC) sample exhibits high strength and elongation in the tensile test compared to the tensile properties of the WQ samples. σ0.2T and an elongation to failure in tension (εfT) are 977 MPa and 1.7%, respectively, in the AC sample. The air cooing leads to a better elongation in tension, while σ0.2C decreases compared with that of the WQ Ti-3.6Fe-5Zr-0.2B alloy. The yield anisotropy defined by σ0.2C0.2T becomes 1.3. Thus, it is found that the slow cooling rate improves the mechanical properties.

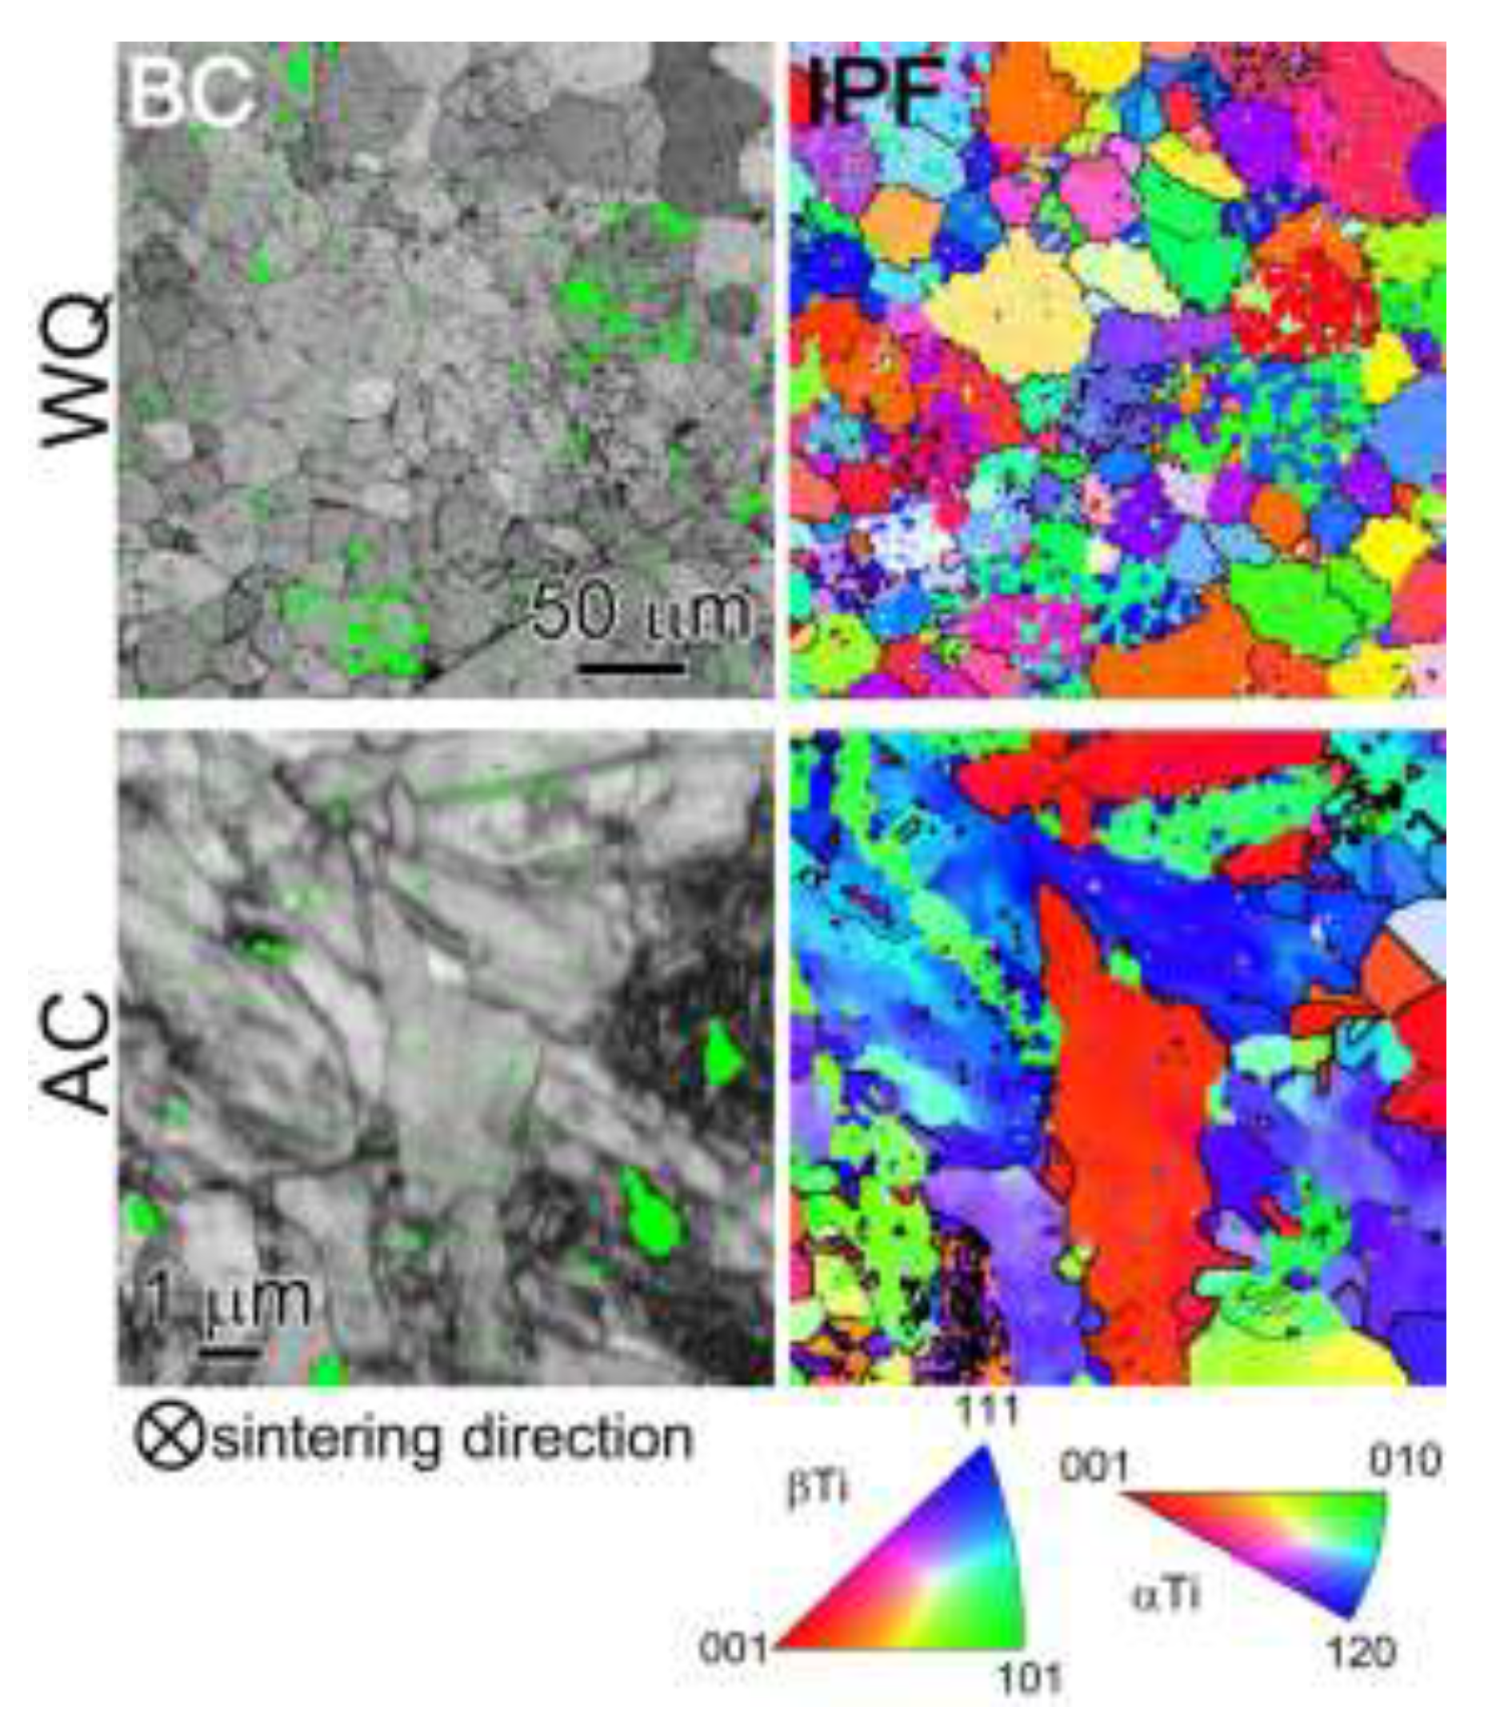
3.2. Constitutive Phases

Microstructural observations, of which directions were parallel to the sintered direction, were carried out for the WQ and AC samples. The results are given in Figure 2. BC and IPF stand for a band contrast image and inverse pole figure map, respectively. As reported previously [12], the as-quenched microstructure after water quenching reveals equiaxed microstructures mainly composed of a globular β phase without an ingot breakdown. The average grain diameter is 11.9 ± 5.6 μm. On the other hand, when the cooling rate is slow, precipitations of α phases start during the cooling. This leads to fine dispersions of the lath α phases. Thus, both coarse and fine microstructures coexist in the AC sample. The different cooling rates lead to different grain sizes so that the grain size can increase, particularly in the AC sample, due to a relatively longer diffusion time during the cooling. The green color in the BC image is a crystal phase color for TiB, whose crystal structure is identified as an orthorhombic structure, as discussed in the introduction part. It is superimposed on both the BC image and the IPF map. TiB is relatively uniformly dispersed in the β matrix in both samples, though some TiB compounds are locally agglomerated. The IPF maps do not show any texture developments. It is in conformity with our previous report [12].

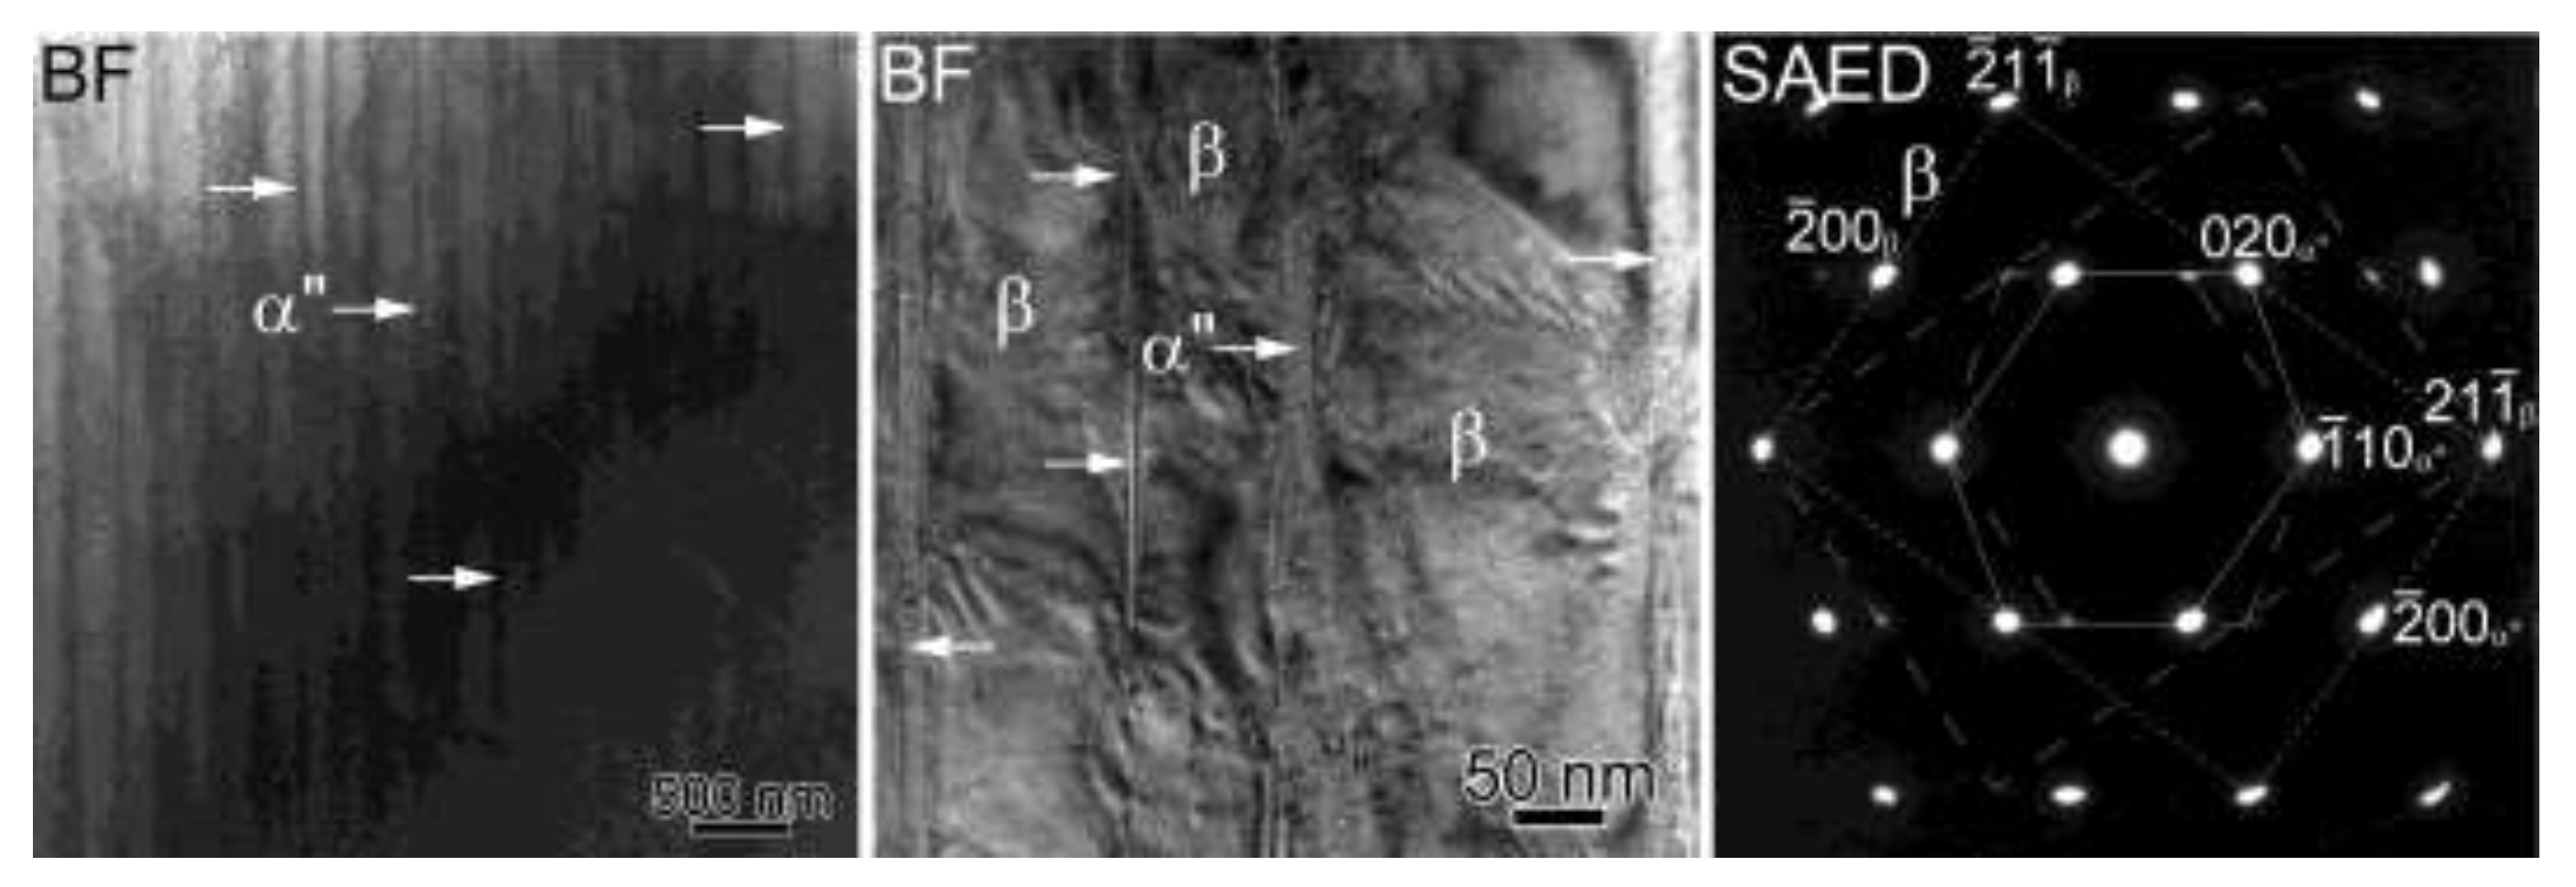
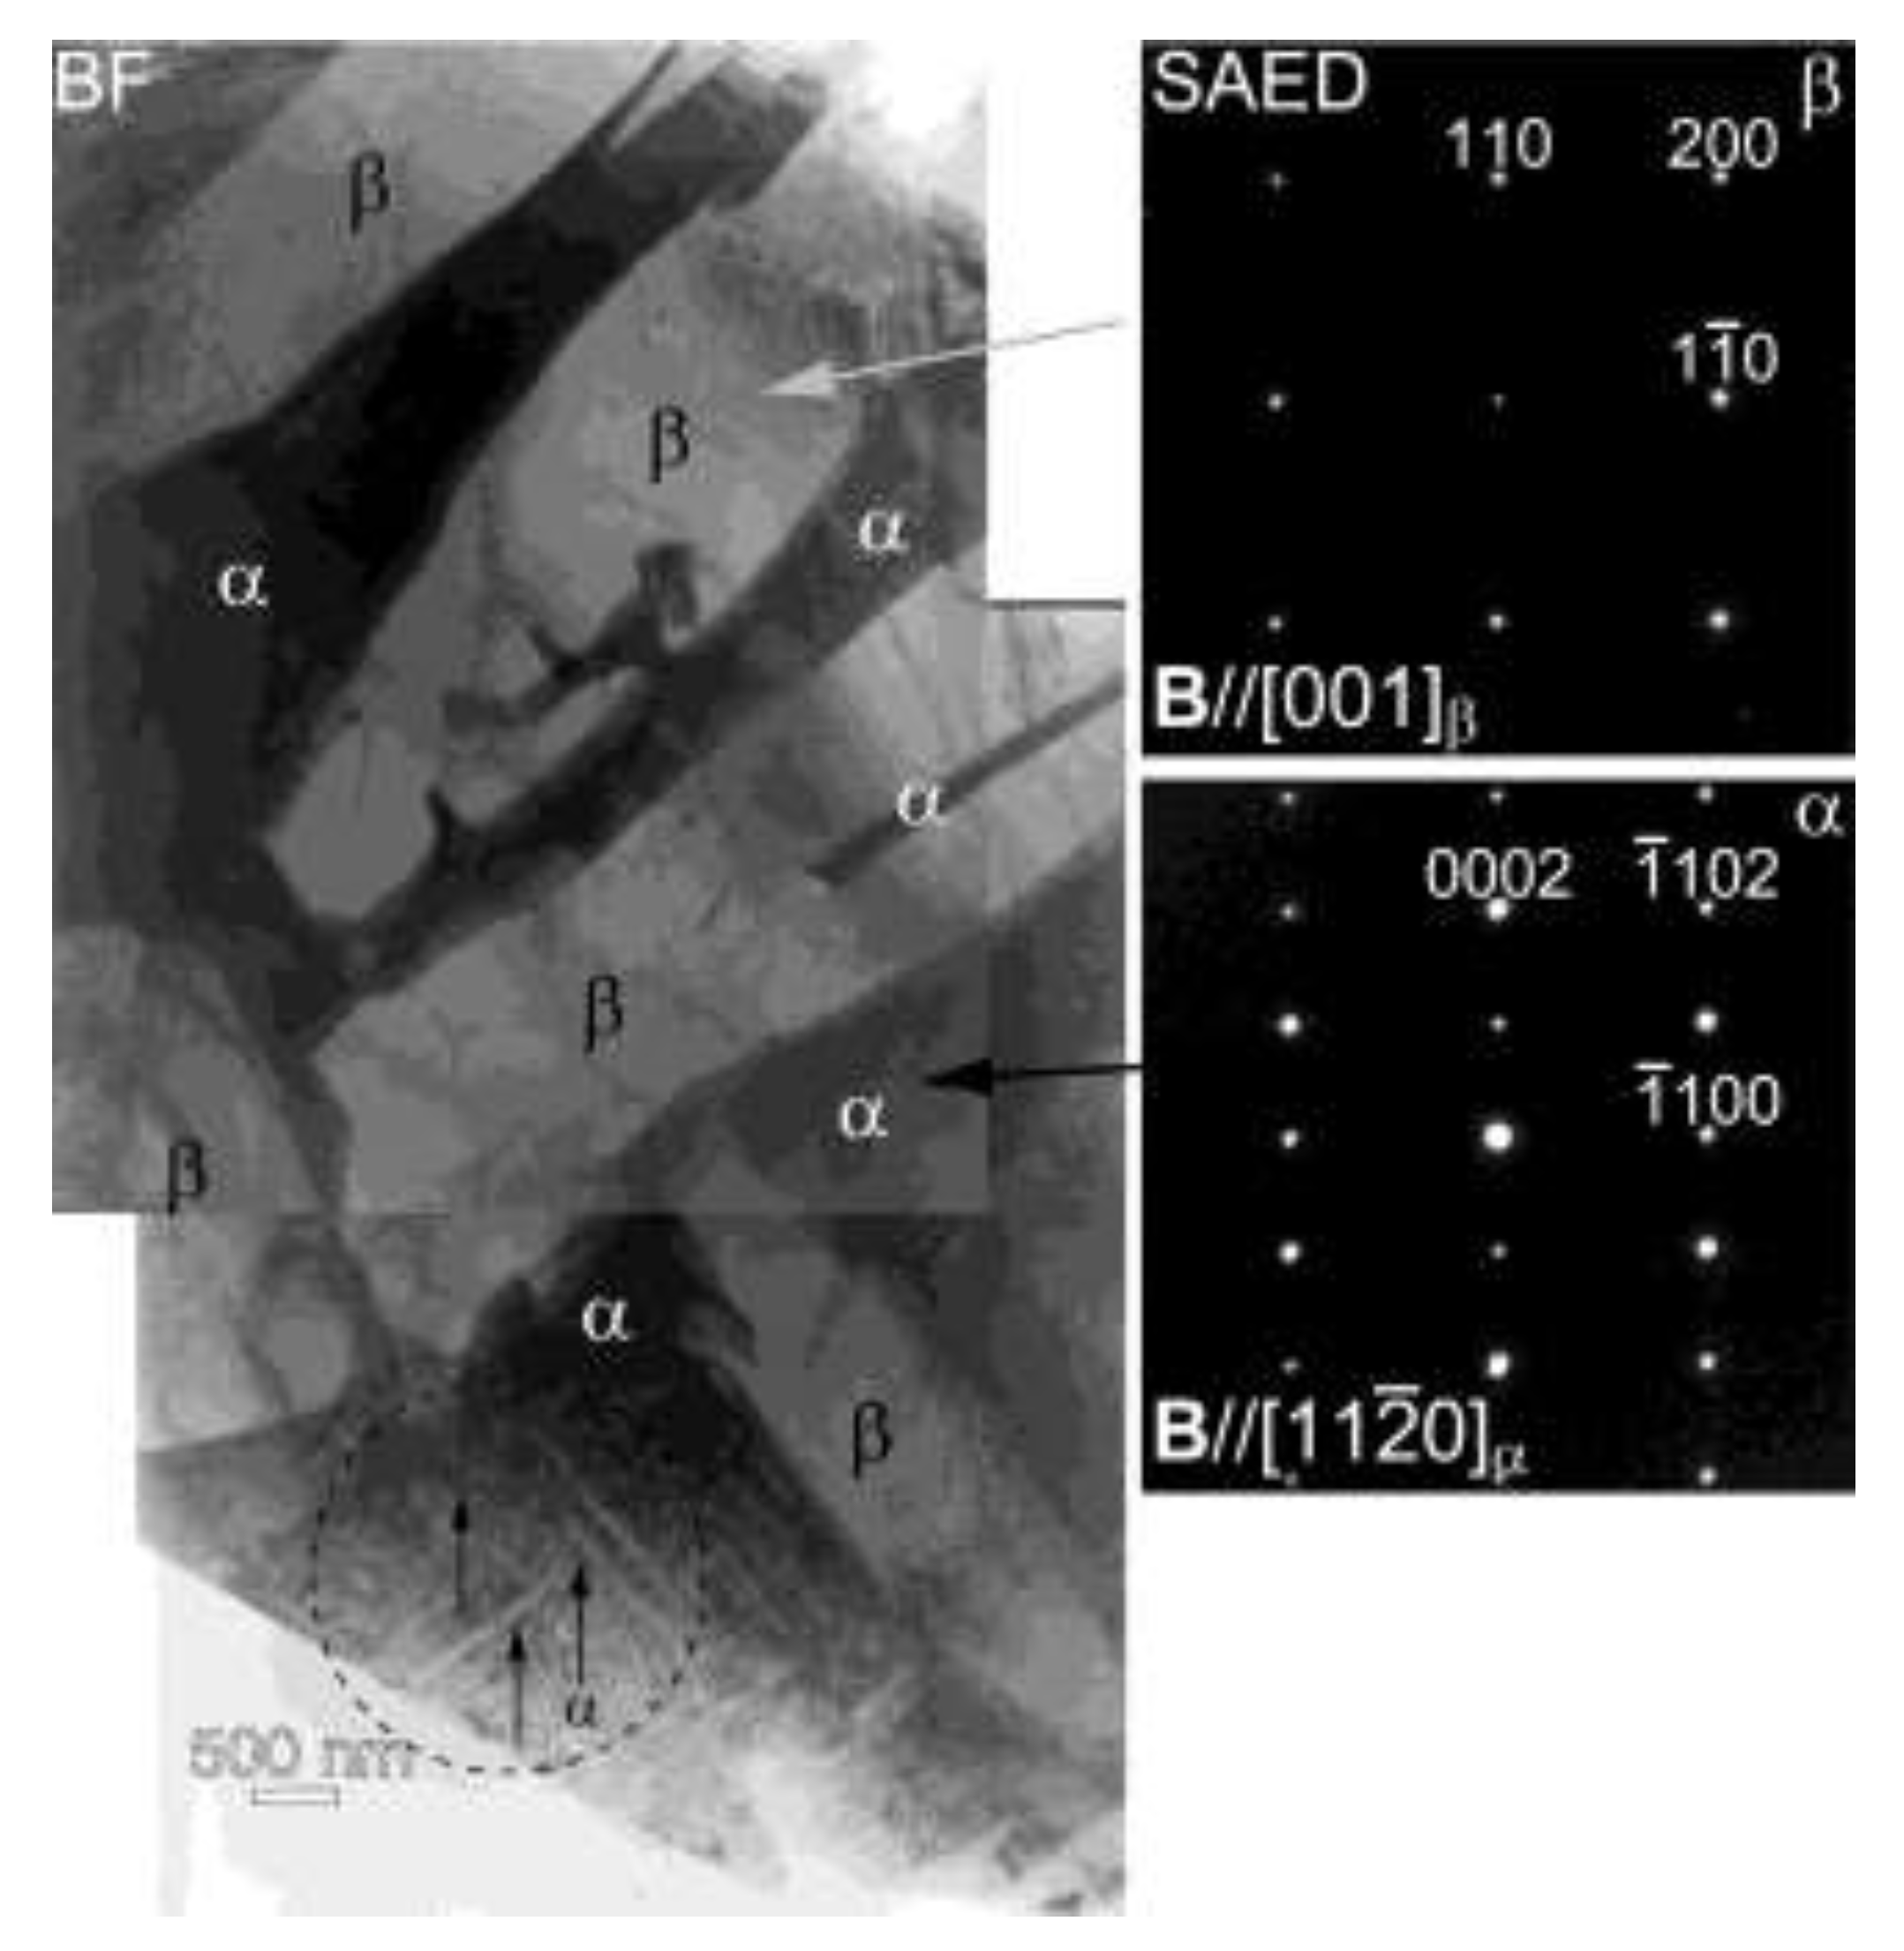
3.3. TEM Nanostructures

The nanostructures were analyzed by TEM. The results are shown in Figure 3 for the WQ sample. Nevertheless, although the β grains were only visible in the IPF map shown in Figure 2, indeed fine lath-shaped phases appeared in the β matrix as shown in the low and high magnification bright field (BF) images. The structure is determined using the selected area electron diffraction (SAED) pattern. It is identified as an α” martensitic phase [21]; the space group of Cmcm and lattice parameters of a = 0.310 nm, b = 0.488 nm, and c = 0.470 nm [15,22]. It can be confirmed as a twinning of the α” phases in the SAED pattern. Such a twinning can usually occur when the martensitic transformation takes place, and the remaining strains can be accommodated by the presence of the twins.
Meanwhile, Figure 4 shows the nanostructures of the AC sample. The BF images reveal coarse α phases, which are embedded in the β matrix. Such α phase formations are not confirmed in the WQ sample (Figure 3). The thickness of the α lath is around 1 μm, and this may affect the resolution of the IPF map shown in Figure 2. It should be noted that fine α phases are also precipitated in the space between the coarse β and α phases, as indicated by a dotted circle shown in Figure 4. The width of the nanoscale α phases is less than 200 nm. Thus, there is a bimodal distribution of the α lath size in the AC sample, and this may influence the mechanical properties. Any α” phases do not appear in the AC sample at all.

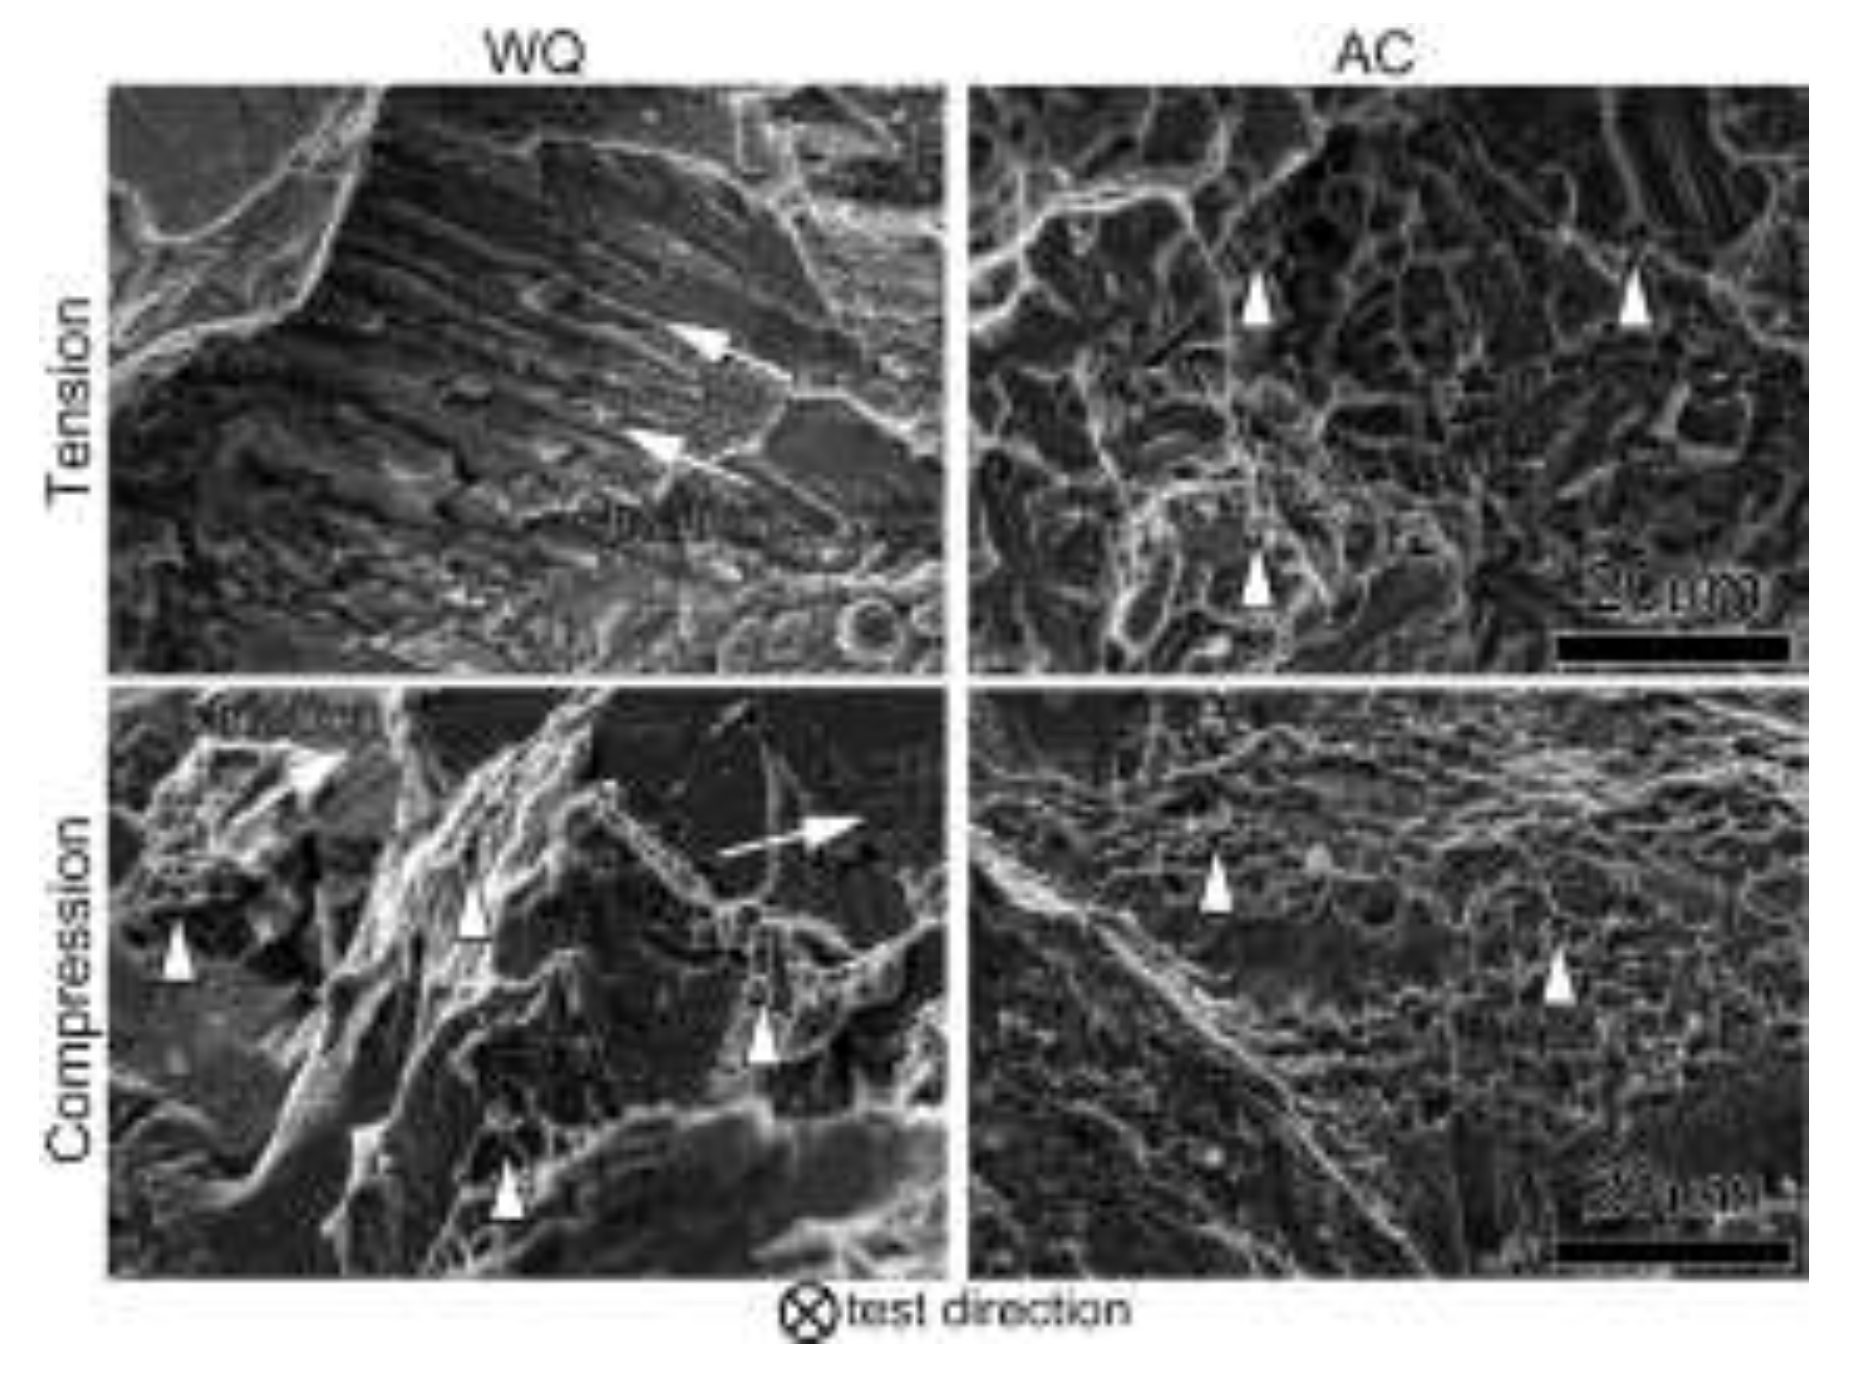
3.4. Fractography and Elemental Distributions to α or β Phases of Air-Cooled Sample

Figure 5 shows the fractured surfaces of the investigated alloys after tensile or compressive tests. The observed planes are normal to the directions of the applied stresses. In the WQ samples, the striations can sometimes appear in the relatively coarse β grains, as shown by the white arrows. Although almost no dimple structures are observed in the tensile specimen, some dimple ones appear at the coarse grain boundaries, as indicated by the arrowheads in the compressive specimen. In the AC samples, most of the fractured surfaces are covered with dimple structures, indicating that the fracture mode is ductile compared to that of the WQ samples. It is interesting to note that the size of the dimples in the AC samples may alter, depending on the size of the α laths, as observed in Figure 4: there are very small and relatively coarse dimples in both the tensile and compressive specimens.
An EDX elemental map of Fe was obtained for the AC sample so that the size of α” phases was extremely fine in the WQ sample, and thus we obtained it only for the AC one. The HAADF-STEM image was simultaneously obtained in the same observed area, as given in Figure 6. We can distinguish coarse and fine α phases even from Figure 6. Fe is preferentially partitioned into β phases, while a very low amount of Fe is dispersed within the α phases, according to the EDX map. Similarly, based on the contrast in the HAADF-STEM, we can estimate the partitioning behavior of Fe so that Fe is a heavy element compared to the matrix Ti and partitioned into the β phase; Fe is known as one of the β stabilizers. Hence, Fe is partitioned into the bright regions in the HAADF-STEM image, which correspond to the Fe-enriched regions in the EDX elemental map. The Fe distributions were also confirmed in the previous Ti-5Fe-5Zr alloy [12]. Such behaviors are also seen in the nanoscale α lath structures.

4. Discussion

This study has shown the fundamental strength of the spark plasma sintered sample subjected to a β solution treatment, followed by water quenching or air cooling. The mechanical properties of tensile and compression tests are measured perpendicular to the compression direction of the sintering. The microstructures were observed by EBSD and TEM. We consider here the reasons for the poor tensile ductility in the water-quenched (WQ) sample. Then, it is understood that the effects of the improvement in the tensile ductility in the air-cooled (AC) one.
The sintering temperature, pressure, and time were increased or prolonged in this study compared with those in our previous studies [12,14]. The increase in the temperature promotes the densification of the sintered sample due to an enhancement in the creep deformation of powders [23,24]. Indeed, such an effect has been reported for pure Cu [25]. The limitation of the maximum pressure is, in fact, determined by the strengths of the used graphite dies and punches. We used the pressure limit in order to obtain the high density, leading to a recrystallization of the β phase at the end of the heating step [25]. The combinations of optimum selections of the sintering temperature and time result in a high-density state [26]. Eventually, it acquired 100% of the relative density in the as-sintered Ti-3.6Fe-5Zr-0.2B alloy.
Majima et al. reported using a hot isostatic press (HIP) machine that σUTS and εf were not obtained in a Ti-4Fe (mass%) binary alloy, which was water quenched from 1233 K (within the β phase filed) and kept for 1.8 ks, due to a failure of the specimen when it was fixed at the jig for the tensile test [27]. On the other hand, σUTS (or σ0.2T) of our water-quenched sample revealed 835 MPa without a total elongation (Table 2). When these tensile behaviors are compared, it can be concluded that there may be three possibilities for the poor ductility in those WQ samples: (1) pores exist in the SPS sample, (2) a solid solution of Fe brings about large strains and/or (3) α″ martensitic phases form. The effect of the pores is considered in this paragraph, and others are argued in the following paragraphs. Ando et al. reported the effect of pores in the sintered pure Fe with 11.7% initial porosities on the tensile fracture. They investigated it by distinguishing open or closed pores using synchrotron X-ray laminography [28]. The open pores are connected to each other, while closed pores are “visually” disconnected before a tensile deformation. During the tensile test, the closed pores approach not only the open pores, but other closed pores, resulting in the formation of ductile cracks. Nevertheless, although Ando et al. elucidated the effects of the remaining pores on the tensile properties, we could neglect them since the pores might not remain, so Majima et al. used the HIP machine, which was often used to close pores generated in the precedent powder process [5], while the obtained relative density in our WQ samples was 100%.
Morinaga reported the effects of types of elements on local lattice strains in a fcc, bcc, or hcp structure using the CASTEP code—one of the ab initio calculation software packages [29,30]. When Fe or another β stabilizer was put in the body-centered atomic position in the bcc Ti lattice, then the structure was accommodated in order to obtain stable lattice parameters. According to his results calculated from 3 a 3 / a , where a 3 is the amount of a strain as to the bcc lattice towards the a axis, and a is the lattice parameter; Fe produces the maximum local compressive strain compared with other elements. Hence, we can readily estimate large amounts of the local strains when we have the as-quenched state after WQ. In order to estimate the effect of Fe on the strengthening in the WQ sample, a rough calculation following an additive strengthening mechanism is applicable: a yield strength could be obtained from σ y = σ i + σ s s + σ p p t + σ H P , where σ i is the intrinsic strength of pure βTi due to a lattice resistance by the Peierls stress, σ p p t the precipitation strengthening due to α or α” phases (Figure 3 and Figure 4) and σ H P the Hall-Petch strengthening due to a grain refinement obtained from σ H P = k d 1 / 2 ; here, k is the Hall-Petch coefficient which is reported as 0.30 MPa·m1/2, and d the average grain diameter [11,31,32]. We do not discuss σ i and σ p p t here because of the difficulties of the microstructural identifications. The solid solution strengthening by the 3.6 mass% Fe addition is estimated from σ s s = i B i 3 / 2 X i 2 / 3 , where B i = M μ λ i 4 / 3 Z , M is the Taylor factor, μ the shear modulus of the alloy, λ a misfit parameter, Z a temperature-dependent numerical factor and X i the concentration of solute i (molar fraction) [33]. The calculated value of B F e is 1715 MPa·at.−2/3, whilst X F e is 0.032. Hence, the contribution to the yield strength due to the solid solution strengthening is 172.9 MPa when we consider 100% of the β phase for the matrix in the WQ sample, while the Hall-Petch strengthening could be estimated as 87.0 MPa for the WQ sample. Thus, the contributions of σ s s and σ H P to σ0.2T (Table 2) become 31%. Hence, we conclude that the high strength, but the relatively poor ductility in the WQ sample could be related to the effect of local lattice strains caused by the Fe addition and fine β grain size. The appearance of the local strains also triggers the martensitic transformation.
Sato et al. experimentally reported the martensite start (Ms) temperatures of binary Ti alloys [34], whilst Bignon et al. calculated the Ms temperature by taking into account a model combining thermodynamics and micromechanics to explain apparencies of the martensitic transformations in Ti alloys [35]. It is found that among various β stabilizers, Fe is the most effective element in decreasing the Ms temperature. It should be emphasized that most of the papers related to a Ti-4Fe or Ti-5Fe (mass%) binary alloy described a formation of ω phases in the as-quenched state after a solution treatment [12,14,36,37,38]. Nevertheless, while we used the same SPS machine and water quenching method with our previous experimental results [12,14], fine and dense α” phases are uniformly dispersed in the β matrix in the WQ sample. We, therefore, conclude that an addition of 3.6 mass% Fe could be concerned with the formation of α” phases rather than the ω phases. The balance between the contents of Fe and Zr could also influence the formation [39]. It has been reported that the formation of the dense α” phases enhances the yield strength but a lower elongation in a Ti-8Mn (mass%) alloy aged at 723 K for 9 ks [40]. When the local lattice strains caused by the β stabilizers are considered [29], a compressive strain due to the Mn addition is quite like that of Fe. So, the formation of the α” phases in Fe-bearing Ti alloys should be remarkably enhanced after water quenching, leading to the high strength and brittle nature of the aged Ti-8Mn alloy. When the air cooling is applied to the Ti-3.6Fe-5Zr-0.2B alloy, the α” phase does not form, and the α phases are precipitated during the air cooling, resulting in better ductility (Figure 1 and Table 2). Because of it, we could enhance the plastic deformation behavior of the AC sample, which can lead to work hardening after the yielding in addition to the precipitation hardening due to precipitations of the α laths, resulting in the high yield and ultimate tensile strengths.

5. Conclusions

Fundamental mechanical properties obtained by only spark plasma sintering (SPS) using a blended elemental method and a β solution treatment of Ti-3.6Fe-5Zr-0.2B (mass%) alloy are investigated. The water-quenched (WQ) or air-cooled (AC) microstructures after the solution treatment have been examined using electron backscatter diffraction (EBSD) and transmission electron microscopy (TEM). The following conclusions were obtained.
Fe gives rise to high local strains within a βTi matrix compared to other β stabilizers, and B disperses relatively large TiB compounds at mainly grain boundaries. Therefore, these alloying elements are tentatively decreased in the developed Ti-3.6Fe-5Zr-0.2B alloy. By means of the modified SPS conditions, a relative density of 100% was achieved. We can then neglect the effects of remaining pores on the tensile properties. The 0.2% proof stresses in tension and compression are increased in the WQ sample, but it still fractures within the elastic deformation region in tension due to formations of α” martensitic phases during the rapid quenching. The balance between the contents of Fe and Zr in the alloy influences the occurrence of the transformation. Fe produces large local lattice strains, and this is particularly true in the WQ sample. The solid solution strengthening by the addition of 3.6 mass% Fe is very high. The Hall-Petch strengthening due to the fine and globular β grains in the WQ sample could also enhance the strength. The high strength, but the relatively poor ductility in the WQ sample could be related to the effects of the local lattice strains caused by the Fe addition, including a martensitic transformation and the solid solution strengthening.
The AC sample exhibits high strength and an improved elongation compared to those of the WQ sample. The grain size of β is fine in the WQ sample, but relatively coarse β and α phases appear when the cooling rate is slow. This leads to coarse and fine α laths in the AC sample. There is a bimodal distribution as to the α lath size in the AC sample, and this influences mechanical properties. Fe is preferentially partitioned into the β phases.
The formation of α″ phases should be enhanced remarkably after WQ, leading to a high strength but brittle nature. When AC is applied to the Ti-3.6Fe-5Zr-0.2B alloy, the formation of the α″ phases is suppressed, and α phases are precipitated during the air cooling, resulting in better ductility.

Author Contributions

Conceptualization, T.H.; methodology, T.H. and T.W.; validation, T.H. and T.W.; formal analysis, T.H. and T.W.; investigation, T.H. and T.W.; resources, T.H.; data curation, T.H. and T.W.; writing—original draft preparation, T.H.; writing—review and editing, T.H.; visualization, T.H.; supervision, T.H.; project administration, T.H.; funding acquisition, T.H. All authors have read and agreed to the published version of the manuscript.

Funding

This research received no external funding.

Data Availability Statement

Not applicable.

Acknowledgments

This work was, in part, supported by Takeuchi MFG. Go., Ltd., 2019, and the Union Tool Grant, 2018. The authors acknowledge the technical assistance from N. Saito of the Nagaoka University of Technology, Japan, and M. Nanko of the Nagaoka University of Technology, Japan, for the use of equipment.

Conflicts of Interest

The authors declare no conflict of interest.

References

  1. Lütjering, G.; Williams, J.C. Titanium, 2nd ed.; Springer: Berlin/Heidelberg, Germany, 2007. [Google Scholar]
  2. Munir, Z.A.; Anselmi-Tamburini, U.; Ohyanagi, M. The effect of electric field and pressure on the synthesis and consolidation of materials: A review of the spark plasma sintering method. J. Mater. Sci. 2006, 41, 763–777. [Google Scholar] [CrossRef]
  3. Saheb, N.; Iqbal, Z.; Khalil, A.; Hakeem, A.S.; Aqeeli, N.A.; Laoui, T.; Al-Qutub, A.; Kirchner, R. Spark plasma sintering of metals and metal matrix nanocomposites: A review. J. Nanomater. 2012, 2012, 983470. [Google Scholar] [CrossRef] [Green Version]
  4. Yanagisawa, O.; Kuramoto, H.; Matsugi, K.; Komatsu, M. Observation of particle behavior in copper powder compact during pulsed electric discharge. Mater. Sci. Eng. A 2003, 350, 184–189. [Google Scholar] [CrossRef]
  5. Fang, Z.Z.; Paramore, J.D.; Sun, P.; Chandran, K.S.R.; Zhang, Y.; Xia, Y.; Cao, F.; Koopman, M.; Free, M. Powder metallurgy of titanium–Past, present, and future. Int. Mater. Rev. 2018, 63, 407–459. [Google Scholar] [CrossRef] [Green Version]
  6. Babu, N.K.; Kallip, K.; Leparoux, M.; AlOgab, K.A.; Talari, M.K.; Alqahtani, N.M. High strength Ti-6Al-4V alloy fabricated by high-energy cube milling using calcium as process control agent (PCA) and spark plasma sintering. Int. Adv. Manuf. Technol. 2017, 93, 445–453. [Google Scholar] [CrossRef]
  7. Liu, L.H.; Yang, C.; Kang, L.M.; Long, L.; Xiao, Z.Y.; Li, P.J.; Zhang, L.C. Equiaxed Ti-based composites with high strength and large plasticity prepared by sintering and crystallizing amorphous powder. Mater. Sci. Eng. A 2016, 650, 171–182. [Google Scholar] [CrossRef] [Green Version]
  8. Sim, K.H.; Wang, G.; Kim, T.J.; Ju, K.S. Fabrication of a high strength and ductility Ti-22Al-25Nb alloy from high energy ball-milled powder by spark plasma sintering. J. Alloys Compds. 2018, 741, 1112–1120. [Google Scholar] [CrossRef]
  9. Bahador, A.; Kariya, S.; Umeda, J.; Kondoh, K. Tailoring microstructure and properties of a superelastic Ti-Ta alloy incorporating spark plasma sintering with thermomechanical processing. J. Mater. Eng. Perform. 2019, 28, 3012–3020. [Google Scholar] [CrossRef]
  10. Kang, L.M.; Yang, C. A review on high-strength titanium alloys: Microstructure, strengthening, and properties. Adv. Eng. Mater. 2019, 21, 1801359. [Google Scholar] [CrossRef]
  11. Ashby, M.F.; Jones, D.R.H. Engineering Materials; Pergamon: Oxford, UK, 1980. [Google Scholar]
  12. Homma, T.; Takano, H. Enhancement in age hardenability of sintered Ti-5Fe alloy by Zr addition processed by pulsed electric current sintering. Philos. Mag. 2018, 98, 2296–2310. [Google Scholar] [CrossRef]
  13. Homma, T.; Arafah, A.; Haley, D.; Nakai, M.; Niinomi, M.; Moody, M.P. Effect of alloying elements on microstructural evolution in oxygen content controlled Ti-9Nb-13Ta-4.6Zr (wt%) alloys for biomedical applications during aging. Mater. Sci. Eng. A 2018, 709, 312–321. [Google Scholar] [CrossRef]
  14. Homma, T. Influence of the boron addition on fine microstructures in sintered Ti-Fe-Zr alloy. Titan. Jpn. 2020, 68, 70–75. [Google Scholar]
  15. Villiars, P.; Calvert, L.D. Pearson’s Handbook of Crystallographic Data for Intermetallic Phase, 2nd ed.; ASM International: Materials Park, OH, USA, 1991. [Google Scholar]
  16. Martin, J.W.; Doherty, R.D.; Cantor, B.L. Stability of Microstructure in Metallic Systems, 2nd ed.; Cambridge University Press: Cambridge, UK, 1997. [Google Scholar]
  17. Fujii, H.; Takahashi, K.; Mori, K.; Kawakami, A.; Kunieda, K.; Otsuka, H. Titanium and its alloys using non-rare common elements as alloying ones. Mater. Jpn. 2009, 48, 547–554. [Google Scholar] [CrossRef]
  18. German, R.M. Coarsening in sintering: Grain shape distribution, grain size distribution, and grain growth kinetics in solid-pre systems. Crit. Rev. Solid State Mater. Sci. 2010, 35, 263–305. [Google Scholar] [CrossRef]
  19. Olevsky, E.A.; Froyen, L. Impact of thermal diffusion in densification during SPS. J. Am. Ceram. Soc. 2009, 92, S122–S132. [Google Scholar] [CrossRef]
  20. Ashby, M.F.; Jones, D.R.H. Engineering Materials 2; Pergamon: Oxford, UK, 1986. [Google Scholar]
  21. Zafari, A.; Xia, K. Stress induced martensitic transformation in metastable b Ti-5Al-5Mo-5V-3Cr alloy: Triggering stress and interaction with deformation bands. Mater. Sci. Eng. A 2018, 724, 75–79. [Google Scholar] [CrossRef]
  22. Moffat, D.L.; Larbalestier, D.C. The competition between martensite and omega in quenched Ti-Nb alloys. Met. Trans. A 1988, 19A, 1677–1686. [Google Scholar] [CrossRef]
  23. Trapp, J.; Semenov, A.; Nöthe, M.; Wallmersperger, T.; Kieback, B. Fundamental principle of spark plasma sintering of metals: Part III–Densification by plasticity and creep deformation. Powder Met. 2020, 63, 329–337. [Google Scholar] [CrossRef]
  24. Zou, L.M.; Yang, C.; Long, Y.; Xiao, Z.Y.; Li, Y.Y. Fabrication of biomedical Ti-35Nb-7Zr-5Ta alloys by mechanical alloying and spark plasma sintering. Powder Met. 2012, 55, 65–70. [Google Scholar] [CrossRef]
  25. Diouf, S.; Molinari, A. Densification mechanisms in spark plasma sintering: Effect of particle size and pressure. Powder Technol. 2012, 221, 220–227. [Google Scholar] [CrossRef]
  26. Handtrack, D.; Despang, F.; Sauer, C.; Kieback, B.; Reinfried, N.; Grin, Y. Fabrication of ultra-fine grained and dispersion-strengthened titanium materials by spark plasma sintering. Mater. Sci. Eng. A 2006, 437, 423–429. [Google Scholar] [CrossRef]
  27. Majima, K.; Isono, T.; Shoji, K. Effect of (a+b)-quenching on the mechanical properties of sintered Ti-Fe binary alloys. Funtai Oyobi Fummatsu Yakin 1987, 34, 349–354. [Google Scholar]
  28. Ando, I.; Mugita, Y.; Hirayama, K.; Munetoh, S.; Aramaki, M.; Jiang, F.; Tsuji, T.; Takeuchi, A.; Uesugi, M.; Ozaki, Y. Elucidation of pore connection mechanism during ductile fracture of sintered pure iron by applying persistent homology to 4D images of pores: Role of open pore. Mater. Sci. Eng. A 2021, 828, 142112. [Google Scholar] [CrossRef]
  29. Morinaga, M. Local lattice strain around alloying elements in metals and its influence on alloy properties. Rep. Toyota Phys. Chem. Res. Inst. 2019, 72, 115–127. [Google Scholar]
  30. Payne, M.C.; Teter, M.P.; Allan, D.C.; Arias, T.A.; Joannopoulos, J.D. Iterative minimization techniques of ab initio total-energy calculations: Molecular dynamics and conjugate gradients. Rev. Mod. Phys. 1992, 64, 1045–1097. [Google Scholar] [CrossRef] [Green Version]
  31. Cherfliff, H.R.; Ashby, M.F. A process model for age hardening of aluminium alloys—I. the model. Acta Met. Mater. 1990, 38, 1789–1802. [Google Scholar]
  32. Li, H.; Cai, Q.; Li, S.; Xu, H. Effects of Mo equivalent on the phase constituent, microstructure and compressive mechanical properties of Ti-Nb-Mo-Ta alloys prepared by powder metallurgy. J. Mater. Res. Technol. 2022, 16, 588–598. [Google Scholar] [CrossRef]
  33. Zhao, G.-H.; Liang, X.Z.; Kim, B.; Rivera-Díaz-del-Castillo, P.E.J. Modelling strengthening mechanisms in beta-type Ti alloys. Mater. Sci. Eng. A 2019, 756, 156–160. [Google Scholar] [CrossRef]
  34. Sato, T.; Hukai, S.; Huang, Y.C. The Ms points of binary titanium alloys. J. Aust. Inst. Met. 1960, 5, 149–153. [Google Scholar]
  35. Bignon, M.; Bertrand, E.; Tancret, F.; Divera-Díaz-del-Castillo, P.E.J. Modelling martensitic transformation in titanium alloys: The influence of temperature and deformation. Materialia 2019, 7, 100382. [Google Scholar] [CrossRef]
  36. Oshio, E.; Yoshinaga, A.; Adachi, M. Transmission electron microscope observations of w phase in titanium-5% iron alloy. Nippon Kinzoku Gakkaishi 1969, 33, 437–442. [Google Scholar]
  37. Hanada, S.; Yoshio, Y.; Izumi, O. Plastic deformation mode of retained β phase in β-eutectoid Ti-Fe alloy. J. Mater. Sci. 1986, 21, 866–870. [Google Scholar] [CrossRef]
  38. Komatsu, S.; Ikeda, M.; Sugimoto, T.; Kamei, K.; Inoue, K. Phase constitution and resistivity of quenched Ti-2 to 15 mass% Fe alloys. Nippon Kinzoku Gakkaishi 1991, 55, 491–496. [Google Scholar]
  39. Abdel-Hady, M.; Fuwa, H.; Hinoshita, K.; Kimura, H.; Shinzato, Y.; Morinaga, M. Phase stability change with Zr content in b-type Ti-Nb alloys. Scripta Mater. 2007, 57, 1000–1003. [Google Scholar] [CrossRef]
  40. Mantani, Y.; Takemoto, Y.; Hida, M.; Sakakibara, A.; Tajima, M. Phase transformation of a” martensite structure by aging in Ti-8 mass% Mo alloy. Mater. Trans. 2004, 45, 1629–1634. [Google Scholar] [CrossRef] [Green Version]
Figure 1. Nominal stress–strain curves of investigated alloys with WQ or AC.
Crystals 13 01184 g001
Figure 2. BC images and IPF maps obtained in the WQ and AC samples. The observed areas between the BC image and the IPF map are identical. The positions of green color in the BC images indicate TiB compounds.
Crystals 13 01184 g002
Figure 3. Low and high-magnification TEM BF images and the corresponding [011]β SAED pattern were obtained from the WQ sample.
Crystals 13 01184 g003
Figure 4. BF images and SAED patterns from relatively coarse α and β phases in the AC sample. Fine α phases are also seen in the dotted circle.
Crystals 13 01184 g004
Figure 5. Secondary electron images of fractographs of the tensile or compression test specimen. The arrows and arrowheads indicate striations and dimple structures, respectively.
Crystals 13 01184 g005
Figure 6. HAADF-STEM image and corresponding EDX elemental map of Fe in the AC sample.
Crystals 13 01184 g006
Table 1. Relative density of the sintered sample.
AlloyDensityTheoretical DensityRelative Density
g/cm3g/cm3%
Ti-3.6Fe-5Zr-0.2B4.654.65100
Table 2. Measured mechanical properties of Ti-3.6Fe-5Zr-0.2B and Ti-5Fe-5Zr-0.75B alloys. The indices T and C indicate tension and compression, respectively.
AlloyCoolingσUTSσ0.2TεfTσUCSσ0.2CεfC
MPaMPapctMPaMPapct
Ti-3.6Fe-5Zr-0.2BWQ-835-200618625.3
AC10789771.72419125532
Ti-5Fe-5Zr-0.75BWQ-447-196319044.3
Disclaimer/Publisher’s Note: The statements, opinions and data contained in all publications are solely those of the individual author(s) and contributor(s) and not of MDPI and/or the editor(s). MDPI and/or the editor(s) disclaim responsibility for any injury to people or property resulting from any ideas, methods, instructions or products referred to in the content.

