Article

Comparative Analysis of Three Constitutive Models and Microstructure Characteristics of Nb521 during Hot Deformation

1
School of Mechanical Engineering and Automation, Beihang University, Beijing 100191, China
2
State Key Laboratory of Special Rare Metal Materials, Northwest Rare Metal Materials Research Institute Ningxia Co., Ltd., Shizuishan 753000, China
3
Ningxia Horizontal Titanium Industry Co., Ltd., Shizuishan 753000, China
4
Jiangxi Research Institute of Beihang University, Beihang University, Nanchang 330024, China
*
Author to whom correspondence should be addressed.
Crystals 2023, 13(8), 1170; https://doi.org/10.3390/cryst13081170
Submission received: 5 May 2023 / Revised: 12 June 2023 / Accepted: 6 July 2023 / Published: 27 July 2023

Abstract

:
This study presents an exploration of the flow stress constitutive model and the deformation mechanism of Nb521, both critical for its practical application. Hot-compression experiments were performed on Nb521 at temperatures ranging from 1523 K to 1723 K and strain rates ranging from 0.01 to 10 s 1 . In addition, the microstructure evolution was concurrently studied through scanning electron microscopy (SEM) and electron backscattered diffraction (EBSD). The stress–strain behaviour of Nb521 was assessed, leading to the development of three constitutive models: the Johnson–Cook model, the modified Johnson–Cook model and the Arrhenius model. In the course of the deformation process, it is consistently observed that the hardening effect surpasses the softening effect during the plastic phase, with no observable occurrence of a steady-state phase. The modified Johnson–Cook model offers superior predictive accuracy. Both grain elongation and torsion are the main deformation mechanisms of Nb521 and specific texture forms during stretching. This study also reveals that fractures at both room temperature and high temperatures are brittle in nature. The elucidation of the constitutive model and underlying deformation mechanisms in this study offers indispensable insights into the hot-deformation behaviour of Nb521.

1. Introduction

The Nb521 alloy, characterized by moderate strength and plasticity, has been utilized to manufacture thin walls and complex-shaped parts on rocket engines [1], satellites and spacecraft [2] due to its low density, high specific strength at high temperatures (600~1600 °C) [3] and excellent cold [4] and hot formability [5]. Current scholarly research has studied the mechanical properties of Nb521. For instance, Xia et al. [6] demonstrate that the suitable addition of niobium carbide particles can bolster the high-temperature strength of the Nb521 alloy. Xin et al.’s [7] study indicated a positive correlation between the processing rate of the cold rotary forging process and the alloy’s strength, with optimal mechanical properties observed at a processing rate of 60%. However, the complex nature of Nb521’s hot-deformation process renders the effects of strain rate and temperature on flow stress challenging to describe precisely and reliably via a single-material constitutive model. Therefore, it is necessary to reasonably compare and analyse various constitutive models for Nb521.
Constitutive relation, which describes the correlation between flow stress and strain, strain rate and temperature, plays a pivotal role in finite-element simulation. Widely employed models such as the Johnson–Cook [8] and the Arrhenius [9] constitutive models are commonly used to characterize the hot deformation of metals due to their simplicity and broad applicability in the plastic constitutive relations of metals. Yang et al. [10] proposed a Johnson–Cook model for FG D6A and pointed out that grain refinement reduces the strain rate sensitivity of the material. Mohamed Toumi Nasri [11] identified the parameters of the Johnson–Cook model for A1050 at different temperatures through experimental and numerical simulation and studied the failure behaviour in hot forming. Qian et al. [12] proposed a modified Johnson–Cook model considering the coupled effects of strain, strain rate and temperature on the behaviour of the material, which can give an accurate and credible prediction of the dynamic behaviour of the CuCrZr alloy over a wide range of strain rates and temperatures. Wang et al. [13] proposed the modified Johnson–Cook model by introducing high-temperature softening parameters, which can correctly describe the deformation behaviour at any temperature within a specific range. Yang et al. [14] proposed the strain-modified Arrhenius constitutive equation for 20MnCr5, which has strong prediction ability, and provided the temperature and strain rate interval to avoid its plastic instability. Xia et al. [15] applied the Arrhenius constitutive model to study the hot-deformation behaviour of Ti-6Al-4V-0.1Ru and used a series of material constants as polynomial functions of strain to improve the accuracy of finite-element method simulation. Hu et al. [16] compared the prediction ability of the modified Johnson–Cook model and Arrhenius model about Ti-6Al-4V and pointed out that the prediction accuracy of the Arrhenius model was higher than that of the modified Johnson–Cook model. Therefore, in this research, Johnson–Cook and Arrhenius constitutive equations were employed to investigate Nb521.
Electron backscattered diffraction (EBSD) provides a reliable means to characterize the microstructure and micro-texture of materials, yielding substantial crystallographic information about samples. Wan et al. [17] studied the deformation mechanism of RHEAs during tensile deformation using discontinuous in situ EBSD and pointed out that the difference in slip behaviour causes the difference in ultimate tensile strength. Wang et al. [18] determined the crystal orientation and orientation contrast by the scattered electron of EBSD and measured the interfacial misorientation of low angles. Ye et al. [19] used EBSD to study the plastic deformation of polycrystalline structures. They verified the existence of additional obstacles to dislocation slip caused by ordered structures in the plastic deformation process. Zhu et al. [20] studied nickel-based superalloys with EBSD and other technologies. Their research pointed out that the tensile deformation would produce texture, and the fracture behaviour was controlled by intergranular fracture and transgranular fracture. In the present study, EBSD was deployed to ascertain the plastic deformation mechanism, microstructure and texture of Nb521.
Research on the fracture mechanism of Nb521 is also noteworthy. Cai et al. [21] pointed out that Nb521 presented plastic or brittle fractures at different oxidation temperatures through scanning electron microscopy (SEM) fracture morphology. However, none observed the fracture process and microstructure evolution of Nb521. Han et al. [22] observed the microstructure evolution of materials through in situ SEM experiments, including slip marks and initiation and propagation of short cracks. Gao et al. [23] adopted in situ tensile experiments combined with SEM, EBSD and digital image correlation (DIC) and pointed out that the fracture mechanism of the material changed from ductile transgranular fracture to brittle intergranular–transgranular mixed fracture with the increase in grain size. Liu et al. [24] used in situ SEM combined with EBSD and DIC to show that the crack occurs at the triangular point during alloy fracture and spreads along the grain boundary to generate an intergranular crack. In this study, we utilized in situ SEM, coupled with EBSD and other technologies, to analyse the entire fracture process of materials.
The plastic-forming capacity, high-temperature strengthening mechanism and fracture mechanism of Nb521 have not been studied [25]. Further research remains essential to meet the high-performance requirements of aerospace engines. In this research, the hot-deformation behaviour of Nb521 was analysed through a high-temperature compression experiment. The Johnson–Cook model, modified Johnson–Cook model and Arrhenius model were established, and the high-temperature flow stress was predicted. In addition, the deformation and fracture mechanism of Nb521 were studied by discontinuous in situ EBSD and in situ SEM experiments. This paper aims to offer data support and theoretical reference for the forming process of Nb521.

2. Materials

The hot-compression experiment of sample Nb521 was carried out on the Gleeble-3500 simulation testing machine (Dynamic System Inc., New York, NY, USA). The Nb521 cylinder size is φ8 mm × 12 mm, annealed in a vacuum. The chemical composition is shown in Table 1. The surface roughness of the sample was polished to less than or equal to 1.6 μm to reduce friction in the deformation process, and then the hot-compression test was carried out on the test machine. The compression experiment was conducted at a temperature of 1523 K to 1723 K, with an interval of 50 K. The strain rates were 0.01 s 1 , 0.1 s 1 , 1 s 1 and 10 s 1 . The true strain of the experiment was 0.7. The experiment used water quenching.

3. Result and Discussion

3.1. Stress–Strain Curve

Figure 1 presents the true stress–true strain curves for Nb521 under various strain rates. There is a monotonic increase in stress corresponding to the strain, signifying an initial occurrence of strain hardening, which can be attributed to an increase in dislocation density [26]. No yield plateau is produced. At the same strain rate, the stress decreases with the temperature increase. This is because as the temperature increases, the atomic thermal motion of the metal becomes intense, and dislocation is more likely to cancel out, resulting in thermal softening instead of hardening. As shown in Figure 1, the flow stress increases with the increase in strain rate at the same temperature due to the work hardening caused by the increase in dislocation. For example, at 1523 K, the true stress is 282 MPa when the strain rate is 0.01 and the strain of 0.2. It increases to 415 MPa when the strain rate is 10. During the plastic phase, as the strain increases, the flow stress monotonically increases until fracture, indicating that the hardening effect is always greater than the softening effect during the deformation process.

3.2. Johnson–Cook Model

The Johnson–Cook model is as follows:
σ = ( A + B ( ε ε 0 ) n ) [ 1 + C ln ( ε ˙ p ε ˙ 0 ) ] [ 1 ( T T 0 T m e l t T 0 ) m ]
In the equation, σ is flow stress (MPa), ε is true strain, ε 0 refers to the reference strain, ε ˙ p is the strain rate of this material ( s 1 ) and ε ˙ 0 is the reference strain rate ( s 1 ). A is the yield strength at the reference temperature and reference strain rate; B is the strain-hardening coefficient; n is the strain-hardening index; C is the strain-rate-hardening coefficient; T is the experimental temperature (K); T 0 is the reference temperature (K); T m e l t is the melting temperature (2725 K); and m is the thermal-softening index [27]. In the fitting process, the reference temperature is 1523 K, the reference strain rate is 0.1 s 1 and the reference strain is 0.1 for determining the parameters in the constitutive equation. In Equation (1), the first term determines the shape of the fitting curve, the second term determines its relationship with strain rate and the third term determines its relationship with temperature.
The Johnson–Cook model’s parameters can be fitted independently. At the reference temperature of 1523 K and the reference strain rate of 0.1 s 1 , Equation (1) can be expressed as
σ = ( A + B ( ε ε 0 ) n )
Under this deformation condition, as shown in Figure 2a, A is the material’s yield stress of 176.99 MPa. We can obtain the relationship between ln ( σ A ) and ln ε at the reference temperature and strain rate by substituting A into the equation. n can be confirmed by the slope of the linear fitting, which equals 0.8577, and lnB is the intercept of 6.51, this means that B is 59.45 MPa.
At the deformation temperature of 1523 K, the equation transformed into the equation below:
σ = ( A + B ε p n ) [ 1 + C ln ( ε ˙ p ε ˙ 0 ) ]
The C value can be obtained by fixed-intercept linear fitting the slope of ln ( ε ˙ p ε ˙ 0 ) and σ A + B ε n , which is 0.068, as depicted in Figure 2b. At the strain rate of 0.1 s 1 , the equation became
σ = ( A + B ε n ) [ 1 ( T T 0 T m e l t T 0 ) m ]
Through linear fitting of ln ( 1 σ A + B ε n ) and ln ( T T 0 T m e l t T 0 ) , m can be obtained by the slope of 0.75 as shown in Figure 2c.
The constitutive equation is as follows:
σ = [ 176.99 + 59.44 × ( 10 ε ) 0 . 86 ] × [ 1 + 0 . 068 ln ( 10 ε ˙ ) ] × [ 1 ( T 1523 2725 1523 ) 0.75 ]
The flow stress predicted by the initial model is compared with the experimental values in Figure 3.
Comparing the predicted and experimental values, as depicted in Figure 3, the Johnson–Cook model exhibits enhanced precision under different deformation conditions. Notably, at a strain rate of 0.01 s 1 , the predicted values demonstrate substantial deviation, presenting a considerable discrepancy with changes in the temperature gradient. At a strain rate of 0.1 s 1 , the predicted values demonstrate increased accuracy, and the low strain is more accurate when the strain rate is 1 s 1 . However, the strain increment is smaller than the experimental value. When the strain rate is 10 s 1 , the predicted value aligns accurately with the strain increment, but the value varies with the temperature gradient. Overall, the predicted value of the Johnson–Cook model under low strain is better than that under high strain [28]. When the temperature is 1723 K and the strain rate is 1 s 1 , the maximum absolute error reaches 52.48 MPa. When the temperature is 1723 K and the strain rate is 0.01 s 1 , the maximum relative error reaches 24.02%.

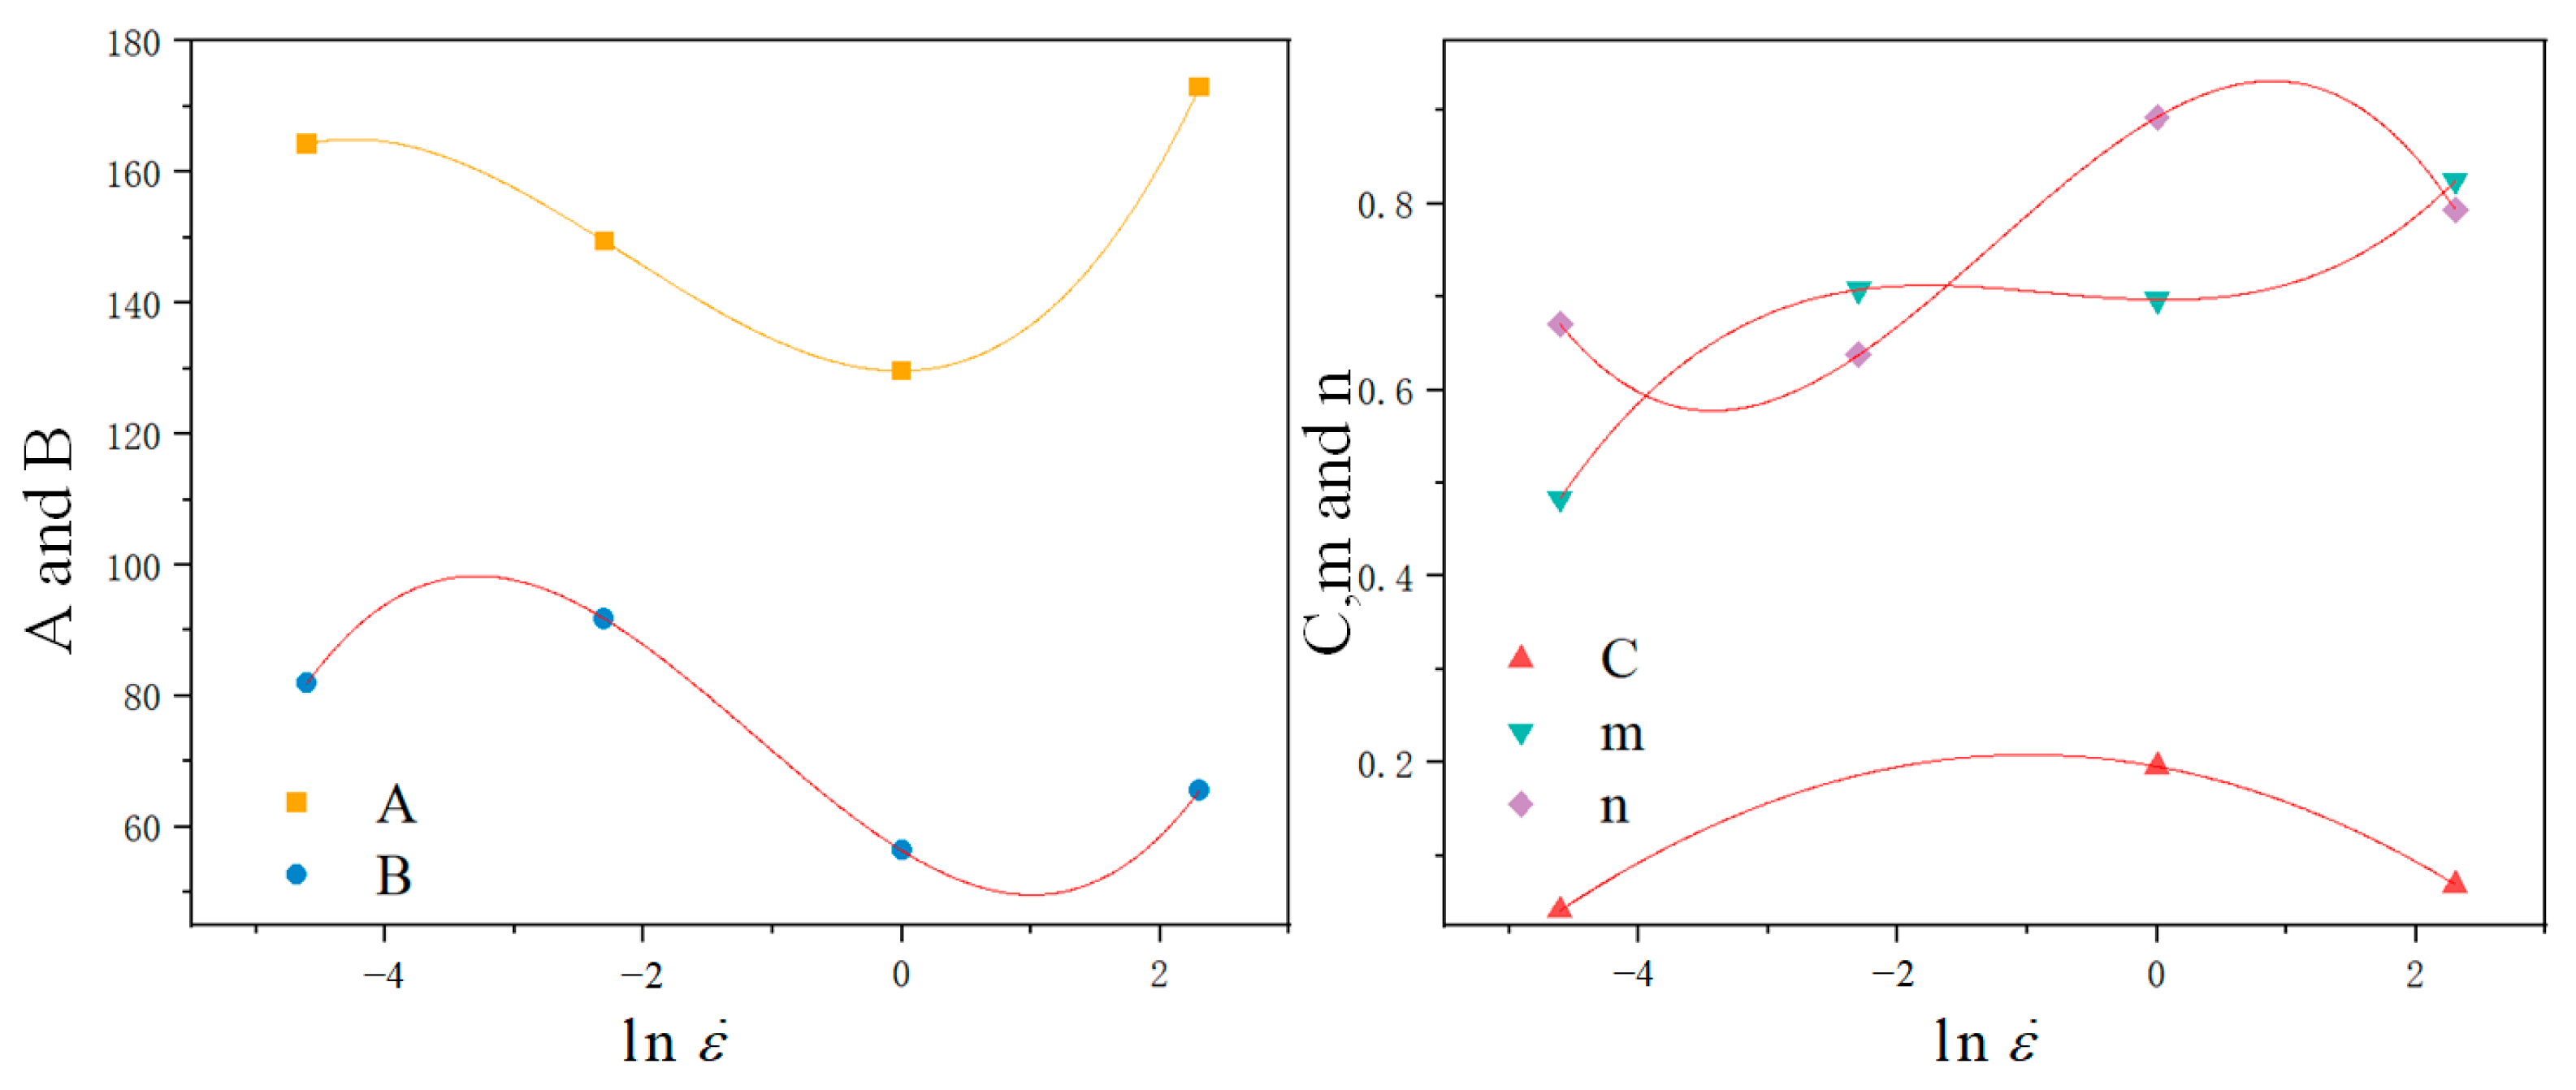
3.3. Modified Johnson–Cook Model

The parameters of the Johnson–Cook model are further fitted and obtained by modification [29]. Polynomial fitting was performed to get A, B, C, m and n represented by strain rates [12] to improve prediction accuracy. As shown in Table 2, the values of the parameters corresponding to each strain rate can be obtained by nonlinear fitting of five curves at different temperatures under that strain rate using the Levenberg–Marquardt method [30]. Table 3 presents the coefficient value of polynomial fitting.
{ A = A 0 + A 1 ln ( ε ˙ ) + A 2 [ ln ( ε ˙ ) ] 2 + A 3 [ ln ( ε ˙ ) ] 3 B = B 0 + B 1 ln ( ε ˙ ) + B 2 [ ln ( ε ˙ ) ] 2 + B 3 [ ln ( ε ˙ ) ] 3 C = C 0 + C 1 ln ( ε ˙ ) + C 2 [ ln ( ε ˙ ) ] 2 m = M 0 + M 1 ln ( ε ˙ ) + M 2 [ ln ( ε ˙ ) ] 2 + M 3 [ ln ( ε ˙ ) ] 3 n = N 0 + N 1 ln ( ε ˙ ) + N 2 [ ln ( ε ˙ ) ] 2 + N 3 [ ln ( ε ˙ ) ] 3
As seen from Figure 4, with the change in strain rate, the value of parameter A presents a quadratic function relationship with strain rate. In contrast, other parameters have no such connection.
The modified Johnson–Cook constitutive equation is as follows:
σ = [ A ( ε ˙ ) + B ( ε ˙ ) ( 10 ε ) n ( ε ˙ ) ] [ 1 + C ( ε ˙ ) ( 10 ε ˙ ) ] { 1 [ ( T T 0 ) / ( T m e l t T 0 ) ] m ( ε ˙ ) }
The predicted value of flowing stress can be obtained under varying conditions. The comparison between the experimental and predicted values is represented in Figure 5. As per Figure 5, the modified Johnson–Cook model provides a more precise prediction than the Johnson–Cook model. When the temperature is 1523 K, and the strain rate is 0.01 s 1 , the predicted value is inconsistent with the experiment with the increase in strain. However, prediction performance improves at other temperatures and strain rates. The maximum absolute error of 19.71 MPa and the maximum relative error of 4.94% appeared at the temperature of 1723 K and the strain rate of 1 s 1 . The modified Johnson–Cook model is more precise than the Johnson–Cook model.

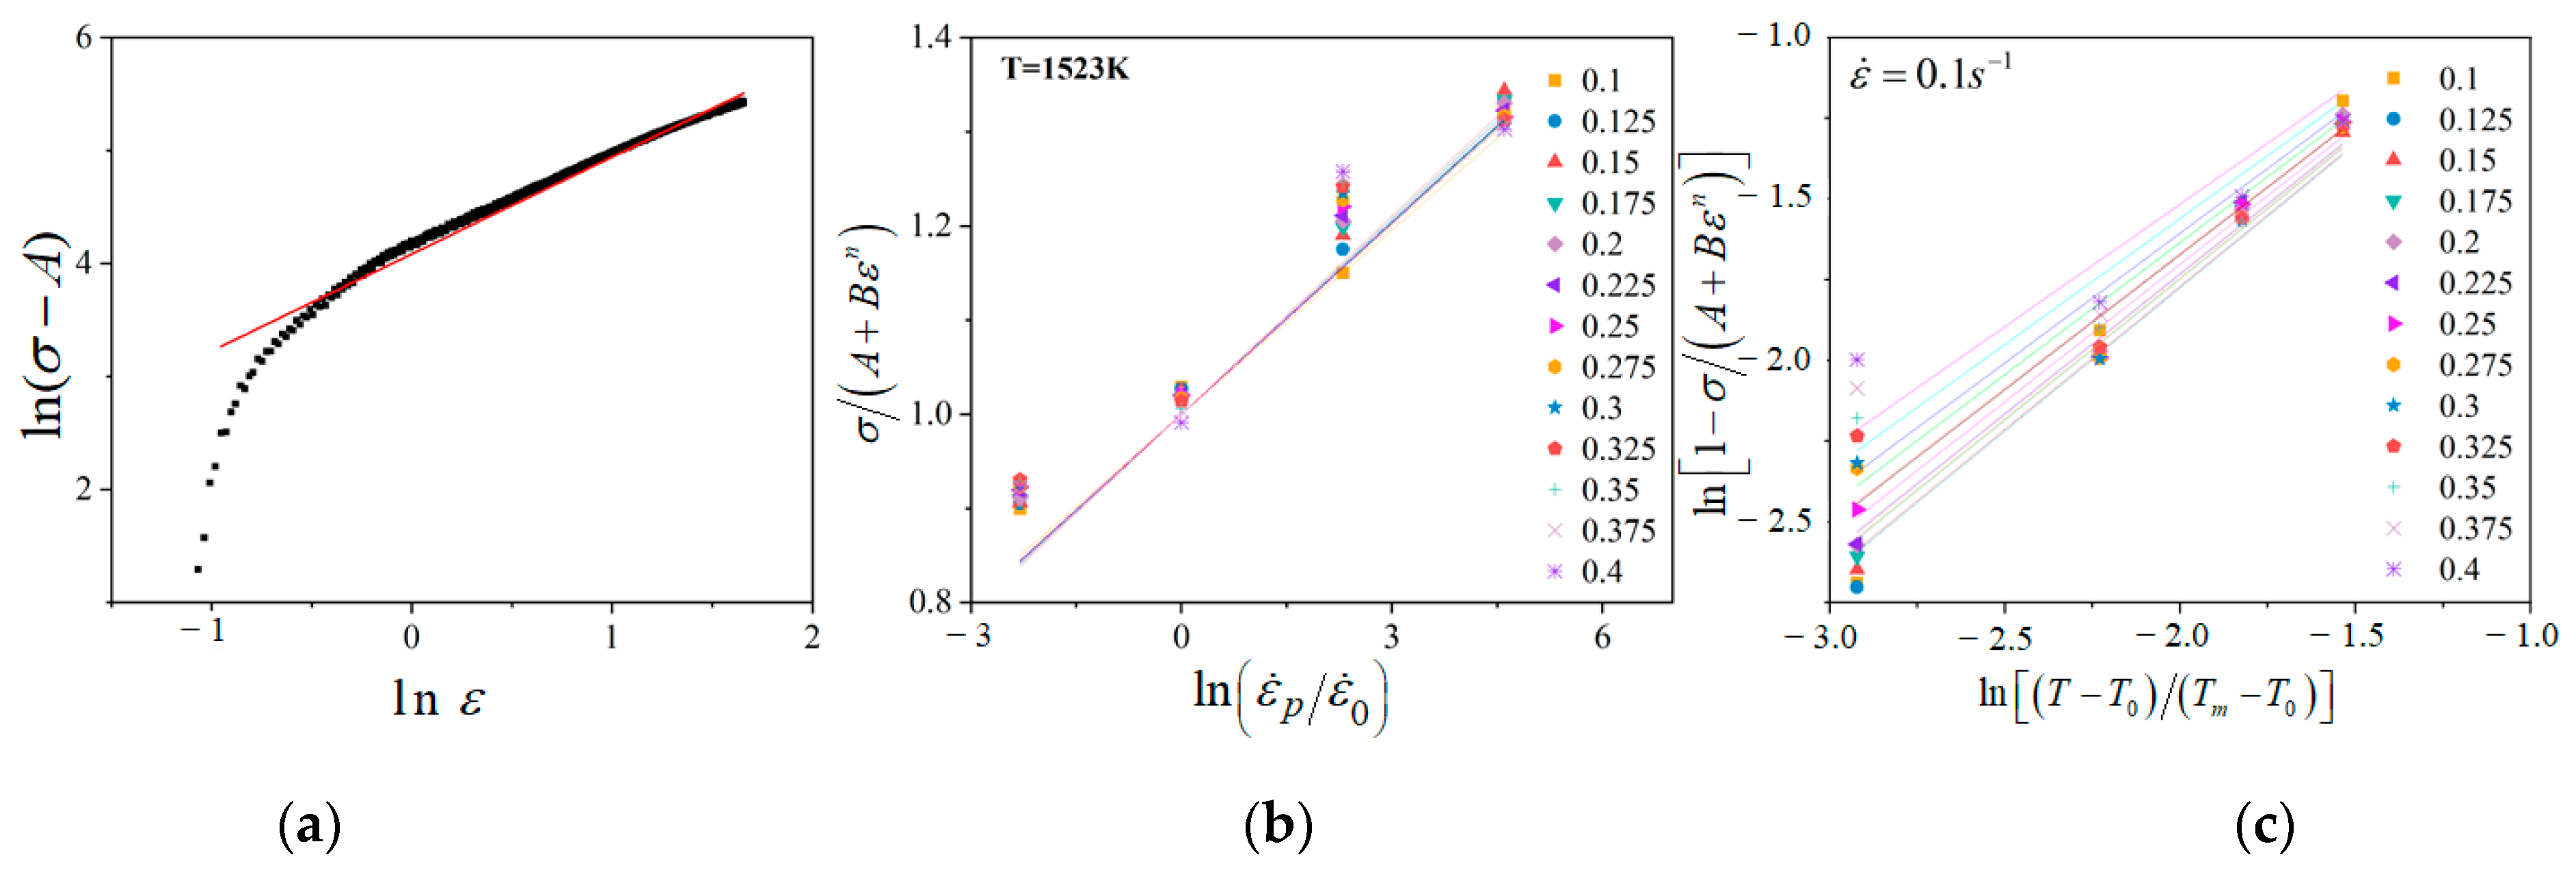
3.4. Arrhenius Model

The Arrhenius model can well describe the constitutive relationship between temperature, strain rate and strain during hot deformation [31]. Its form is expressed as follows:
ε ˙ = e c F ( σ ) e Q R T
F ( σ ) = { σ n 1 , α σ < 0.8 e β σ , α σ > 1.2 [ sinh ( α σ ) ] n , f o r   a l l   σ
The influence of temperature and strain rate on deformation behaviour can be expressed by the Zener–Hollomon parameter, which is
Z = ε ˙ e Q R T
where ε ˙ refers to the strain rate ( s 1 ), Q is the activation energy of hot deformation ( k J / m o l ) and R is the universal gas constant (8.314 J m o l 1 K 1 ). Q reflects the microstructure mechanism in the hot-deformation process, and c is the frequency index. α , β , n 1 , n are material constants in which α = β / n 1 . It must be noted that the power form and exponential form work for low-stress levels ( α σ < 0.8 ) and high-stress levels ( α σ > 1.2 ). The hyperbolic sine function in the third equation is more general, covering a wider stress range. Therefore, this research used the hyperbolic sine function to describe the thermal-deformation behaviour of the Nb521 alloy.
At the strain of 0.2, the value of n 1 and β can be obtained by the relationship between ln ε ˙ ln σ and ln ε ˙ σ under five different temperatures using linear fitting, and α = β / n 1 = 0 . 0039 MPa   1 . These relations are shown in Figure 6.
The value of A and B can be obtained by the relationship between ln ε ˙ ln [ sinh ( α σ ) ] and ln [ sinh ( α σ ) ] 1000 / T primely, which is 10.04 and 6.46. Thus, the activation energy is Q = R × A × B = 540 . 0   kJ / m o l .
With the value of Z of four strain rates and five temperatures, a total of 20 conditions, the relationship between ln Z ln [ sinh ( α σ ) ] can be confirmed. The value of n and c can be obtained by their slope and intercept, which are 9.87 and 37.21.
Combining equation and Z, the explicit form of flow stress is acquired as follows:
σ = 1 α ln { ( Z e c ) 1 n + [ ( Z e c ) 2 n + 1 ] 1 2 }
Under different temperatures and strain rates, strain affects both the flow stress and the material constant [32]. The material constants are polynomial functions within the strain range. The equations are as follows:
{ α = C 0 + C 1 ε + C 2 ε 2 + C 3 ε 3 + C 4 ε 4 + C 5 ε 5 n = D 0 + D 1 ε + D 2 ε 2 + D 3 ε 3 + D 4 ε 4 + D 5 ε 5 Q = E 0 + E 1 ε + E 2 ε 2 + E 3 ε 3 + E 4 ε 4 + E 5 ε 5 c = F 0 + F 1 ε + F 2 ε 2 + F 3 ε 3 + F 4 ε 4 + F 5 ε 5
The result can be obtained by performing multi-order polynomial fitting on α, n, Q and c, as shown in Figure 7. The coefficients of the polynomial fitting can be acquired in Table 4. From the table, the value of material parameters at any deformation temperature and strain rate can be determined. Figure 8 illustrates the variation of parameters with respect to strain. The Arrhenius model is as follows:
{ σ = 1 α ( ε ) ln { ( Z [ Q ( ε ) ] e c ( ε ) ) 1 n ( ε ) + [ ( Z [ Q ( ε ) ] e c ( ε ) ) 2 n ( ε ) + 1 ] 1 2 } Z = ε ˙ e [ Q ( ε ) R T ]
The Arrhenius model’s predicted and experimental value comparison is illustrated in Figure 9. As can be seen from Figure 9, when the strain rate is 0.01 s 1 , the predicted value is smaller than the actual value at 1523 K but larger than the actual value at other temperatures. When the strain rate is 0.1 s 1 , the predicted value is small when the temperature exceeds 1623 K, and the prediction effect is better at other temperatures. When the strain rate is 1 s 1 , the predicted value is more accurate at low strain, but with the increase in strain, the stress increment is smaller than the actual value. When the strain rate is 10 s 1 , the increment of the predicted value with the temperature gradient is larger than the actual value. Overall, when the strain rate is high and the strain is minimal, the predicted value is more accurate, and the accuracy decreases with strain increment [33]. The deviations could be due to the intrinsic limitations of the constitutive equation.

3.5. Precision Analysis

Chao et al. [34] assert that the prediction results of the classical Johnson–Cook model exhibit apparent strain hardening, and the error is relatively large when the strain is larger. Based on the comparison, it can be deduced that the Johnson–Cook model provides reasonably accurate predictions only when applied within the specified range of reference temperature and strain rate. The model’s effectiveness is limited to a narrow range around the reference conditions, as it only incorporates the effects of work hardening, strain-rate-induced hardening and temperature-induced hardening and softening. The model overlooks the interaction among these factors during the actual deformation process. Unlike the original Johnson–Cook model, the thermal-softening index m and hardening coefficient C of Nb521 were associated with strain and strain rate. A more precise predicted value of flow stress can be obtained by quadratic fitting. This indicates that the high-temperature flow behaviour of Nb521 is controlled by thermal softening, strain hardening and strain rate hardening. In addition, its coupling effect with strain, temperature and strain rate should also be considered. Therefore, when the temperature and strain rate differ greatly from the reference temperature and strain rate used to determine the parameters, the Johnson–Cook model cannot consider these coupling effects, thus leading to a huge error in the predicted value. The modified Johnson–Cook model can more accurately predict the high-temperature deformation of Nb521. However, at the temperature of 1523 K with a strain rate of 0.01 s 1 , the prediction is more inaccurate than others. The cause may be the error during the experiment. Since the modified Johnson–Cook model does not involve the recovery of dislocation density, the practicability has not been improved.
To further assess the accuracy of the three constitutive models, each model’s absolute and relative errors were calculated when the strain was 0.3. The errors of the predicted values under the three constitutive equations are shown in Table 5. The maximum error of the Johnson–Cook model is 30.97 MPa when the temperature is 1673 K and the strain rate is 0.01 s 1 . Its relative error value ranges from −8.95% to 16.56%. The maximum error of the modified Johnson–Cook model occurs when the temperature is 1623 K and the strain rate is 1 s 1 , reaching 7.46 MPa. Its relative error value ranges from −2.16% to 2.25%. The maximum error of the Arrhenius model occurs when the temperature is 1523 K and the strain rate is 10, reaching 30.12 MPa. Its relative error value ranges from −9.64% to 7.20%. It is apparent that the modified Johnson–Cook model exhibits the highest accuracy and an effective prediction effect.

3.6. In Situ EBSD Tensile Test

An in situ EBSD stretching experiment was conducted on Nb521. Figure 10a illustrates the loading and deformation curves of the tensile experiment. The EBSD sampling is conducted in A, B, C and D. Figure 10b–e are the comparisons of the initial stage (A) and plastic deformation phase (D). Figure 10b represents the surface morphology change of Nb521. It is evident that with the stretching, the internal slip system of each grain is activated, the slip track in different directions can be observed on the surface, some grains are elongated and there is convex between grains. Figure 10c displays the evolution of the recrystallized structure. With stretching, the original recrystallized structure almost all becomes the deformation structure. Bibhanshu et al. [35] proposed that changes in grain orientation could be identified by colour changes within grains, and high-angle grain boundaries would shift to medium-angle grain boundaries and then small-angle grain boundaries. Figure 10d presents the orientation distribution diagram of the inverse pole figure, where different colours indicate different orientations of grains. After stretching, the colour inside the grain changes, suggesting that the grain twists and crystal orientation changes during the deformation process. Crystals primarily oriented along the ~(001) direction (highlighted in red in the figure) undergo significant morphological changes relative to the tensile direction, while the grain orientation deviates minimally from the initial orientation. On the other hand, grains oriented approximately along ~(111) (highlighted in blue in the figure) and ~(101) (highlighted in green in the figure) exhibit a shift towards the red region. Figure 10e represents the distribution map of grain boundaries, with the thin line indicating the presence of low-angle grain boundaries. It is evident that there is a substantial increase in low-angle grain boundaries resulting from grain boundary torsion induced by stretching. The formation of low-angle grain boundaries parallels high-angle grain boundaries and mainly occurs near hard particles. Figure 10 provides an illustration of the cooperative deformation mechanisms in Nb521, involving dislocation slip and grain rotation during the loading process. The plastic stage is characterized by strain hardening, attributed to the stretching of grains, alterations in crystal orientation and enhanced deformation resistance.
Figure 11 displays the pole figure of {100},{110},{111} for Nb521 when the displacement is 0, 1100, 1500 and 1900 μm, where X0 is TD and Y0 is RD. Wu et al. [36] outlined that grains tend to be arranged rather than dispersed with increased stress, and larger tensile stress will enhance the cubic texture. It can be observed that there is no specific texture in the material at the beginning, but with the progress of stretching, a particular texture is gradually formed. Since Nb is a body-centred cubic crystal, it can be seen that the material has a {001} <110> cubic texture [37]. This observation indicates that stretching causes the Nb521 grains to tend to arrange to form a specific texture, thus possibly enhancing work hardening.

3.7. Fracture Analysis

Figure 12 illustrates the SEM image of the in situ tensile curve of Nb521 at room temperature and the surface morphology of the specimen during the tensile process. There is no obvious plastic deformation characteristic at the low strain stage. The first crack in the tensile process occurs near the grain boundary (Figure 12c) and expands along the direction perpendicular to the stress (Figure 12d). It can be seen that there are impurity particles in the crack, indicating that the crack is a microcrack induced by impurity particles at the grain boundary. As shown in Figure 12e, numerous other cracks are formed near the refracture surface after the initial crack. The growth of these cracks weakens the material’s bearing capacity, ultimately resulting in a brittle fracture [38]. Most of the cracks are located at a certain distance from the fracture plane [39]. The main crack formation takes place near the fracture stage (Figure 12a), which suggests that the critical cleavage fracture stress of Nb521 is approximately 500 MPa.
Figure 13 illustrates the in situ tensile curve of Nb521 at the temperature of 1473 K. SEM figures are obtained in the order of a, b, c, d and e during the phase of fracture. As can be seen from Figure 13a,b, cracks appear on the sample’s surface and gradually grow. There are no impurity particles inside the sample, indicating that under the condition of hot deformation, the microcracks are not induced by impurity particles but under the interference of a particular stress state and other conditions. It can be seen from Figure 13c that cracks appear on both sides of the prefabricated damage and increase with stretching. According to Figure 13d,e, although cracks appeared on both sides, the fracture surface appeared in the middle instead of the crack, indicating that the sample fracture at 1473 K was a brittle fracture induced by non-impurity particles.

4. Conclusions

The hot-deformation behaviour of Nb521 at strain temperatures of 1523, 1573, 1623, 1673 and 1723 K and strain rates of 0.01, 0.1, 1 and 10 s 1 were studied by hot-compression experiments. The Johnson–Cook model, modified Johnson–Cook model and Arrhenius model were established based on the true stress–strain curves obtained by experiments. The accuracy of the three models for high-temperature flow stress prediction of Nb521 was compared. The microstructure and fracture mechanism of Nb521 were studied by in situ tensile test and in situ EBSD tensile test. According to the research results, the following conclusions can be drawn:
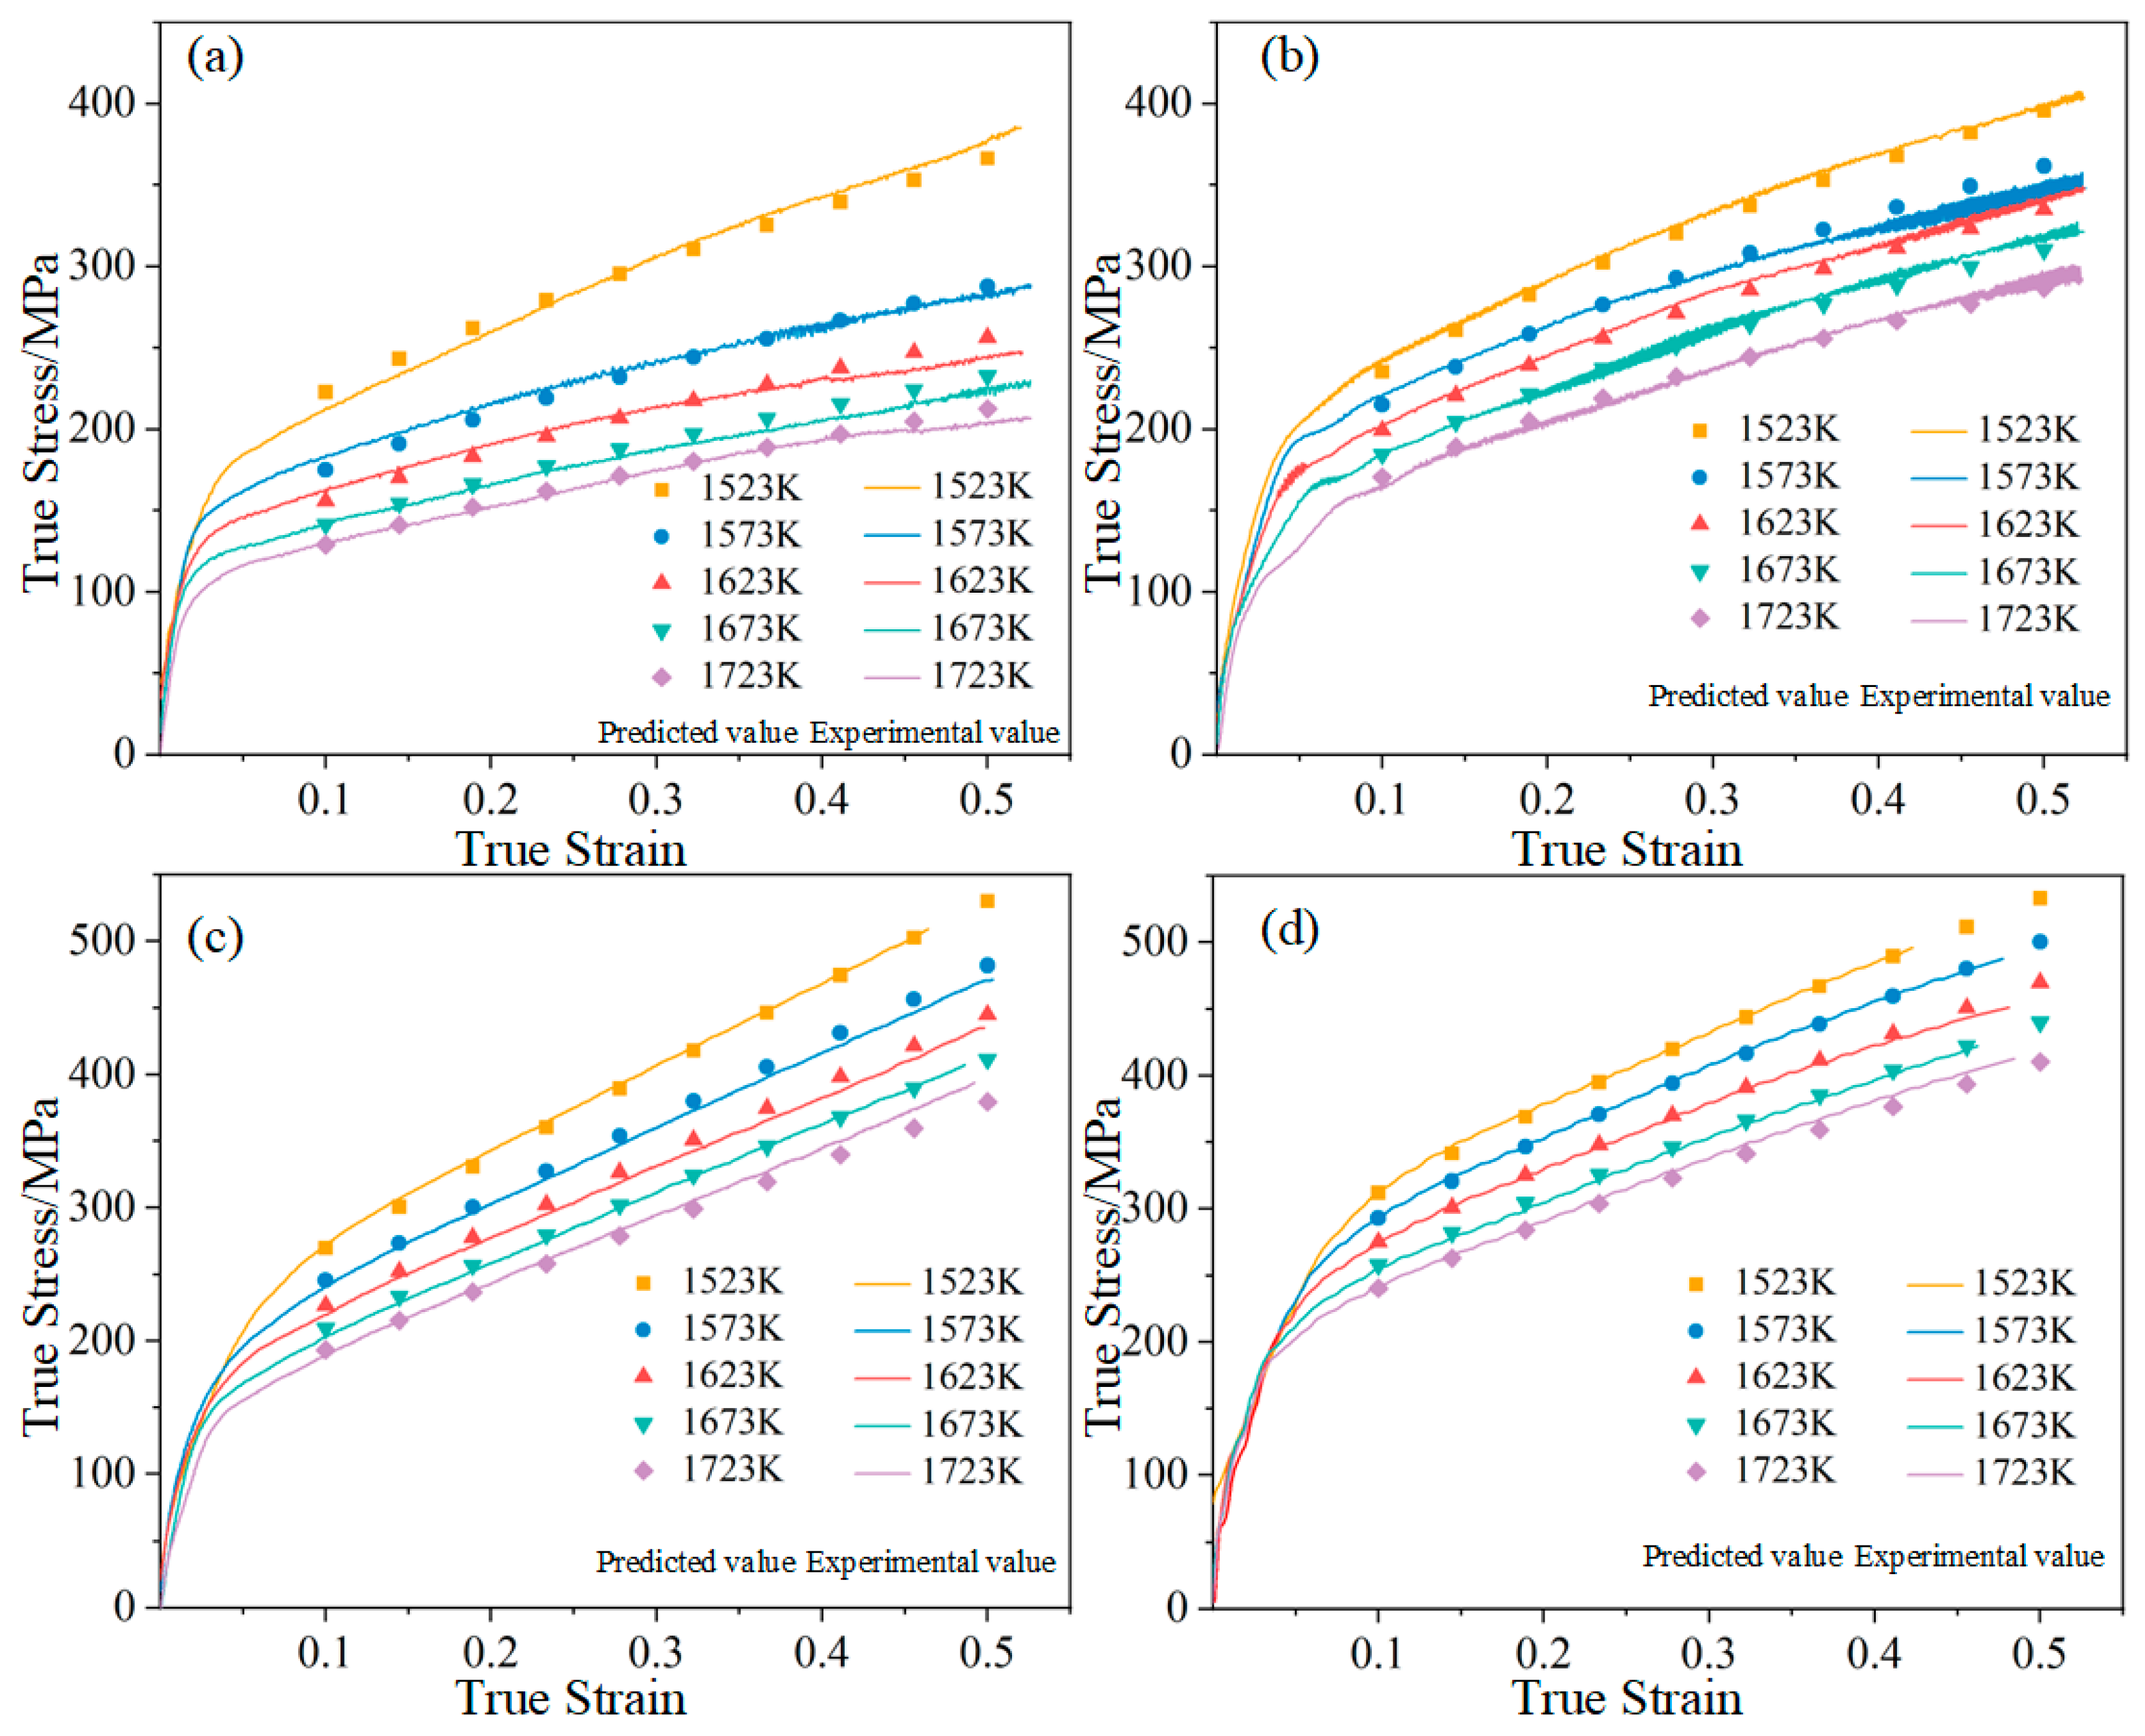
  • All three models exhibit varying degrees of error. The maximum errors of the Johnson–Cook model, modified Johnson–Cook model and Arrhenius model are 30.97 MPa, 7.46 MPa and 30.12 MPa, and the relative errors are 16.56%, 2.25% and 9.64%. Among them, the modified Johnson–Cook model demonstrates superior accuracy. The JC model displays good prediction accuracy only when referring to reference strain and temperature. It can be seen from the MJC model that the parameters of Nb521 vary greatly at different temperatures and strain rates, which may be because the deformation mechanism of Nb521 is affected at higher temperatures and strain rates.
  • Both grain elongation and torsion are the main deformation mechanism of Nb521, and {001} <110> cubic texture gradually forms with stretching.
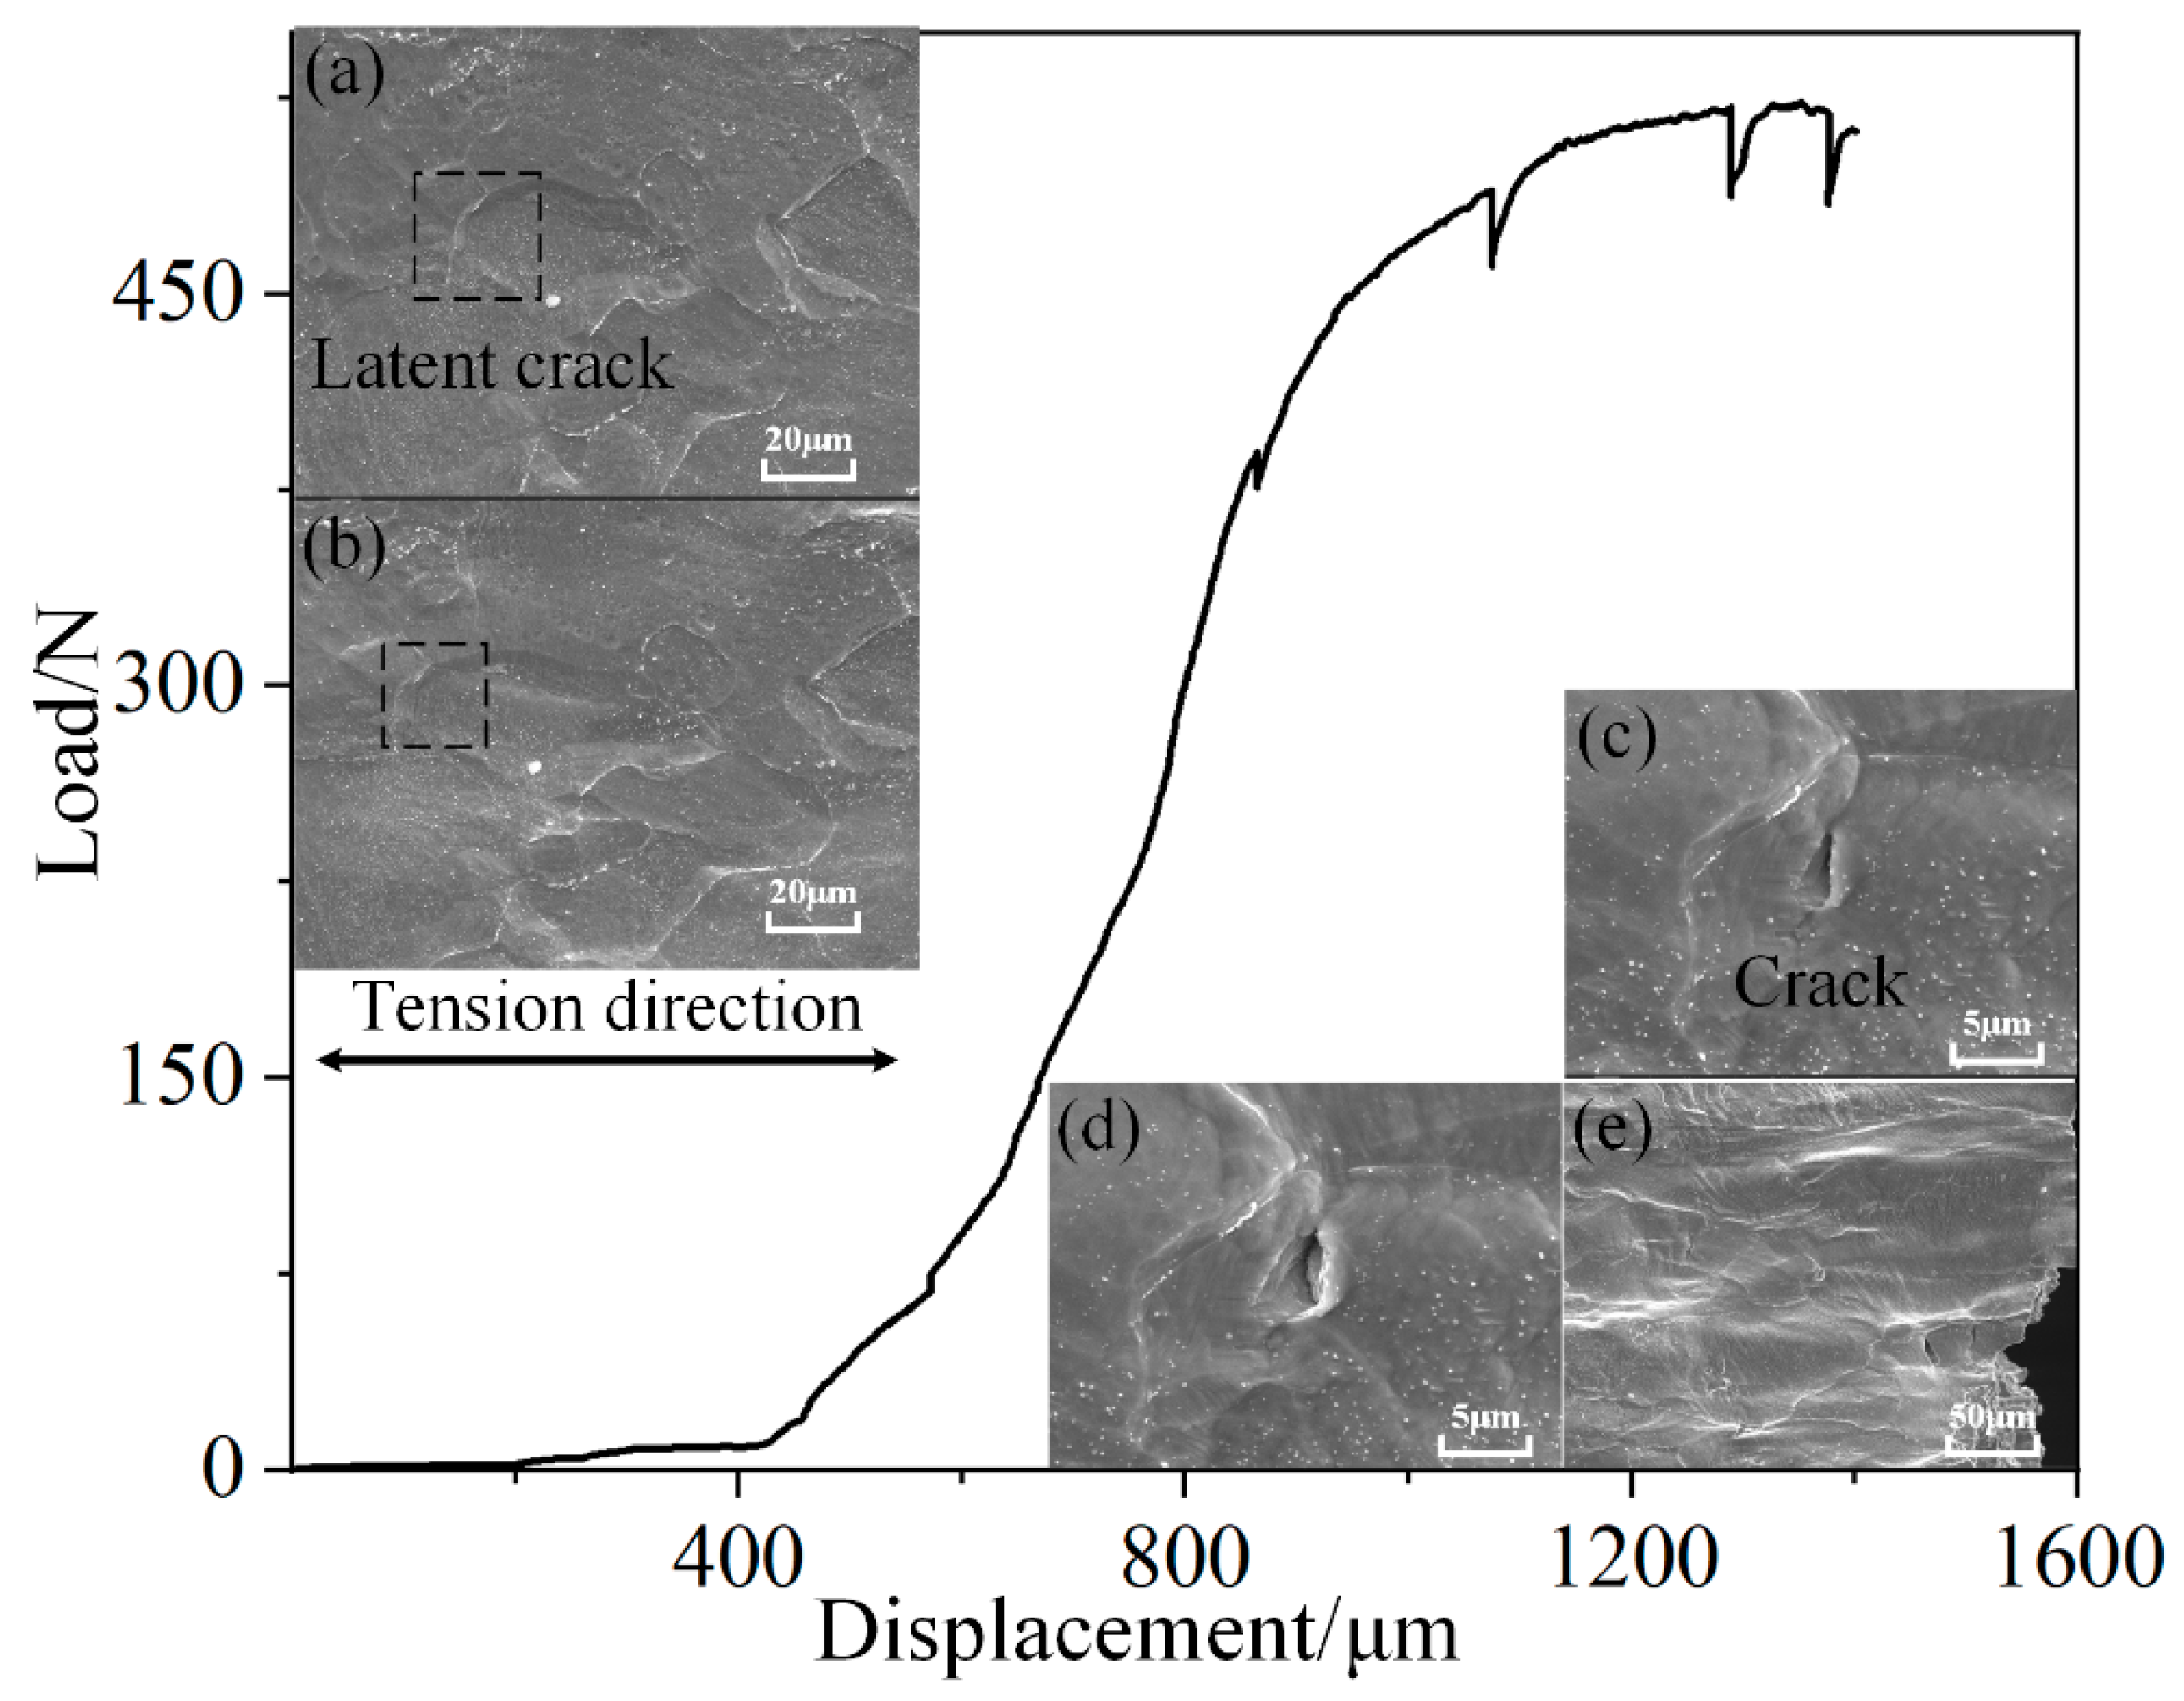
  • The fracture mechanism of Nb521 at room temperature and high temperature has been revealed. At room temperature, microcracks induced by impurity particles at the grain boundary initiate the fracture. At high temperatures, the microcracks are not induced by impurity particles but by specific stress conditions. The cracks appear on both sides along with the stretching, leading to the brittle fracture of the surface structure.

Author Contributions

Conceptualization, B.Z.; methodology, B.Z. and M.J.; formal analysis, B.Z. and M.J.; investigation, M.J.; resources, M.W.; data curation, B.Z. and M.J.; writing—original draft preparation, B.Z. and M.J.; writing—review and editing, R.Z.; visualization, M.J.; supervision, R.Z.; funding acquisition, R.Z. and M.W. All authors have read and agreed to the published version of the manuscript.

Funding

This research was funded by the project (grant number 52105316 from National Natural Science Foundation of China), the project (grant number 20212BAB214046 from Natural Science Foundation of Jiangxi Province), and the Fundamental Research Funds for the Central Universities (Qingba from BeiHang University), and the State Key Laboratory of Special Rare Metal Materials in Northwest Rare Metal Materials Research Institute Ningxia Co., Ltd. (grant number SKL2018K002).

Institutional Review Board Statement

Not applicable.

Informed Consent Statement

Not applicable.

Data Availability Statement

Not applicable.

Acknowledgments

The author would like to acknowledge the financial support of Zhejiang Qiyue Technology Co., Ltd. for providing the facilities for the EBSD analysis and experimental works, and Jiangxi Research Institute of Beihang University for assistance during experiments and writing.

Conflicts of Interest

The authors declare no conflict of interest.

References

  1. Wang, N.; Li, H.; Xu, F.; Yin, Z.; Zhang, X. Recent Development of Advanced Materials for Liquid Rocket Thruster Chambers. Aerosp. Mater. Technol. 2019, 49, 1–8. [Google Scholar]
  2. Zhang, C.; Hu, G. Structure, Properties and Applaction of Nb521 Alloys. Aerosp. Mater. Technol. 2012, 42, 105–107. [Google Scholar]
  3. Senkov, O.N.; Rao, S.I.; Butler, T.M.; Chaput, K.J. Ductile Nb alloys with reduced density and cost. J. Alloys Compd. 2019, 808, 151685. [Google Scholar] [CrossRef]
  4. Luo, Y.; Zhai, B. Research on precision spinning-pressure forming process of large-size thin-walled nozzle made of niobium tungsten alloy. J. Rocket. Propuls. 2016, 42, 68–73. [Google Scholar]
  5. Yapici, G.G. Simultaneous improvement in strength and ductility of severely deformed niobium alloy. Mater. Lett. 2020, 279, 128443. [Google Scholar] [CrossRef]
  6. Xia, M.; Zheng, X.; Liu, H.; Bai, R.; Cai, X.; Wang, F. Effect of Nb2C Particle Size and Content on Microstructure and Properties of Niobium Alloy. Hot Work. Technol. 2016, 45, 115–117. [Google Scholar] [CrossRef]
  7. Xin, M.; Lv, Y.; Li, S.; Zhang, X.; Wang, H.; Han, W.; Hu, X.; Shen, L. Effects of Cold Rotary Forging on Microstructure and Mechanical Properties of Nb521 Alloy Bars. Rare Met. Cem. Carbides 2018, 46, 37–42. [Google Scholar]
  8. Johnson, G.R.; Cook, W.H. Fracture characteristics of three metals subjected to various strains, strain rates, temperatures and pressures. Eng. Fract. Mech. 1985, 21, 31–48. [Google Scholar] [CrossRef]
  9. Bodunrin, M.O. Flow stress prediction using hyperbolic-sine Arrhenius constants optimised by simple generalised reduced gradient refinement. J. Mater. Res. Technol.-JmrT 2020, 9, 2376–2386. [Google Scholar] [CrossRef]
  10. Yang, Z.; Feng, X.; Zhang, X.; Shen, Y.; Huang, X.; Xie, R. Study on Dynamic Mechanical Behaviors and J–C Constitutive Model of a Fine-Grained D6A Steel. Crystals 2022, 12, 806. [Google Scholar] [CrossRef]
  11. Nasri, M.T.; Abbassi, F.; Ahmad, F.; Makhloufi, W.; Ayadi, M.; Mehboob, H.; Choi, H.S. Experimental and numerical investigation of sheet metal failure based on Johnson-Cook model and Erichsen test over a wide range of temperatures. Mech. Adv. Mater. Struct. 2022, 30, 2087–2100. [Google Scholar] [CrossRef]
  12. Qian, X.; Peng, X.; Song, Y.; Huang, J.; Wei, Y.; Liu, P.; Mao, X.; Zhang, J.; Wang, L. Dynamic constitutive relationship of CuCrZr alloy based on Johnson-Cook model. Nucl. Mater. Energy 2020, 24, 100768. [Google Scholar] [CrossRef]
  13. Wang, Y.; Zhou, D.; Zhou, Y.; Sha, A.; Cheng, H.; Yan, Y. A Constitutive Relation Based on the Johnson–Cook Model for Ti-22Al-23Nb-2(Mo, Zr) Alloy at Elevated Temperature. Crystals 2021, 11, 754. [Google Scholar] [CrossRef]
  14. Yang, J.; Wang, L.; Zheng, Y.; Zhong, Z. Strain Modified Constitutive Equation and Processing Maps of High Quality 20MnCr5(SH) Gear Steel. Crystals 2021, 11, 536. [Google Scholar] [CrossRef]
  15. Xia, Y.F.; Jiang, W.; Cheng, Q.; Jiang, L.; Jin, L. Hot deformation behavior of Ti-6Al-4V-0.1Ru alloy during isothermal compression. Trans. Nonferrous Met. Soc. China 2020, 30, 134–146. [Google Scholar] [CrossRef]
  16. Hu, M.; Dong, L.; Zhang, Z.; Lei, X.; Yang, R.; Sha, Y. Correction of Flow Curves and Constitutive Modelling of a Ti-6Al-4V Alloy. Metals 2018, 8, 256. [Google Scholar] [CrossRef] [Green Version]
  17. Wan, Q.; Hua, K.; Tong, Y.; Wu, Y.; Zhang, F.; Li, X.; Wang, H. Interrupted in-situ EBSD study of crystallographic characteristics and deformation micro-mechanism in TiZrHfNb refractory high entropy alloys during uniaxial tensile deformation. Mater. Charact. 2022, 189, 111960. [Google Scholar] [CrossRef]
  18. Wang, Z.; Zaefferer, S. On the accuracy of grain boundary character determination by pseudo-3D EBSD. Mater. Charact. 2017, 130, 33–38. [Google Scholar] [CrossRef]
  19. Ye, Z.; Li, C.; Zheng, M.; Zhang, X.; Yang, X.; Gu, J. In-situ EBSD/DIC-based investigation of deformation and fracture mechanism in FCC- and L12-structured FeCoNiV high-entropy alloys. Int. J. Plast. 2022, 152, 103247. [Google Scholar] [CrossRef]
  20. Zhu, Q.; Wang, C.; Qin, H.; Chen, G.; Zhang, P. Effect of the grain size on the microtensile deformation and fracture behaviors of a nickel-based superalloy via EBSD and in-situ synchrotron radiation X-ray tomography. Mater. Charact. 2019, 156, 109875. [Google Scholar] [CrossRef]
  21. Cai, X.; Li, Q.; Xia, M.; Li, W.; Zheng, X.; Wang, F.; Liu, H.; Bai, R. Effect of Oxidizing Temperature on Mechanical Properties of Nb521 Alloy. Hot Work. Technol. 2021, 50, 36–38. [Google Scholar] [CrossRef]
  22. Han, Q.; Wang, W.; Fang, J.; Cui, H.; Zhang, H.; Yang, X.; Mu, Q.; Xu, J.; Shi, H. In-situ SEM and EBSD study on fretting fatigue crack initiation of a directionally solidified Ni-based superalloy. Int. J. Fatigue 2022, 161, 106908. [Google Scholar] [CrossRef]
  23. Gao, W.; Lu, J.; Zhou, J.; Liu, L.E.; Wang, J.; Zhang, Y.; Zhang, Z. Effect of grain size on deformation and fracture of Inconel718: An in-situ SEM-EBSD-DIC investigation. Mater. Sci. Eng. A 2022, 861, 144361. [Google Scholar] [CrossRef]
  24. Liu, J.; Sun, J.; Chen, Q.; Lu, L. Intergranular Cracking in Mg-Gd-Y Alloy during Tension Test. Crystals 2022, 12, 1040. [Google Scholar] [CrossRef]
  25. Zhu, B.; Wu, X.; Wan, M.; Zhao, G.; Cao, Y.; Luo, W.; Li, S.; He, J. Progress of high temperature niobium alloy for aerospace applications. Chin. J. Nonferrous Met. 2022, 1–33. [Google Scholar] [CrossRef]
  26. Lin, X.; Huang, H.; Yuan, X.; Wang, Y.; Zheng, B.; Zuo, X.; Zhou, G. Establishment and validity verification of the hot processing map of a Ti-47.5Al-2.5V-1.0Cr-0.2Zr alloy with a lamellar microstructure. Mater. Charact. 2022, 183, 111599. [Google Scholar] [CrossRef]
  27. Shokry, A.; Gowid, S.; Mulki, H.; Kharmanda, G. On the Prediction of the Flow Behavior of Metals and Alloys at a Wide Range of Temperatures and Strain Rates Using Johnson-Cook and Modified Johnson-Cook-Based Models: A Review. Materials 2023, 16, 1574. [Google Scholar] [CrossRef] [PubMed]
  28. Zhang, D.-N.; Shangguan, Q.-Q.; Xie, C.-J.; Liu, F. A modified Johnson–Cook model of dynamic tensile behaviors for 7075-T6 aluminum alloy. J. Alloys Compd. 2015, 619, 186–194. [Google Scholar] [CrossRef]
  29. Ojal, N.; Cherukuri, H.P.; Schmitz, T.L.; Devlugt, K.T.; Jaycox, A.W. A combined experimental and numerical approach that eliminates the non-uniqueness associated with the Johnson-Cook parameters obtained using inverse methods. Int. J. Adv. Manuf. Technol. 2022, 120, 2373–2384. [Google Scholar] [CrossRef]
  30. Wang, C.; Shi, D.; Yang, X.; Li, S.; Dong, C. An improved viscoplastic constitutive model and its application to creep behavior of turbine blade. Mater. Sci. Eng. A 2017, 707, 344–355. [Google Scholar] [CrossRef]
  31. Wu, M.; Zhang, S.; Ma, S.; Yan, H.; Wang, W.; Li, Q. Hot Deformation Behavior of Q345 Steel and Its Application in Rapid Shear Connection. Materials 2019, 12, 2186. [Google Scholar] [CrossRef] [PubMed] [Green Version]
  32. Zhao, G.; Tian, Y.; Song, Y.; Li, J.; Li, H.; Zhang, J. A Comparative Study of Three Constitutive Models concerning Thermo-Mechanical Behavior of Q345 Steel during Hot Deformation. Crystals 2022, 12, 1262. [Google Scholar] [CrossRef]
  33. Niu, D.; Zhao, C.; Li, D.; Wang, Z.; Luo, Z.; Zhang, W. Constitutive Modeling of the Flow Stress Behavior for the Hot Deformation of Cu-15Ni-8Sn Alloys. Front. Mater. 2020, 7, 577867. [Google Scholar] [CrossRef]
  34. Chao, Z.L.; Jiang, L.T.; Chen, G.Q.; Zhang, Q.; Zhang, N.B.; Zhao, Q.Q.; Pang, B.J.; Wu, G.H. A modified Johnson-Cook model with damage degradation for B4Cp/Al composites. Compos. Struct. 2022, 282, 115029. [Google Scholar] [CrossRef]
  35. Bibhanshu, N.; Gussev, M.N.; Massey, C.P.; Field, K.G. Investigation of deformation mechanisms in an advanced FeCrAl alloy using in-situ SEM-EBSD testing. Mater. Sci. Eng. A 2022, 832, 142373. [Google Scholar] [CrossRef]
  36. Wu, X.; Suo, H.; Ji, Y.; Li, J.; Ma, L.; Liu, M.; Zhang, Z.; Wang, Q. Systematical analysis on the grain orientation evolution of pure nickel under plastic deformation by using in-situ EBSD. Mater. Sci. Eng. A 2020, 792, 139722. [Google Scholar] [CrossRef]
  37. Zhang, Z.-W.; Li, Z.; Liu, Y.; Wang, J.-T. Path Dependency of Plastic Deformation in Crystals: Work Hardening, Crystallographic Rotation and Dislocation Structure Evolution. Crystals 2022, 12, 999. [Google Scholar] [CrossRef]
  38. Jiang, J.; Zhai, H.; Du, M.; Wang, D.; Pei, X.; Ma, X.; Wang, B. Temperature-dependent deformation and cracking behavior in Cr coating for accident tolerant fuel cladding: An in-situ SEM study. Surf. Coat. Technol. 2021, 427, 127815. [Google Scholar] [CrossRef]
  39. Li, S.; Wang, Y.; Wang, X. In-situ Observation of the Deformation and Fracture Behaviors of Long-Term Thermally Aged Cast Duplex Stainless Steels. Metals 2019, 9, 258. [Google Scholar] [CrossRef] [Green Version]
Figure 1. Nb521 true strain–stress curve. (a) 0.01 s 1 ; (b) 0.1 s 1 ; (c) 1 s 1 ; (d) 10 s 1 .
Crystals 13 01170 g001
Figure 2. The relationship between (a) ln ε and ln ( σ A ) at 1523 K and 0.1 s 1 ; (b) ln ( ε ˙ p / ε ˙ 0 ) and σ / ( A + B ε n ) at 1523 K; and (c) ln [ ( T T 0 ) / ( T m e l t T 0 ) ] and ln [ 1 σ / ( A + B ε n ) ] . The curves are the linear fitting results.
Crystals 13 01170 g002
Figure 3. Comparison between the predicted and experimental value of flow stress using the Johnson–Cook model at different strain rates: (a) 0.01 s 1 ; (b) 0.1 s 1 ; (c) 1 s 1 ; (d) 10 s 1 .
Crystals 13 01170 g003
Figure 4. Relationships between A, B, C, m, n and ln ε ˙ .
Crystals 13 01170 g004
Figure 5. Comparison between predicted and experimental values of flow stress using the modified Johnson–Cook model at a strain rate of (a) 0.01 s 1 ; (b) 0.1 s 1 ; (c) 1 s 1 ; and (d) 10 s 1 .
Crystals 13 01170 g005
Figure 6. The relationship between: (a) ln ( ε ˙ ) ln ( σ ) ; (b) ln ( ε ˙ ) σ ; (c) ln ε ˙ ln [ sinh ( α σ ) ] ; (d) ln [ sinh ( α σ ) ] 1000 / T .
Crystals 13 01170 g006
Figure 7. Relationship between lnZ and ln[sinh(ασ)].
Crystals 13 01170 g007
Figure 8. Relationships between material parameters and ε : (a) α ; (b) n; (c) Q; (d) c.
Crystals 13 01170 g008
Figure 9. Comparison between predicted and experimental flow stress using the strain-compensated Arrhenius model at different strain rates: (a) 0.01 s 1 ; (b) 0.1 s 1 ; (c) 1 s 1 ; (d) 10 s 1 .
Crystals 13 01170 g009
Figure 10. In situ EBSD tensile tests give (a) load–displacement curve; and figures by Channel 5 show (b) morphology of the sample surface; (c) recrystallized fraction; (d) inverse pole figure; (e) low- and high-angle grain boundary at the displacement of 0 and 1900.
Crystals 13 01170 g010
Figure 11. Pole figure of Nb521 at the displacement of 0, 1100, 1500 and 1900.
Crystals 13 01170 g011
Figure 12. The in situ tensile curve at room temperature and micromorphology in the surface at the displacement of (a) 864.38 μm, (b) 1377.54 μm, (c) necking, (d) 1404 μm and (e) fracture.
Crystals 13 01170 g012
Figure 13. The in situ tensile curve at 1473 K and micromorphology in the surface at the phase of (a) cracks occurred, (b) cracks grew, (c) cracks on both sides, (d) cracks propagate and merge, (e) fracture occurred. All (ae) occurs during the phase of fracture.
Crystals 13 01170 g013
Table 1. Chemical composition of Nb521 alloy (wt/%).
Composition of Nb521 Alloy
WMoZrCNOCuTiFeSiTaNb
5.141.871.330.00950.00600.0100.0010.0160.0010.00280.59Bal
Table 2. Parameter values obtained by nonlinear fitting.
ε ˙ ln ( ε ˙ ) ABCmn
0.01−4.60164.2881.990.0420.4840.67
0.1−2.30149.4391.78 0.7070.637
10129.6656.400.1960.6970.893
102.30172.9865.590.0690.8240.793
Table 3. The coefficient value obtained by polynomial fitting.
ABCmn
A0 = 129.66B0 = 56.40C0 = 0.196M0 = 0.697N0 = 0.893
A1 = 0.19B1 = −12.18C1 = −0.025M1 = −0.0016N1 = 0.080
A2 = 5.95B2 = 4.20C2 = −0.013M2 = 0.0131N2 = −0.0335
A3 = 0.93B3 = 1.23 M3 = 0.00509N3 = −0.00877
Table 4. Coefficients of the polynomial for α, n, Q and c.
αnQc
C 0 = 0.0055 D 0 = 23.61 E 0 = 1120.6 F 0 = 77.69
C 1 = 0.011 D 1 = 311.7 E 1 = 13,337 F 1 = 905.11
C 2 = 0.017 D 2 = 2748.5 E 2 = 118,552 F 2 = 7930.6
C 3 = 0.012 D 3 = 11,608 E 3 = 502,966 F 3 = 33,389
C 4 = 0.0079 D 4 = 23,300 E 4 = 1,010,224 F 4 = 66,684
C 5 = 0.018 D 5 = 17,945 E 5 = 778,931 F 5 = 51,200
Table 5. Absolute error value and relative error value of three kinds of constitutive models under different deformation conditions at a strain of 0.3.
T/K ε ˙ / s 1 Δ σ J C / M P a Δ σ M J C / M P a Δ σ A R R / M P a R E σ J C ( % ) R E σ M J C ( % ) R E σ A R R ( % )
15230.01−27.32−0.09−29.42−8.95−0.03−9.64
0.1−4.52−5.01−0.95−1.35−1.50−0.29
1−25.64−2.90−11.25−6.30−0.71−2.77
101.000.2330.120.230.056.98
15730.0111.66−1.194.814.81−0.491.98
0.14.974.444.911.681.501.66
1−11.367.101.17−3.161.970.32
10−12.52−2.7017.19−3.07−0.664.21
16230.0121.44−1.268.4410.03−0.593.94
0.1−5.61−6.14−11.68−1.97−2.16−4.11
1−8.637.46−1.44−2.612.25−0.43
10−13.141.1312.55−3.460.303.31
16730.0130.973.1713.4716.561.697.20
0.1−3.29−3.80−13.95−1.26−1.45−5.33
1−12.501.72−9.60−4.010.55−3.08
10−13.853.108.40−3.920.882.38
17230.0127.24−3.297.1015.63−1.894.07
0.11.581.09−11.870.670.46−5.00
1−17.93−5.31−17.73−6.09−1.80−6.03
10−23.84−5.27−3.72−7.06−1.56−1.10
Disclaimer/Publisher’s Note: The statements, opinions and data contained in all publications are solely those of the individual author(s) and contributor(s) and not of MDPI and/or the editor(s). MDPI and/or the editor(s) disclaim responsibility for any injury to people or property resulting from any ideas, methods, instructions or products referred to in the content.

