Article

Crystal Structure of Bismuth-Containing Samarium Iron–Aluminium Borates Sm1−xBixFe3−yAly(BO3)4 (x = 0.05–0.07, y = 0–0.28) in the Temperature Range of 25–500 K

by
Ekaterina S. Smirnova
1,*,
Olga A. Alekseeva
1,
Vladimir V. Artemov
1,
Timofei A. Sorokin
1,
Dmitry N. Khmelenin
1,
Ekaterina V. Sidorova
1,
Kirill V. Frolov
1 and
Irina A. Gudim
2
1
Shubnikov Institute of Crystallography of Federal Scientific Research Centre ‘Crystallography and Photonics’, Russian Academy of Sciences, Moscow 119333, Russia
2
Kirensky Institute of Physics, Federal Research Center KSC SB RAS, Krasnoyarsk 660036, Russia
*
Author to whom correspondence should be addressed.
Crystals 2023, 13(7), 1128; https://doi.org/10.3390/cryst13071128
Submission received: 21 June 2023 / Revised: 12 July 2023 / Accepted: 15 July 2023 / Published: 19 July 2023

Abstract

:
Structural features of new mixed bismuth-containing samarium iron–aluminium borate single crystals Sm1−xBixFe3−yAly(BO3)4 (x = 0.05–0.07, y = 0–0.28) were studied using X-ray diffraction analysis based on aluminium content and temperature in the range 25–500 K. The crystals were grown using the solution-in-melt technique with Bi2Mo3O12 in a flux. The composition of the single crystals was analyzed using energy-dispersive X-ray fluorescence and energy-dispersive X-ray elemental analysis. Temperature dependencies of Sm1−xBixFe3−yAly(BO3)4 unit-cell parameters were studied. Negative thermal expansion was identified below 100 K and represented by characteristic surfaces of the thermal expansion tensor. (Sm,Bi)–O, (Sm,Bi)–(Fe,Al), (Fe,Al)–(Fe,Al), and (Fe,Al)–O interatomic distances decreased with the addition of aluminium atoms. An increase in the (Fe,Al)–(Fe,Al) intrachain bond length at low temperatures in the magnetically ordered state weakened this bond, whereas a decrease in the (Fe,Al)–(Fe,Al) interchain distance strengthened super-exchange paths between different chains. It was found that the addition of aluminium atoms influenced interatomic distances in Sm1−xBixFe3−yAly(BO3)4 much more than lowering the temperature from 293 K to 25 K. The effect of aluminium doping on magnetoelectric properties and structural symmetry of rare-earth iron borates is also discussed.

1. Introduction

Complex borates with a general formula of RM3(BO3)4 (R = La–Lu, Y; M = Al, Fe, Cr, Ga, Sc) and their solid solutions are promising materials for lasers, nonlinear optics, spintronics, and photonics since they are characterized by multifunctional properties depending on their composition and crystal structures [1].
Crystals from the rare-earth iron borate family RFe3(BO3)4 with subsystems of different magnetic ions (R and Fe) are attributed to the multiferroics due to a wide range of magnetoelectric properties caused by the complex exchange interactions between the magnetic subsystems that are responsible for the magnetic structure (easy-plane, easy-axis, or more complex arrangements of magnetic ions), the magnitude of magnetoelectric and magnetoelastic effects, the presence and temperature of spin-reorientation transition, structure phase transition, and magnetic phase transition [2,3,4,5,6,7,8,9].
Rare-earth aluminium borates RAl3(BO3)4 with only magnetic subsystem (R) combine luminescent and pronounced nonlinear optical properties and exhibit giant magnetoelectric effects with induced polarization values that are higher than for iron borates [10,11]. YAl3(BO3)4 with different doping activators is a non-linear material that is widely used in lasing technology [12].
The type of rare-earth atoms in RM3(BO3)4 influences their crystal structure. Currently, RM3(BO3)4 crystals are synthesized in trigonal crystal systems (R32, P3121, P321 space groups) or monoclinic crystal systems (C2/c, Cc, and C2 space groups) [1].
Rare-earth iron borates RFe3(BO3)4 at high temperatures belong to the trigonal space group R32, which persists down to 2–3 K for R = La–Sm. There is a structural phase transition from space group R32 (at higher temperatures) to space group P3121 (at lower temperatures) for RFe3(BO3)4 with a smaller ionic radius of rare-earth atom (R = Eu–Er), which manifests itself through anomalies in dielectric properties, thermal expansion, and magnetoelectric properties [13]. The temperature of the structural phase transition increases with the decrease in the rare-earth ion radius. The structural features of the phase transition were first described in [14], while distortions in the crystal structure appearing in RFe3(BO3)4 in the P3121 space group at lower temperatures were discussed later [15]. The iron subsystem in RFe3(BO3)4 becomes antiferromagnetically ordered below ТN = 30–40 К, and fd exchange interaction between R and Fe magnetic moments leads to the different types of magnetic anisotropy and magnetic moment orientation [16]. Various types of spin reorientations appear with a further decrease in temperature [17,18,19,20].
Most rare-earth aluminium borates, RAl3(BO3)4, also have a structure type of mineral huntite CaMg3(CO3)4 described by space group R32. However, monoclinic modifications (space group C2/c or C2) were discovered for RAl3(BO3)4 (R = Pr, Nd, Sm, Eu, Gd, Tb, Ho) crystals and the polytype nature of phases R32, C2/c, and C2 was demonstrated [21,22,23], similar to that in rare-earth chromium borates [24]. Trigonal huntite phase R32 may be present in a monoclinic view in accordance with the known transformation of rhombohedral R-cell to monoclinic C-cell [23].
The quality, structure, and composition of RM3(BO3)4 (M = Fe, Al) single crystals are highly dependent on growth techniques [1,25,26,27]. Rare-earth iron borates RFe3(BO3)4 of the highest quality and with sizes optimal for comprehensive analysis of physical properties were grown using the solution-in-melt technique following the method described in [28,29,30,31]. However, using Bi2Mo3O12 in a flux led to partial substitution of rare-earth atoms in the structures with ≈4–9% of bismuth atoms [15]. Incorporation of Bi in the RFe3(BO3)4 structure lowered the R32→P3121 transition temperature; however, other structural features associated with bismuth addition have not been identified [29,32]. RAl3(BO3)4 single crystals were grown using the solution-in-melt technique, with different fluxes or annealing of precursors [21,22,23,33,34]. The formation of monoclinic or trigonal phases was dependent on growth conditions, specifically on the crystallization temperature [22].
SmFe3(BO3)4 single crystals are known to exhibit very large magnetodielectric effects [35]. Magnetoelectric properties of SmFe3(BO3)4 single crystals were found to be dependent on twin components in the crystal structure [29].
The physical properties of SmAl3(BO3)4 have not been studied extensively. Spectroscopic properties of the monoclinic phase of SmAl3(BO3)4 were analyzed in [21] and IR-spectra were measured for trigonal SmAl3(BO3)4 in [22].
Substitution of iron atoms by aluminium atoms in the structure of RFe3−xAlx(BO3)4 can influence the magnetic structure and properties of these crystals. The modification of crystals by diamagnetic ion influences the magnetocrystalline anisotropy, and as a result, transforms the electromagnetic characteristics [36,37]. Diamagnetic substitution in Fe1–xGaxBO3 single crystals influenced Néel temperature and magnetic susceptibility [37]. Ferroelectric properties improved with increased Ti4+ substitution in Nd3+-modified Bi0.9Nd0.1Fe1−xTixO3 (0.025 ≤ x ≤ 0.100) solid solutions [38]. Thin areas of Al–O–Al structures around the magnetic domains in Ni0.4Zn0.35Co0.25Fe2−xAlxO4 (0 ≤ x ≤ 0.12) ferrite ceramic create obstacles for the movement of domain walls, increasing the coercivities [39].
A comprehensive study of a series of rare-earth iron–aluminium borate RFe3−xAlx(BO3)4 solid solutions is interesting due to possible variation or enhancement of multiferroic and optical properties induced by competition for Fe and Al ion interactions with neighbouring atoms.
In the present work, we studied the composition and crystal structure of mixed bismuth-containing Sm1−xBixFe3−yAly(BO3)4 single crystals grown for the first time using the solution-in-melt technique, analysed their structural features based on the Al content (y = 0–0.28) and the temperature (25–500 K). Information on the structural evolution of Sm1−xBixFe3−yAly(BO3)4 will be valuable for further studies of multiferroic and optical properties of mixed orthoborates R1−xR′xM3−yM′y(BO3)4 with different rare-earth and metal elements, including first-principle approaches.

2. Materials and Methods

2.1. Crystal Growth

SmFe3−yAly(BO3)4 (0 ≤ y ≤ 0.2) single crystals were grown from fluxes based on Bi2Mo3O12 [28,29]. The flux composition in the quasibinary form was (100 − n)%маss.{Bi2Mo3O12 + pB2O3 + rSm2O3} + n%маss. SmFe3−yAly(BO3)4, where n is the crystal-forming oxide concentration corresponding to the SmFe3−yAly(BO3)4 stoichiometry and p, q, and r are coefficients. The contents of the flux components and the main crystallization parameters are given in Table 1.
Areas of SmFe3−yAly(BO3)4 crystal stability and ratios of flux components were defined using the direct phase probing method. The saturation temperature Tsat was determined to an accuracy of ±2 °C using probe crystals that were obtained preliminarily from the same flux under conditions of spontaneous crystallization on a rotating Pt ring-shaped holder. The metastable zone width of ∆Тmet ≈ 12 °С was determined as the maximum supercooling temperature at which no nucleation occurred on the platinum surface over a 20-h period.
Fluxes 0.1 kg in mass were prepared at T = 1000 °C in a cylindrical platinum crucible (D = 50 mm, H = 60 mm) by melting oxides (Bi2O3, MoO3, B2O3, Sm2O3, Fe2O3, Al2O3 ) in a ratio determined using the above formula. The crucible was placed in a furnace where the temperature was reduced from the crucible bottom at a vertical gradient of 1–2 °C/cm. The flux was homogenized at T = 1000 °C for 24 h. The flux was stirred to maintain homogeneity.
Single crystals were grown in two stages. First, small crystals about 1 mm in size were grown through spontaneous crystallization at T = Tsat − (15–20) °C. They were rapidly cooled after removal from the flux. In the next stage, crystals were grown on the seeds. For this, the Pt ring-shaped holder with 10–12 visual quality seeds was immersed in the flux at Т = Тsat + 7 °С and a reversible rotation with a period of 1 min at ω = 30 rpm was turned on. After 5 min, the temperature was reduced to Т = Тsat − 7 °С. Then, the temperature was gradually reduced by 1–2 °C per day so that the crystal growth rate did not exceed 1 mm per day. Growth was completed within 3–7 days. The ring was lifted above the surface of the flux and cooled to room temperature at a rate of no more than 100 °C/h. Crystals of about 5–7 mm in size were produced via this process.
The flux was replenished with crystal-forming oxides and used repeatedly. After correcting the flux composition, SmFe3−yAly(BO3)4 crystals with stoichiometries of y = 0, 0.05, 0.1, 0.15, and 0.2 were sequentially grown.

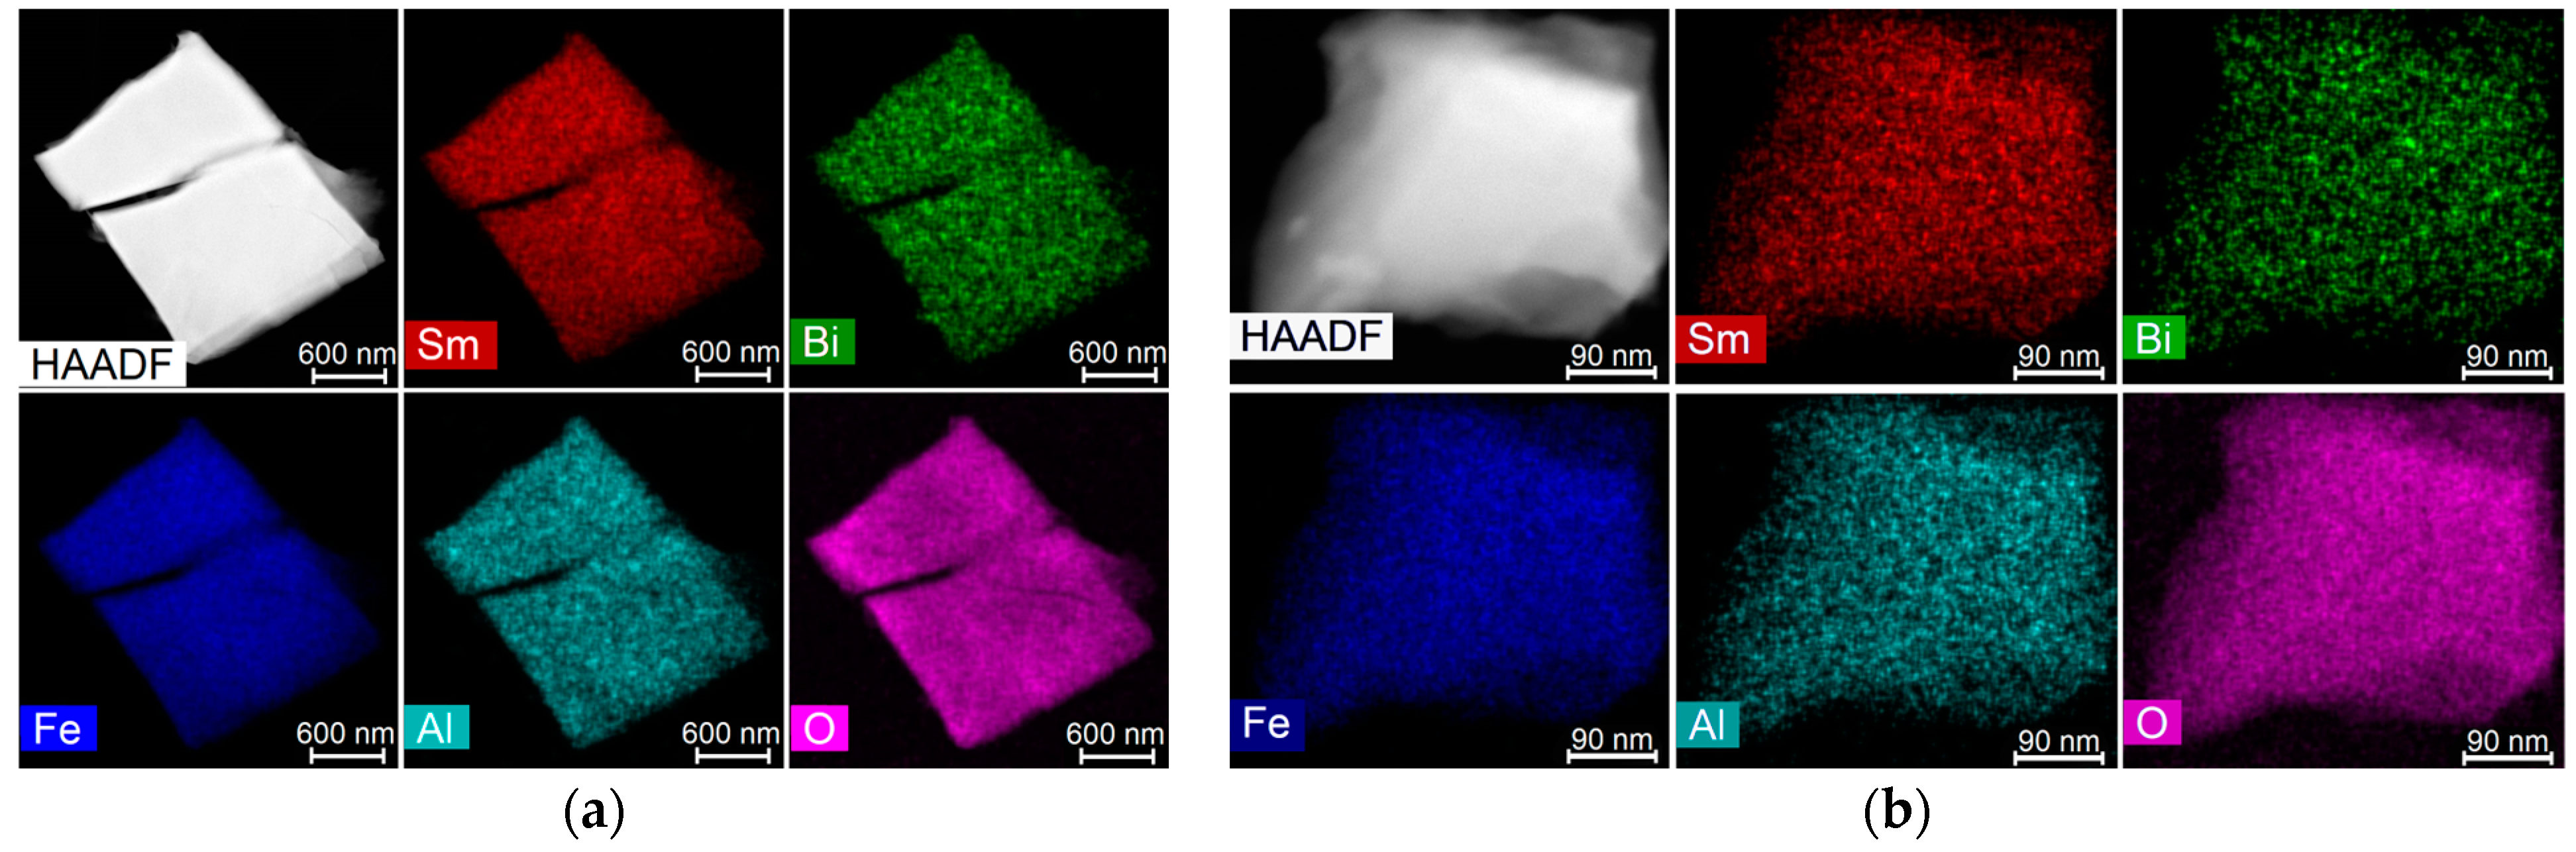
2.2. Elemental Analysis

Qualitative elemental analysis of single crystals grown using different contents of Al and a single crystal grown without Al was performed using energy-dispersive X-ray fluorescence using Orbis PC Micro-XRF Analyzer in a vacuum of 0.5 Torr. The accelerating voltage was 40 kV, the beam size was 1 mm, and the amplification time was 12.8 ms. Lines of low intensity corresponding to Al atoms were revealed in the spectra of the crystals grown in the presence of Al2O3. Additionally, low-intensity lines corresponding to Bi atoms were observed for all the crystals.
Quantitative elemental analysis of Sm1−xBixFe3−yAly(BO3)4 crystals was performed using energy-dispersive X-ray elemental analysis using an FEI Quanta 200 3D Dual Beam scanning electron microscope equipped with an EDAX microanalyzer. The accelerating voltage was 20 kV. Several measurements were taken at the same mode for different Sm1−xBixFe3−yAly(BO3)4 samples. Sm:Bi and Fe:Al atomic ratios were estimated based on At.%, assuming that Bi atoms partially substitute Sm atoms, and Al atoms partially substitute Fe atoms. The Bi content was about x = 5–7% relative to Sm in all the samples, which is consistent with results obtained previously for Bi-containing rare-earth iron borates [15]. The aluminium content was y = 0, 0.07 (1), 0.17 (1), 0.25 (1), 0.28 (1) relative to Fe.
Elemental mapping was performed for the Sm1−xBixFe3−yAly(BO3)4 sample with the highest aluminium content (y = 0.28 (1)) following EDX elemental analysis in an FEI Osiris transmission electron microscope with a HAADF (high-angle annular dark-field) X-ray detector and an EDX analysis block Bruker SuperX at an accelerating voltage of 200 kV. For these measurements, a single crystal was ground in a mortar and the samples were placed on a carbon-coated copper grid. Based on the mapping results, element distribution was uniform for different samples; low-content Bi and Al atoms were also distributed uniformly in the crystal (Figure 1).

2.3. Single Crystal X-ray Diffraction

X-ray diffraction (XRD) datasets of Sm1−xBixFe3−yAly(BO3)4 single crystals were obtained at 293 K using CCD Xcalibur EOS S2 diffractometer (Rigaku Oxford Diffraction) with a Cobra Plus temperature attachment (Oxford Cryosystems). Samples were prepared by chipping off the single crystals and generating spherical shapes using airflow in an abrasive chamber in order to correctly account for the absorption of the X-rays. The diameters of the samples were 0.26–0.34 mm. Experimental details are given in Table 2. Crystal structure files CIF S1–S5 are given in Supplementary Materials.
Temperature dependencies of the unit-cell parameters a, b, and c, and the volume of Sm1−xBixFe3−yAly(BO3)4 single crystals with the highest aluminium content, y = 0.28 (1), were measured at temperatures of 85–500 K using Rigaku XtaLAB Synergy-DW (Rigaku Oxford Diffraction) diffractometer with a rotating anode (MoKα-radiation) and a Rigaku HyPix-Arc 150° detector. The temperature was set using a flow of nitrogen gas via a Cobra Plus temperature attachment (Oxford Cryosystems). The chipped single crystals of size 0.03–0.06 mm were glued to the glass fibre using epoxy resin and used for measurement. An experimental strategy 20 min in duration was conducted, with at least 60 min between experiments.
Complete X-ray diffraction datasets of Sm1−xBixFe3−yAly(BO3)4 with an aluminium content of y = 0.28 (1) were obtained at temperatures of 25, 30, 35, 40, 50, 60, 70, and 80 K (helium gas flow) and 110, 150, 220, and 293 K (nitrogen gas flow) using Rigaku XtaLAB Synergy-DW (Rigaku Oxford Diffraction) diffractometer and N-Helix temperature attachment (Oxford Cryosystems). A single crystal with an irregular shape and a size of 0.06–0.14 mm was used. The experimental strategy, which ensured the completeness of the measurements, was 1 h 20 min in duration. The time between experiments was at least 10 min for crystal temperature stabilization. The experimental details are given in Table 3. Crystal structure files CIF S6–S17 are given in Supplementary Materials.
There was a systematic difference between the unit-cell parameters a, b, and c and the volume obtained using Cobra Plus and N-Helix temperature attachments that was considered based on the shift in Cobra Plus dependencies to N-Helix dependencies using a coefficient as described in [40].
Analysis of the three-dimensional distribution of reflection peaks, unit-cell finding, and integration of diffraction intensities was performed using CrysAlisPro software [41]. The structures were refined using the least-squares method and anisotropic approximation of atomic displacements using the Jana2006 program [42].
The trigonal unit cell (hexagonal setting) was chosen for all the crystals based on the analysis of three-dimensional diffraction peak distribution (Table 2 and Table 3). More than 97% (3D peak hunting procedure [41]) or 73% (Smart peak hunting procedure for datasets obtained using CCD detector [41]) of observed reflections were indexed in the chosen trigonal unit cells for all the samples. Reflection tails and lambda-half reflections were deleted for accurate indexation [41] and there were no additional phases found. In the case of a forced search for a monoclinic unit cell of SmAl3(BO3)4 [21], the same quantity of observed reflections was indexed in the unit cell. However, the regular absence of reflections in the reciprocal lattice points in the case of a monoclinic unit cell indicated the wrong choice of the monoclinic unit cell for the crystals studied in the present work (Appendix A).
For datasets obtained using the Synergy-DW diffractometer, both empirical and numerical correction for a multifaceted crystal were performed during finalization in CrysAlisPro. For datasets obtained using Xcalibur EOS S2, empirical correction was performed in CrysAlisPro and correction for a spherical shape was performed in Jana2006.
It was confirmed that Bi atoms partially substitute Sm atoms in their positions, and Al atoms partially substitute Fe atoms, consistent with Shannon ionic radii (0.958 Å for Sm3+ and 1.03 Å for Bi3+ with the coordination number VI; 0.645 Å for high-spin Fe3+ and 0.535 Å for Al3+ with the coordination number VI) [43,44]. Sm:Bi and Fe:Al ratios in the final chemical formulas (Table 2) were based both on elemental analysis and XRD refinement. Splitting Sm:Bi and Fe:Al positions did not significantly influence refinement disagreement factors and residual electron density, therefore identical coordinates and anisotropic displacement parameters (ADPs) for Sm and Bi, and for Fe and Al were used, and the sums of overall occupancy factors were constrained.
Absolute configuration was considered by refining the ratio of the volumes of the racemic twin components (Flack parameter) [45]. Taking into account the extinction effect, the best Becker–Coppens model [46,47] was selected for each of the experiments where the orientation of the mosaic blocks was distributed according to the Lorentz law (type 1).
Coefficients and characteristic surfaces of thermal expansion tensor were obtained based on the temperature dependencies of unit-cell parameters using the ThetaToTensor (TTT) program [48]. Unit cell parameter a was fitted using polynomials of the second degree and parameter c was best fitted using the third-degree polynomial over the temperature range 25–500 K. Fitting parameters a and c using different second-degree polynomials within the temperature intervals led to similar shapes of thermal expansion figures in the temperature range 25–500 K but with more complicated temperature dependencies of thermal expansion eigenvalues, which was considered unreliable. Thermal expansion coefficient eigenvalues are given in Table 4.
Based on the values of the equivalent isotropic atomic displacement parameters Ueq obtained for atoms in the Sm0.93Bi0.07Fe2.72Al0.28(BO3)4 structure at 12 temperatures, the characteristic Debye temperature (TD) and Einstein temperature (TE) were calculated (Table 5) using the models described in [49]. Model Ueq (T) dependencies in both approximations were obtained. Effective relative atomic masses for (Sm,Bi) and (Fe,Al) atoms were used for the calculations. The modelling agreement factors are given in Table 5.
Three-dimensional visualization of electron density distribution was additionally obtained using the maximum entropy method (MEM) implemented in the Dysnomia software [50]. Calculations were performed based only on observed structure amplitudes, Fobs, using the lowest possible P1 symmetry in order not to restrain electron density map by symmetry laws and to get a more detailed distribution.
Quantitative measurements of coordination polyhedra distortions from ideal symmetry were performed using the Polynator program [51] by minimizing the squares of vertex deviations.

3. Results and Discussion

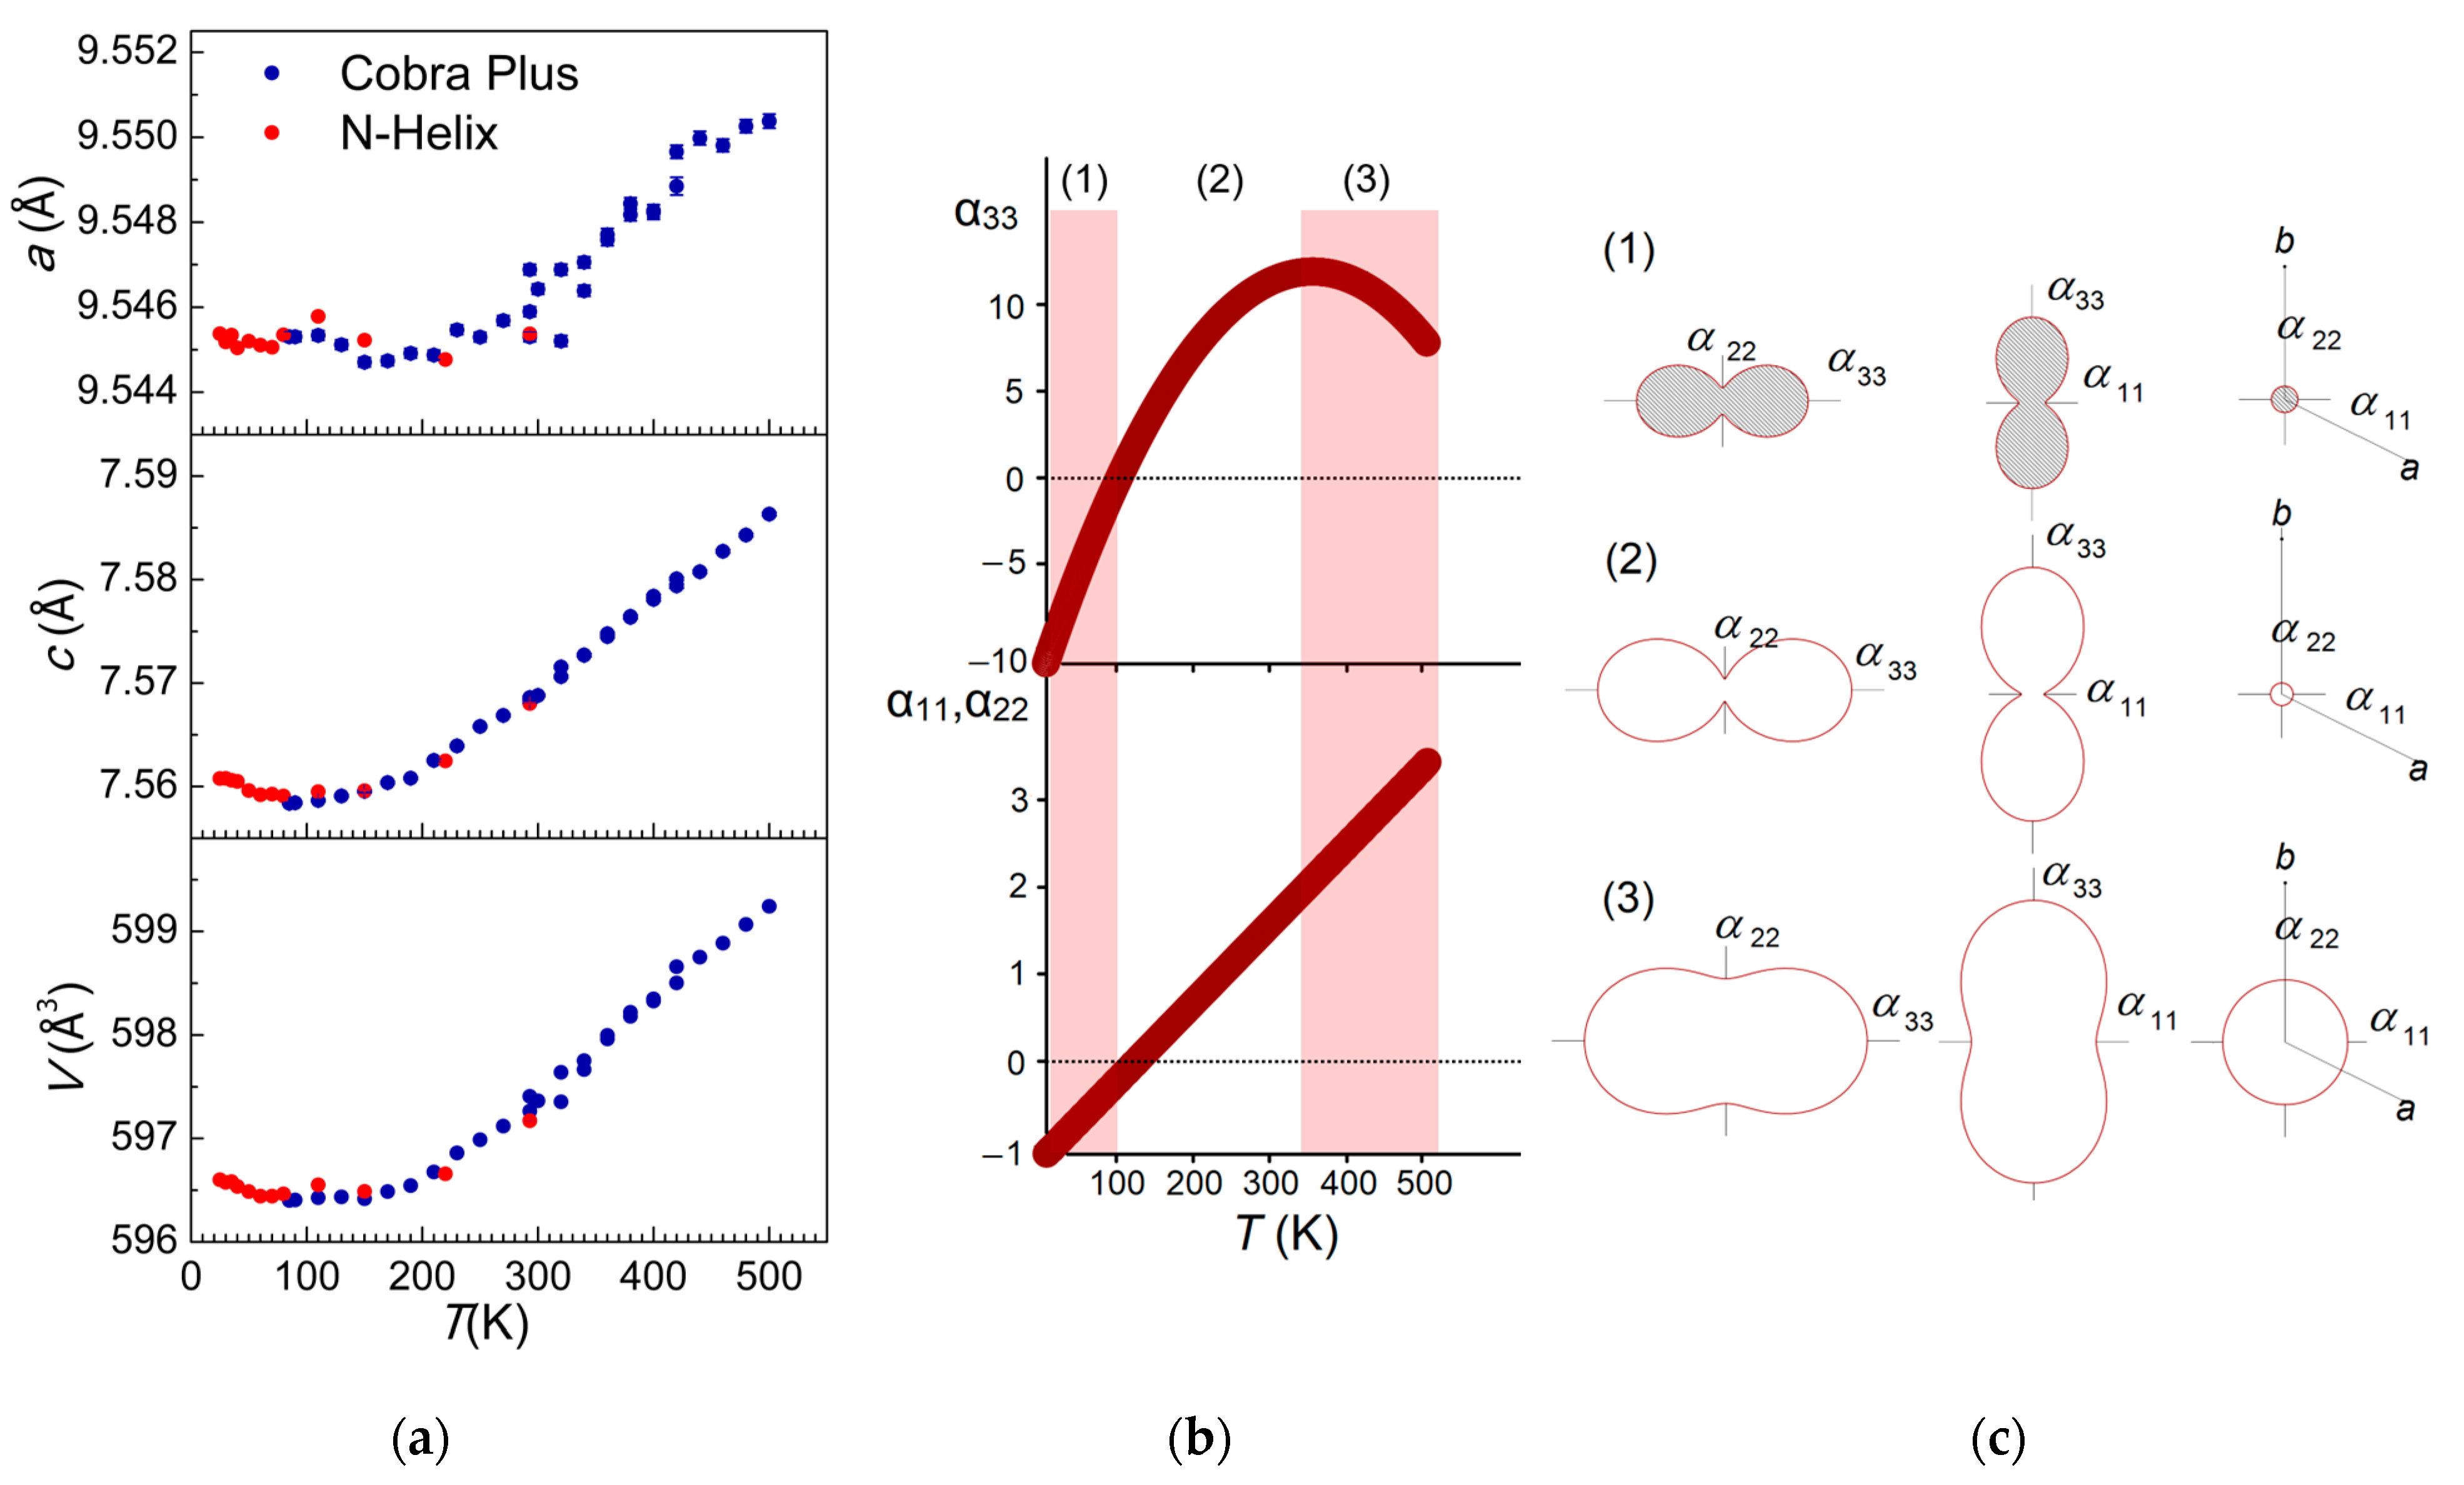
3.1. Temperature Dependencies of Unit-Cell Parameters

Unit cell parameters of Sm1−xBixFe3−yAly(BO3)4 (x = 0.05–0.07, y = 0–0.28) single crystals (Table 2) decreased with an increase in aluminium content from 0 to 0.28. This agrees with the difference in Shannon ionic radii [43,44].
There were no structural phase transitions in Sm0.93Bi0.07Fe2.72Al0.28(BO3)4 in the 25–500 K temperature range based on lattice parameter dependencies (Figure 2a). Temperature dependencies of Sm0.93Bi0.07Fe2.72Al0.28(BO3)4 unit-cell parameters (Figure 2a) demonstrate similar behaviours to those of samarium and neodymium iron borates, which do not have structural phase transitions from the R32 space group at low temperatures but demonstrate magnetic ordering below TN = 32−33 K [32,40].
Unit-cell parameter c undergoes the most pronounced change over the 25–500 K temperature range (Figure 2a): Between 25 K and 85 K it decreases by about 0.002 Å as the temperature rises, and after that it increases steadily by about 0.028 Å from 85 K to 500 K. Unit-cell parameter a varies by no more than 0.0007 Å between 25 and 110 K and then slightly increases by about 0.006 Å from 110 K to 500 K. Unit-cell volume demonstrates the effect of negative thermal expansion, reflecting the behaviour of parameter c. Between 25 K and 85 K, the volume decreases by about 0.1 Å3 and then increases by about 2.8 Å3 (Figure 2a). Such effects of negative thermal expansion were discovered in rare-earth iron borates in both space groups R32 and P3121, and were associated with an increase in Fe–Fe intrachain distances and Fe–O–Fe angles in chains along the c-axis formed by FeO6 distorted octahedra [15].
This effect on Sm0.93Bi0.07Fe2.72Al0.28(BO3)4 was additionally demonstrated by modelling the thermal expansion coefficient based on measured unit-cell parameters (Figure 2b,c, and Figure 3). It can be seen that the main changes in eigenvalues of the tensor appear in the c-axis direction (coefficient α33Figure 2c and Figure 3, Table 4). Below 100 K, all coefficients—αa, αb, αc and αV—are negative and negative thermal expansion (contraction) is observed principally in the c direction (Figure 3, Table 4). Contraction is more pronounced at lower temperatures and approaches zero at about 100 K. The thermal expansion coefficient becomes positive in the c direction at about 100 K and in the ab direction at about 120 K (Figure 2b, Table 4). At higher temperatures closer to 500 K, expansion in the ab plane (α11, α22) begins to compete with expansion in the c direction (α33) and the thermal expansion figure becomes closer to isotropic (Figure 2c and Figure 3).

3.2. Crystal Structure of Sm1−xBixFe3−yAly(BO3)4 at Room Temperature

Structures of Sm1−xBixFe3−yAly(BO3)4 (x = 0.05–0.07, y = 0–0.28) single crystals were refined in trigonal R32 space group, Z = 3 (Table 2, Figure 4). Detailed descriptions of the crystal structures of rare-earth iron borates in this space group can be found in [14,15,32,40,52].
There is one Wyckoff atomic position (3a) for (Sm,Bi) atoms, one (9d) position for (Fe,Al) atoms, two positions for boron atoms [B1 (3b) and B2 (9e)], and three positions for oxygen atoms [O1(9e), O2(9e), O3(18f)] (Figure 4). There are layers of (Sm,Bi) and (Fe,Al) atoms, which alternate in the c-axis direction with layers of two types of BO3 triangles. Equilateral triangle B1O3 is parallel to the ab plane, while the isosceles triangle B2O3 deviates from it slightly. (Sm,Bi) atoms are in trigonal (Sm,Bi)O6 prisms whose bases are slightly rotated relative to each other. (Fe,Al) atoms are in distorted (Fe,Al)O6 octahedra connected by the edges and form helicoidal chains along the c-axis. B1O3 triangles are connected only to three (Fe,Al)O6 chains, whereas B2O3 triangles are connected both to (Fe,Al)O6 octahedra and (Sm,Bi)O6 prisms. (Sm,Bi)O6 prisms are connected to three (Fe,Al)O6 chains directly or through B2O3 triangles (Figure 4).
The characters of electron density distributions are similar for Sm1−xBixFe3−yAly(BO3)4 single crystals with y = 0, 0.07, 0.17, 0.25 and 0.28 (Figure 5). The electron density distribution maps do not show significant anisotropy of the (Sm,Bi) and (Fe,Al) positions, which, together with low values of structure refinement factors and values of residual electron density, Δρmax and Δρmin, indicates a low degree of local disordering at these positions. The highest values of residual electron density not accounted for (Table 2) are spread at distances of 0.28–1.03 Å from the (Sm,Bi) position. This residual density can originate from the configuration of electron shells or can be a result of features of mathematical apparatus used in the least squares refinement method [53,54].
Analysis of the Flack parameter (Table 2) demonstrated that Sm1−xBixFe3−yAly(BO3)4 single crystals with y = 0, 0.07, 0.17, 0.25, and 0.28 can be merohedral racemic twins (for two components of which perfect overlapping of reflections is observed, and twin operation is inversion). Two of the crystals (y = 0 and 0.28) were merohedral racemic twins with almost equal ratios of opposite twin components. The ratios of the two twin components of the sample with y = 0.17 were unequal. Two other samples (y = 0.07, 0.25) were almost monodomain (Table 2). Therefore, Sm1−xBixFe3−yAly(BO3)4 single crystals have different absolute configurations that have to be taken into account when studying their physical properties.
Relative atomic coordinates of samples with absolute configuration parameter Flack > 0.5 (opposite chirality to the modelled one) were not inverted for the convenience of structure comparison. The single crystal chosen for the temperature XRD experiments was almost monodomain (Flack ≈ 0, Table 3).
A slight decrease of ≈0.004 Å in (Sm,Bi)–O3 interatomic distances in a distorted trigonal (Sm,Bi)O6 prism occurs as the content of aluminium increases from 0 to 0.28 (Figure 6a). The decrease in distances from the (Sm,Bi) atom to the more distant oxygen atom O2(9e) is ≈0.011 Å. O2 atoms connect B2O3 triangles with iron chains (Figure 4). They have a special role in structural rearrangement in rare-earth iron borates with ionic radii smaller than that of Sm having R32→P3121 structural phase transition. O2 splits into two independent positions below the structural phase transition temperature; oxygen atoms from one approaches R-atom and influences the paths of exchange bonding [15]. Therefore, a noticeable decrease in (Sm,Bi)–O2 distance with the inclusion of aluminium atoms could also influence the exchange paths at lower temperatures. There is also a noticeable decrease of ≈0.013 Å in distances between (Sm,Bi) and (Fe,Al) atoms, which could influence indirect (Sm,Bi)–(Fe,Al) interaction (Figure 6e).
(Fe,Al)–O distances in distorted (Fe,Al)O6 octahedra also decrease with the increase in the content of aluminium (Figure 6b). (Fe,Al)–O distances of different types decrease almost uniformly by ≈0.011–0.012 Å. (Fe,Al)–(Fe,Al) distances in the same chain decrease by ≈0.018 Å with the addition of Al, and the closest distance between two (Fe,Al)–(Fe,Al) chains decreases by ≈0.009 Å (Figure 6f).
Boron coordination is the most stable, depending on the aluminium content (Figure 6c,d), similar to the temperature dependence of boron coordination [15]. B1–O distance varies by no more than ≈0.0003 Å, B2–O2 distance increases by ≈0.0014 Å, and B2–O3 distance decreases by ≈0.0023 Å with Al addition.

3.3. Crystal Structure of Sm0.93Bi0.07Fe2.72Al0.28(BO3)4 in the 25–293 K Temperature Range

The structure of Sm0.93Bi0.07Fe2.72Al0.28(BO3)4 single crystal was refined in trigonal space group R32, Z = 3 at all the temperatures studied (Table 3). There were no reflections corresponding to systematic absences.
Interatomic distances were analyzed in Sm0.93Bi0.07Fe2.72Al0.28(BO3)4 depending on temperature. Crystal structural features of Sm0.93Bi0.07Fe2.72Al0.28(BO3)4 in low-temperature regions are of interest since there is a magnetic phase transition below TN = 31.93 (5) K for samarium iron borate [32]. The negative thermal expansion, observed for rare-earth iron borates below 100 K, was accompanied by an increase in Fe–Fe intrachain distances and Fe–O–Fe angles when the temperature was lowered from 90 K to 25 K; however, this observation needs additional analysis [15].
This distinct behaviour of (Fe,Al)–(Fe,Al) chains is also observed in Sm0.93Bi0.07Fe2.72Al0.28(BO3)4 (Figure 7f,g). Distances between (Fe,Al) atoms in the same chain decrease by ≈0.0025 Å when the temperature is lowered from 293 K to 150 K, before increasing by ≈0.0032 Å such that the (Fe,Al)–(Fe,Al) distance at 25 K is higher than the distance at 293 K (Figure 7f). At the same time, the closest distance between different (Fe,Al)–(Fe,Al) chains decreases slowly by ≈0.002 Å from 293 K to 60 K and then drops by ≈0.0027 Å from 60 K to 25 K (Figure 7f). The (Fe,Al)–O–(Fe,Al) intrachain angles increased when the temperature dropped below 100 K (Figure 7g).
(Fe,Al)–O1 distance in (Fe,Al)O6 octahedra decreases by ≈0.0019 Å, (Fe,Al)–O2 distance decreases by ≈0.0029 Å, and (Fe,Al)–O3 distance does not change by more than ≈0.0011 Å (Figure 7e) as the temperature is lowered.
B1–O distance in the B1O3 triangle increases slightly by ≈0.0016 Å, B2–O2 distance in the B2O3 triangle increases by ≈0.004 Å, and B2–O3 distance does not change by more than ≈0.0008 Å (Figure 7c,d) as the temperature is lowered. The angle of deviation of B2O3 from the ab plane is equal to 6.3 (1)° in the whole 25–293 K temperature range.
The distance between (Sm,Bi) and (Fe,Al) magnetic atoms decreases by ≈0.0019 Å as the temperature is lowered from 293 K to 150 K, but does not change by more than ≈0.0002 Å as the temperature decreases to 25 K (Figure 7b).
(Sm,Bi)–O3 distance in the (Sm,Bi)O6 prism decreases by ≈0.0018 Å as the temperature is lowered from 293 K to 25 K, but the distance to the more distant oxygen atom O2 in (Sm,Bi)–O2) changes by no more than ≈0.0007 Å (Figure 7a).
Therefore, even though no structural phase transition occurs in Sm0.93Bi0.07Fe2.72Al0.28(BO3)4 in the 25–293 K temperature range, there are noticeable non-uniform structural changes below 100 K that can precede the appearance of magnetic arrangement.
Figure 8 demonstrates the shifts in the vertices of (Fe,Al)O6 octahedra (O1, O2, O3) from the ideal positions in the regular octahedron modelled around (Fe,Al) atoms based on both Al content and temperature. The shift in oxygen vertex O2 is the most pronounced across all the Al contents and temperatures analysed, which additionally highlights its role in structural rearrangement. The shift in all the vertexes increases as the temperature reduces in the negative thermal expansion region, another evidence that negative thermal expansion is associated with the rearrangement of (Fe,Al)O6 chains.
Change observed in the temperature dependence of (Fe,Al)–(Fe,Al) interchain and intrachain, (Sm,Bi)–(Fe,Al) distances between magnetic ions in the region of negative thermal expansion could lead to the evolution of exchange and super-exchange paths at lower temperatures. The increase in (Fe,Al)–(Fe,Al) intrachain bond lengths at low temperatures could weaken this bond, whereas a decrease in (Fe,Al)–(Fe,Al) interchain distances and unchanged (Sm,Bi)–(Fe,Al) distances at low temperatures could strengthen super-exchange paths between different chains.
However, Section 3.2 and Section 3.3 showed that the addition of aluminium atoms had a stronger influence on interatomic distances in Sm1−xBixFe3−yAly(BO3)4 structures than lowering the temperature from 293 K to 25 K. Thus, growing Sm1−xBixFe3−yAly(BO3)4 single crystals using a higher concentration of Al is of interest since a decrease in (Sm,Bi)–(Fe,Al), (Sm,Bi)–O2, and (Fe,Al)–(Fe,Al) distances could influence magnetoelectric properties at low temperatures. Besides that, substituting iron atoms in RFe3(BO3)4 structures with R = Eu–Er with atoms of other metals could highlight the influence of these atoms on R32→P3121 structural phase transition.

3.4. Atomic Displacement Parameters

Equivalent isotropic parameters Ueq of atomic displacements (ADPs) in Sm0.93Bi0.07Fe2.72Al0.28(BO3)4 decrease as the temperature is lowered (Figure 9). Similar to the (Sm0.93Bi0.07)Fe3(BO3)4 structure [32], the most steep dependence is that of Ueq(T) for (Sm,Bi) and O2 atoms. At high temperatures, Ueq of (Sm,Bi) is higher than Ueq of Fe; however, these values approach convergence at 25 K (Figure 9a), which could reflect the exchange interaction difference at high and low temperatures. O2 atoms have the highest value of Ueq across the whole temperature range analysed. It is worth noting that the highest Ueq of all the atoms in the structures of NdGa3(BO3)4 (P3121 space group) [55], NdSc3(BO3)4 [56], and HoAl3(BO3)4 [57] (R32 space group) are of the oxygen atoms corresponding to O2(9e) in the Sm0.93Bi0.07Fe2.72Al0.28(BO3)4 structure (which splits into two independent positions in the P3121 space group).
Einstein and Debye temperatures (TE and TD) calculated based on Ueq (T) fitting, as well as the difference between the temperatures of the different atoms (Table 5), are comparable to those obtained previously for (Sm0.93Bi0.07)Fe3(BO3)4 single crystal [32]. TE and TD of (Sm,Bi) atoms are equal within an error for the single crystal with aluminium content of y = 0.28 and for the crystal without Al. TE and TD of (Fe,Al) atoms in the structure of Sm0.93Bi0.07Fe2.72Al0.28(BO3)4 are a little higher (close to an error value) than the TE and TD of Fe atoms in the (Sm0.93Bi0.07)Fe3(BO3)4 structure.
Boron atoms had the maximum difference, ΔTDE, corresponding to the largest number of possible vibrational modes, while (Sm,Bi) atoms had the lowest ΔTDE. Boron atoms also had the highest TE and TD, indicating the strongest interaction with neighbouring atoms. (Sm,Bi) atoms had the lowest TE and TD, indicating the weakest interaction with neighbouring atoms.
Temperature dependences of Ueq were well fitted using single curves (Table 5, Figure 9a). This agrees with the absence of structural phase transition in the 25–500 K temperature range. However, it was reported earlier that Ueq fitting [49] using several curves could be used to detect effects implicit to other structural parameters [58,59]. Therefore, the Ueq temperature dependence of boron atoms B2 (9e), having the least smooth character, was fitted over 40–80 K and 110–293 K temperature ranges using two curves. This significantly improved the accuracy of fitting (Figure 9b, Table 5). The chosen low-temperature range of 40–80 K is the identified range of negative thermal expansion (Figure 2). Besides that, including 25 K and 30 K temperature points in the fitting worsened the refinement, which could be due to magnetic phase transition below 40 K. Splitting temperature intervals into two did not improve fitting in the case of B1 (3b) atom, but improved the refinement of O2 (9e) atoms (Figure 9c—modelling curves in the ranges 25–80 K and 110–293 K).
Thus, atomic displacement parameters are sensitive to subtle structural changes in Sm0.93Bi0.07Fe2.72Al0.28(BO3)4, associated with negative thermal expansion.

4. Conclusions

Unit-cell parameters of Sm1−xBixFe3−yAly(BO3)4 (x = 0.05–0.07, y = 0–0.28) single crystals decrease as the aluminium content increases from 0 to 0.28. Temperature dependence of Sm0.93Bi0.07Fe2.72Al0.28(BO3)4 unit-cell parameters do not show any structural phase transition in the 25–500 K temperature range and is similar to that of rare-earth iron borates without R32→P3121 structural phase transition. Negative thermal expansion of Sm0.93Bi0.07Fe2.72Al0.28(BO3)4 was identified below 100 K and was characterized by the characteristic surfaces of the thermal expansion tensor.
No significant anisotropy of electron density close to the (Sm,Bi) and (Fe,Al) positions in Sm1−xBixFe3−yAly(BO3)4 (x = 0.05–0.07, y = 0–0.28) was observed.
(Sm,Bi)–O, (Sm,Bi)–(Fe,Al), (Fe,Al)–(Fe,Al), and (Fe,Al)–O interatomic distances decreased with the addition of aluminium atoms to Sm1−xBixFe3−yAly(BO3)4 (x = 0.05–0.07, y = 0–0.28).
Temperature dependencies of these distances in Sm0.93Bi0.07Fe2.72Al0.28(BO3)4 differed in the region of negative thermal expansion and at higher temperatures. An increase in (Fe,Al)–(Fe,Al) intrachain bond length at low temperatures in the magnetically ordered state could weaken this bond, whereas a decrease in (Fe,Al)–(Fe,Al) interchain distance together with unchanged (Sm,Bi)–(Fe,Al) distance could strengthen super-exchange paths between different chains. Temperature dependence of equivalent isotropic displacement parameters of O2 and B2 atoms vary in the range of negative thermal expansion.
The addition of aluminium atoms influences interatomic distances in Sm1−xBixFe3−yAly(BO3)4 more strongly than lowering the temperature from 293 K to 25 K. Thus, substituting iron atoms in Sm1−xBixFe3−yAly(BO3)4 single crystal with a higher content of Al, as well as substituting iron atoms in RFe3(BO3)4 (R = Eu–Er) with other metal atoms could influence magnetoelectric properties and structural symmetry.

Supplementary Materials

The following supporting information can be downloaded at https://www.mdpi.com/article/10.3390/cryst13071128/s1, Structure information CIF-files: S1–S5 for Sm1−xBixFe3−yAly(BO3)4 (x = 0.05–0.07, y = 0–0.28) at 293 K and CIF S6–S17 for Sm0.93Bi0.07Fe2.72Al0.28(BO3)4 in the temperature range 25–293 K.

Author Contributions

Conceptualization, O.A.A., E.S.S. and K.V.F.; methodology, O.A.A., E.S.S., I.A.G. and K.V.F.; validation, O.A.A., E.S.S. and K.V.F.; formal analysis, E.S.S., O.A.A. and K.V.F.; crystal growth, I.A.G.; EDX analysis, V.V.A. and D.N.K.; XRF analysis, T.A.S. and E.S.S.; single-crystal XRD, E.S.S. and E.V.S.; data curation, E.S.S., V.V.A., E.V.S., T.A.S., D.N.K. and I.A.G.; writing—original draft preparation, E.S.S., I.A.G., O.A.A. and K.V.F.; writing—review and editing, O.A.A., K.V.F. and E.S.S.; visualization, E.S.S.; supervision, O.A.A. and K.V.F.; project administration, O.A.A. and K.V.F. All authors have read and agreed to the published version of the manuscript.

Funding

This work was supported by the Russian Science Foundation (project No 23-22-00286).

Data Availability Statement

Crystal structure datasets were deposited via the joint CCDC/FIZ Karlsruhe deposition service at https://www.ccdc.cam.ac.uk (accessed on 14 July 2023) and assigned Deposition Numbers CSD 2271124–2271140.

Acknowledgments

This work was conducted using equipment at the Shared Research Center FSRC ‘Crystallography and Photonics’ RAS.

Conflicts of Interest

The authors declare no conflict of interest.

Appendix A

The appendix presents a comparison of reflection indexation in monoclinic and trigonal unit cells of Sm0.93Bi0.07Fe2.72Al0.28(BO3)4 single crystals at 25 K. 3D diffraction patterns were collected using XtaLAB Synergy-DW diffractometer with HyPix-Arc 150° detector and rotating anode (Mo Kα radiation). UB-matrix fitting of the monoclinic unit cell with parameters a = 7.4737(3) Å, b = 9.5516(3) Å, c = 11.4930(5) Å, β =103.820(4) was performed using 18 145 observed reflections out of 18 177 total reflections (99.82%). UB fitting of the trigonal unit cell was performed using 18 165 observed reflections out of 18 177 total reflections (99.93%). However, visual analysis of the monoclinic lattice chosen highlights the wrong choice of unit cell since reflections in the reciprocal lattice points were regularly absent in the case of the monoclinic unit cell (Figure A1a), whereas all reciprocal lattice points contained reflections in the case of the trigonal lattice (Figure A1b). Although reflections in the monoclinic space group C2/c were averaged with Rint = 9.01% (which is comparable to averaging in trigonal space group R32, Table 3), the search for the initial model of heavy atoms was not successful in the C2/c space group and the refinement of the initial structure model from [21] failed when refinement factor R > 20%.

References

  1. Kuz’micheva, G.; Kaurova, I.; Rybakov, V.; Podbel’skiy, V. Crystallochemical Design of Huntite-Family Compounds. Crystals 2019, 9, 100. [Google Scholar] [CrossRef] [Green Version]
  2. Kadomtseva, A.M.; Popov, Y.F.; Vorob’ev, G.P.; Pyatakov, A.P.; Krotov, S.S.; Kamilov, K.I.; Ivanov, V.Y.; Mukhin, A.A.; Zvezdin, A.K.; Kuz’menko, A.M.; et al. Magnetoelectric and Magnetoelastic Properties of Rare-Earth Ferroborates. Low Temp. Phys. 2010, 36, 511–521. [Google Scholar] [CrossRef]
  3. Vasiliev, A.N.; Popova, E.A. Rare-Earth Ferroborates RFe3(BO3)4. Low Temp. Phys. 2006, 32, 735–747. [Google Scholar] [CrossRef]
  4. Kuz’menko, A.M.; Mukhin, A.A.; Ivanov, V.Y.; Kadomtseva, A.M.; Bezmaternykh, L.N. Effects of the Interaction between R and Fe Modes of the Magnetic Resonance in RFe3(BO3)4 Rare-Earth Iron Borates. JETP Lett. 2011, 94, 294–300. [Google Scholar] [CrossRef]
  5. Kuzmenko, A.M.; Szaller, D.; Kain, T.; Dziom, V.; Weymann, L.; Shuvaev, A.; Pimenov, A.; Mukhin, A.A.; Ivanov, V.Y.; Gudim, I.A.; et al. Switching of Magnons by Electric and Magnetic Fields in Multiferroic Borates. Phys. Rev. Lett. 2018, 120, 027203. [Google Scholar] [CrossRef] [Green Version]
  6. Popova, M.N.; Boldyrev, K.N.; Klimin, S.A.; Stanislavchuk, T.N.; Sirenko, A.A.; Bezmaternykh, L.N. Spectral Signatures of Spin-Phonon and Electron-Phonon Interactions in Multiferroic Iron Borates. J. Magn. Magn. Mater. 2015, 383, 250–254. [Google Scholar] [CrossRef] [Green Version]
  7. Hinatsu, Y.; Doi, Y.; Ito, K.; Wakeshima, M.; Alemi, A. Magnetic and Calorimetric Studies on Rare-Earth Iron Borates LnFe3(BO3)4 (Ln = Y, La-Nd, Sm-Ho). J. Solid. State Chem. 2003, 172, 438–445. [Google Scholar] [CrossRef]
  8. Ritter, C.; Pankrats, A.; Gudim, I.; Vorotynov, A. Determination of the Magnetic Structure of SmFe3(BO3)4 by Neutron Diffraction: Comparison with Other RFe3(BO3)4 Iron Borates. J. Phys. Condens. Matter. 2012, 24, 386002. [Google Scholar] [CrossRef]
  9. Popov, Y.F.; Kadomtseva, A.M.; Vorob’ev, G.P.; Mukhin, A.A.; Ivanov, V.Y.; Kuz’menko, A.M.; Prokhorov, A.S.; Bezmaternykh, L.N.; Temerov, V.L. Observation of Spontaneous Spin Reorientation in Nd1−xDyxFe3(BO3)4 Ferroborates with a Competitive R-Fe Exchange. JETP Lett. 2009, 89, 345–351. [Google Scholar] [CrossRef]
  10. Liang, K.-C.; Chaudhury, R.P.; Lorenz, B.; Sun, Y.Y.; Bezmaternykh, L.N.; Temerov, V.L.; Chu, C.W. Giant Magnetoelectric Effect in HoAl3(BO3)4. Phys. Rev. B 2011, 83, 180417. [Google Scholar] [CrossRef] [Green Version]
  11. Liang, K.-C.; Chaudhury, R.P.; Lorenz, B.; Sun, Y.Y.; Bezmaternykh, L.N.; Gudim, I.A.; Temerov, V.L.; Chu, C.W. Magnetoelectricity in the System RAl3(BO3)4 (R = Tb, Ho, Er, Tm). J. Phys. Conf. Ser. 2012, 400, 032046. [Google Scholar] [CrossRef] [Green Version]
  12. Sváb, E.; Beregi, E.; Fábián, M.; Mészáros, G. Neutron Diffraction Structure Study of Er and Yb Doped YAl3(BO3)4. Opt. Mater. 2012, 34, 1473–1476. [Google Scholar] [CrossRef]
  13. Kadomtseva, A.M.; Kuvardin, A.V.; Pyatakov, A.P.; Zvezdin, A.K.; Vorob’ev, G.P.; Popov, Y.F.; Bezmaternykh, L.N. Magnetic Magnetoelectric and Magnetoelastic Properties of New Multiferroic Material NdFe3(BO3)4. arXiv 2006, arXiv:cond-mat/0607217v1. [Google Scholar] [CrossRef]
  14. Klimin, S.A.; Fausti, D.; Meetsma, A.; Bezmaternykh, L.N.; Van Loosdrecht, P.H.M.; Palstra, T.T.M. Evidence for Differentiation in the Iron-Helicoidal Chain in GdFe3(BO3)4. Acta Crystallogr. B 2005, 61, 481–485. [Google Scholar] [CrossRef] [PubMed] [Green Version]
  15. Alekseeva, O.A.; Smirnova, E.S.; Frolov, K.V.; Lyubutina, M.V.; Lyubutin, I.S.; Gudim, I.A. Crystal Structure Dynamics of RFe3(BO3)4 Single Crystals in the Temperature Range 25–500 K. Crystals 2022, 12, 1203. [Google Scholar] [CrossRef]
  16. Zvezdin, A.K.; Krotov, S.S.; Kadomtseva, A.M.; Vorob’ev, G.P.; Popov, Y.F.; Pyatakov, A.P.; Bezmaternykh, L.N.; Popova, E.A. Magnetoelectric Effects in Gadolinium Iron Borate GdFe3(BO3)4. J. Exp. Theor. Phys. Lett. 2005, 81, 272–276. [Google Scholar] [CrossRef]
  17. Frolov, K.V.; Lyubutin, I.S.; Smirnova, E.S.; Alekseeva, O.A.; Verin, I.A.; Artemov, V.V.; Kharlamova, S.A.; Bezmaternykh, L.N.; Gudim, I.A. Low-Temperature Structural and Magnetic Phase Transitions in Multiferroic GdFe3(BO3)4. J. Alloys Compd. 2016, 671, 545–551. [Google Scholar] [CrossRef]
  18. Ritter, C.; Balaev, A.; Vorotynov, A.; Petrakovskii, G.; Velikanov, D.; Temerov, V.; Gudim, I. Magnetic Structure, Magnetic Interactions and Metamagnetism in Terbium Iron Borate TbFe3(BO3)4: A Neutron Diffraction and Magnetization Study. J. Phys. Condens. Matter 2007, 19, 196227. [Google Scholar] [CrossRef]
  19. Ritter, C.; Vorotynov, A.; Pankrats, A.; Petrakovskii, G.; Temerov, V.; Gudim, I.; Szymczak, R. Magnetic Structure in Iron Borates RFe3(BO3)4 (R = Y,Ho): A Neutron Diffraction and Magnetization Study. J. Phys. Condens. Matter 2008, 20, 365209. [Google Scholar] [CrossRef]
  20. Kadomtseva, A.M.; Vorob’ev, G.P.; Popov, Y.F.; Pyatakov, A.P.; Mukhin, A.A.; Ivanov, V.Y.; Zvezdin, A.K.; Gudim, I.A.; Temerov, V.L.; Bezmaternykh, L.N. Magnetoelectric and Magnetoelastic Properties of Easy-Plane Ferroborates with a Small Ionic Radius. J. Exp. Theor. Phys. 2012, 114, 810–817. [Google Scholar] [CrossRef]
  21. Oreshonkov, A.S.; Shestakov, N.P.; Molokeev, M.S.; Aleksandrovsky, A.S.; Gudim, I.A.; Temerov, V.L.; Adichtchev, S.V.; Pugachev, A.M.; Nemtsev, I.V.; Pogoreltsev, E.I.; et al. Monoclinic SmAl3(BO3)4: Synthesis, Structural and Spectroscopic Properties. Acta Crystallogr. B Struct. Sci. Cryst. Eng. Mater. 2020, 76, 654–660. [Google Scholar] [CrossRef] [PubMed]
  22. Dobretsova, E.A.; Borovikova, E.Y.; Boldyrev, K.N.; Kurazhkovskaya, V.S.; Leonyuk, N.I. IR Spectroscopy of Rare-Earth Aluminum Borates RAl3(BO3)4 (R = Y, Pr-Yb). Opt. Spectrosc. 2014, 116, 77–83. [Google Scholar] [CrossRef]
  23. Plachinda, P.A.; Belokoneva, E.L. High Temperature Synthesis and Crystal Structure of New Representatives of the Huntite Family. Cryst. Res. Technol. 2008, 43, 157–165. [Google Scholar] [CrossRef]
  24. Dobretsova, E.A.; Boldyrev, K.N.; Popova, M.N.; Chernyshev, V.A.; Borovikova, E.Y.; Maltsev, V.V.; Leonyuk, N.I. Vibrational Spectroscopy of GdCr3(BO3)4: Quantitative Separation of Crystalline Phases. J. Phys. Conf. Ser. 2016, 737, 012035. [Google Scholar] [CrossRef]
  25. Leonyuk, N.I.; Maltsev, V.V.; Volkova, E.A.; Koporulina, E.V.; Kuleshov, N.V.; Kisel, V.E.; Gorbachenya, K.N. Ytterbium and Erbium Co-Doped Rare-Earth Aluminum Borate Crystals as New Materials for Eye-Safe Lasers: Flux Growth and Characterization. In Handbook of Ecomaterials; Springer International Publishing: Cham, Switzerland, 2019; pp. 2491–2536. [Google Scholar]
  26. Leonyuk, N.I.; Leonyuk, L.I. Growth and Characterization of RM3(BO3)4 Crystals. Prog. Cryst. Growth Charact. Mater. 1995, 31, 179–278. [Google Scholar] [CrossRef]
  27. Boldyrev, K.N.; Popova, M.N.; Bettinelli, M.; Temerov, V.L.; Gudim, I.A.; Bezmaternykh, L.N.; Loiseau, P.; Aka, G.; Leonyuk, N.I. Quality of the Rare Earth Aluminum Borate Crystals for Laser Applications, Probed by High-Resolution Spectroscopy of the Yb3+ Ion. Opt. Mater. 2012, 34, 1885–1889. [Google Scholar] [CrossRef]
  28. Gudim, I.A.; Eremin, E.V.; Temerov, V.L. Flux Growth and Spin Reorientation in Trigonal Nd1−xDyxFe3(BO3)4 Single Crystals. J. Cryst. Growth 2010, 312, 2427–2430. [Google Scholar] [CrossRef]
  29. Eremin, E.; Gudim, I.; Temerov, V.; Smolyakov, D.; Molokeev, M. Comparing the Magnetic and Magnetoelectric Properties of the SmFe3(BO3)4 Ferroborate Single Crystals Grown Using Different Solvents. J. Cryst. Growth 2019, 518, 1–4. [Google Scholar] [CrossRef] [Green Version]
  30. Bezmaternykh, L.N.; Temerov, V.L.; Gudim, I.A.; Stolbovaya, N.A. Crystallization of Trigonal (Tb,Er)(Fe,Ga)3(BO3)4 Phases with Hantite Structure in Bismuth Trimolybdate-Based Fluxes. Crystallogr. Rep. 2005, 50, S97–S99. [Google Scholar] [CrossRef]
  31. Bezmaternykh, L.N.; Kharlamova, S.A.; Temerov, V.L. Flux Crystallization of Trigonal GdFe3(BO3)4 Competing with the Crystallization of α-Fe2O3. Crystallogr. Rep. 2004, 49, 855–857. [Google Scholar] [CrossRef]
  32. Smirnova, E.S.; Alekseeva, O.A.; Dudka, A.P.; Sorokin, T.A.; Khmelenin, D.N.; Yapaskurt, V.O.; Lyubutina, M.V.; Frolov, K.V.; Lyubutin, I.S.; Gudim, I.A. Crystal Structure, Absolute Configuration and Characteristic Temperatures of SmFe3(BO3)4 in the Temperature Range 11–400 K. Acta Crystallogr. B Struct. Sci. Cryst. Eng. Mater. 2022, 78, 546–556. [Google Scholar] [CrossRef] [PubMed]
  33. Maltsev, V.V.; Volkova, E.A.; Mitina, D.D.; Leonyuk, N.I.; Kozlov, A.B.; Shestakov, A.V. Growth and Thermophysical Properties of RAl3(BO3)4 (R = Y, Nd, Gd, Lu) and RMgB5O10 (R = Y, La, Gd) Crystals. Inorg. Mater. 2020, 56, 612–625. [Google Scholar] [CrossRef]
  34. Leonyuk, N.I.; Maltsev, V.V.; Volkova, E.A.; Pilipenko, O.V.; Koporulina, E.V.; Kisel, V.E.; Tolstik, N.A.; Kurilchik, S.V.; Kuleshov, N.V. Crystal Growth and Laser Properties of New RAl3(BO3)4 (R = Yb,Er) Crystals. Opt. Mater. 2007, 30, 161–163. [Google Scholar] [CrossRef]
  35. Mukhin, A.A.; Vorob’ev, G.P.; Ivanov, V.Y.; Kadomtseva, A.M.; Narizhnaya, A.S.; Kuz’menko, A.M.; Popov, Y.F.; Bezmaternykh, L.N.; Gudim, I.A. Colossal Magnetodielectric Effect in SmFe3(BO3)4 Multiferroic. JETP Lett. 2011, 93, 275–281. [Google Scholar] [CrossRef]
  36. Trukhanov, A.V.; Kostishyn, V.G.; Panina, L.V.; Korovushkin, V.V.; Turchenko, V.A.; Thakur, P.; Thakur, A.; Yang, Y.; Vinnik, D.A.; Yakovenko, E.S.; et al. Control of Electromagnetic Properties in Substituted M-Type Hexagonal Ferrites. J. Alloys Compd. 2018, 754, 247–256. [Google Scholar] [CrossRef]
  37. Snegirev, N.I.; Bogach, A.V.; Lyubutin, I.S.; Chuev, M.A.; Yagupov, S.V.; Mogilenec, Y.A.; Selezneva, K.A.; Strugatsky, M.B. The Evolution of the Magnetic Properties of Iron Borate Single Crystals Doped with Gallium. Phys. Met. Metallogr. 2023, 124, 133–137. [Google Scholar] [CrossRef]
  38. Kumar, A.; Sharma, P.; Kumar, S.; Singh, A.; Kundu, R.S.; Punia, R. Effect of Diamagnetic Ion Substitution on Structural and Magnetic Properties of Nd3+ Modified Solid Solutions. Integr. Ferroelectr. 2019, 203, 176–182. [Google Scholar] [CrossRef]
  39. Jahan, N.; Khandaker, J.I.; Liba, S.I.; Hoque, S.M.; Khan, M.N.I. Structural Analysis through Cations Distributions of Diamagnetic Al3+ Ions Substituted Ni-Zn-Co Ferrites. J. Alloys Compd. 2021, 869, 159226. [Google Scholar] [CrossRef]
  40. Smirnova, E.S.; Alekseeva, O.A.; Dudka, A.P.; Verin, I.A.; Artemov, V.V.; Lyubutina, M.V.; Gudim, I.A.; Frolov, K.V.; Lyubutin, I.S. Crystal Structure of Bismuth-Containing NdFe3(BO3)4 in the Temperature Range 20–500 K. Acta Crystallogr. B Struct. Sci. Cryst. Eng. Mater. 2022, 78, 1–13. [Google Scholar] [CrossRef]
  41. CrysAlisPro Software System; Rigaku Corporation: Wroclaw, Poland. Available online: http://www.rigaku.com (accessed on 14 July 2023).
  42. Petříček, V.; Dušek, M.; Palatinus, L. Crystallographic Computing System JANA2006: General Features. Z. Krist. Cryst. Mater. 2014, 229, 345–352. [Google Scholar] [CrossRef]
  43. Shannon, R.D. Revised Effective Ionic Radii and Systematic Studies of Interatomie Distances in Halides and Chaleogenides; Wiley Online Library: Hoboken, NJ, USA, 1976; Volume 32. [Google Scholar]
  44. Atomistic Simulation Group in the Materials Department of Imperial College Database of Ionic Radii. Available online: http://abulafia.mt.ic.ac.uk/shannon/ptable.php (accessed on 21 June 2023).
  45. Watkin, D.J.; Cooper, R.I. Howard Flack and the Flack Parameter. Chemistry 2020, 2, 796–804. [Google Scholar] [CrossRef]
  46. Becker, P.J.; Coppens, P. Extinction within the Limit of Validity of the Darwin Transfer Equations. I. General Formalism for Primary and Secondary Extinction and Their Applications to Spherical Crystals. Acta Crystallogr. Sect. A 1974, 30, 129–147. [Google Scholar] [CrossRef]
  47. Becker, P.J.; Coppens, P. Extinction within the Limit of Validity of the Darwin Transfer Equations. II. Refinement of Extinction in Spherical Crystals of SrF 2 and LiF. Acta Crystallogr. Sect. A 1974, 30, 148–153. [Google Scholar] [CrossRef]
  48. Bubnova, R.S.; Firsova, V.A.; Filatov, S.K. Software for Determining the Thermal Expansion Tensor and the Graphic Representation of Its Characteristic Surface (Theta to Tensor-TTT). Glass Phys. Chem. 2013, 39, 347–350. [Google Scholar] [CrossRef]
  49. Dudka, A.P.; Bolotina, N.B.; Khrykina, O.N. DebyeFit: A Simple Tool to Obtain an Appropriate Model of Atomic Vibrations in Solids from Atomic Displacement Parameters Obtained at Different Temperatures. J. Appl. Crystallogr. 2019, 52, 690–692. [Google Scholar] [CrossRef]
  50. Momma, K.; Ikeda, T.; Belik, A.A.; Izumi, F. Dysnomia, a Computer Program for Maximum-Entropy Method (MEM) Analysis and Its Performance in the MEM-Based Pattern Fitting. Powder Diffr. 2013, 28, 184–193. [Google Scholar] [CrossRef] [Green Version]
  51. Stoiber, D.; Niewa, R.; Kristallogr, Z. Available online: https://www.iac.uni-stuttgart.de/en/research/akniewa/downloads/ (accessed on 14 July 2023).
  52. Campá, J.A.; Cascales, C.; Gutiérrez-Puebla, E.; Monge, M.A.; Rasines, I.; Ruíz-Valero, C. Crystal Structure, Magnetic Order, and Vibrational Behavior in Iron Rare-Earth Borates. Chem. Mater. 1997, 9, 237–240. [Google Scholar] [CrossRef]
  53. Massa, W.; Gould, R.O. Crystal Structure Determination; SpringerLink: Berlin/Heidelberg, Germany, 2004. [Google Scholar]
  54. Poray-Koshits, M.A. Fundamentals of Structural Analysis of Chemical Compounds; HSE Publishing House: Moscow, Russia, 1982. (In Russian) [Google Scholar]
  55. Belokoneva, E.L.; Al’shinskaya, L.I.; Simonov, M.A.; Leonyuk, N.I.; Timchenko, T.I.; Belov, N.V. Crystal Structure of NdGa3[BO3]4. J. Struct. Chem. 1978, 19, 332–334. [Google Scholar] [CrossRef]
  56. Eremin, E.V.; Pavlovskiy, M.S.; Gudim, I.A.; Temerov, V.; Molokeev, M.; Andryushin, N.D.; Bogdanov, E.V. Synthesis of NdSc3(BO3)4 Single Crystals and Study of Its Structure Properties. J. Alloys Compd. 2020, 828, 154355. [Google Scholar] [CrossRef]
  57. Chong, S.; Riley, B.J.; Nelson, Z.J.; Perry, S.N. Crystal Structures and Comparisons of Huntite Aluminum Borates RE Al3(BO3)4 (RE = Tb, Dy and Ho). Acta Crystallogr. E Crystallogr. Commun. 2020, 76, 339–343. [Google Scholar] [CrossRef] [Green Version]
  58. Bolotina, N.; Khrykina, O.; Azarevich, A.; Gavrilkin, S.; Sluchanko, N. Fine Details of Crystal Structure and Atomic Vibrations in YbB12 with a Metal–Insulator Transition. Acta Crystallogr. B Struct. Sci. Cryst. Eng. Mater. 2020, 76, 1117–1127. [Google Scholar] [CrossRef] [PubMed]
  59. Inosov, D.S. Rare-Earth Borides; Jenny Stanford Publishing: New York, NY, USA, 2021; ISBN 9781003146483. [Google Scholar]
Figure 1. Distribution of chemical elements in Sm0.93Bi0.07Fe2.72Al0.28(BO3)4 single crystals of different sizes: (a) 600 nm and (b) 90 nm.
Crystals 13 01128 g001
Figure 2. (a) Temperature dependence of unit-cell parameters a and c, and volume V of Sm0.93Bi0.07Fe2.72Al0.28(BO3)4 in the 25–500 K temperature range. Errors are smaller than dot size; (b) Temperature dependence of thermal expansion eigenvalues α33 in the c direction and α11 = α22 in the ab plane based on unit-cell measurements. Three different intervals (1), (2), (3) are shown; (c) General view of thermal expansion figure projections in the α11, α22, α33 directions. Example figures of three different temperature intervals are shown. All coefficients in (1) are negative, while those in (2) and (3) are positive.
Crystals 13 01128 g002
Figure 3. Transformation of the 3D characteristic surface of thermal expansion tensor depending on the temperature. Red and green colours correspond to negative and positive eigenvalues, respectively.
Crystals 13 01128 g003
Figure 4. Crystal structure of Sm0.93Bi0.07Fe2.72Al0.28(BO3)4. Bonding of (Sm,Bi)O6 distorted prisms, (Fe,Al)O6 distorted octahedra, two types of BO3 triangles, as well as helicoidal chains of (Fe,Al)O6 directed along the c-axis are shown. Unit cells are highlighted using black lines. Angles in (Fe,Al)–O1–(Fe,Al) are shown in turquoise-blue and angles in (Fe,Al)–O2–(Fe,Al) are shown in green. O1 oxygen atoms are vertices of equilateral triangle B1O3 and O2 are vertices of isosceles triangle B2O3.
Crystals 13 01128 g004
Figure 5. Electron density distribution in Sm0.95Bi0.05Fe3(BO3)4 (y = 0) and Sm0.93Bi0.07Fe2.72Al0.28(BO3)4 (y = 0.28) at 293 K built using the maximum entropy method (MEM). Sections parallel to the ab plane are built in a plane going through atoms 1—(Sm,Bi) and 2—(Fe,Al) and in a plane going through 3—BO3 triangles. Electron density distribution is shown using a colour gradient: red corresponds to maximum saturation (rate = 2 Å−3) and blue corresponds to minimum saturation (rate = 0).
Crystals 13 01128 g005
Figure 6. Interatomic distances in the structures of Sm1−xBixFe3−yAly(BO3)4 (x = 0.05–0.07, y = 0–0.28) depending on the aluminium content: (a) (Sm,Bi)–O3 in distorted trigonal (Sm,Bi)O6 prism; (b) (Fe,Al)–O in distorted (Fe,Al)O6 octahedra; (c) B1–O in B1O3 equilateral triangle; (d) B2–O in B2O3 isosceles triangle; (e) (Sm,Bi)–(Fe,Al) closest distances; (f) Distances between atoms in (Fe,Al)–(Fe,Al) chains (intra) and between the closest atoms in different (Fe,Al)–(Fe,Al) chains (inter). For clarity, Bi and Al atoms are not labelled.
Crystals 13 01128 g006
Figure 7. Interatomic distances in Sm0.93Bi0.07Fe2.72Al0.28(BO3)4 depending on the temperature: (a) (Sm,Bi)–O3 in distorted trigonal (Sm,Bi)O6 prism and (Sm,Bi)–O2 to the more distant oxygen atom; (b) (Sm,Bi)–(Fe,Al) closest distances; (c) B1–O in B1O3 equilateral triangle; (d) B2–O in B2O3 isosceles triangle; (e) (Fe,Al)–O in distorted (Fe,Al)O6 octahedra; (f) Distances between atoms in (Fe,Al)–(Fe,Al) chains (intra) and between the closest atoms in different (Fe,Al)–(Fe,Al) chains (inter); (g) Angles (Fe,Al)–O–(Fe,Al) in the chain. For clarity, Bi and Al atoms are not labelled on the figure.
Crystals 13 01128 g007
Figure 8. Shift in the vertices of (Fe,Al)O6 octahedra (O1, O2, O3) from the ideal positions in the regular octahedron modelled around (Fe,Al) atoms: (a) The shift in the structures of Sm1−xBixFe3−yAly(BO3)4 based on aluminium content (y = 0–0.28); (b) The shift in the structure of Sm0.93Bi0.07Fe2.72Al0.28(BO3)4 based on temperature; (c) Regular octahedron is shown in pink and (Fe,Al)O6 octahedron in the Sm0.93Bi0.07Fe2.72Al0.28(BO3)4 structure at 25 K is shown in blue.
Crystals 13 01128 g008
Figure 9. Temperature dependence of equivalent isotropic displacement parameters of atoms in the structure of Sm0.93Bi0.07Fe2.72Al0.28(BO3)4. Experimental XRD values are shown together with the model curves in Debye or Einstein extended approximation: (a) all Ueq dependencies are modelled using single curves; (b) Ueq of boron atoms B2(9e) are modelled using two curves; (c) Ueq of oxygen atoms O2 (9e) are modelled using two curves.
Crystals 13 01128 g009
Figure A1. View of the three-dimensional diffraction peak distribution in the [100], [010], and [001] directions of Sm0.93Bi0.07Fe2.72Al0.28(BO3)4 at 25 K: (a) monoclinic lattice and (b) trigonal lattice. None reflections were rejected to show in the figure. Reciprocal lattice lines in the directions of a*, b*, c* are shown by different colours.
Crystals 13 01128 g0a1aCrystals 13 01128 g0a1b
Table 1. Contents of flux components and the crystallization parameters.
ynprТsat, °СdTsat/dn, °C/Mass.%Тmet, °С
02020.6977~5≈12
0.0519.820.6955~5.5
0.120.120.6960~5
0.1520.220.6956~6
0.2232.10959~8
Table 2. Experimental details and structural refinement parameters of Sm1−xBixFe3−yAly(BO3)4 single crystals at 293 K.
Chemical FormulaSm0.95Bi0.05Fe3(BO3)4Sm0.93Bi0.07Fe2.93Al0.07(BO3)4Sm0.95Bi0.05Fe2.83Al0.17(BO3)4Sm0.95Bi0.05Fe2.75Al0.25(BO3)4Sm0.93Bi0.07Fe2.72Al0.28(BO3)4
CSD2,271,1362,271,1352,271,1242,271,1342,271,125
Crystal shape and colourCrystals 13 01128 i001Crystals 13 01128 i002Crystals 13 01128 i003Crystals 13 01128 i004Crystals 13 01128 i005
Crystal data
Mr556.1555.2551.2548.8549.2
a, c (Å)9.5650 (1),
7.5869 (1)
9.5595 (1),
7.5816 (1)
9.5534 (1),
7.5767 (1)
9.5435 (1),
7.5628 (1)
9.5329 (1),
7.5553 (1)
V3)601.13 (1)600.02 (1)598.86 (1)596.53 (1)594.61 (1)
Dx (Mg m−3)4.6084.6104.5854.5834.601
µ (mm−1)13.3513.5613.1313.0513.34
Crystal radius (mm)0.140.12 0.17 0.15 0.15
No. of measured/ independent/
observed [I > 3σ(I)] reflections
20,702/2773/2773 20,709/ 2697/2696 20,631/2744/2744 20,549/2670/2670 20,486/2744/2743
Rint0.0270.0270.0340.0290.028
(sin θ/λ)max−1)1.3551.3551.3561.3561.355
Refinement
R[F2 > 2σ(F2)], wR(F2), S0.011, 0.015, 1.010.012, 0.015, 1.010.012, 0.017, 1.020.012, 0.016, 1.000.011, 0.016, 1.03
Δρmax, Δρmin
(e Å−3)
0.84, −0.880.79, −0.901.49, −0.541.15, −0.510.70, −0.86
Absolute structure parameter0.480 (4)0.900 (4)0.779 (5)0.993 (4)0.475 (4)
For all structures: trigonal, R32, Z = 3. Crystal shape: sphere (light green). Experiments were carried out at 293 K with Mo Kα radiation using an Xcalibur, EosS2 with high theta cut. Data collection used ω scans. Absorption correction was performed for a Spherical shape in Jana2006. Refinement (36 parameters) was carried out on F.
Table 3. Experimental details and structural refinement parameters of Sm0.93Bi0.07Fe2.72Al0.28(BO3)4 single crystal at selected temperatures in the 25–293 K range.
Crystal Data
Temperature (K)254080110293
CSD2,271,1332,271,1372,271,1282,271,1392,271,129
a, c (Å)9.5430 (1),
7.5634 (1)
9.5438 (1),
7.5616 (1)
9.5444 (1),
7.5601 (1)
9.5450 (1),
7.5598 (1)
9.5452 (1),
7.5680 (1)
V3)596.51 (1)596.47 (1)596.42 (1)596.48 (1)597.15 (1)
Dx (Mg m−3)4.5864.5864.5874.5864.581
µ (mm−1)13.2913.2913.3013.2913.28
No. of measured/ independent/
observed [I > 3σ(I)] reflections
74,155/ 2822/ 2820 74,207/ 2824/ 2823 74,222/ 2823/ 2820 74,140/ 2824/ 2818 73,951/ 2825/ 2750
Rint0.0850.0720.0760.0770.098
(sin θ/λ)max−1)1.3621.3631.3631.3631.362
Refinement
R[F2 > 2σ(F2)], wR(F2), S0.016, 0.038, 1.010.015, 0.033, 1.020.015, 0.034, 1.020.016, 0.038, 1.000.022, 0.046, 1.00
Δρmax, Δρmin (e Å−3)1.86, −1.630.96, −1.101.06, −1.530.94, −1.341.13, −0.76
Absolute structure parameter0.041 (5)0.032 (5)0.030 (5)0.035 (5)0.044 (7)
For all structures: Mr = 549.2, trigonal, R32, Z = 3. Crystal shape: irregular (light green). Crystal size: 0.14 × 0.09 × 0.06 mm. Experiments were carried out using Mo Kα radiation with an XtaLAB Synergy-DW system, HyPix-Arc 150. Data collection used ω scans. Gaussian, CrysAlis PRO 1.171.42.63a (Rigaku Oxford Diffraction, 2022). Absorption was corrected using numerical methods: absorption correction was based on Gaussian integration over a multifaceted crystal model and empirical absorption correction used spherical harmonics implemented in SCALE3 ABSPACK scaling algorithm. Refinement (36 parameters) was carried out on F2.
Table 4. Eigenvalues of thermal expansion tensor of Sm0.93Bi0.07Fe2.72Al0.28(BO3)4 at selected temperatures (multiplied by 106, K).
Coefficient α2550100120140293400500
α11(=α22, αa, αb)−0.9 (2)−0.7 (2)−0.20 (12)0.0 (1)0.2 (1)1.55 (6)2.53 (12)3.4 (2)
α33(=αс)−8.2 (5)−5.2 (4)0.0 (2)1.82 (13)3.48 (11)11.23 (14)11.5 (2)7.8 (6)
μa1 = ∠α11,a (°)3030303030303030
αV−10 (1)−7 (1)−0.4 (3)1.82 (13)3.8 (2)14.3 (2)16.5 (3)15 (1)
Table 5. Characteristic temperatures and static atomic displacements in Sm0.93Bi0.07Fe2.72Al0.28(BO3)4. Debye TD and Einstein TE characteristic temperatures, their difference, ΔTDE, values of zero-point oscillations, <u2>zero and <u2>shift (<u2>static = <u2>zero + <u2>shift) for atoms in the Sm0.93Bi0.07Fe2.72Al0.28(BO3)4 structure, and R-factors of model refinement. The top-line <u2>zero and <u2> shift is the Einstein approximation and the bottom-line is the Debye approximation.
TE, KTD, KΔTDE<u2>zero Å2<u2>shift Å2R, %
(Sm,Bi)118 (1)205 (1)870.0013330.00143 (2)0.95
0.0011480.00148 (2)0.73
(Fe,Al)245 (2)436 (2)1910.0018650.00075 (3)1.32
0.0015720.00094 (2)0.75
O1385 (7)708 (9)3230.0032140.00052 (11)2.63
0.0033310.00111 (7)1.46
O2300 (6)540 (6)2400.0050470.0015 (2)2.97
0.0042080.00210 (10)1.62
O3342 (5)622 (5)2800.0044290.00032 (12)2.69
0.0036560.00092 (6)1.2
B1518 (21)983 (34)4650.004336−0.0002 (2)4.03
0.0034230.0006 (2)3.09
B2461 (13)861 (16)4000.004869−0.0006 (2)3.94
0.0039080.0003 (1)2.27
Disclaimer/Publisher’s Note: The statements, opinions and data contained in all publications are solely those of the individual author(s) and contributor(s) and not of MDPI and/or the editor(s). MDPI and/or the editor(s) disclaim responsibility for any injury to people or property resulting from any ideas, methods, instructions or products referred to in the content.

